
 Facebook
 X
X
 Pinterest
 Copy Link

The following analysis of select counties of the Northwest Oregon and Southwest Washington real estate market is provided by Windermere Real Estate Chief Economist Matthew Gardner. We hope that this information may assist you with making better-informed real estate decisions. For further information about the housing market in your area, please don’t hesitate to contact your Windermere Real Estate agent.
Regional Economic Overview
Employment in the Oregon counties covered by this report continues to expand, though the pace of growth is slowing. As it stands, employment levels are still down 20,220 jobs from the 2020 pre-COVID peak. Over the last 12 months, employers added 15,990 new jobs, representing an annual growth rate of 1.1%. Unemployment in the region continues to improve. The 3.5% jobless rate we saw in the second quarter was marginally lower than the 3.6% rate during the second quarter of 2022. In the Southwest Washington market areas, the pace of job gains is also slowing, but the area added 6,719 jobs over the past year for an annual growth rate of 2.9%. Unemployment was 3.6%, which is an improvement from the first quarter, as the area saw its labor force fall modestly.
Northwest Oregon and Southwest Washington Home Sales
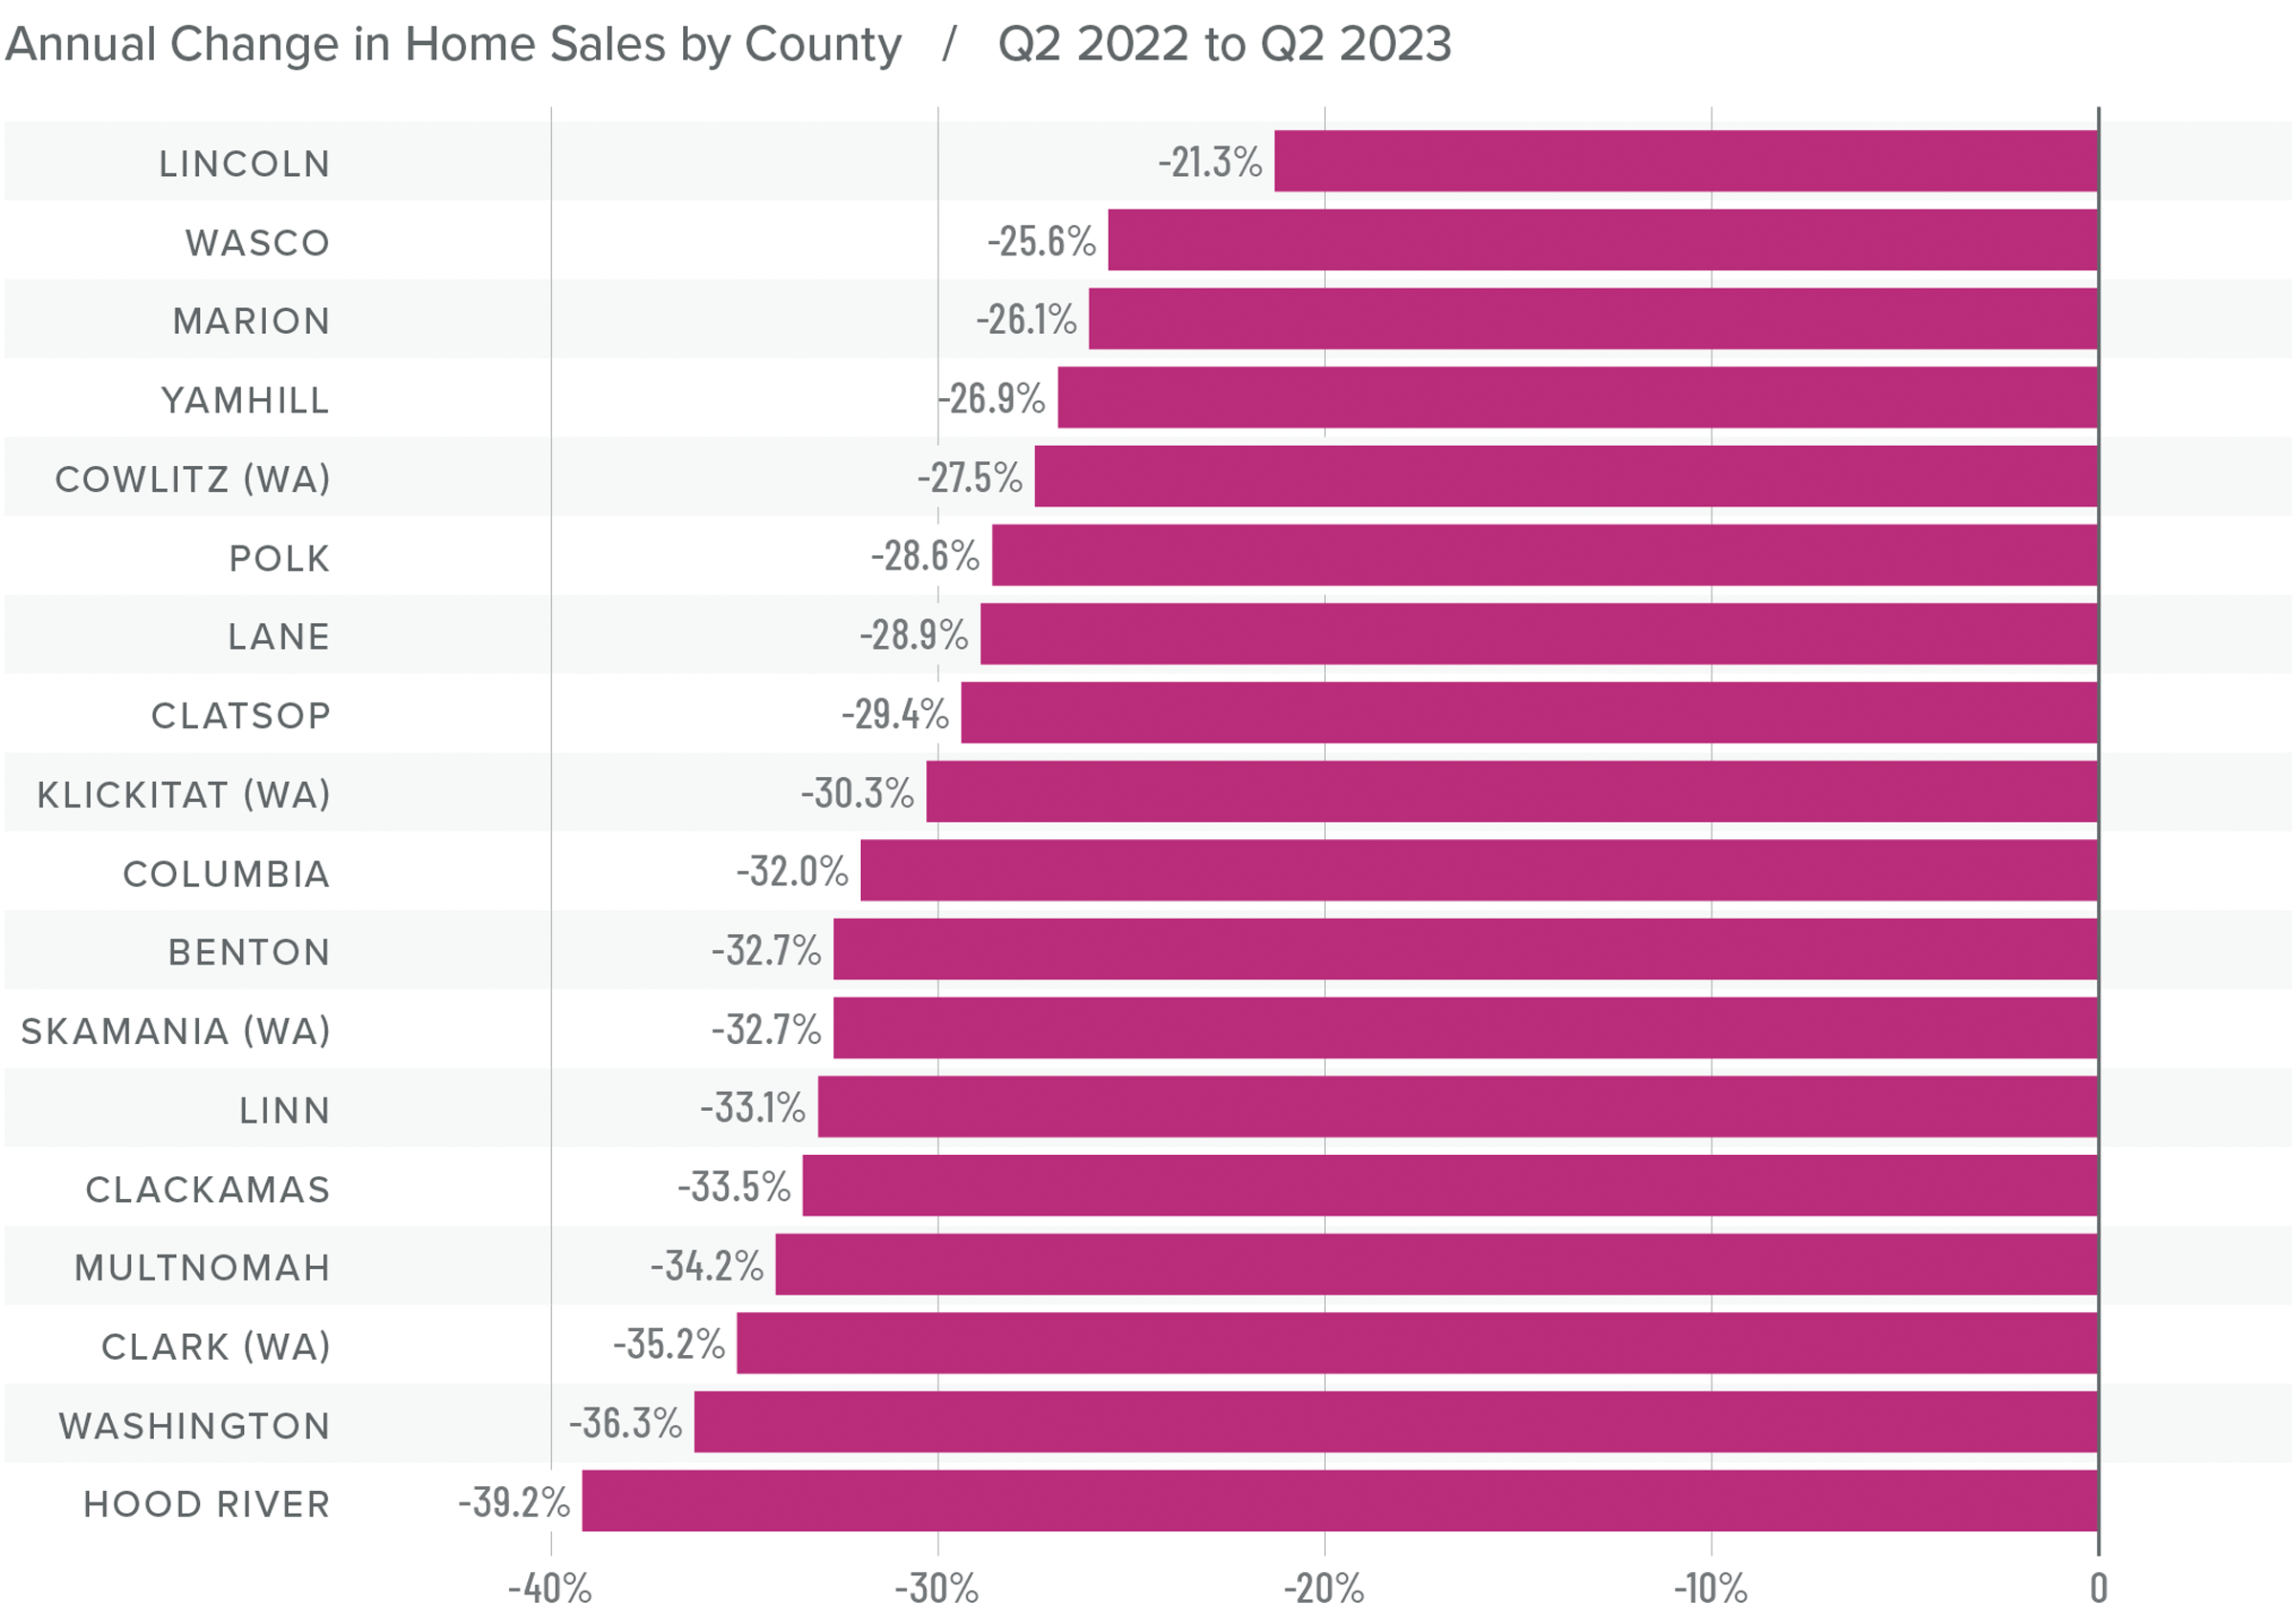
❱ In the second quarter of 2023, 10,286 homes sold. Although this was down 32.6% from the same period in 2022, sales were 37.3% higher than in the first quarter of the year.
❱ Higher sales can be attributed to an increase in the number of homes for sale. What was of particular interest was that sales managed to grow significantly even in the face of higher mortgage rates.
❱ Sales fell in every county compared to the same period in 2022, but all markets had more sales compared to the first quarter of 2023.
❱ It appears as if demand still exceeds supply, even with growing inventory levels in most markets.
Northwest Oregon and Southwest Washington Home Prices
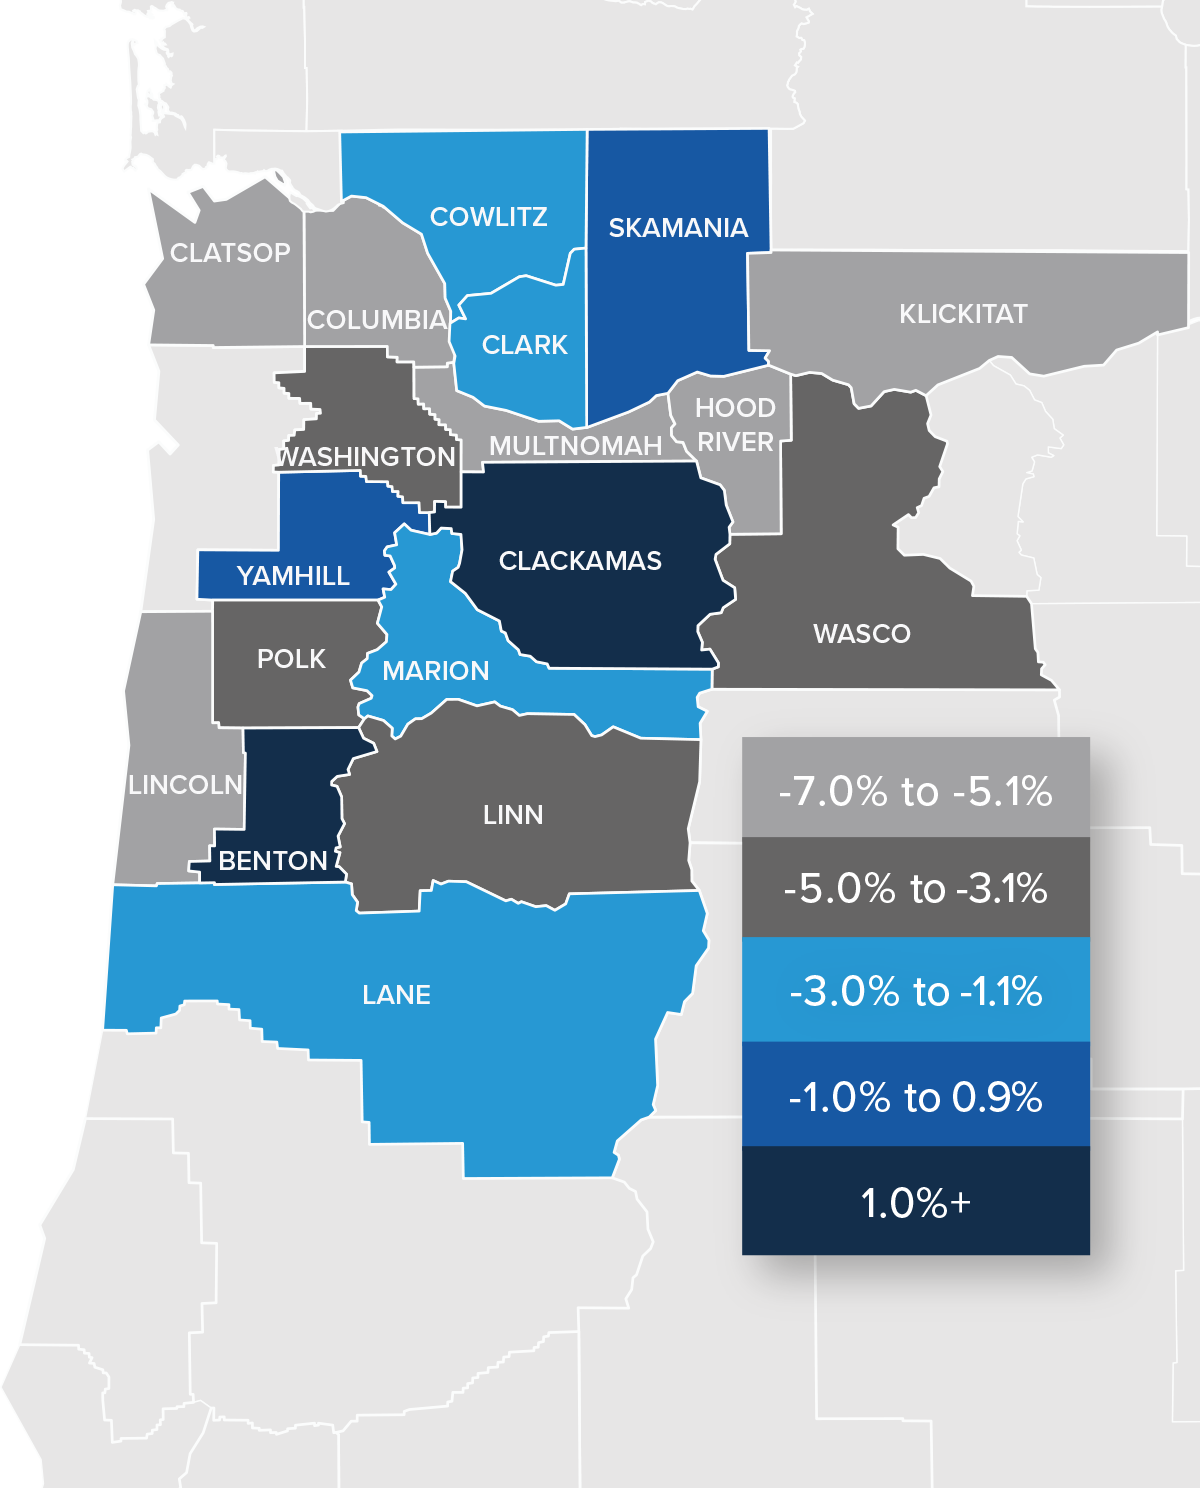
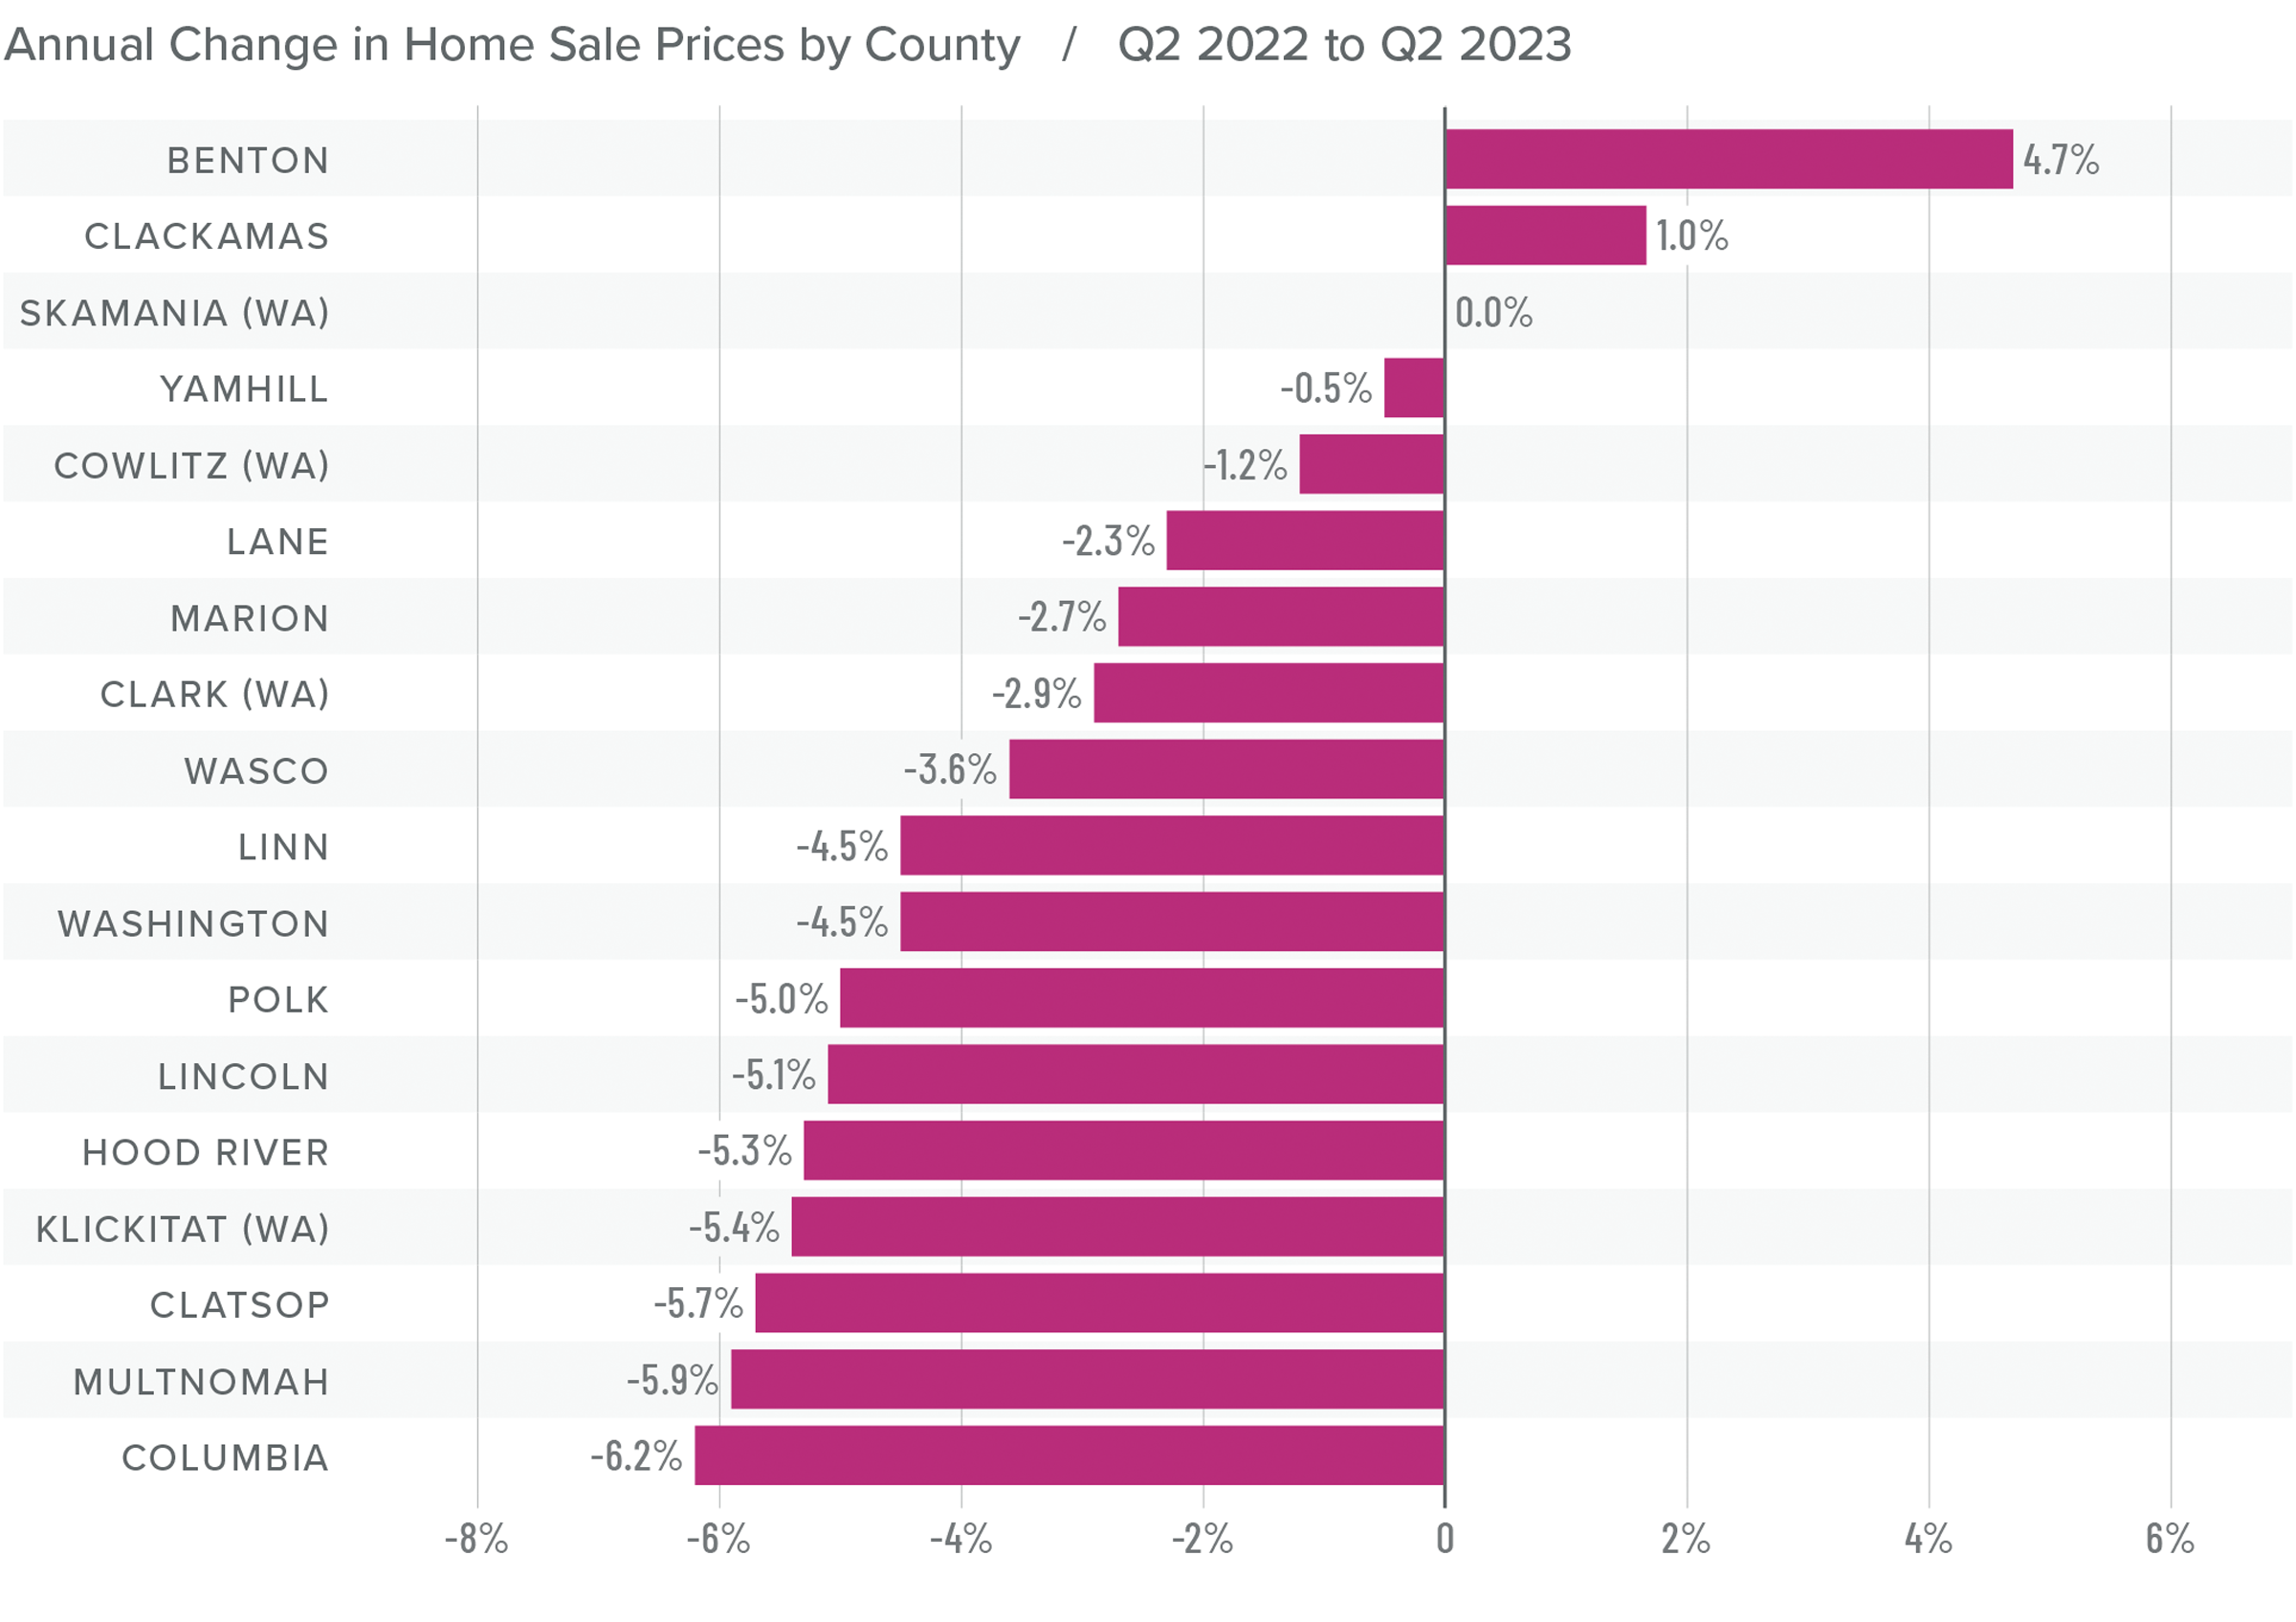
❱ The average sale price in the region fell 3.7% year over year, but there was a profound spring bump. Prices in the second quarter were 8.4% higher than in the first quarter of this year.
❱ On average, median list prices rose 7% compared to the first quarter of this year, suggesting that home sellers are feeling confident about the market.
❱ All but three counties saw average sale prices fall compared to the second quarter of 2022. Every county other than Clatsop, Linn, Marion, and Skamania saw prices rise compared to the first quarter of this year.
❱ I expect home prices to rise as we move through the second half of the year, but mortgage rates will dictate the pace of growth.
Mortgage Rates
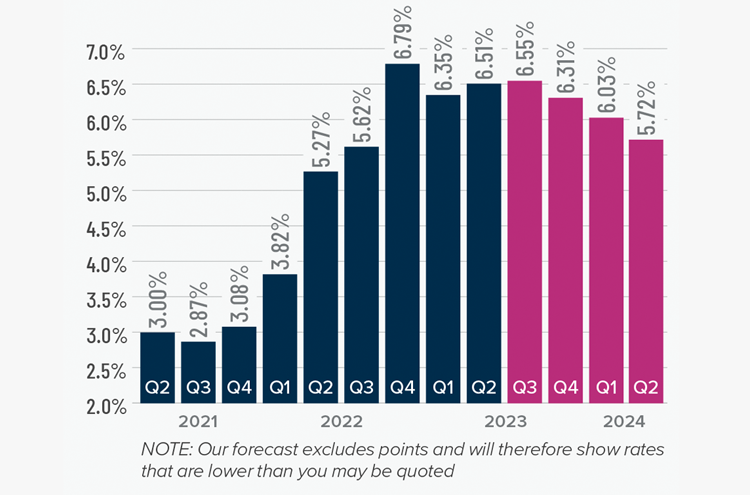
Although they were less erratic than the first quarter, mortgage rates unfortunately trended higher and ended the quarter above 7%. This was due to the short debt ceiling impasse, as well as several economic datasets that suggested the U.S. economy was not slowing at the speed required by the Federal Reserve.
While the June employment report showed fewer jobs created than earlier in the year, as well as downward revisions to prior gains, inflation has not sufficiently slowed. Until it does, rates cannot start to trend consistently lower. With the economy not slowing as fast as expected, I have adjusted my forecast: Rates will hold at current levels in third quarter and then start to trend lower through the fall. Although there are sure to be occasional spikes, my model now shows the 30-year fixed rate breaking below 6% next spring.
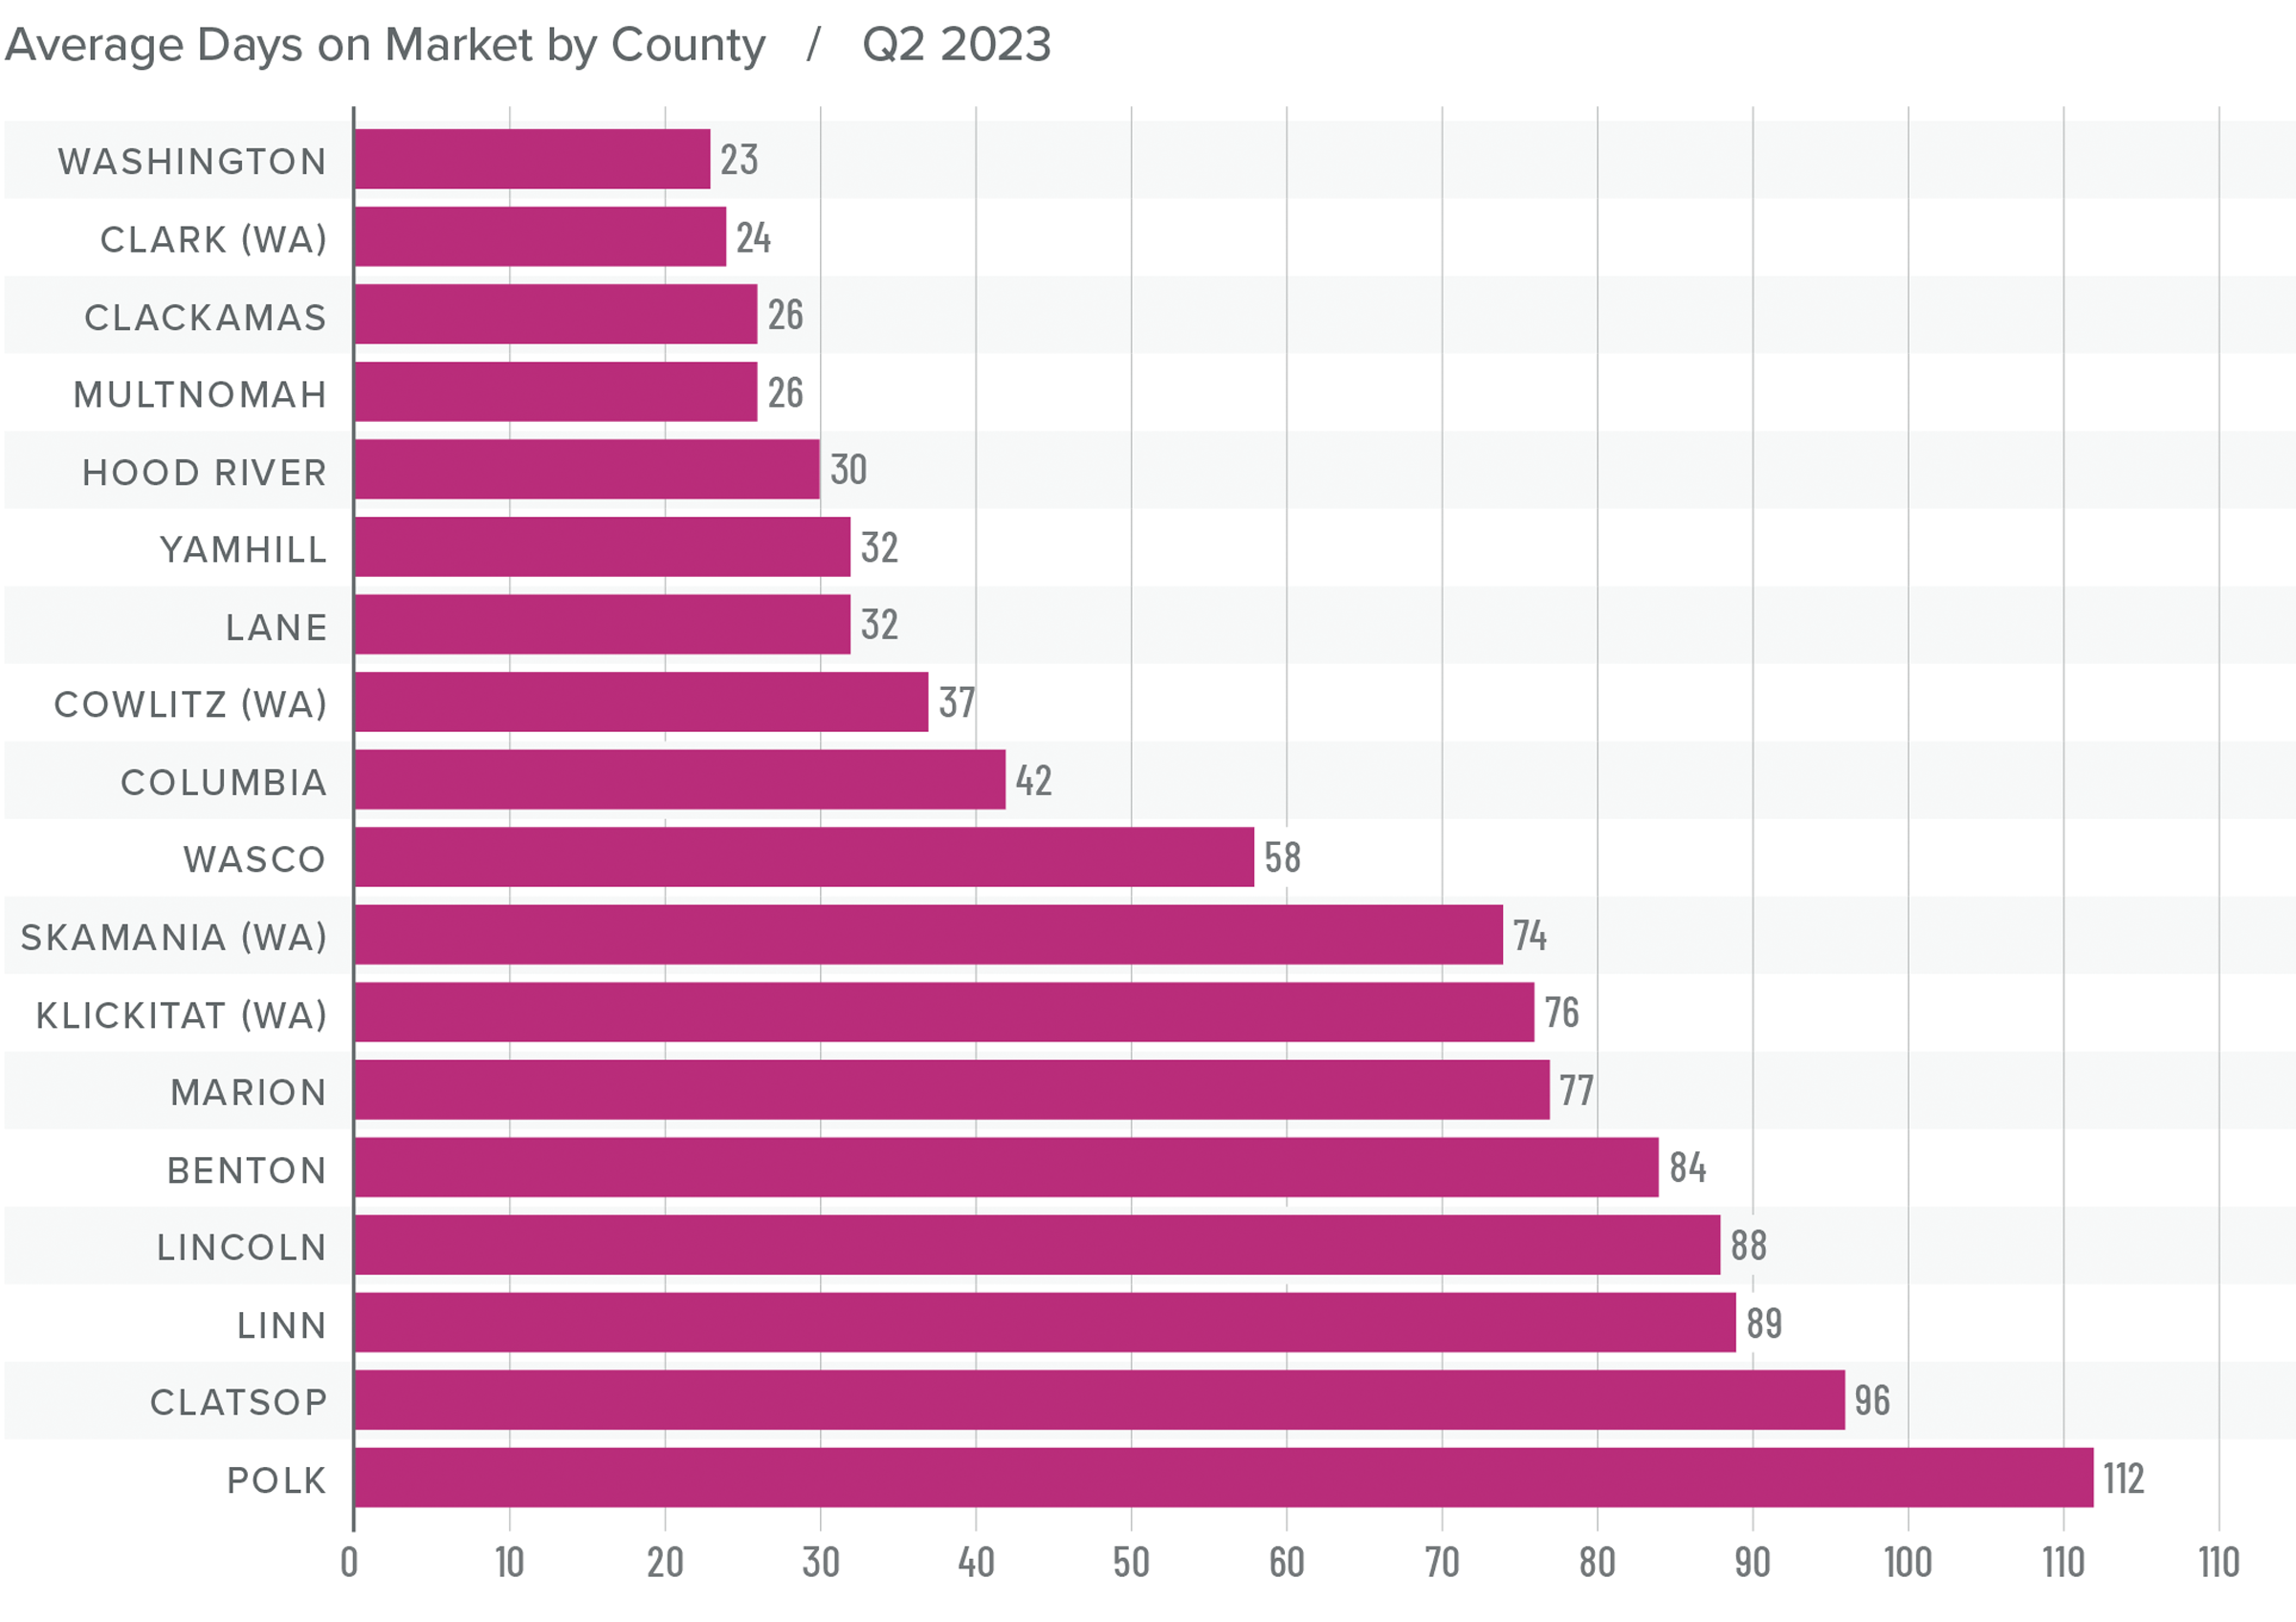
Northwest Oregon and Southwest Washington Days on Market
❱ The average time it took to sell a home in the region rose 20 days compared to the same period in 2022. It took 14 fewer days for a home to sell compared to the first quarter of 2023.
❱ The average time it took to sell a home in the second quarter of 2023 was 57 days.
❱ All counties in this report except Benton saw days on market rise compared to the same period in 2022. Compared to the first quarter of 2023, market time fell in all counties except Clatsop, Polk, and Skamania.
❱ The market appears to be shrugging off higher financing costs and is taking advantage of the modest growth in inventory.
Conclusions
This speedometer reflects the state of the region’s real estate market using housing inventory, price gains, home sales, interest rates, and larger economic factors.
Rising list prices, home prices, and sales all point to a market that favors home sellers. Although one quarter of growth could be an anomaly, I do not believe this to be the case here.
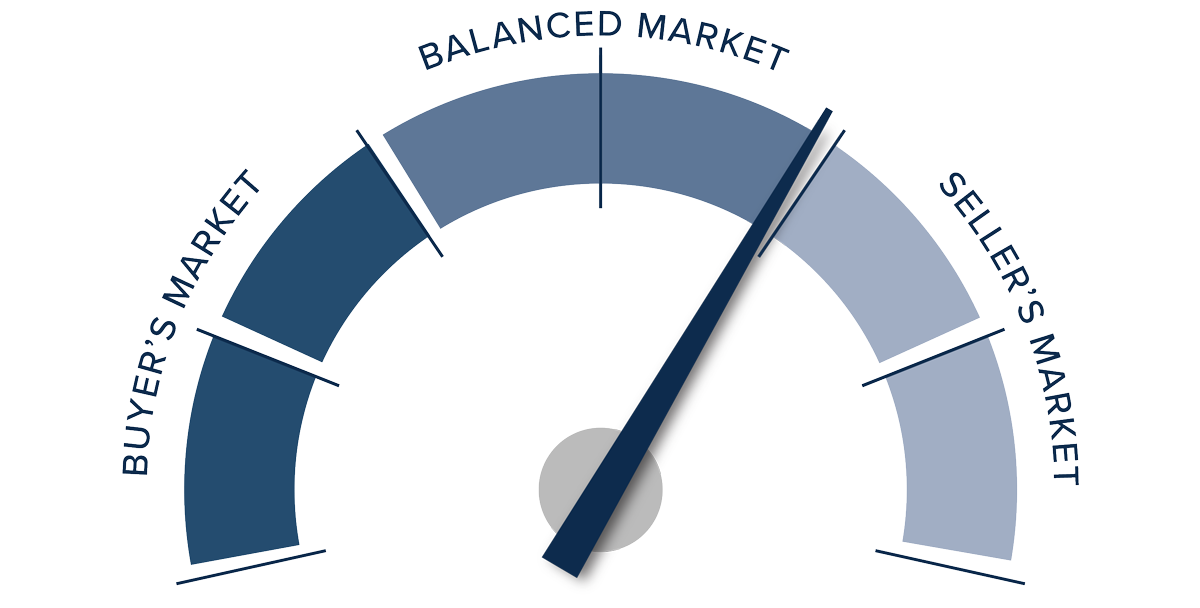
In the first quarter Gardner Report, I gave the advantage to home buyers, but I also stated that I could easily see the market returning to one that favors sellers as we approached the summer months. This appears to be the case. As such, I have moved the needle to favor home sellers again.
About Matthew Gardner

As Chief Economist for Windermere Real Estate, Matthew Gardner is responsible for analyzing and interpreting economic data and its impact on the real estate market on both a local and national level. Matthew has over 30 years of professional experience both in the U.S. and U.K.
In addition to his day-to-day responsibilities, Matthew sits on the Washington State Governors Council of Economic Advisors; chairs the Board of Trustees at the Washington Center for Real Estate Research at the University of Washington; and is an Advisory Board Member at the Runstad Center for Real Estate Studies at the University of Washington where he also lectures in real estate economics.
")


