
 Facebook
 X
X
 Pinterest
 Copy Link

The following analysis of select counties of the Northwest Oregon and Southwest Washington real estate market is provided by Windermere Real Estate. We hope that this information may assist you with making better-informed real estate decisions. For further information about the housing market in your area, please don’t hesitate to contact your Windermere Real Estate agent.
Regional Economic Overview
Employment growth in the Oregon counties covered by this report continues to slow. With 13,370 jobs added over the last 12 months, the growth rate was only .9%. Non-agricultural employment in Northwest Oregon is still down 11,690 jobs compared to its pre-COVID 2020 peak. That said, the jobless rate pulled back to 3.3% from 4.1% in the third quarter of 2022.
In the Southwest Washington market areas, the pace of job gains picked up a little. The areas covered by this report added 7,997 jobs over the past year, which represented an annual growth rate of 3.4%. Unemployment was 4.2%, which is up from the 5.2% level we saw in August 2022.
Northwest Oregon and Southwest Washington Home Sales
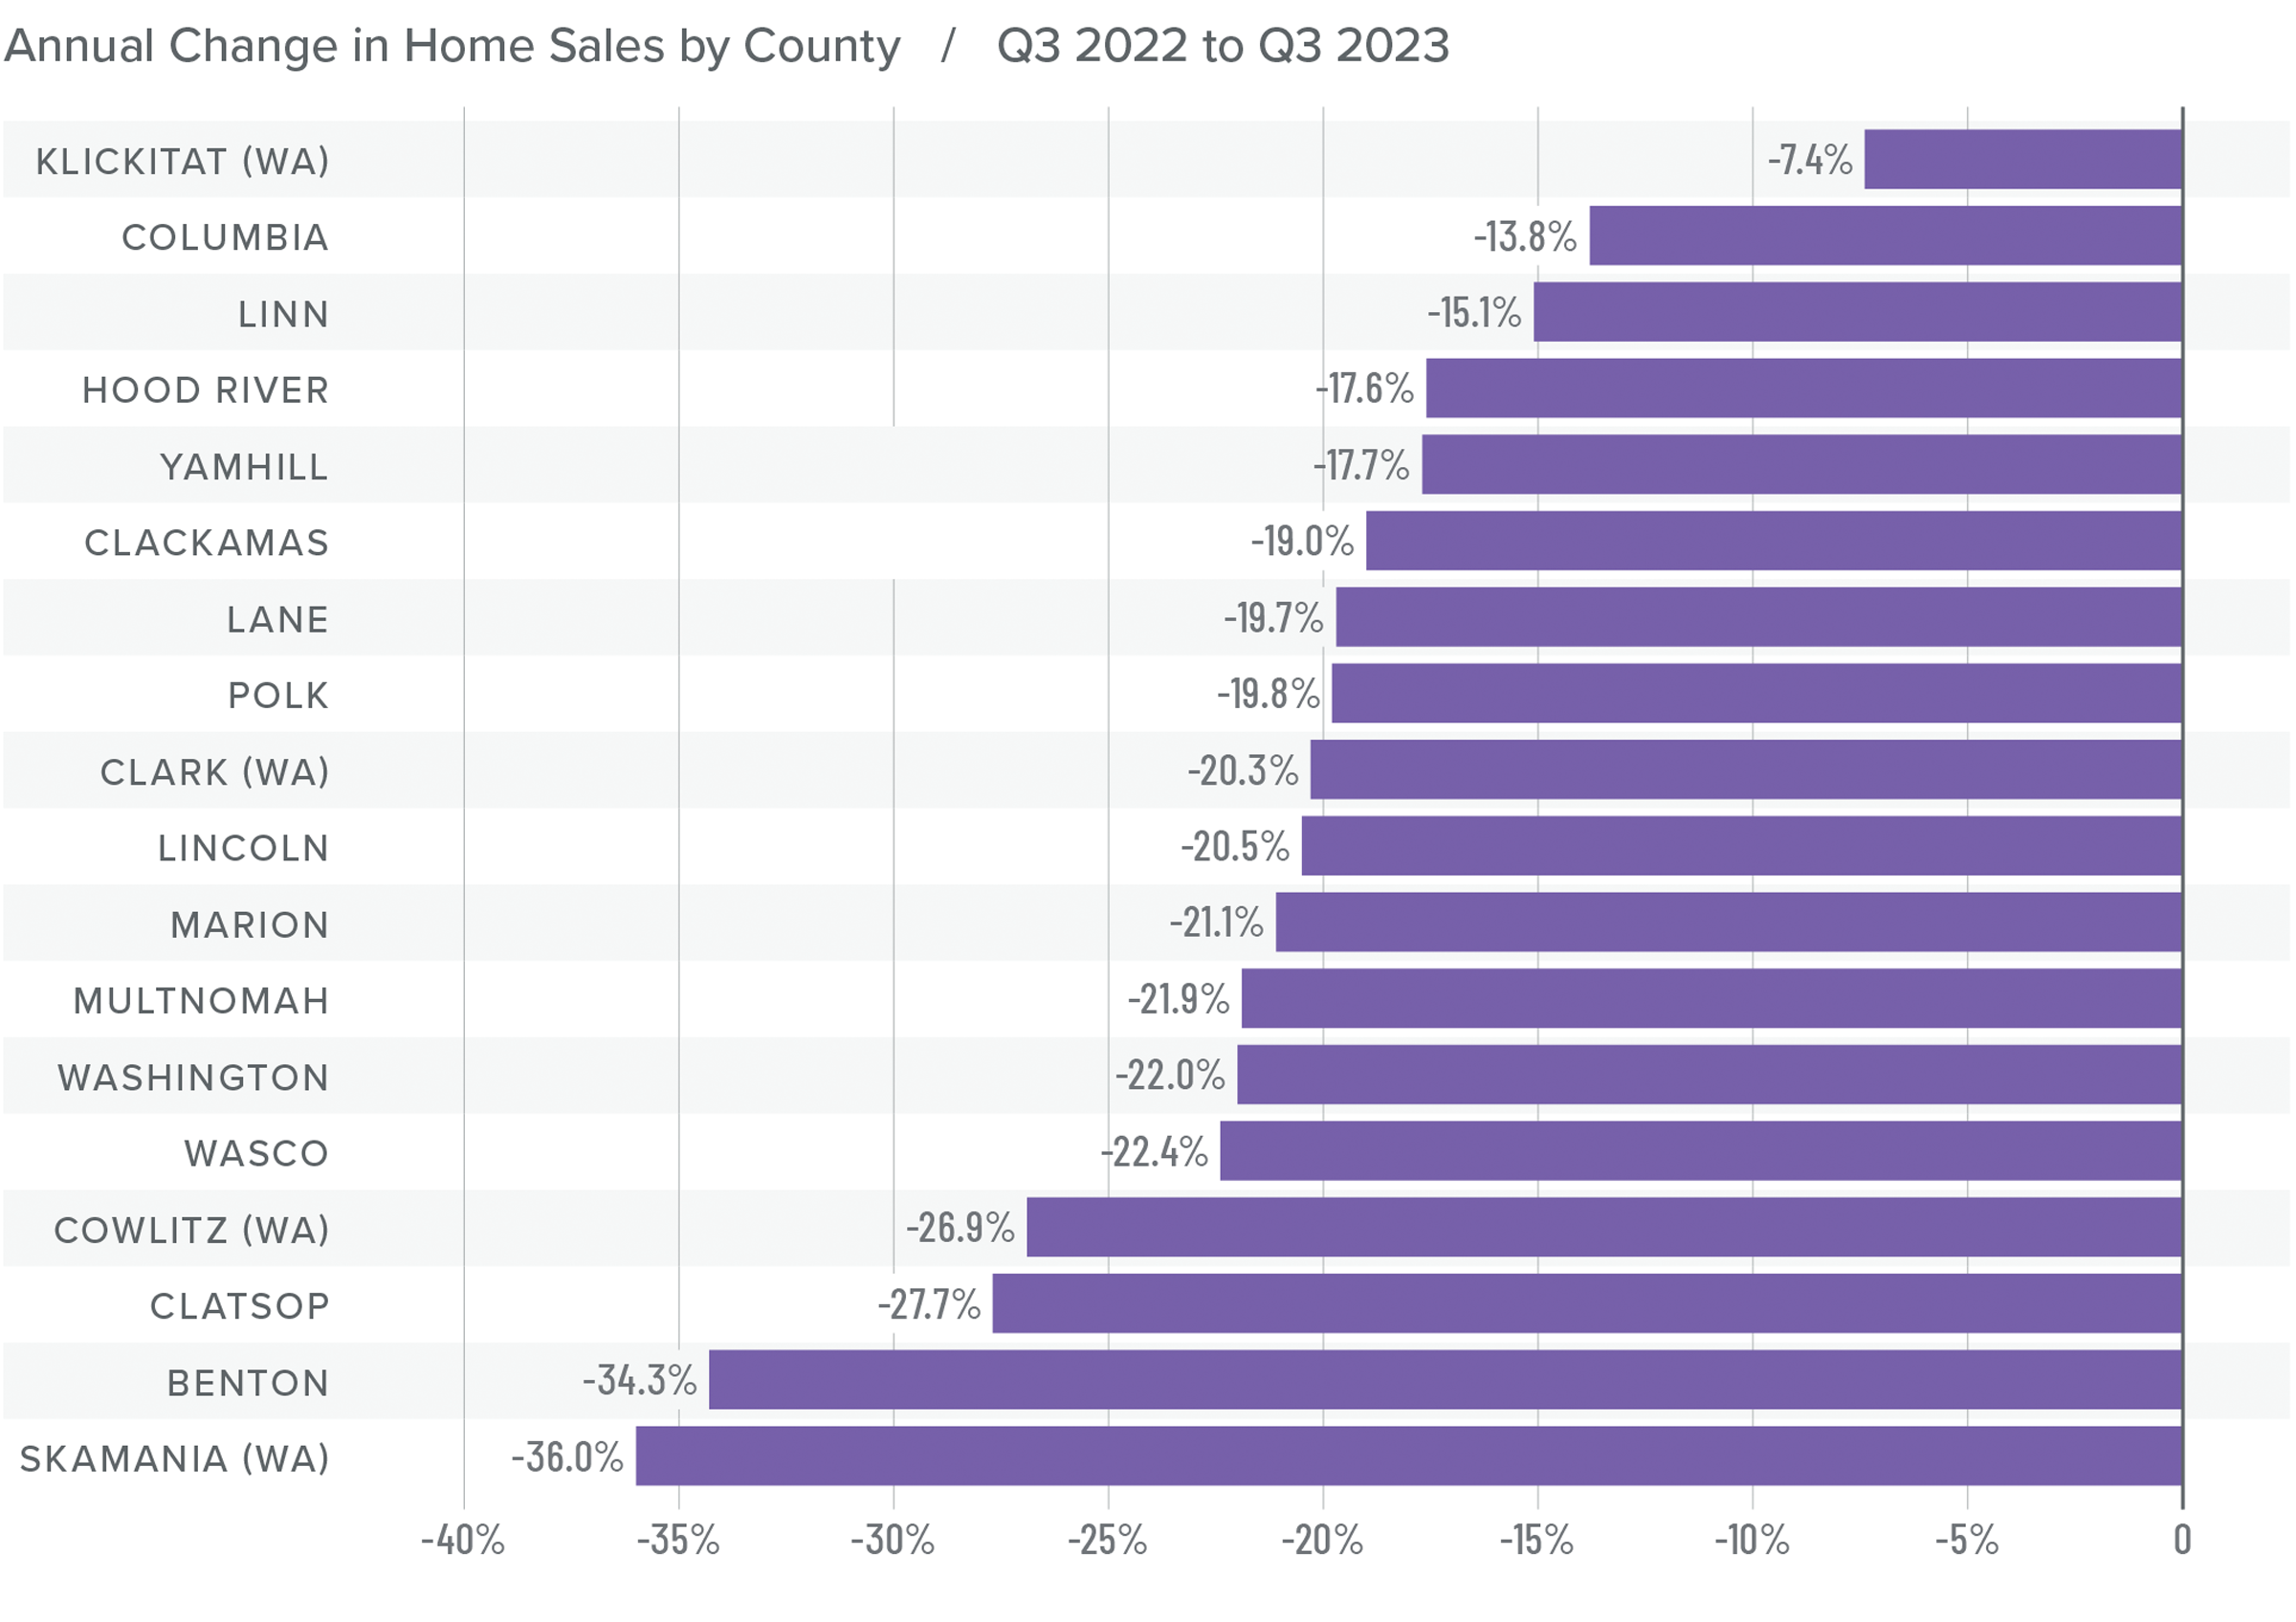
❱ In the third quarter of 2023, 10,279 homes sold. This was down 21% from the same period in 2022 and was 1.3% lower than in the second quarter of this year.
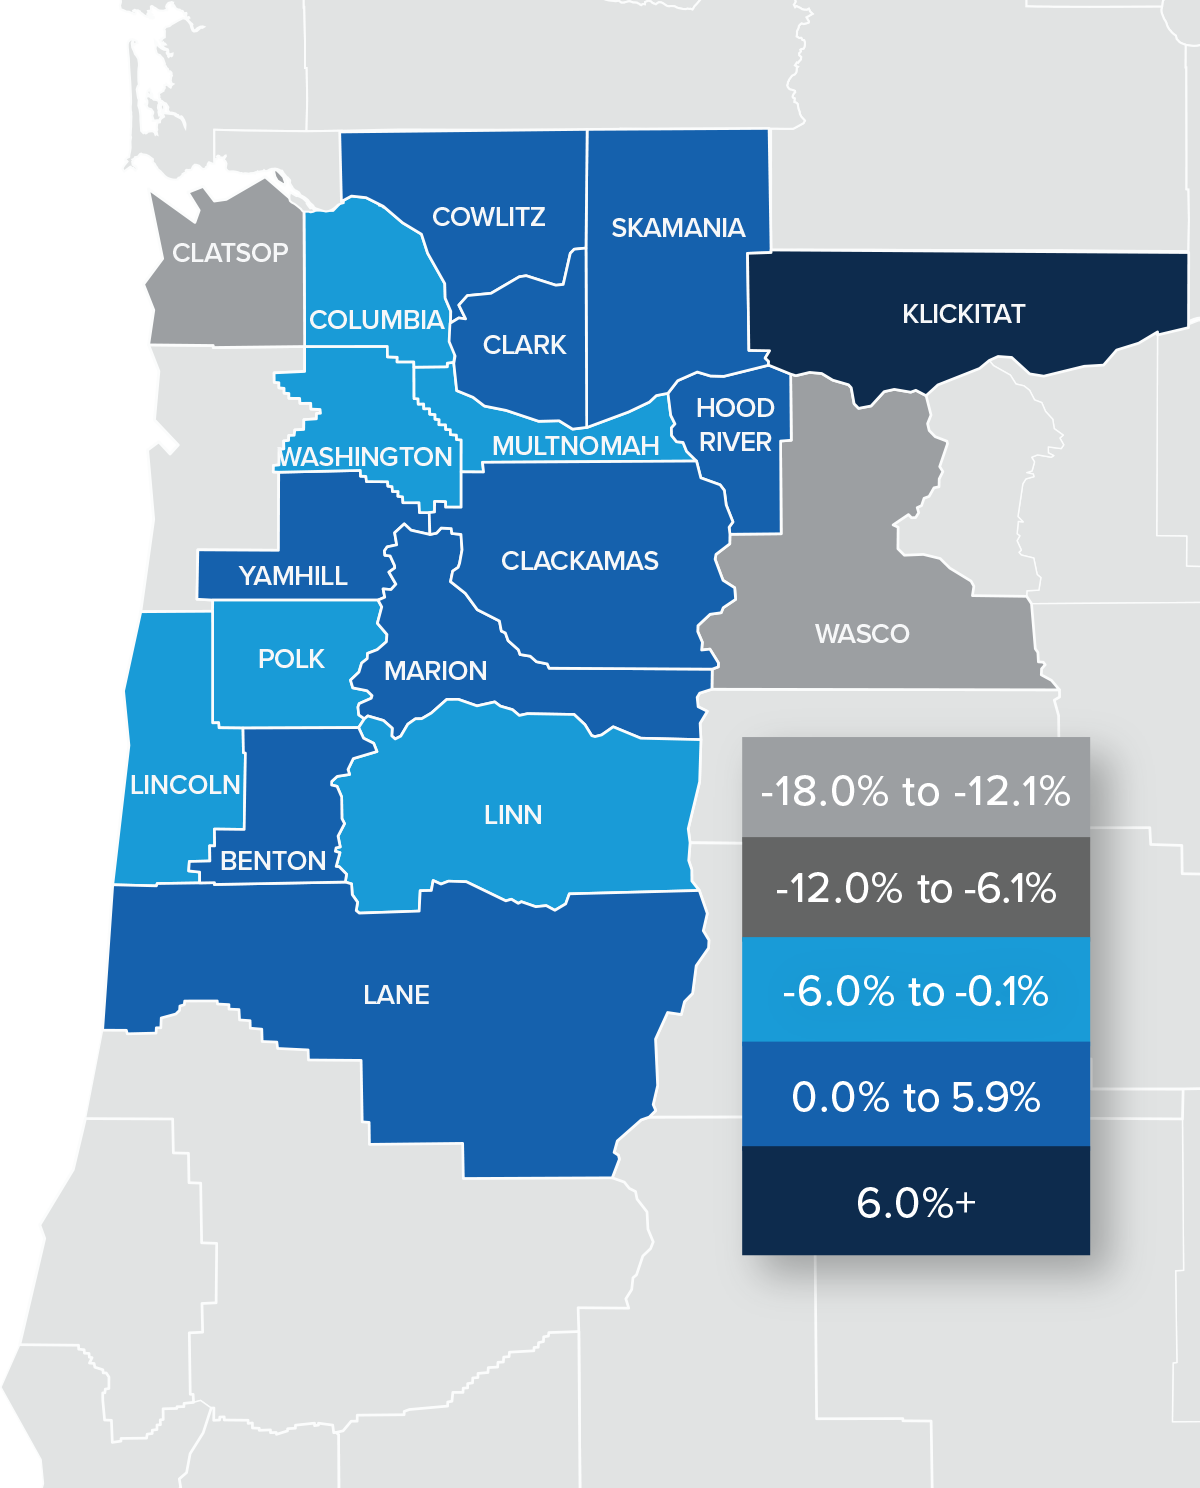
❱ Compared to the second quarter of this year, sales fell in eight counties but rose in ten. Klickitat and Hood River counties had significant growth; however, sales fell more than 10% in Lincoln, Skamania, and Wasco counties.
❱ Sales fell in every county compared to the third quarter of 2022, with significant declines in every county other than Klickitat.
❱ It appears as if higher mortgage rates are now starting to impact the market. Additionally, inventory levels did not rise in any of the counties in this report, which could also be a factor in slowing sales activity.
Northwest Oregon and Southwest Washington Home Prices
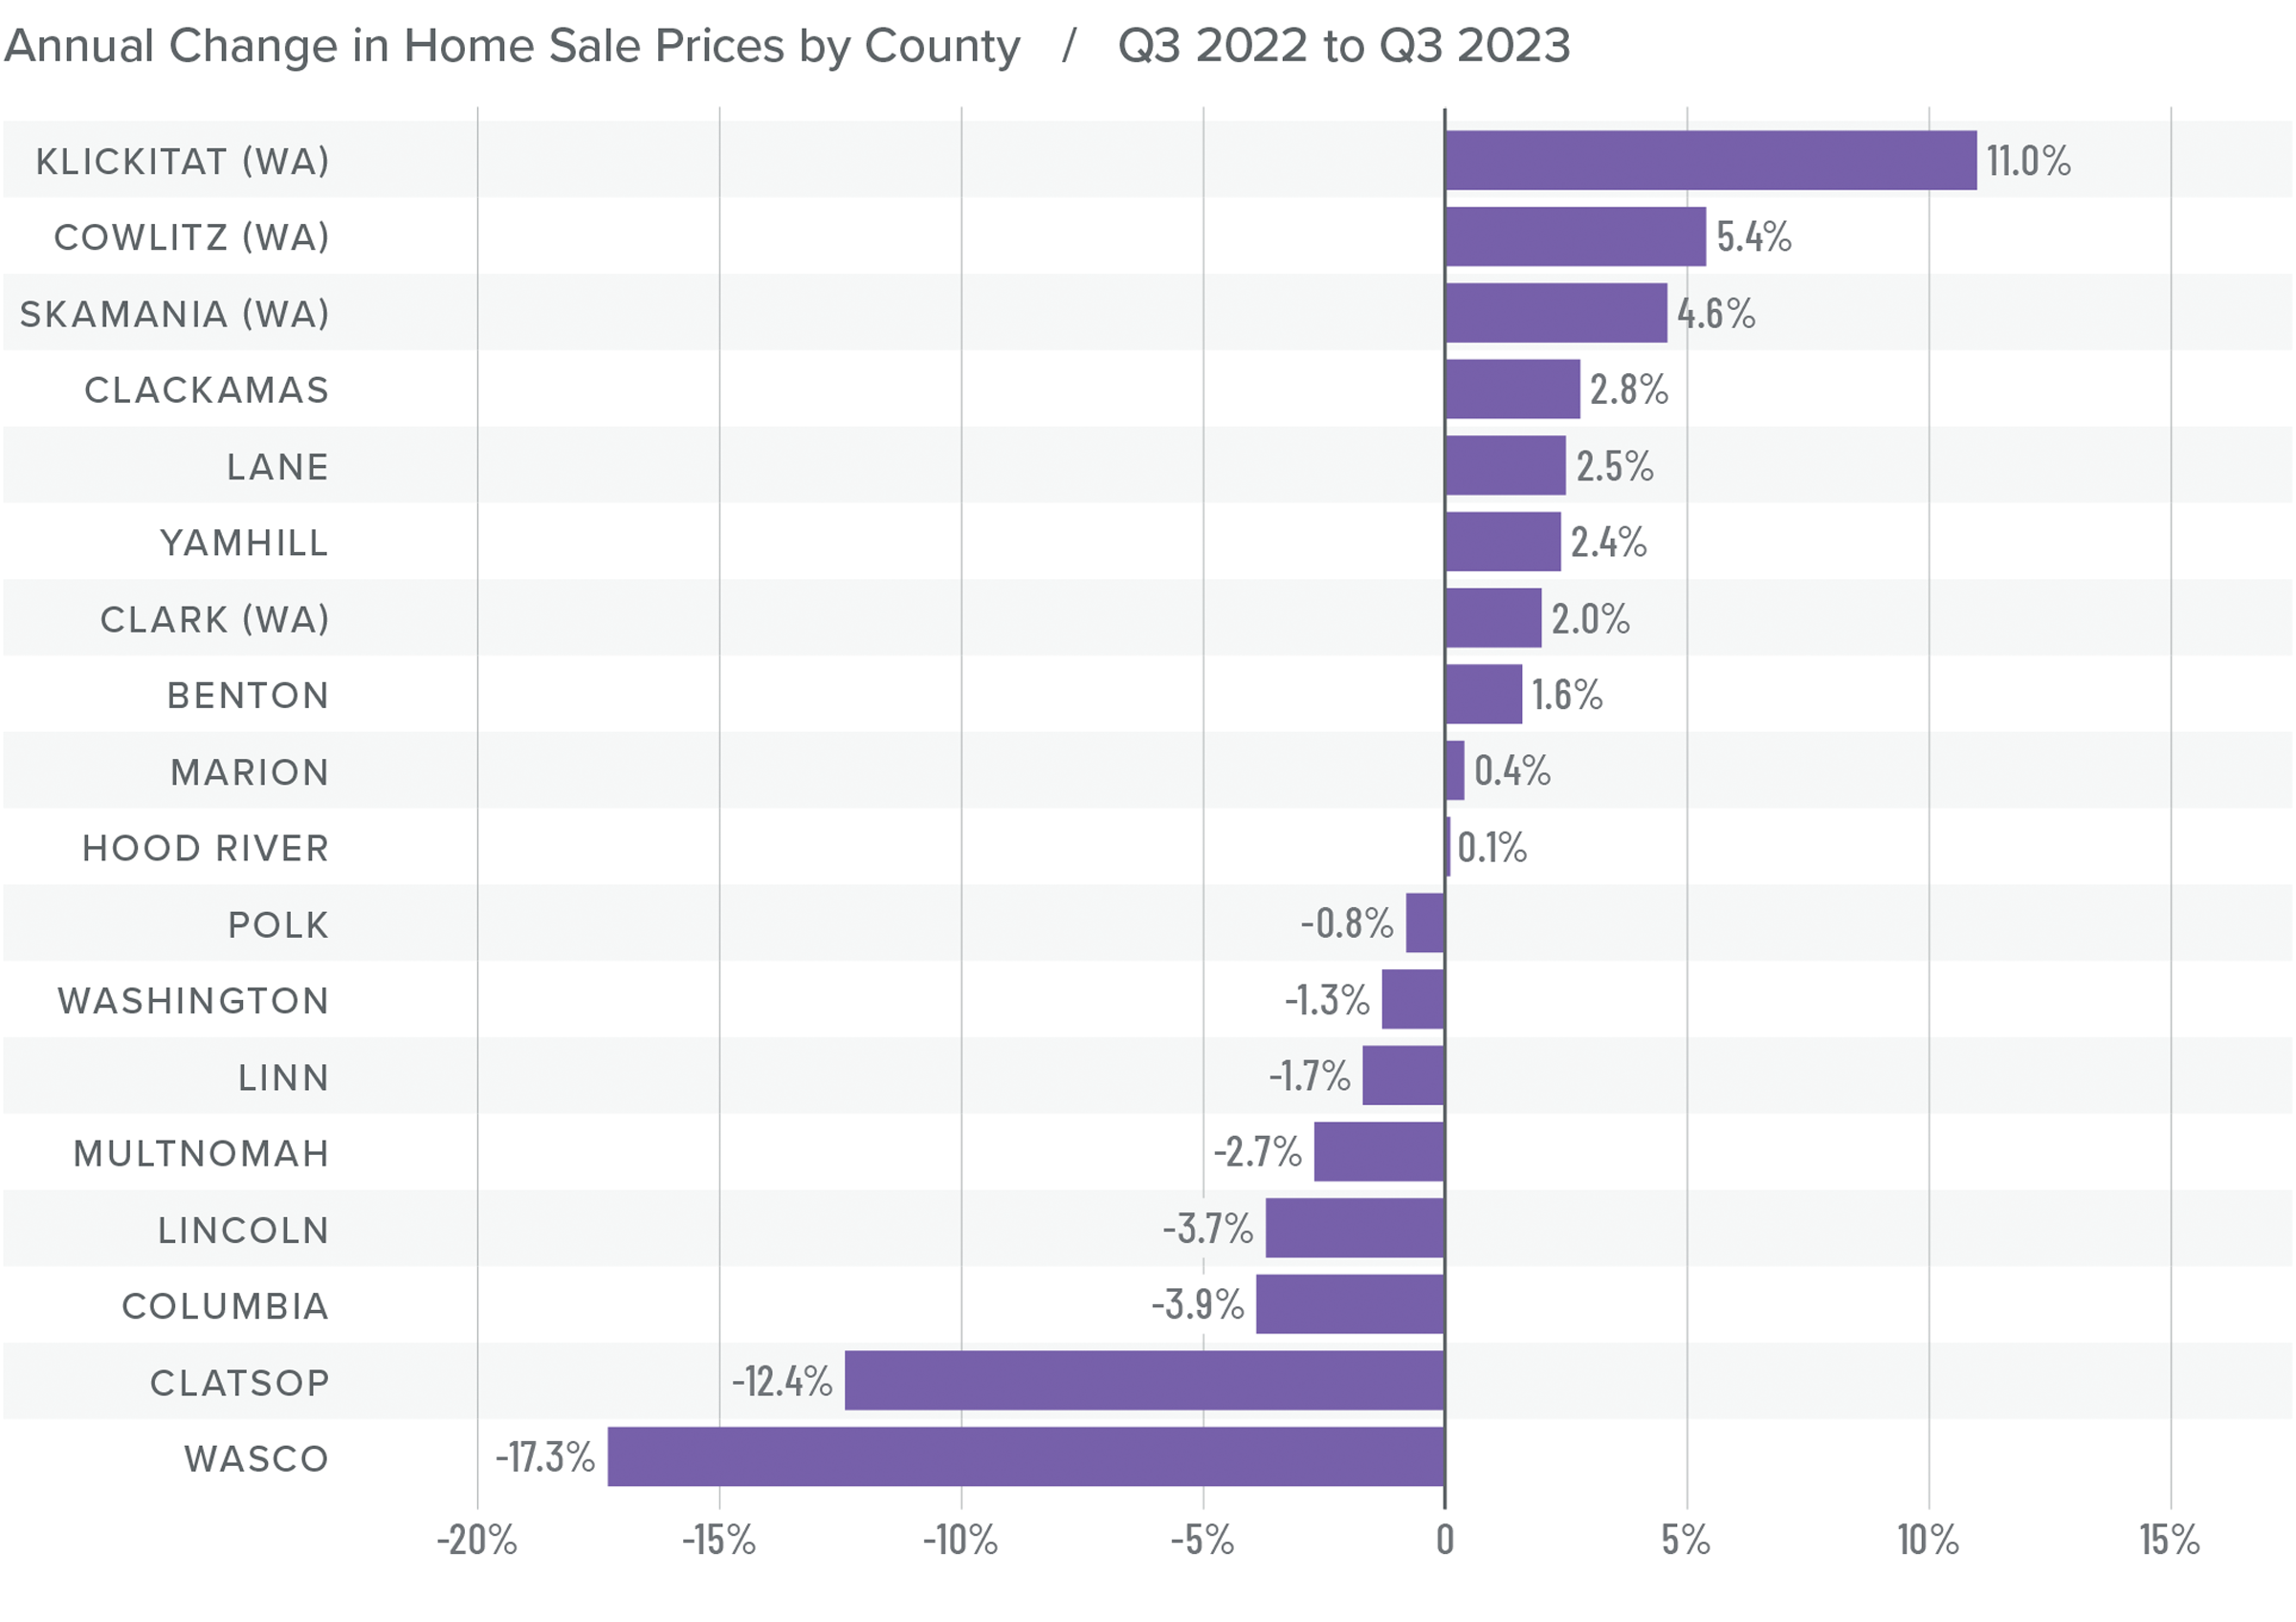
❱ The average price that a home sold for in the region fell .1% year over year and was essentially flat compared to the second quarter of 2023.
❱ On average, the median listing price of a home rose a modest 1.9% compared to the second quarter of this year, suggesting that home sellers are starting to be realistic about the impact higher mortgage rates are having on buyers.
❱ Average sale prices rose in 10 counties compared to the third quarter of 2022, while eight saw prices fall. Wasco and Clatsop counties experienced fairly significant declines in prices, but these are relatively small markets where significant swings can occur. The same can be said when looking at markets where prices rose, with prices in Klickitat County up more than 10%.
❱ Price growth appears to have stalled out, which isn’t surprising given that mortgage rates were above 7% for almost the entire quarter. I expect home prices to remain fairly static for the fourth quarter as buyers and sellers wait to see where mortgage rates are headed.
Mortgage Rates
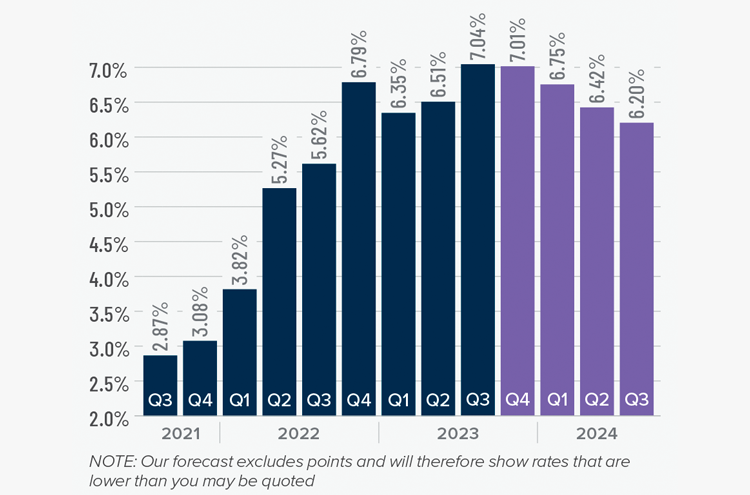
Mortgage rates continued trending higher in the third quarter of 2023 and are now at levels we have not seen since the fall of 2000. Mortgage rates are tied to the interest rate (yield) on 10-year treasuries, and they move in the opposite direction of the economy. Unfortunately for mortgage rates, the economy remains relatively buoyant, and though inflation is down significantly from its high, it is still elevated. These major factors and many minor ones are pushing Treasury yields higher, which is pushing mortgage rates up. Given the current position of the Federal Reserve, which intends to keep rates “higher for longer,” it is unlikely that home buyers will get much reprieve when it comes to borrowing costs any time soon.
With such a persistently positive economy, I have had to revise my forecast yet again. I now believe rates will hold at current levels before starting to trend down in the spring of next year.
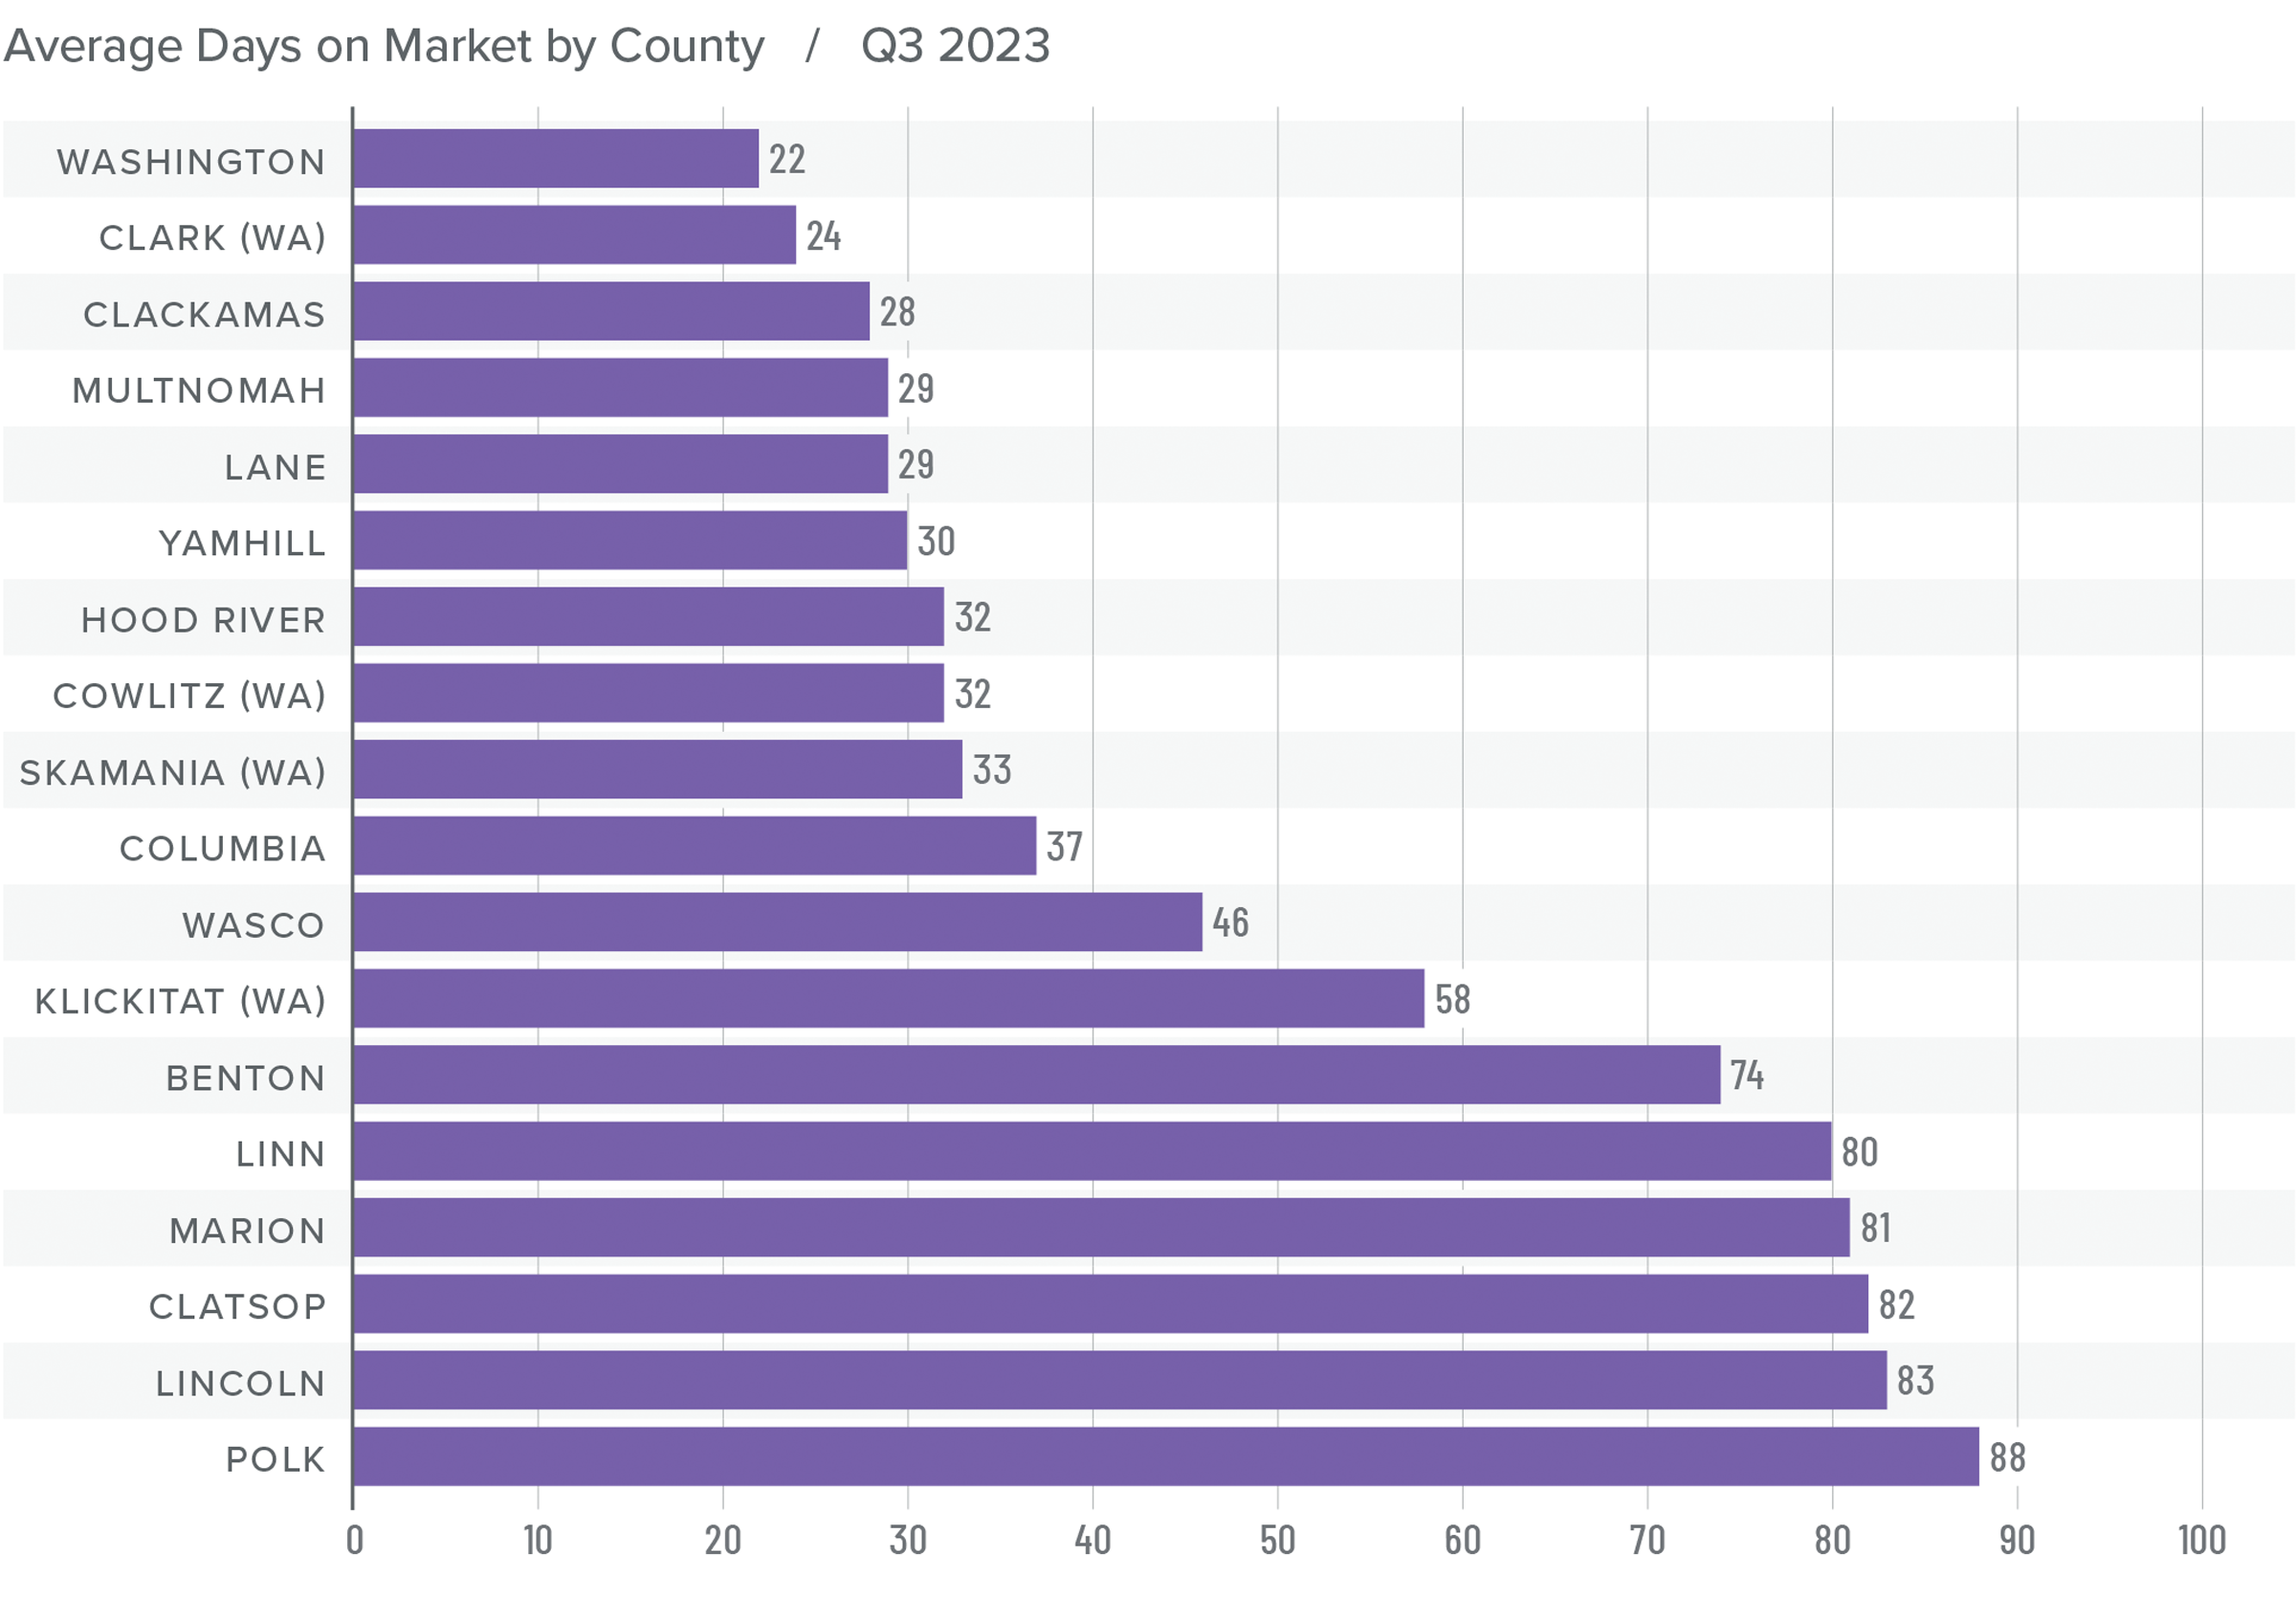
Northwest Oregon and Southwest Washington Days on Market
❱ The average time it took to sell a home in the third quarter of 2023 was 49 days.
❱ The average time it took to sell a home in the region rose eight days compared to the same period in 2022, but it took seven fewer days for a home to sell compared to the second quarter of 2023.
❱ Except for Benton and Skamania Counties, all counties in this report saw the length of time it took for a home to sell rise compared to the third quarter of 2022. Compared to the second quarter of 2023, market time fell in 13 counties. Days on market rose in Clackamas, Hood River, Marion, and Multnomah counties.
❱ The numbers seem to suggest that buyers are moving relatively swiftly when they do find a home that they want, even in the face of higher mortgage rates.
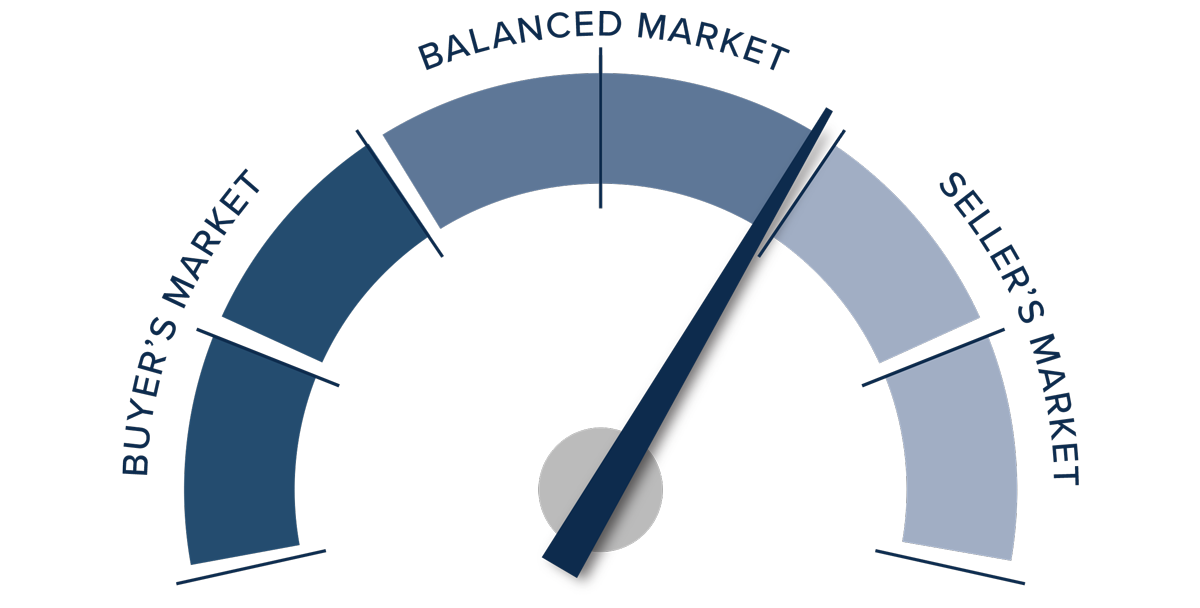
Conclusions
This speedometer reflects the state of the region’s real estate market using housing inventory, price gains, home sales, interest rates, and larger economic factors.
Although modestly lower home sales could suggest that buyers are in a better position when it comes to negotiating for a home, list prices, sale prices, and shorter market time favor home sellers.
In the second quarter market update, it was suggested that the market was returning to one that favors sellers and moved the needle accordingly. This is still the case, but mortgage rates remain a significant obstacle. Therefore the needle stays in the same position as last quarter: very slightly favoring sellers, but not by much.
")


