Since 1989, the Windermere Foundation has supported low-income and homeless families throughout the Western U.S. Earlier this year, the Foundation proudly crossed the $44 million mark in total donations.
2021 has been an active year for giving back at Windermere. Our offices have continued to support their communities during the COVID-19 pandemic, donating time and money to local organizations. In June, Windermere celebrated its 37th Annual Community Service Day, which saw agents and staff from across the Windermere footprint show up in force to partner with local organizations serving a variety of needs. When all was said and done, this year’s Community Service Day resulted in hundreds of hours of volunteer time and over $269,000 in donations.
Through the efforts of Windermere agents, owners, and staff, the Windermere Foundation raised over $1 million in the first half of 2021. This included the Windermere Lloyd Tower office which partnered with Adelante Mujeres, an organization that educates and uplifts the low-income Latina population in the Portland area. The Windermere Coeur d’Alene office worked with Second Harvest to set up a mobile market at the Kootenai County Fairgrounds to feed those in need, and the Windermere Spokane office partnered with Vitalant to set up a blood drive for local blood banks with depleted supply due to the COVID-19 pandemic.
To learn more about the Windermere Foundation, visit windermerefoundation.com. To help support programs in your community, click the Donate button below.
A swimming pool can turn a backyard into a grotto, an oasis, an at-home vacation spot. But to let the poolside good times roll, they require maintenance. Your local climate can often dictate how much you use your pool. For some homeowners, you may be swimming in your pool year-round. For others, the pool may be a summer ritual, only to close it up once fall temperatures start to plummet. No matter how often you use your pool, these tips will help you keep it in tip-top shape.
5 Tips for Swimming Pool Maintenance
1. Keep Your Pool Water Balanced
A well-balanced pool maintains the correct levels of chemicals and, through filtration and disinfection, avoids having to change the pool water year after year. The main levels of concern are pH, total alkalinity, chlorine levels and calcium hardness. Aim to keep these levels within the following parameters:
pH: 7.2 – 7.8
Total alkalinity: 80 – 120 ppm
Chlorine levels: 1 – 3 ppm
Calcium hardness: 180 – 200 ppm
2. Routine Cleaning
Regardless of the season, keeping your pool water crystal clear requires routine cleaning. Weekly tasks include vacuuming, backwashing the pool filter, applying algaecide and chlorine, and cleaning the skimmer baskets. Running the circulation system is a daily task, which keeps the pool water fresh. Pool walls are a commonly missed cleaning spot. Brush them routinely to prevent algae growth and to eliminate chemical buildup.
3. Closing Your Pool
If you don’t use your pool year-round, you’ll have to go through the steps of proper decommission to avoid any hang-ups when it’s time to open it back up. Stow all equipment including ladders, lights, and thermometers before cleaning and vacuuming the pool. After you’ve balanced the pool water, let the system run for up to twenty-four hours before adding winterizing chemicals. Once the chemicals have run through for a few hours, remove the pool equipment, and drain. Finally, cover your pool to protect it from debris during the offseason.
4. Opening Your Pool
For those who user their pools seasonally, the day you reopen your pool is cause for celebration. But before you draft up any pool party invitations, you’ll need to give it some TLC. If you use a removable pool cover be sure to store it in a safe, protected place. Fill the pool back up to the maximum fill line and clear any debris from the water’s surface. Once you’ve tested the water and properly balanced the levels, remove any winterizing plugs to get water flowing into the plumbing system again. Once you’ve tested all systems to make sure the water is being properly heated and pumped, cleaned the walls, vacuumed the floor, there’s only one thing left to do—cannonball!
5. Pool Offseason
Even when your pool is not being used it requires a watchful eye. Besides keeping your pool ready for when you open it back up, offseason maintenance will help to avoid any major repairs due to neglect. Check your pool water occasionally. Even if your pool is covered, it’s possible for leaves, sticks, and needles to make their way inside. Continue to monitor the balance of your pool water by checking the levels weekly and adjusting as needed. Check the pump, heater, and plumbing for any signs of damage and clean the filter regularly.
For more information on keeping your home and the systems in it well-maintained, read more on our blog:
Successfully selling a home and buying a home are significant accomplishments on their own, but when their timelines cross it can be difficult to manage both. If you’re thinking about doing both simultaneously, it’s equally important to understand the steps you can take to make the process go smoothly as it is to have a backup plan in case it doesn’t. Above all, the balancing act required to pull off both deals highlights the importance of working closely with a trusted and experienced real estate agent.
Do I buy or sell first?
One can imagine a perfect world in which the two transactions go through one right after the other. However, this is not usually the case. So, should you list your current home first or start by putting in offers on a new one? There are pros and cons to both.
Selling your current home first allows you to make offers on a new home with cash in your pocket, increases your buying power, and avoids having to juggle two mortgages simultaneously. On the other hand, it creates a gap of residence, often leaving homeowners wondering where they’ll stay until they move into their new home or whether they may need to rent before they can buy again. Sellers may also negotiate a rent-back agreement with the buyers, allowing them to rent the house from the new owners before they move in.
Buying before selling solves the need for any temporary housing and makes the overall moving process much easier. Having a residence established ahead of time means you’ll only have to move once, which can save you some serious stress during this time of transition. Oppositely, buying a new home before you sell your current one will put an added strain on your finances. Having two concurrent mortgages equates to taking on more debt, which could result in less-than-favorable loan terms for purchasing your new home. Without the lump sum generated by a home sale in your pocket, coming up with enough money for a down payment may be a challenge and obtaining private mortgage insurance (PMI) may be in the cards. Finally, buying before selling comes with an obvious assumption—that your current house will sell.
Ultimately, the order of operations depends on your situation. Perhaps you’re moving due to a change of employment, and you need to direct all your energy toward buying a new home by a certain date before you can even think about selling your current one. No matter which route you take, it’s important to communicate your timeline to your listing agent or your buyer’s agent so they can strategize accordingly.
Buying and Selling a Home at the Same Time
Local Market Conditions
Buying and selling at the same time will come with a certain duality: at each step in the process, you’ll have to balance your responsibilities as both a buyer and a seller. For example, when assessing your local market conditions, you’ll be looking at not one, but two housing markets.
Seller’s Market: Selling in a seller’s market means that that you’ll need to be prepared to move once you list, since you could be looking at a short selling timeline. However, relying too heavily on the assumption that your house will sell quickly could make things dicey down the road. If you’re buying in a seller’s market, finding a new home may take longer than expected. You could potentially be waiting weeks or months for an offer to get accepted.
Buyer’s Market: Selling in a buyer’s market typically means that homes stay on the market longer. If you proceed with a new home purchase just after you’ve listed your current house, know that it may take a while to sell. If you’re buying in a buyer’s market you can afford to be picky, knowing that time is on your side. With fewer people buying homes, sellers will be more flexible, giving you leverage to negotiate your contingencies.
Having a Backup Plan
If only you could wave a magic wand and make both transactions go through as planned. That’s why it’s important to have a backup plan in place to right the ship should things go sideways at any point in the buying or selling process. Talk to your agent about which options may be right for you. Here are a few:
Sales Contingency: Buying your new home with a sales contingency allows you to opt out of the purchase contract if your home doesn’t sell by a specified date. Purchasing contingent on the sale is rare in highly competitive markets.
Bridge Loan: If your current home hasn’t sold yet and you’re not able to afford the down payment on a new home, a bridge loan may be a fitting solution. Bridge loans can be used to cover the down payment on a new house and are repaid once your existing home has sold.
Rent-Back Agreement: A rent-back agreement is a clause in the sales contract that allows the seller to rent their old home from the buyer for an agreed-upon period of time before the buyer moves in. This can be especially helpful in situations when the seller is having trouble finding a new home.
For more information on buying and selling a home at the same time, connect with an experienced Windermere Real Estate agent today by clicking on the button below.
This video is the latest in our Monday with Matthew series with Windermere Chief Economist Matthew Gardner. Each month, he analyzes the most up-to-date U.S. housing data to keep you well-informed about what’s going on in the real estate market.
Hello there! I’m Windermere Real Estate’s Chief Economist, Matthew Gardner, and welcome to the latest episode of Mondays with Matthew.
Today I wanted to take a look at the several housing related data releases that came out in August, and I am going to start off with the new home sector and the July numbers for housing permits and starts.
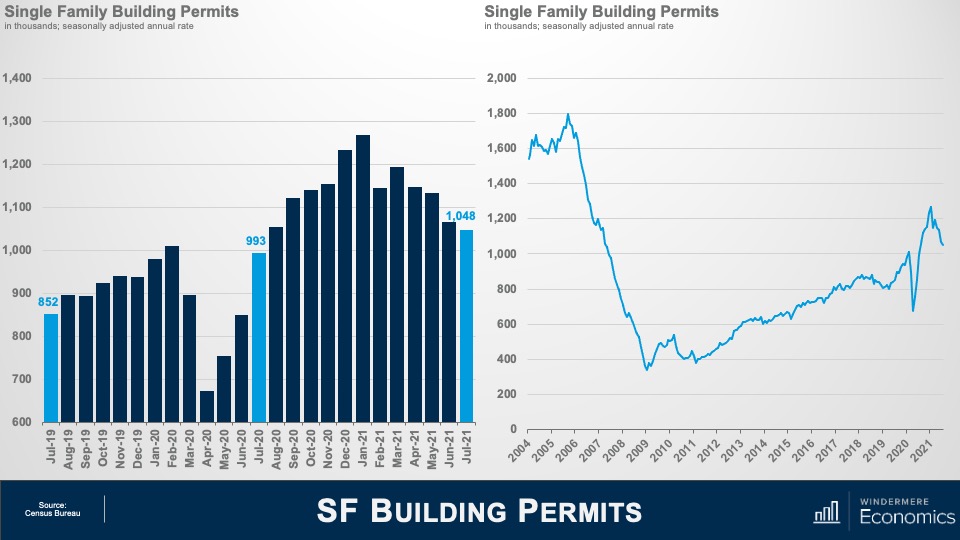
New home permits – and here I am referring to single-family permits – fell by 1.7% (or roughly 18,000 units) in July to an annualized rate of 1.048 million units and have been heading backwards since March.
But I always like to put things into perspective and you can see here that although we have seen a pullback over the past few months, the trend has actually been heading higher since we emerged from the financial crisis in 2011.Of course, COVID had a very pronounced impact on permit activity, but it bounced back rather impressively, that is until the parabolic increase in lumber and other costs really started to hit builders hard.
And the slowdown in permits obviously impacted housing starts which dropped by 4.5% – or 52,000 units – to an annual rate of 1.11 million.
Starts fell across most regions, with the exception of the west which rose by 0.9%. Declines were led by the Northeast (-6.3%), followed by the Midwest (-2.3%) and the South (-2.0%).
But again, for perspective, you can see that the longer term trend is still improving, but I am afraid not to the degree needed to address the massive housing shortage that the country faces.
If you have watched these videos for any length of time you will know that I like to look at homes under construction as opposed to housing starts – which many do not – as I believe it offers a better gauge of the market that permits or starts data. And for those who might not be aware of the difference between housing starts and houses under construction, a home is technically started if a foundation has been poured, but it does not mean that vertical construction has started, but homes under construction show just that.
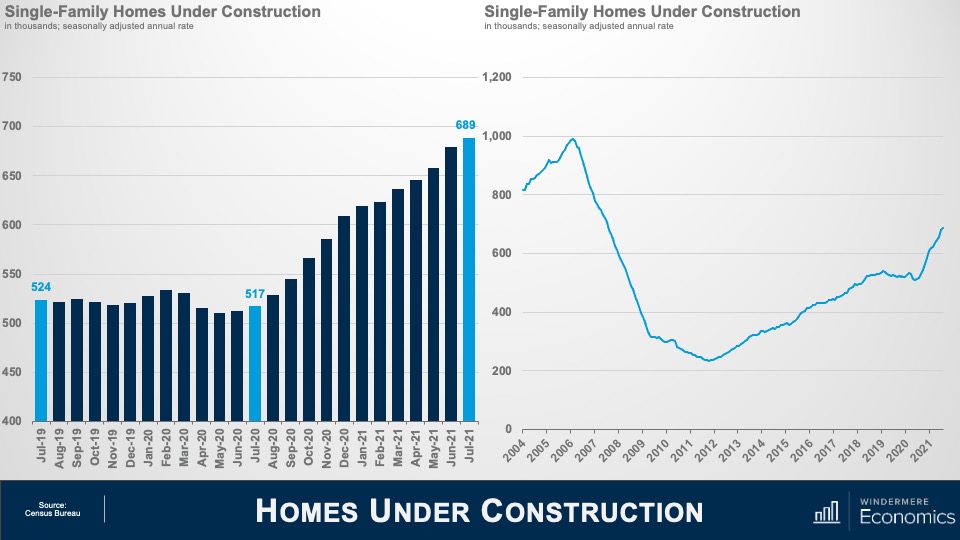
And the number of homes actually being built rose by 1.5% in July to an annual rate of 689,000 units, and that is 33% higher than the same time a year ago.
All regions other than the Northeast – which dropped by 1.6% – saw the pace of vertical construction rise versus June with the South leading the way with a 2.7% increase. This was followed by the Midwest which rose by 1.1%, and the West saw a more modest increase of 0.5%.
Again, when we look at a longer timelines, the growth is actually rather impressive, but, again, it still falls well short of demand.
So, what I see in this data is that the pullback in housing starts was not a surprise, given that permitting activity (which is a leading indicator for starts) having fallen in each of the prior three months. But despite this, the overall pace of new homebuilding actually remains relatively healthy, with the six-month moving average of homes under construction above the pre-pandemic trend at a little more than 655,000 units.
Although rising material costs, a significant shortage of qualified labor, and affordability challenges are all still keeping builders awake at night, I believe that the fundamentals for homebuilding remain solid, thanks mostly to an improving labor market backdrop and still exceptionally low inventory levels.
Additionally, a recent easing in mortgage rates, and a significant pullback in lumber prices which have fallen sharply since peaking in mid-May and are now back to pre-pandemic levels, also provide support to growing new construction activity.
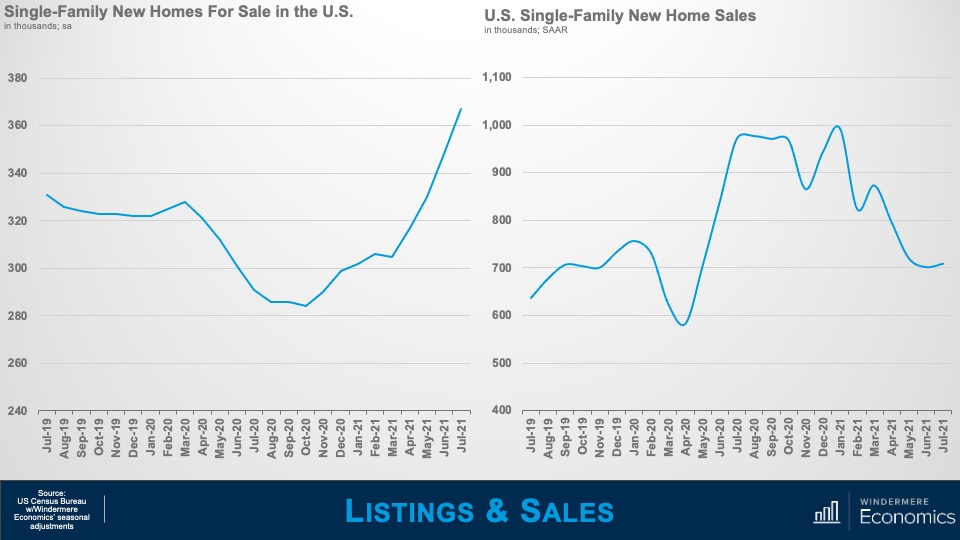
Moving on to new home sales in July and it was a bit of a mixed bag. As you can see here, the number of new homes for sale continues its upward trend – which bottomed out last Fall – and rose by 5.5% versus June and is up by over 26% from a year ago.
Now, this may sound to be great news but as I dug though the data, I saw a different story. You see, the jump in listings was driven by a record rise in homes for sale that have yet to be built.
In fact, the number of houses for sale that have yet to break ground accounted for almost 29% of total inventory. Why is this? It’s because many builders are very cautious about the market given expensive raw materials as well as limited land supply and construction workers.
On the sales side of the equation, contract signings were up by 1% versus June to a seasonally adjusted annual rate of 708,000, but that is down by 27% from a year ago.
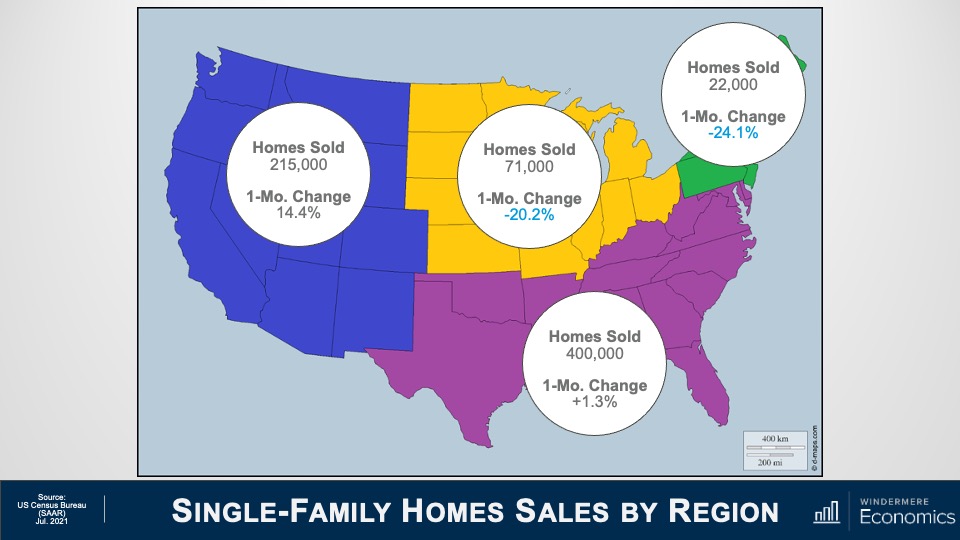
Last month’s gain in new home sales was driven by a 1.3% rise in the populous South and a 14.4% jump in the West, but sales plunged 24.1% in the Northeast and were 20.2% lower in the Midwest.
There can be no doubt that affordability is becoming an increasing issue in the new-home market. The median sale price is up almost 18% from its pre-pandemic level, which is a touch lower than the run-up in sales prices in the existing-home market, but still enough to deter potential homebuyers.
And cost is another factor – in addition to COVID-19 – that is accelerating the migration to suburban markets and metro areas in lower-cost states such as Arizona, Utah, Texas and Florida. But, by contrast, new home sales have weakened in areas where population growth has slowed, in part due to an outflow of residents seeking more affordable real estate, lower taxes and other lifestyle advantages. It will be very interesting to see if this is a trend that continues as we head into 2022.
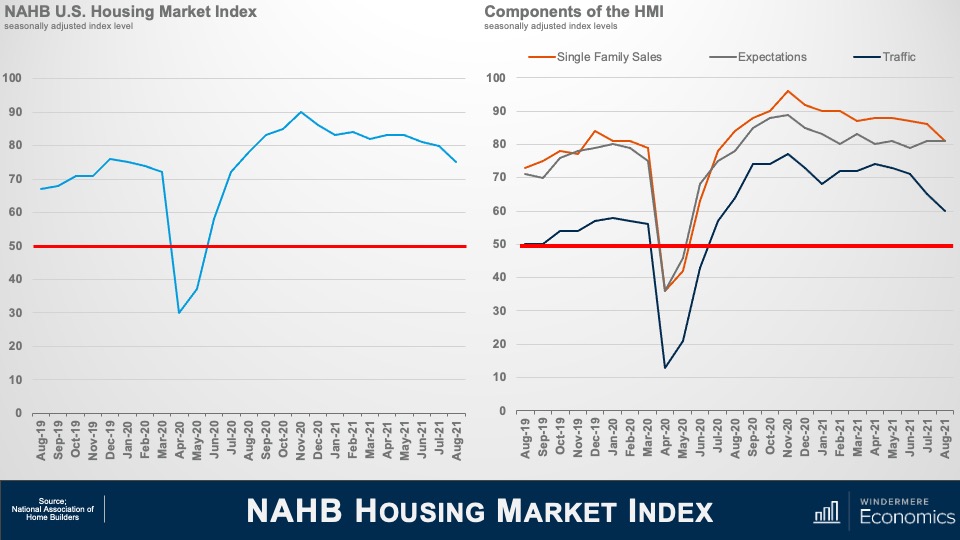
Moving on – the National Association of Homebuilders published their Index of Builder Sentiment in August, and the data rather echoes the numbers that we have just been discussing. You can see that sentiment in the single-family market has been easing gradually in recent months, but it remains well above the 50 level, suggesting that more builders are seeing the market as good, rather than bad, even if the current index is at its lowest level in 13 months.
And when we look at the components of the index, sales conditions fell five points to 81 and the component measuring traffic of prospective buyers also posted a five-point decline to 60. But the gauge charting sales expectations in the next six months held steady at 81.
As we have talked about, builders are facing significant obstacles and this is impacting the pace of new development. According to Freddie Mac, the U.S. housing market is 3.8 million single-family homes short of what is needed to meet the country’s demand and in order to catch up, builders would need to construct between 1.1 million and 1.2 million single-family homes a year to meet long-term demand but, in truth, the start rate would need to be even higher to shrink the existing deficit that we are currently experiencing.
And with more demand than new supply, what happens? That’s right, buyers turn their attentions to the existing home market and that is a neat segue into the final dataset that dropped this month, and that’s the existing home sales numbers for July.
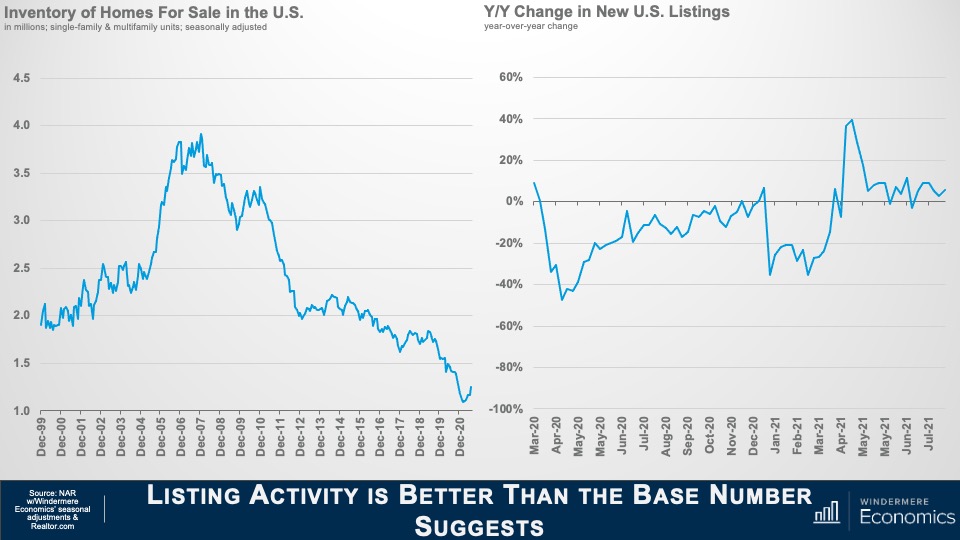
It was pleasing to see that, for the 5th month in a row, Inventory levels ticked higher and, unadjusted for seasonality, were measured at 1.32M units, but I like to look at the seasonally adjusted number and that came in at a still respectable 1.0246M units.
I also like to look at the number of new listings which gives a better view on the market – and as you can see here, they are up year-over-year and that is allowing sales to accelerate.
You see, the inventory number that NAR puts out represents the number of homes for sale at a set date in the month; however, new listings show the total number of homes that came on the market during that month and if a sale is agreed upon in the same month that it comes to market, then it is not included in the overall inventory number.
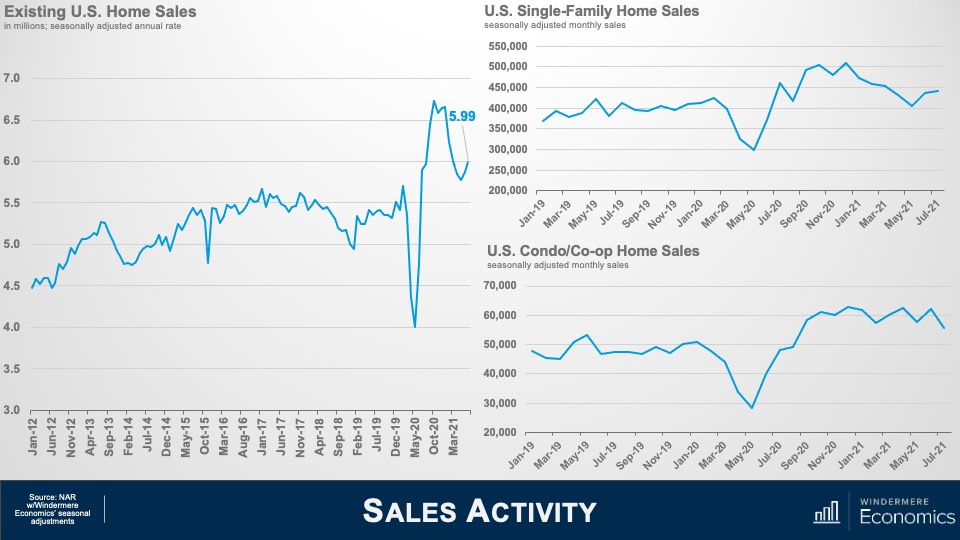
And because new listing activity is still pretty robust, it has allowed sales to tick back up as you can see here. On a seasonally adjusted, annualized basis, sales came in at 5.99M – up for the second month in a row but still well below the numbers we saw last Fall.
On a month-over-month basis, single-family home sales rose by 1% to almost 442,000, but multifamily sales dropped by over 10%, but were still up by 15% from a year ago.
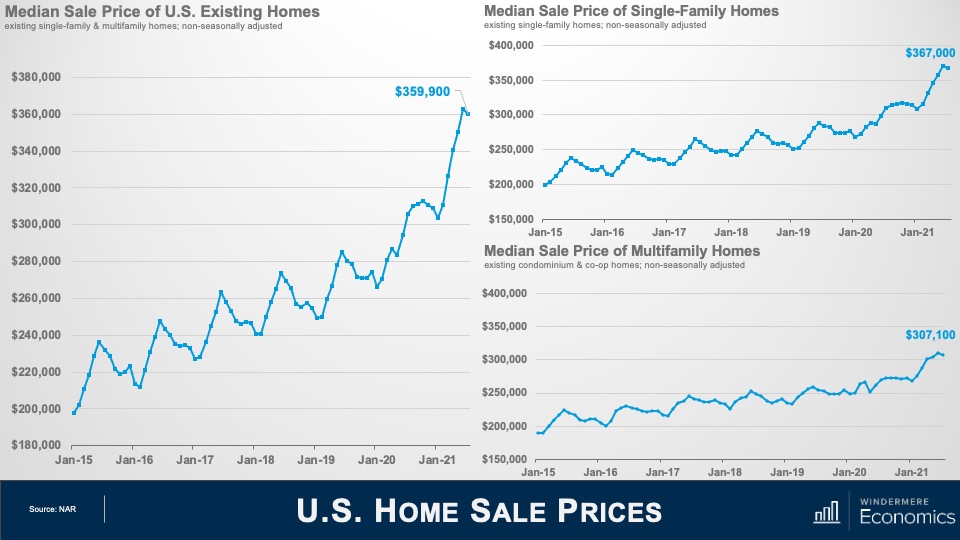
Home prices took a little breather in July – dropping by 0.8% month over month – but are still 17.8% higher than seen a year ago.
Single-family home prices also dipped by 0.8% to $367,000 – but are up by 18.6% from a year ago and multifamily sale prices dropped by 1.3% to $307,100 but were up 14.1% from July of 2020.
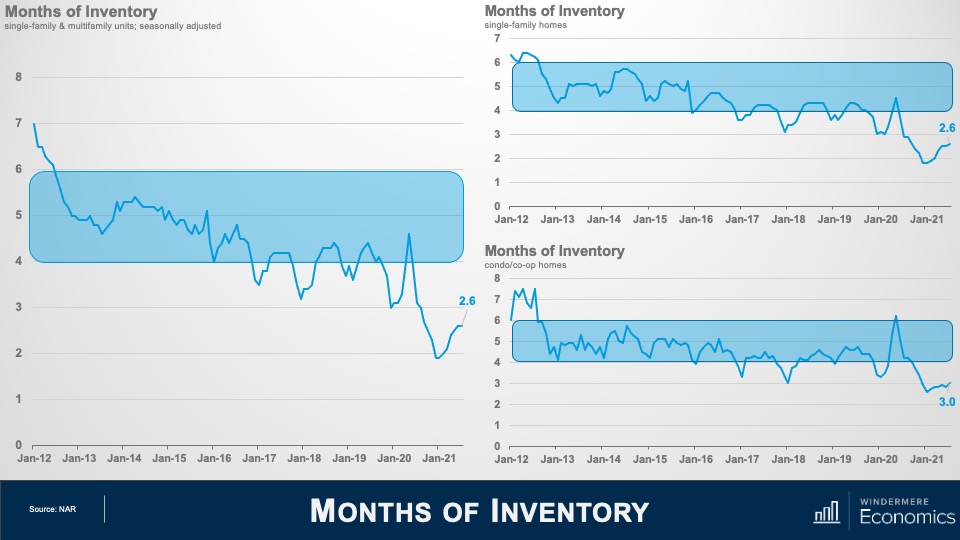
Even though we saw modest increases in listing inventory, the market is still far from balanced. At the existing sale pace, there is only 2.6 months of supply, well below the 4-6 months that is considered balanced, but certainly better than the 1.9 months we saw back in January.
The same was seen in the single-family arena which also showed 2.6 months of supply and things were slightly better in the condo and co-op world where there is currently 3 months of inventory.
As I went through the report in more detail, there were a few more nuggets worthwhile mentioning. Although it is true that inventory levels are somewhat higher – which is certainly a good thing – but the market remains remarkably tight.
For example, for every offer accepted on a home in July, there were 3.5 additional offers; half of all offers made in July were above the list price and, because the market remains highly competitive, the number of all-cash offers rose from 16% a year ago to 23% in July. And with 89% of homes going pending in the same month that they were listed, and the average days on market coming in at just 17, we are still quite far away from experiencing a normal housing market.
Well, I hope that you have found this month’s discussion to be interesting. As always if you have any questions or comments about this topic, please do reach out to me but, in the meantime, stay safe out there and I look forward the visiting with you all again, next month.
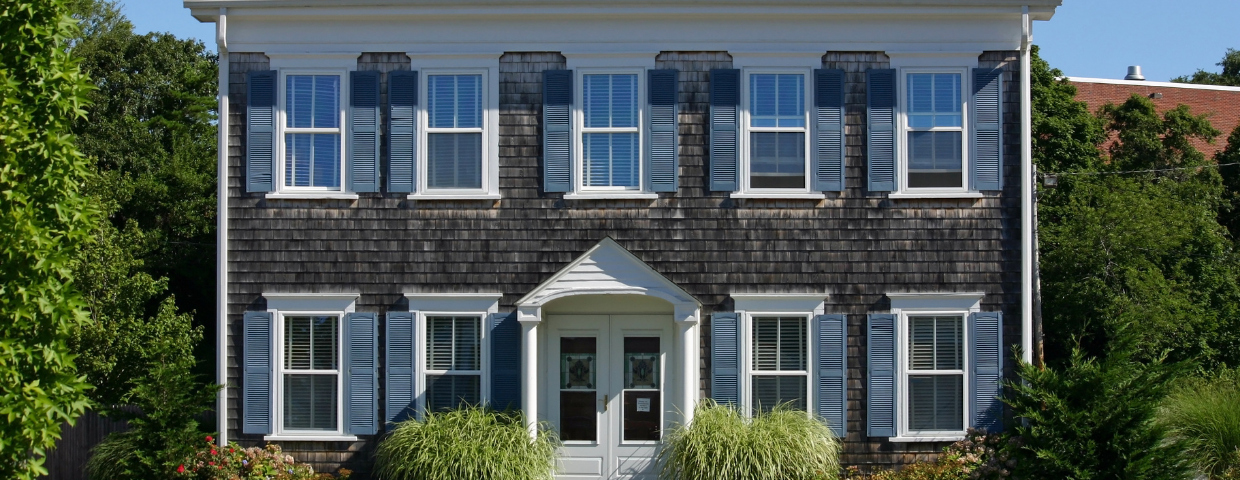
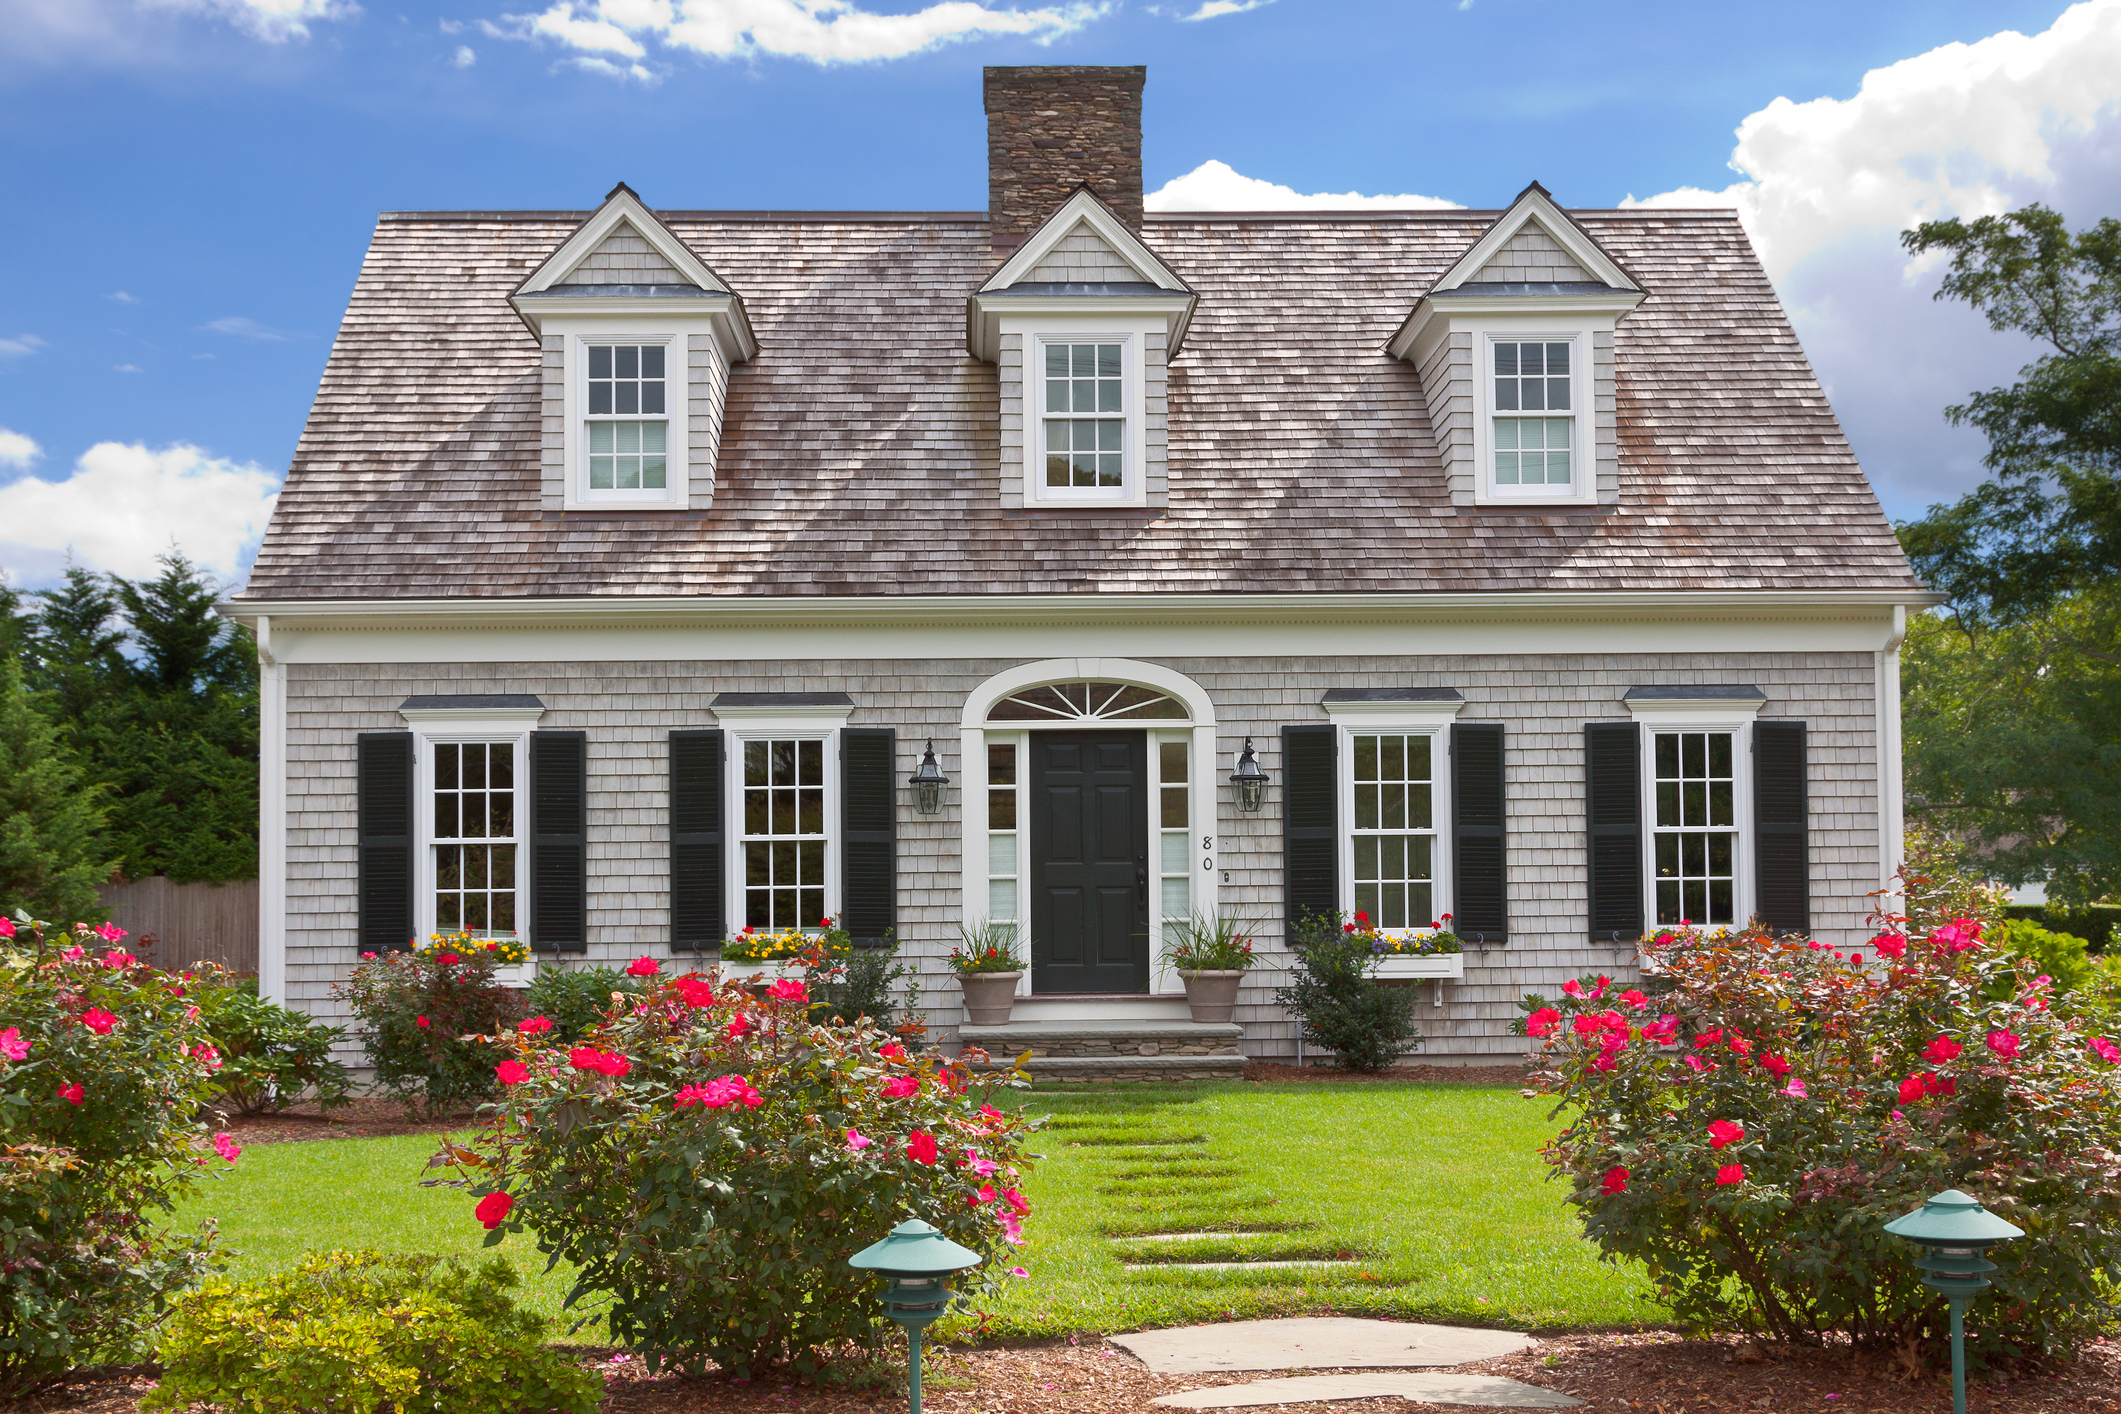
Today, the Cape Cod architectural style is synonymous with waterfront property, windy beaches, and vacation getaways. Known for its distinct exterior features and cozy interior spaces, the Cape Cod home has become an American classic.
History of the Cade Cod Home
The original idea behind the Cape Cod home was to bring a bit of across-the-pond familiarity to the early English settlers in New England. The design of the home was conceptually similar to an English cottage, except with certain modifications to fit the harsher Northeast climate. These homes were built throughout the region during the 19th century, then experienced a surge in popularity in the early-to-mid twentieth century, due to a renewed interest in colonial-era architecture and their affordability in a post-World War II economy.
Image Source: Getty Images – Credit: OlegAlbinsky
What is a Cape Cod Home?
The Cape Cod style uses simple lines and shapes that recall the English cottages they’re inspired by. They are typically one or two stories, square or rectangle in shape, with steeply pitched roofs, shingled exteriors, window shutters, and a central chimney. The steepness of the roofs was designed to reduce snow buildup, thereby reducing the risk of a roof collapse from bearing too much weight. The characteristically low ceilings were meant to prevent heat from escaping, while the shutters served as a wind block against the cold New England breeze.
There are multiple styles of Cape Cod homes. The easiest way to tell the difference between styles is to count the number of windows on either side of the front door. If there are two windows on one side of the door, it is what is known as a “half cape.” A home with two windows on each side of the front door is known as a “full cape.” Regardless of which sub-category a particular Cape Cod home falls under, they all share a flat front façade, which creates their square or rectangular shape. Over time, designers have updated the Cape Cod design to accommodate the needs of modern life, but their unmistakable aesthetic remains timeless.
Visit our Architectural Styles page to learn more about the history behind certain styles of home design, from A-Frame to Victorian. For more information on home design, remodeling, and decorating, visit the Design page on our blog.
This article originally appeared in the Summer 2021 issue of Windermere Living.
By Amanda Zurita
Summer, especially this summer, is meant for barbecues, outdoor movie nights, garden gatherings, and rooftop cocktail affairs. Keep the focus on reconnecting with friends and family by opting for unfussy, minimalist decor and clean color palettes. It’s about time we have something to celebrate, isn’t it?
Backyard Barbecue
Upgrade the summertime tradition of the backyard barbecue with stylish and simple tools.
Image Credit: Jayme Burrows / Stocksy
The most time-honored summertime gathering takes place in your own backyard, and a lineup of modern tabletop grills and tools means you can feed a fête without much fret. For example, BergHOFF’s sleek tabletop grill has a compact design that can easily transport to a balcony or the beach—simply add charcoal, and you’re ready to take orders. Or switch it up with one of this year’s most popular cooking contraptions, a portable pizza oven, like the one made by Ooni. With models powered by gas or by wood fire, these ovens can cook a 12-inch pizza in as little as 60 seconds and will work for meats and vegetables, too. Focus on main courses, and ask your guests to bring sides or desserts to share. Complete the ambience by piping a playlist through portable outdoor speakers like the Move by Sonos, which are equipped with voice control and Bluetooth tech, so you can play DJ with ease.
Elevate Your Grill Game Without Going Too Crazy
Burgers on the menu? Stuff them with gourmet cheeses, like bleu or mozzarella, before throwing them on.
Sitting down together? Time your steaks right by searing them first and finishing them just before serving.
Make it a pizza night—with or without a pizza oven. Load pies with your favorite fixings, roll them out on a pizza stone, and cook them over the open flame.
Don’t skimp on fruits and veggies. Grilled vegetables are summer’s side dish; peaches and pineapple make for a sweet and juicy dessert (make it á la mode!).
Garden Party
Elevate your outdoor space with basic romantic elements.
Image Credit: Trinnette Reed / Stocksy
A garden party is a glorious way to gather with friends for an elegant afternoon. Start by creating a special space in the yard by laying down some outdoor rugs or erecting a temporary canopy to provide shade. To illuminate the celebration, surround the table with candlelit lanterns, or string outdoor lights between overhead branches. Then, it’s all about the tablescape. Select durable (and unbreakable) dishware like sustainable bamboo plates and bowls from Fable New York, which come in a range of colors like soft blush, buttery yellow, and eggshell blue. The same goes for glasses, which can be as durable as they are chic in fluted acrylic designs from West Elm. To distribute your chosen refreshments, fill a cheery pineapple-shaped beverage dispenser from Nordstrom with punch or lemonade, or stock bottles of bubbly in a sleek Permasteel rolling patio cooler. Once you’ve covered the dining and decor, add extras that keep your guests comfortable, like classic paddle fans, supplied by party stores and wedding suppliers like The Knot. Keep mosquitoes at bay with a discreet Patio Shield repeller by Thermacell, which creates a 15-foot zone of protection around your gathering.
Add a touch of natural beauty by creating simple flower arrangements based on what’s in your yard—or the local farmers market. Seasonal blooms like tulips, peonies, and ranunculus come in many shades and have a textural, wild appearance. To step outside the expected, add branches from cherry or olive trees or fresh fruits from trees on your property. Take your time adding and subtracting elements until you achieve a look you love. A flower frog or stretch of lattice can help hold everything in place. For a minimalist spray, choose a monochromatic color palette, or keep it light with just a few blooms.
Sunset Soirée
Watch the sun set from your rooftop, porch, or balcony at an elegant yet restrained affair.
Image Credit: Jovo Jovanovic / Stocksy
To set a classic (and classy) mood, make a portable record player the center of attention, and invite guests to bring a favorite album. Many options, like the turntables from Crosley, have Bluetooth capabilities, so you can link speakers and switch to digital music with ease. To keep the evening chill away, set up a portable fire pit (Solo offers wood-burning, smokeless options in a number of sizes). Citronella candles, like Pottery Barn’s artful candle, help maintain the romantic ambience while keeping the buzz kills away.
Cheers to You
A polished party deserves an equally upscale signature drink, but you don’t want to spend all night playing bartender. A Champagne punch you can batch in advance is easy to make but elegant enough to fit the vibe. This recipe for a berry satsuma sangria will fit the bill and please a crowd, especially when served in shatter-resistant stemware from Williams Sonoma. Prepare about an hour before your party to preserve the bubbles.
Ingredients
6 satsuma oranges
1/2 pint strawberries, sliced
1 pint raspberries
1 bottle of chilled dry Champagne or sparkling wine
6 oz Grand Marnier liqueur
4 oz club soda
2 oz cherry brandy
Fresh mint for garnish
Recipe
Place the segments of two oranges and all of the strawberries and raspberries into a large punch bowl or drink pitcher. Juice the remaining oranges for about . to ⅔ cup of orange juice, and add to the bowl along with the remaining liquid ingredients. Stir together and taste, adding simple syrup if it isn’t at your desired sweetness. Serve over a large ice cube and garnish with mint.
Movie Night
Everything you need to get cozy under the stars.
Image Credit: Shutterstock
Pump Up Your Popcorn
Toss plain popcorn with a variety of seasonings: try butter, salt, and truffle oil; crispy bacon, a few tablespoons bacon drippings, butter, and chopped chives; butter, sriracha, and lime—or bake popcorn on a tray with a few cups of your favorite cheeses for a crunchy-melty treat.
It’s lights, camera, action with a backyard movie night to rival any drive-in. If you’ve spent the last year watching everything Netflix has to offer from the comfort of your couch, this change of scenery is (literally) a breath of fresh air. Opening your own outdoor theater is easy with movie screens, like Pottery Barn’s streamlined option, that set up in no time and come with a portable storage bag. Upgrade from blankets or lawn chairs to specially made outdoor bean bags from Jaxx, line the aisles with IKEA’s romantic solar lanterns, and you’re ready for showtime under the stars.
Project: Projector
When choosing a projector, consider brightness levels in your yard. If you have any light pollution, you’ll likely need a projector that puts out 800 lumens for an 80-inch screen size. A short throw projector, placed three to eight feet from the screen, is ideal. Epson’s EF-100 Mini Laser Projector is a good bet, and it’s both powerful and light, weighing just under six pounds. As for audio, most projectors that do have built-in speakers won’t offer the cinematic sound quality you’re looking for, so a set of well-placed Bluetooth speakers will round out the full experience. A pair of Anker Soundcore Motion Boom speakers placed at the back corners of your viewing area can create rich surround sound. And be sure to let the neighbors know about movie night so they aren’t surprised—better yet, why not extend an invite?
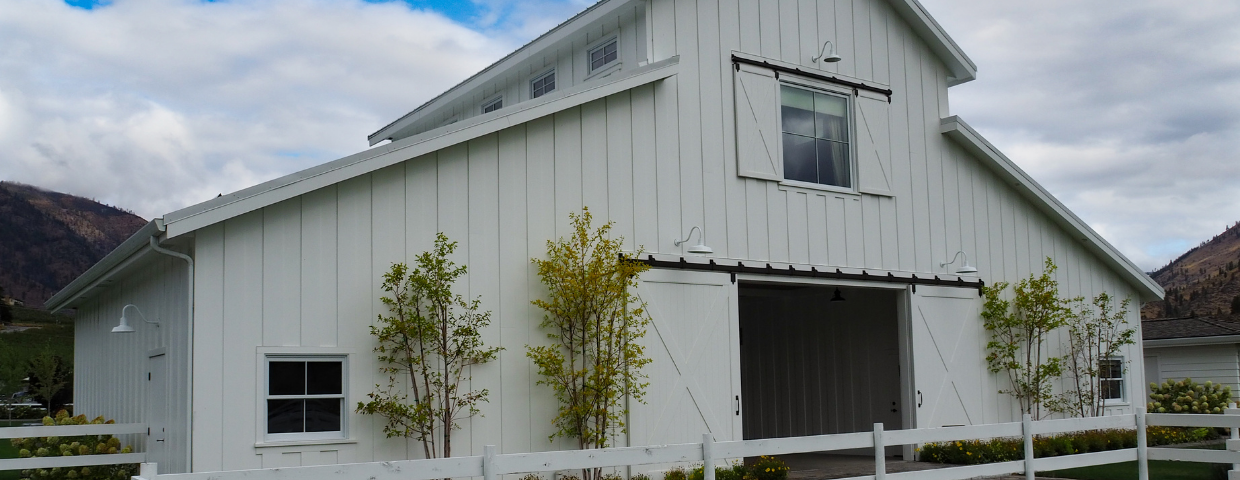
A barndominium is a combination of a barn and condominium and is typically custom built from metal pole barns or other similar structures. Due to the metal structuring, barndominiums require less maintenance than a traditional home. They are also less susceptible to deterioration and damage. The popularity of barndominiums has taken off in recent years due to their multi-functionality as a home, a workspace, a shop, etc. Designs can range from one-story steel structures to contemporary barn homes. Chip and Joanna Gaines from HGTV’s “Fixer Upper”, aired an episode about barndominiums in which they converted a barn with horse stalls and hay storage into a stunning five-bedroom, two-bath home.
Customizable
When designing a barndominium, the floor plan is very flexible. Due to their uncommon framing and design, you have carte blanche to decide which layout is ultimately best for you. Choose to have an open floor plan with designated spaces for each room, or put-up dividing walls that provide more separation. Some barndominium models include energy-efficient windows, engineered concrete slabs, spray foam insulation, plumbing, high ceilings, and much more. There are several companies that offer custom barn home kits which include both the plans and building materials.
Affordable
Inevitably, the cost of building your barndominium will increase depending on the materials and the complexity of its design. However, most barndominiums are relatively affordable to build. According to metalbuildinghomes.org, many large high-end builds begin at $250,000. Other builders will generally charge around $85 per square foot for a complete build-out. On the other hand, a basic barndominium shell with a living quarters can fetch prices as low as $20 per square foot. A basic shell would include the bones of the structure: the slab, building, plumbing, metal or wood, electrical stub outs, vents, sinks, showers, and washrooms. Due to the simplicity of construction, a barndominium can be finished in a matter of weeks. The initial purchase price and the cost of maintenance are considerably lower than a traditional single-family home. Saving money on the necessities allows you to dedicate more funds toward personalizing the space.
Multi-Purpose
Barn Pros in Monroe, Washington explains the different uses of their customizable barns. As they explain, the uses their clients have found for their barndominiums run the gamut from primary homes to yoga studios, to barns for growing plants, as animal sanctuaries, educational facilities, and wedding venues. According to Barn Pros, roughly 40 percent of clients use them for agricultural purposes. The owners of these structures say that there is something appealing about a design that can be used as a standalone home yet has the flexibility to house something more intricate like a winery or a brewery.
Check out these resources to get inspiration from some popular barndominium floor plans:
It can be difficult for sellers to distinguish between two methods of finding the value of their home: a Comparative Market Analysis (CMA) and a home appraisal. Though they share many similarities, there are key differences in how the two approaches ultimately arrive at a listing price for your home.
The Difference Between a Comparative Market Analysis and an Appraisal
Comparative Market Analysis (CMA)
A CMA is conducted by an agent using their knowledge of the local market in conjunction with information available to them on the multiple listing service (MLS), which contains data on sold homes and market trends. A CMA helps to price the home more accurately, keeping the property competitive in the current market. For those who are thinking of selling their home For Sale By Owner (FSBO), it’s worth noting that you will not be able to conduct a CMA on your own, since, among other things, access to the MLS is exclusive to real estate agents.
Your agent’s analysis accounts for the various factors that influence home prices to arrive at an accurate estimate of your home’s value. A CMA compares your home to others in your area that have either recently sold, are currently on the market, or had previously listed but have since expired, typically using data from the past three-to-six months. Comparable homes, or “comps,” are homes whose characteristics are similar to your own, such as the housing type, condition, and the square footage and property size. A thorough CMA will provide information on what homes in your area are selling for, how long they were on the market, and the difference between their listing and sold price, and will list a low, median, and high selling price for your home.
Appraisal
The main difference between an appraisal and a CMA is the personnel involved. Whereas a CMA is conducted by a real estate agent, an appraisal is carried out by a licensed appraiser on behalf of the bank. Once a buyer applies for a loan to purchase your home, the bank will order an appraisal of the property. Though appraisers use methods of comparison similar to an agent’s CMA, unlike a real estate agent, bank appraisers have no vested interest in the sale of the home. The goal of an appraiser’s visit is to determine your home’s fair market value to ensure that the bank isn’t lending more money to the buyer than needed.
For more resources on the selling process and to use our free home value calculator, visit our comprehensive selling guide here:
Featured Image Source: Getty Images – Image Credit: kate_sept2004
Flooring is a key component of a home’s design and can often be the centerpiece of a renovation or remodel. Because it covers such a large surface area it will significantly impact the look and feel of your home, so choosing the right material can be stressful. Weigh your options before making a decision. Learn about the different types of material, assess your budget, and form a plan for installation.
How to Choose the Best Flooring
Room Function
How you spend time in any given room will help you decide which type of flooring is best. In your home office, choose the flooring that best accommodates your working needs. Carpet can be comforting while hardwood and laminate are more durable. Entryways, mudrooms, playrooms, and pet rooms will undoubtedly see their fair share of dents, cracks, and dings, so a resilient material is best for these areas. Consider materials that are strong and easy to clean, such as tile. The kitchen is a high-traffic area that is constantly being cleaned and re-cleaned. Explore solid yet easy to clean materials like vinyl, hardwood, and ceramic tile. If these common flooring materials aren’t to your liking, certain alternative flooring options may appeal to you, including bamboo, cork, and concrete.
Budget
Your budget will be a major deciding factor in which type of flooring you ultimately install. Are you replacing your flooring as part of a larger, full-scale remodel? If so, there may be other projects that will warrant a larger share of your budget. Are you looking to make the flooring a selling point of the home? If so, you’ll likely dedicate more money towards the material and installation. Talk to your agent about which types of flooring have the best resale value and what buyers in the area are looking for. For example, if you live in a climate that experiences cold temperatures, heated flooring may give your home a competitive advantage over other listings when it comes time to sell.
Installation
There are two approaches to a flooring installation: DIY or professional. Installing your flooring on your own is a great way to save money on the project, but it’s also a lot of added responsibility. Before making the decision to install on your own, understand the risks involved with the project and the time it will take to complete it. Vinyl and laminate flooring tend to be easier to install DIY. Hiring a professional will come with increased costs, but you’ll be paying for higher quality work that will increase the value of your home. More involved flooring installations such as hardwood are usually best handled by a pro.
Style & Color
After your budget has been set and you’ve decided on how to install, then comes the fun part. When choosing the style of your flooring, think about how it will interact with the space. Will the flooring be the focal point of the space? Will it compliment the features of the room and the surrounding décor? Knowing these answers will help to sort out the fine details, such as the specific shade of tile or the grain of wood.
Maintenance
At the end of the day, you may simply be looking for flooring that’s easy to take care of. In that case, explore common low-maintenance materials like vinyl and laminate. Vinyl flooring—whether it’s tile, sheet, plank, or peel-and-stick—requires little care compared to high-maintenance flooring such as solid or engineered wood.
For more information on home design, visit our Design page. To learn more about interior design, visit our Design Styles page.
Summer is the season for spending long days in the yard, taking dips in the pool, and sitting in the shade to beat the heat. In the midst of these sun-filled adventures, though, lies the potential for heat waves, smoke, and wildfires. Every homeowner should be ready for these emergencies as well as the damaging effects they can have on their home. The following information will help you prepare your home for the hottest days of the year.
Preparing Your Home for Summer Heat
As temperatures soar, it’s important to make sure that your methods of cooling your home are as effective as possible. Adding insulation may not be the first thing that comes to mind when prepping your home for the summer heat, but it will help prevent cool air from leaking outside and hot air from entering. If your insulation is out of date, now is the time to make replacements as needed. Windows are another culprit for air leaks, which commonly form between the window frame and the frame of the house. Fill these cracks with caulking between the frame and the exterior siding. If your windows are exposed to prolonged periods of direct sunlight, consider placing an awning or screen shades above the exterior side to provide some relief from the radiating heat.
Air conditioning can be a lifesaver during summer. There are two main options when it comes to air conditioning: either a window unit or central cooling. Window units are the least expensive option and offer portability. It’s important to choose a unit that is the right size for your home or the room you’re trying to cool. One that’s too big will quickly cool your space and then shut off completely. This can increase your energy bills and put unnecessary wear on the unit. An undersized unit simply won’t cool your home and will constantly run to try to reach the target temperature. With central air conditioning, homeowners can expect much higher startup costs. But once installed, central AC provides short- and long-term comfort and adds to your home’s value.
Summer is a good time to check your HVAC unit’s air filters. Turn the unit off before performing any maintenance. If any devices that give off heat are close enough to the thermostat that regulates the AC, they could generate an incorrect reading, which could throw off your air conditioning efficiency. For maximum efficiency, place these devices away from the thermostat.
Preparing Your Home for Wildfires
The first step in preparing your home for wildfires is to have an emergency plan. Make sure everyone in your household is aware of what to do in the event of a wildfire. Pack an emergency kit to bring with you in the event of an evacuation. For homeowners who live outside a fire zone, consider buying an air purifier to protect yourself from smoke.
To give yourself the best chances of keeping wildfires from getting too close to your home, keep all flammable objects away from the house, preferably at least thirty feet. Clear your gutters of debris such as leaves, twigs, sticks, and the like. These materials are tinder for fire. Any flammable vegetation within five feet of the home should be cleared away, and any trees that overhang close to the home should be cut back to a distance of ten feet. Remove any dead plants or vegetation from your yard and keep your lawn short. Install mesh screens over exterior vents to prevent embers from entering your home.
This may seem like a daunting list, but these preparatory measures are worth it to protect your home and loved ones this wildfire season. Once you’ve taken these steps, you can enjoy your summer days at home knowing you’re prepared.

 Facebook
 X
X
 Pinterest
 Copy Link


")


