
 Facebook
 X
X
 Pinterest
 Copy Link
The following analysis of select counties of the Montana real estate market is provided by Windermere Real Estate Chief Economist Matthew Gardner. We hope that this information may assist you with making better-informed real estate decisions. For further information about the housing market in your area, please don’t hesitate to contact your Windermere Real Estate agent.
Regional Economic Overview
The slowing job growth trend that started in the summer of last year continued into the fall, with employment increasing only 1.3% year over year. With only 6,500 jobs added over the past 12 months, annual job gains are now below 10,000, a pace we have not seen since the pandemic started having an impact on the job market. Regionally, the picture was the same: all metro areas added jobs but at a far slower pace. Montana’s unemployment rate in November was 2.9%, matching the level of the year prior. In the metro areas covered in this report, the lowest jobless rate was in Billings at 2.1%, followed by Missoula at 2.2%, and Great Falls at 2.5%.
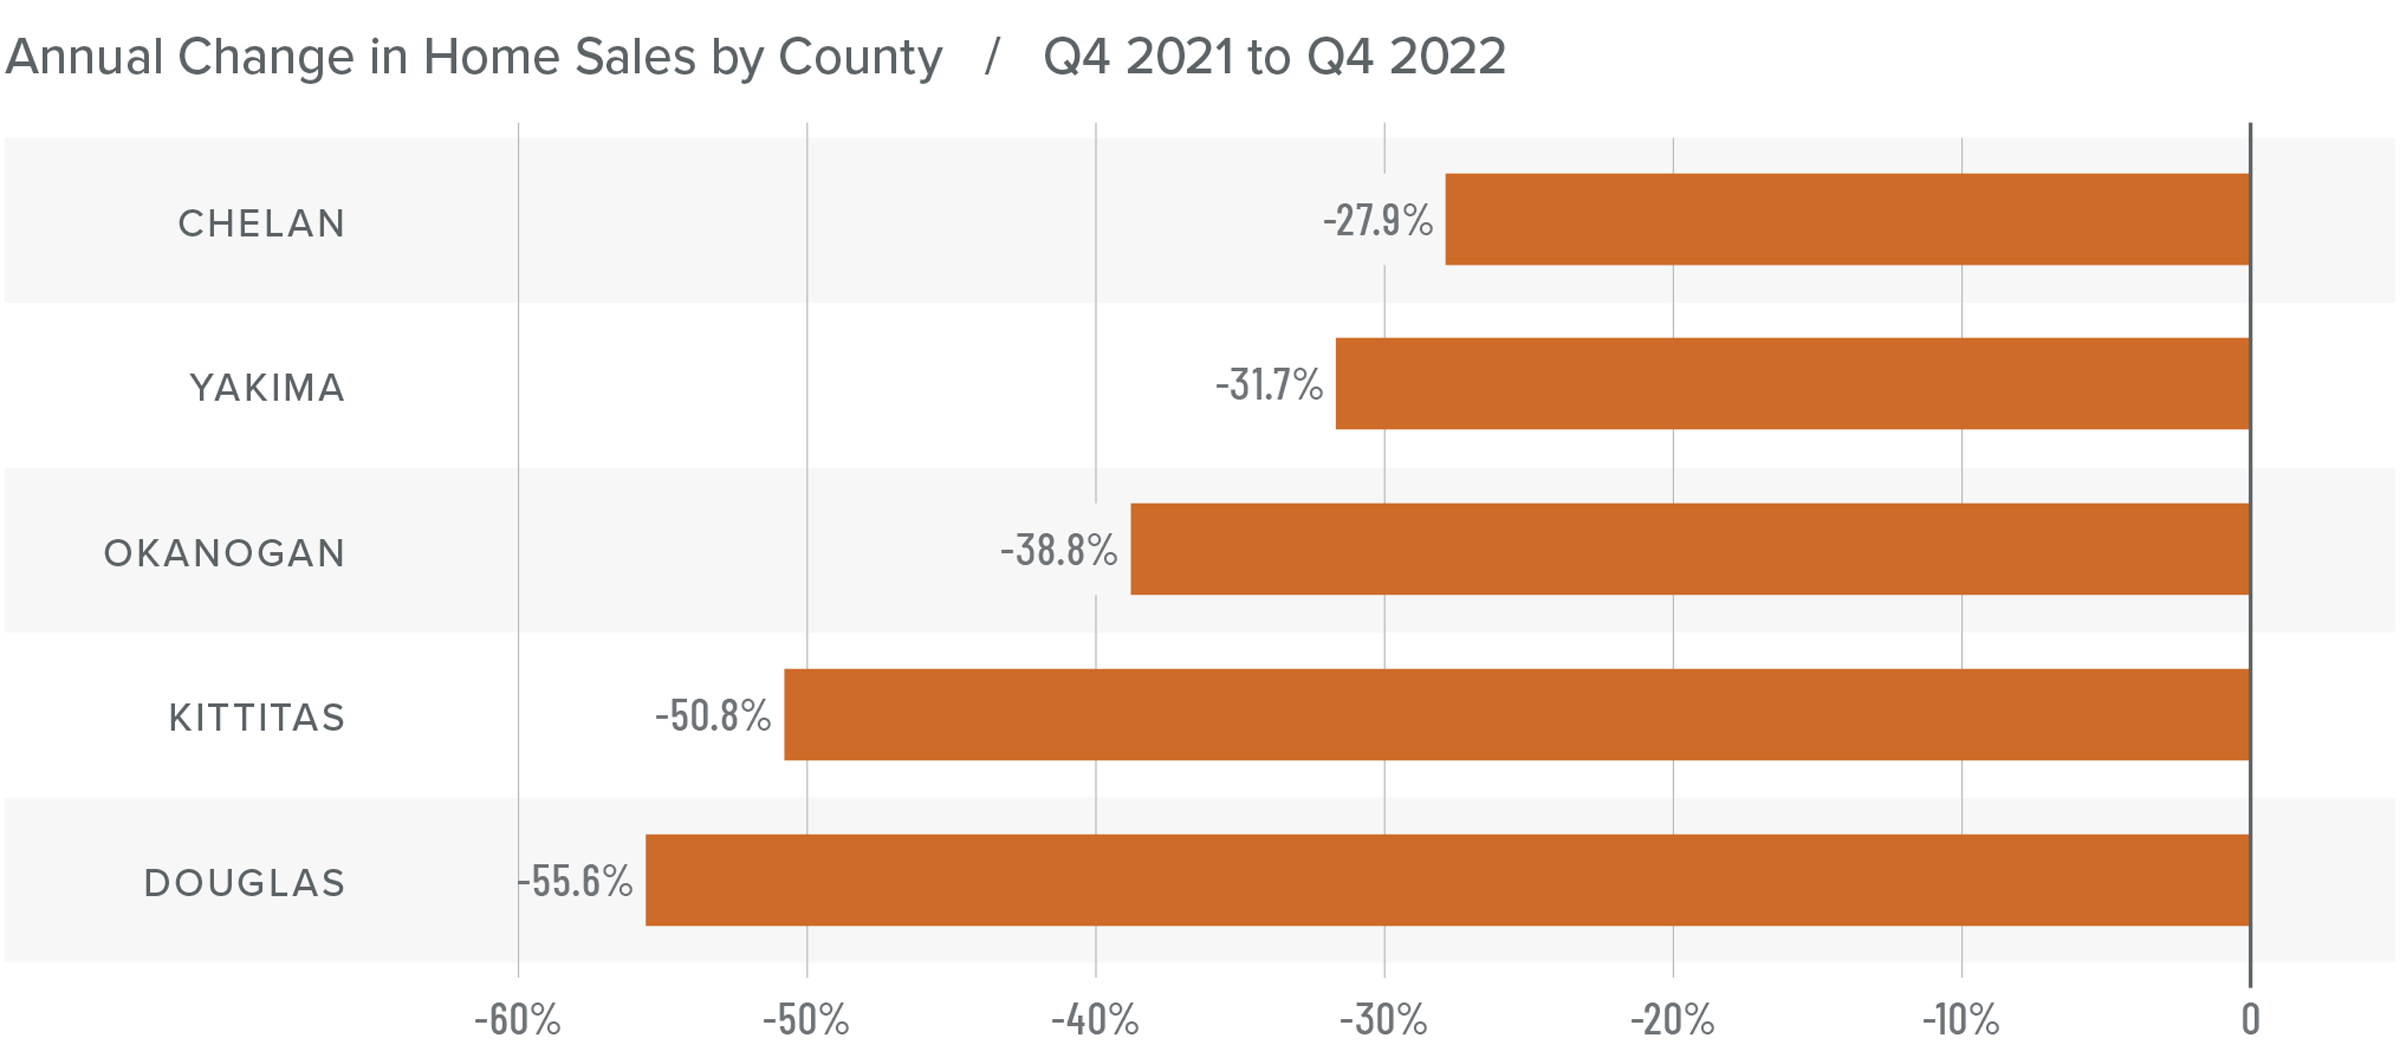
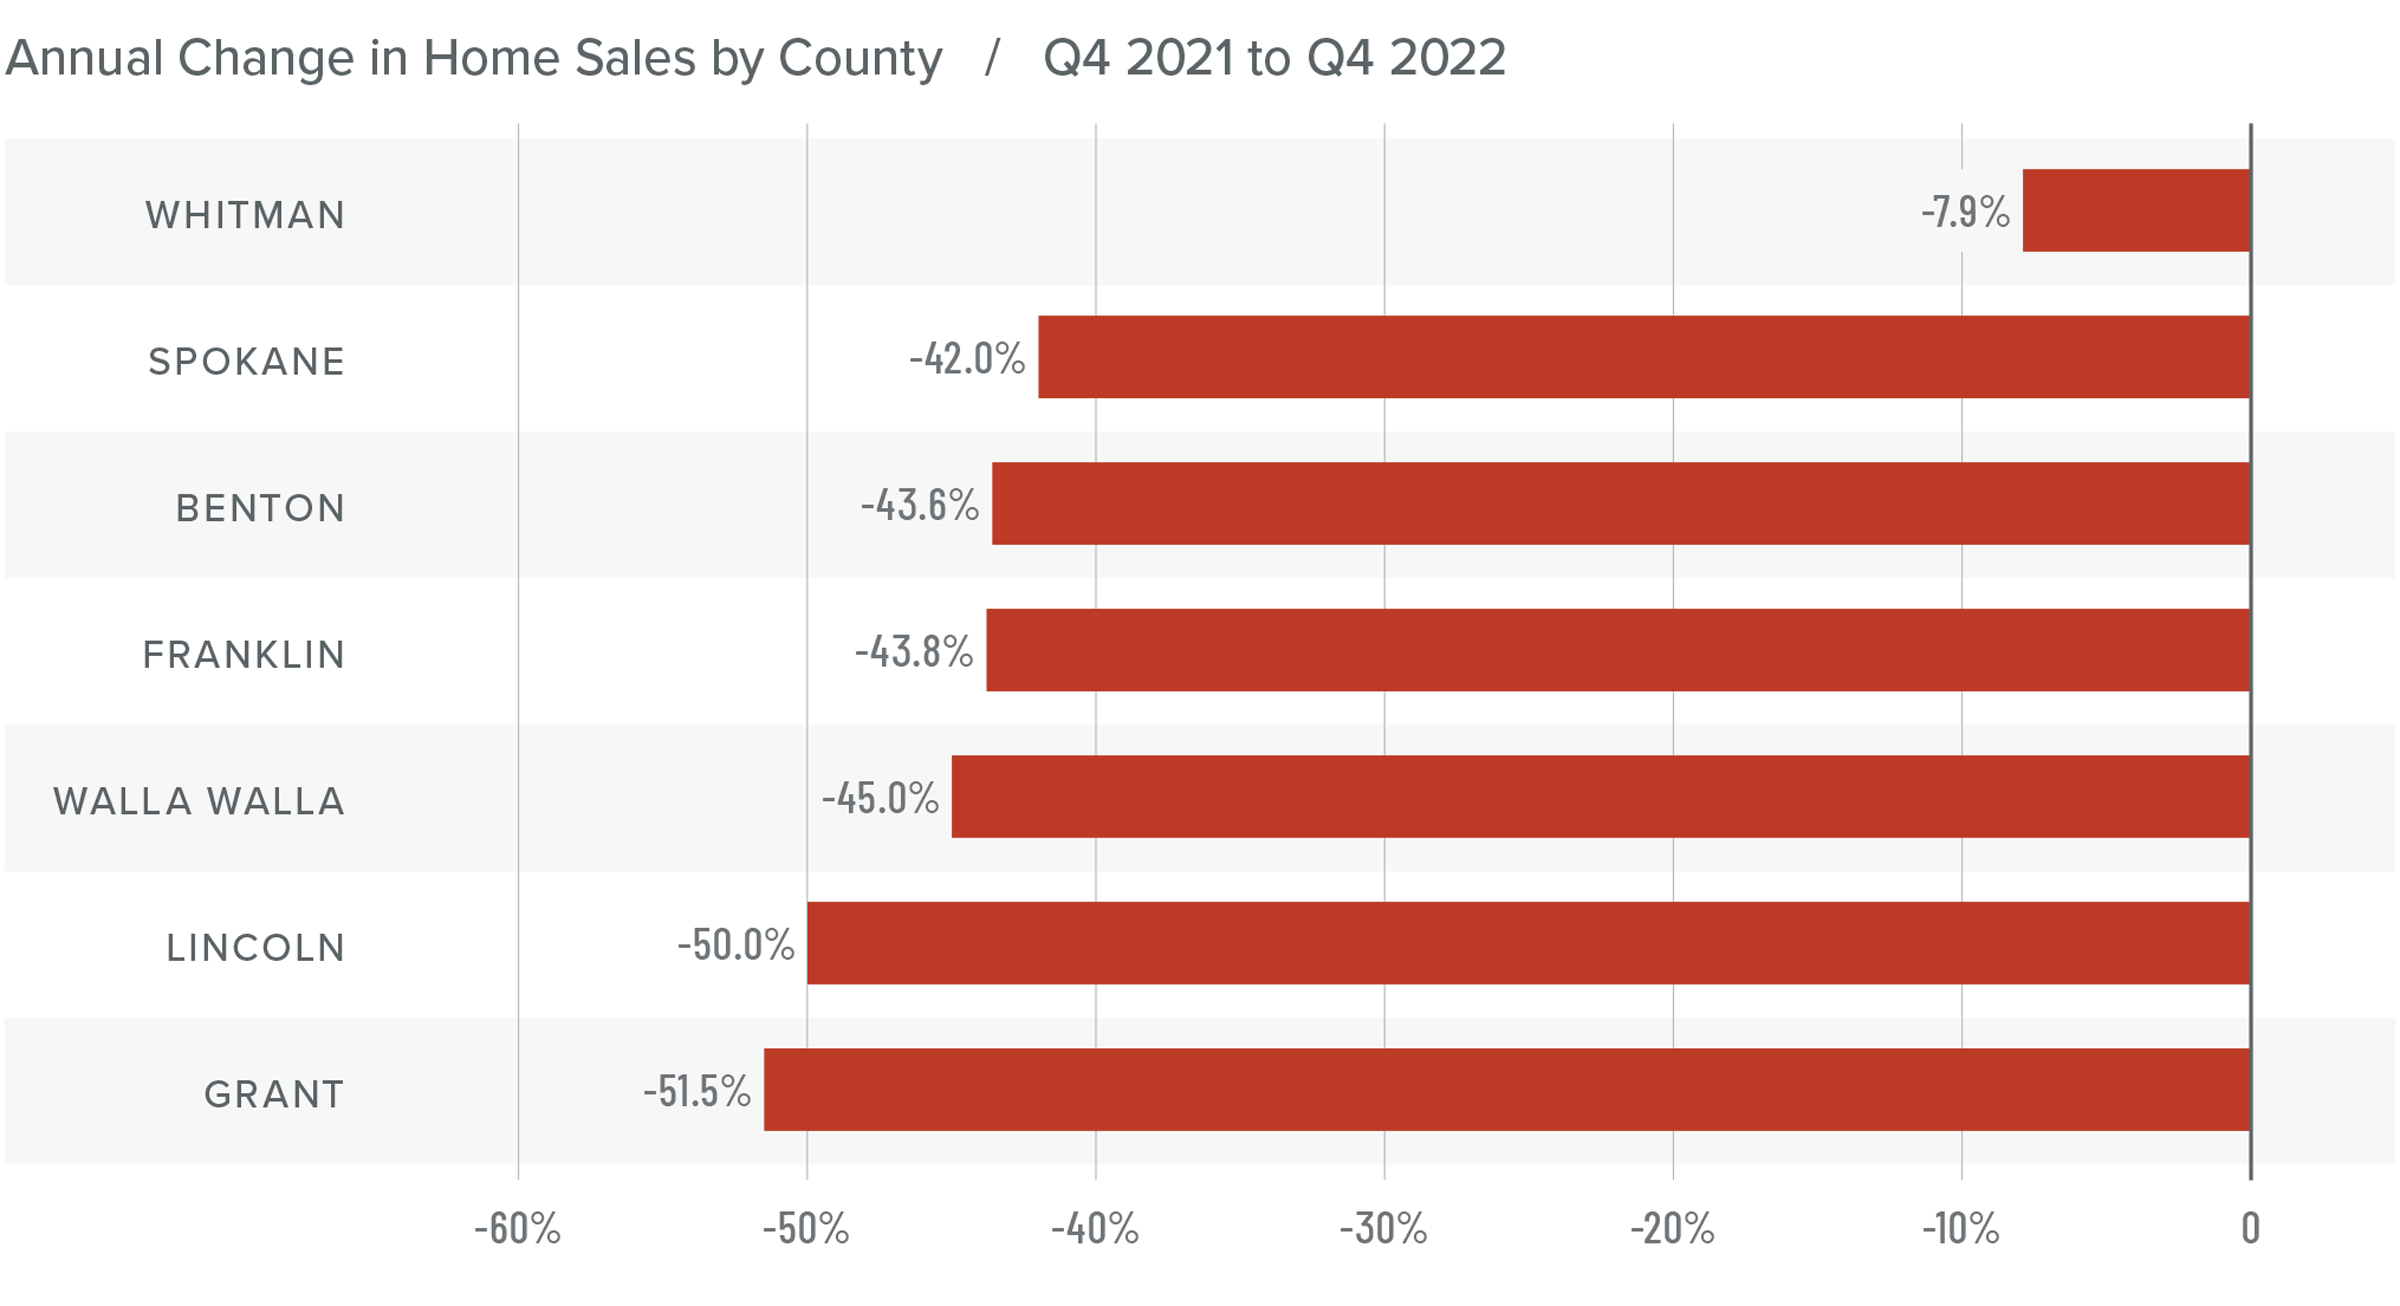
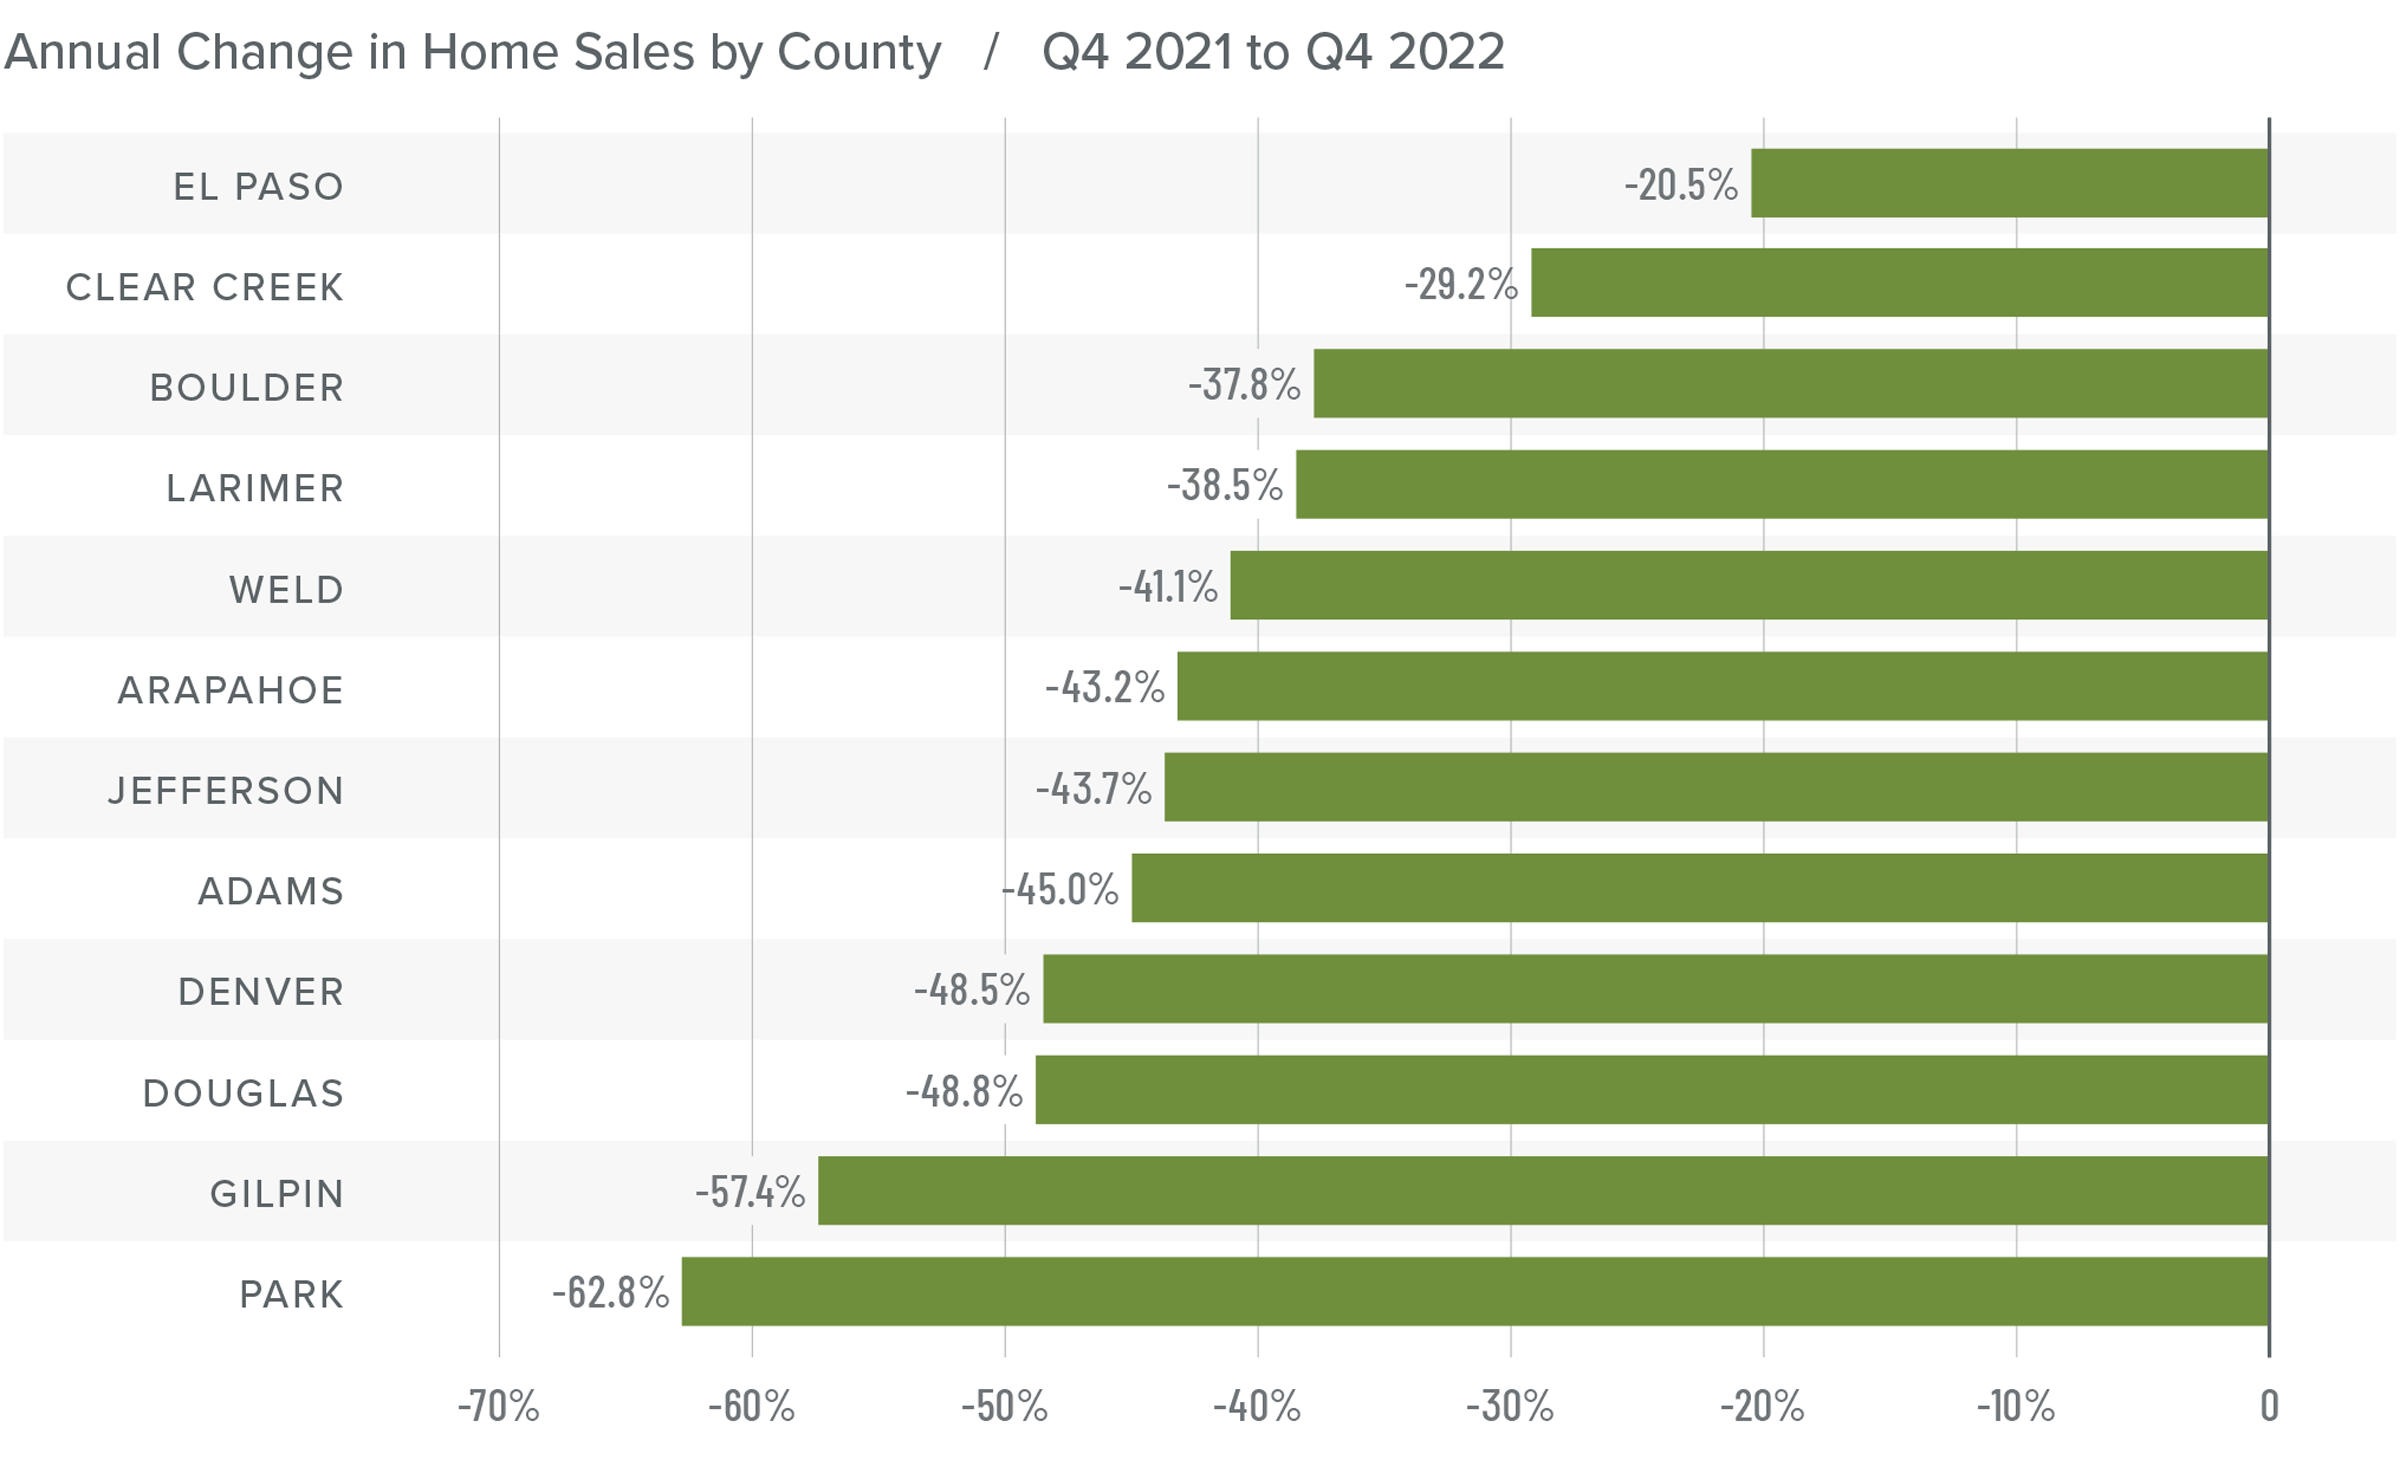
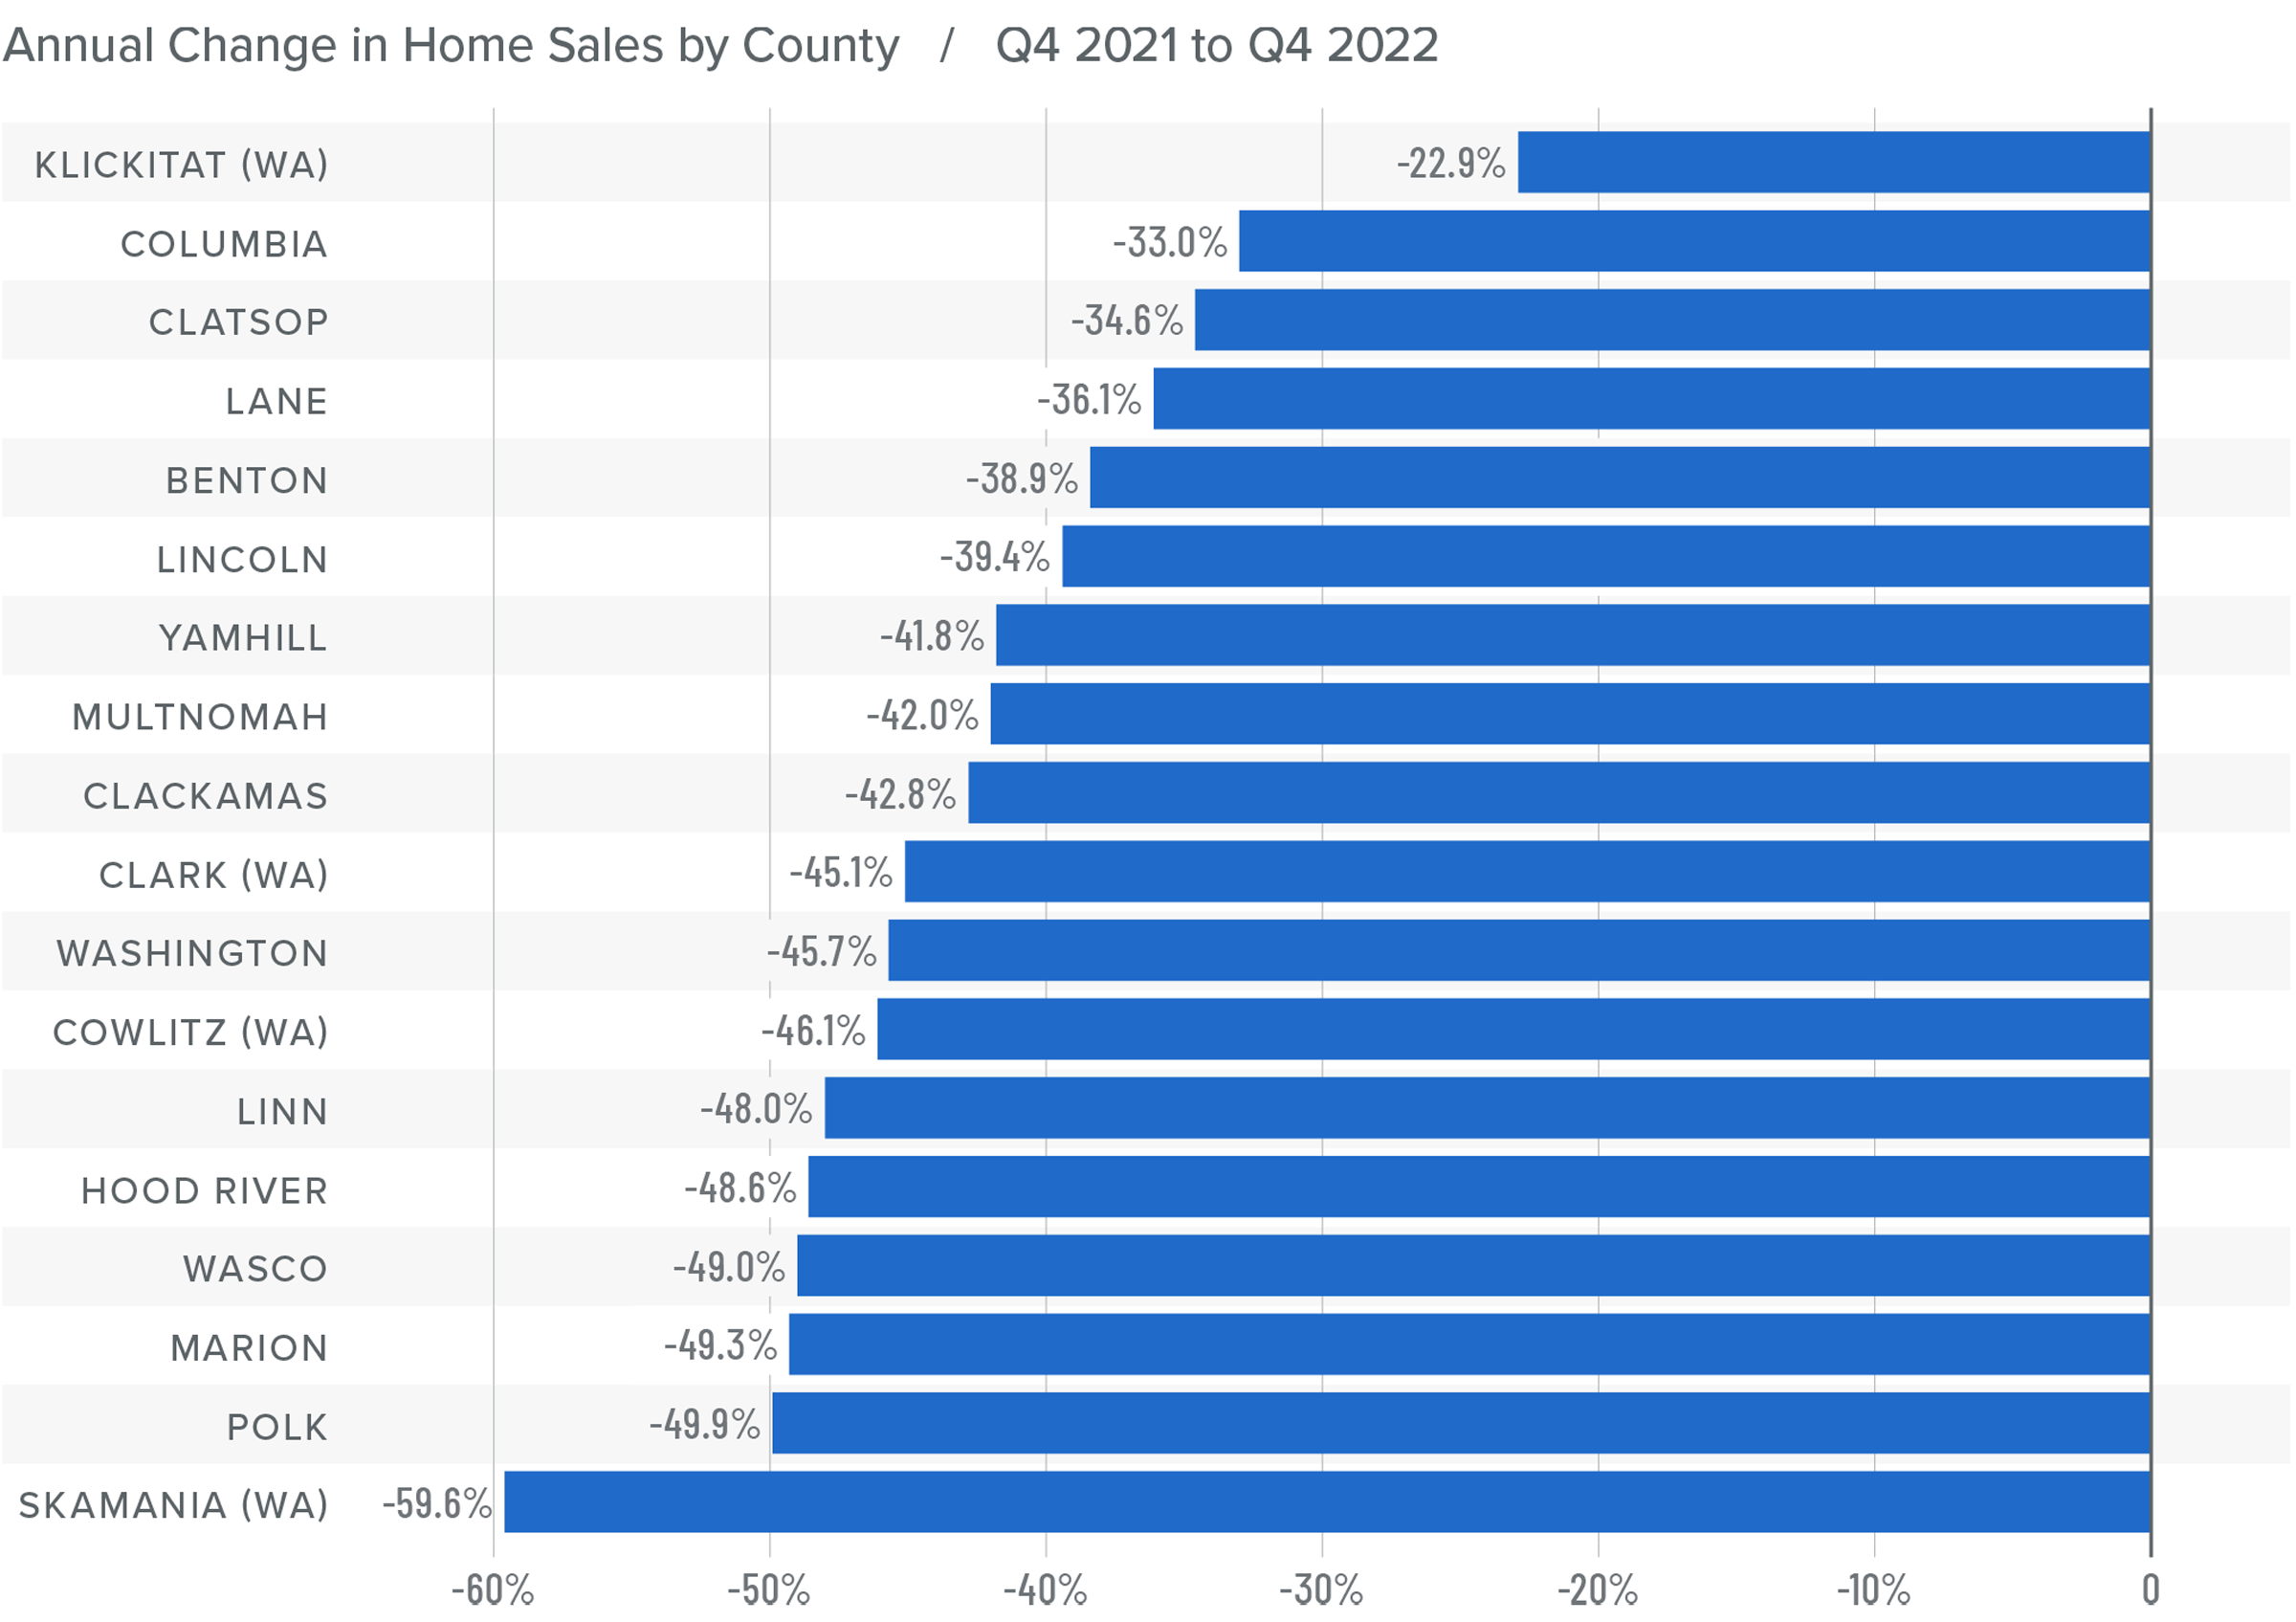
Montana Home Sales
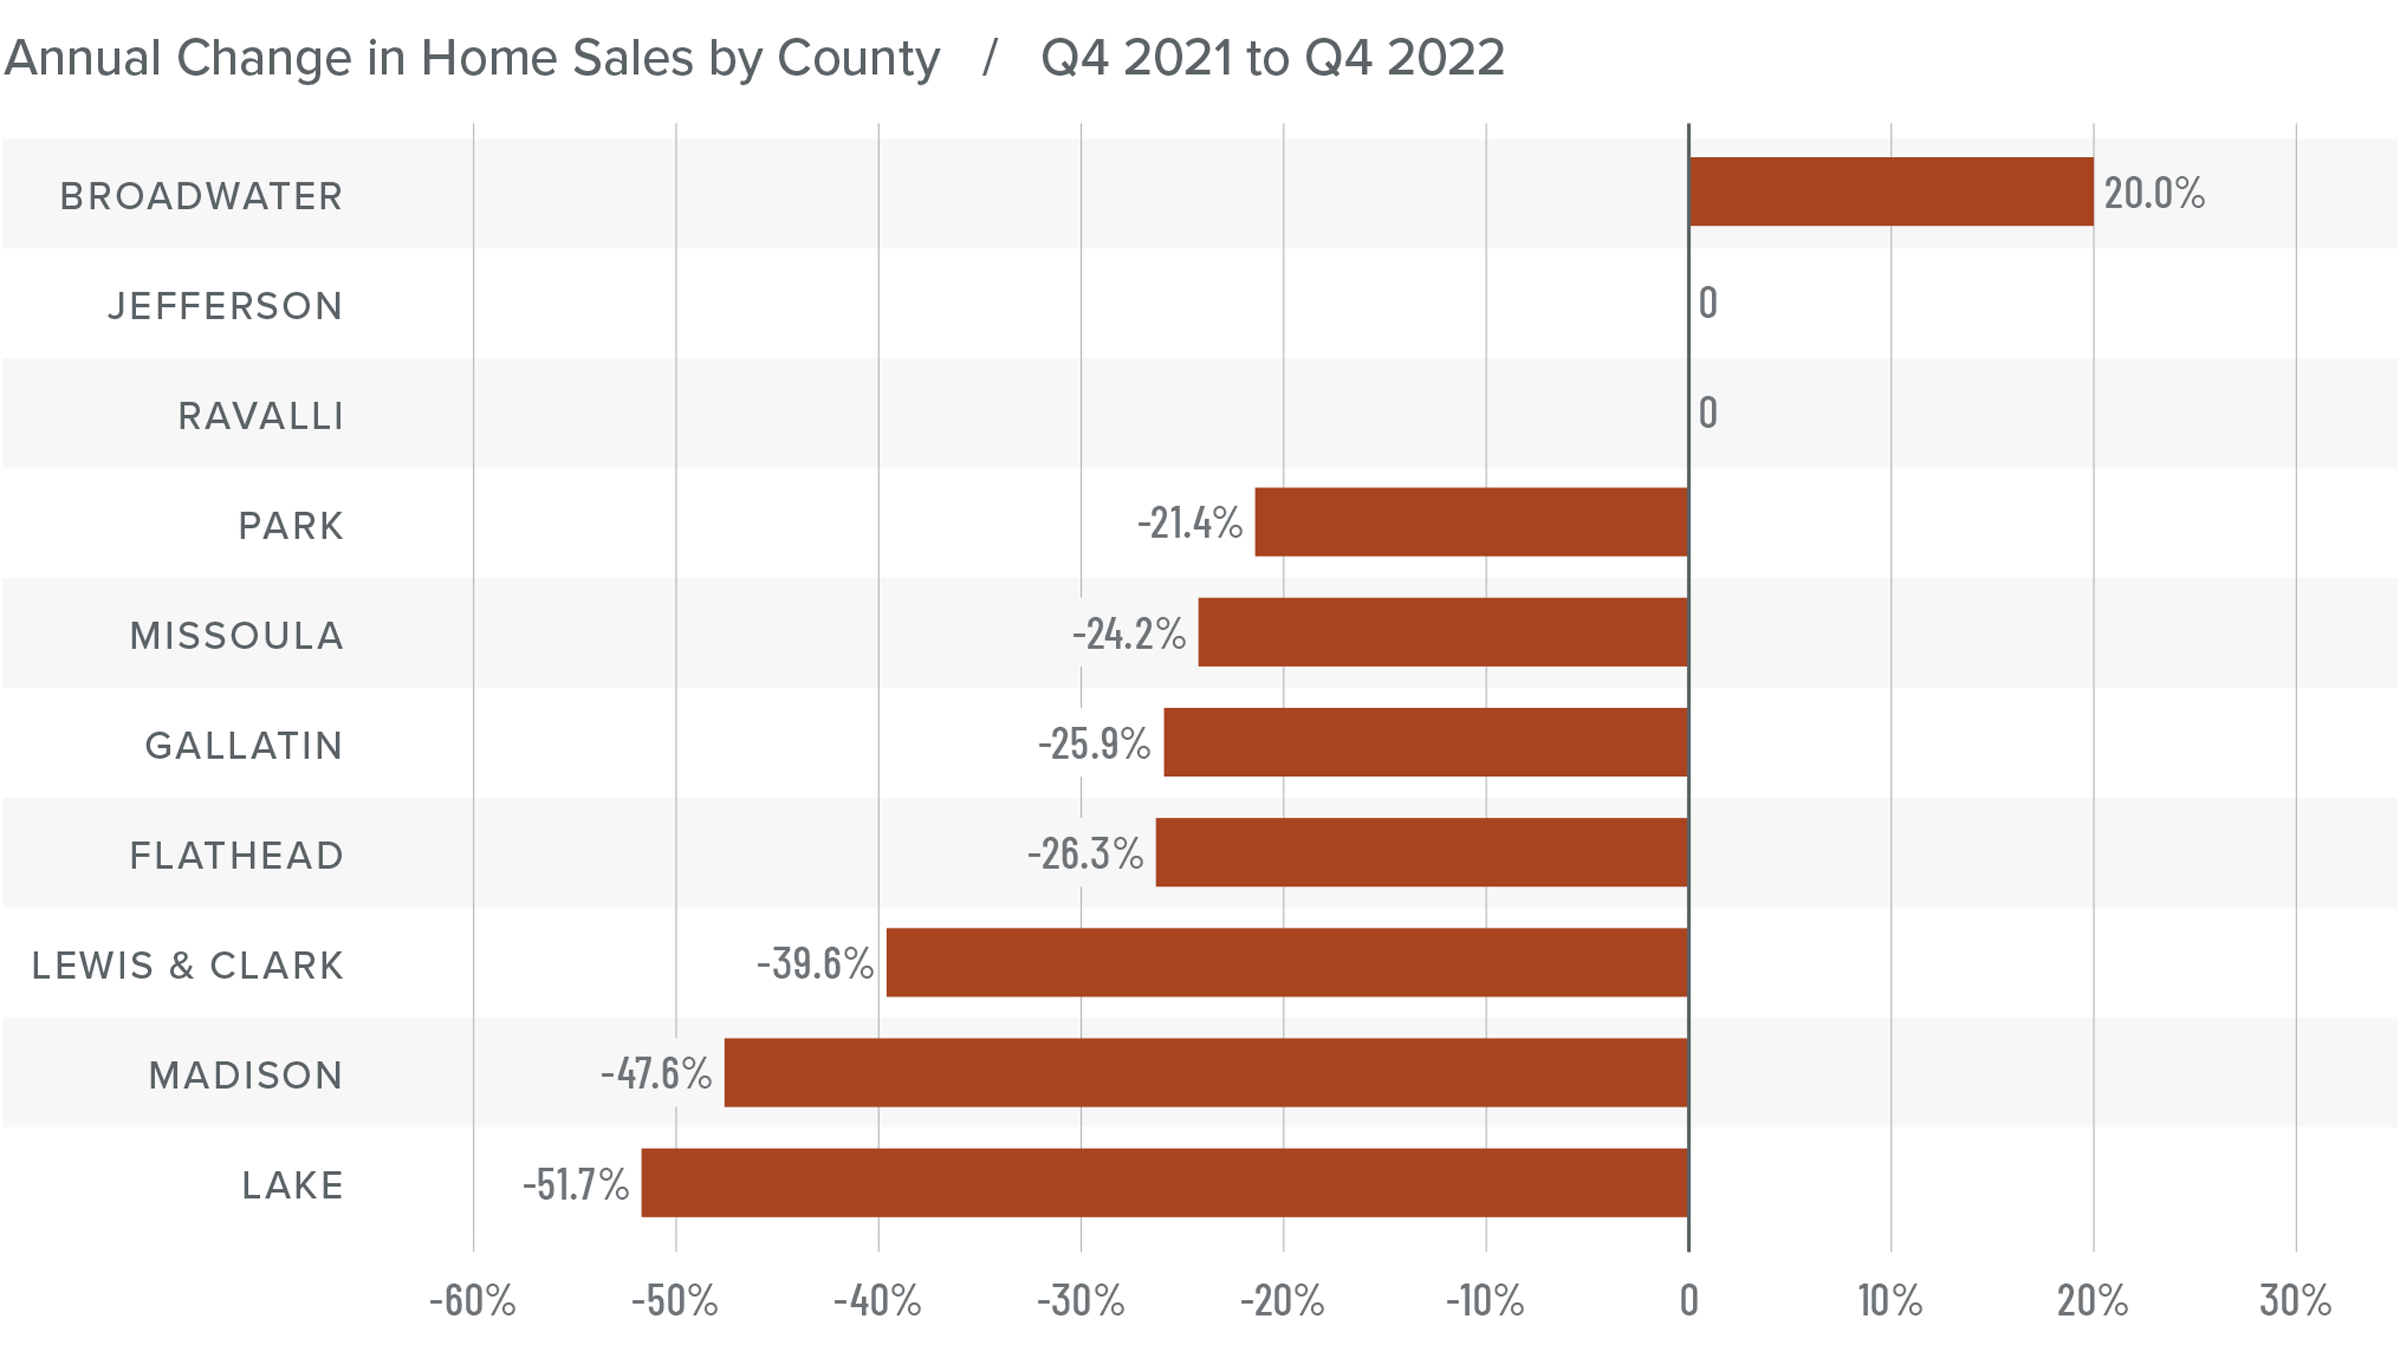
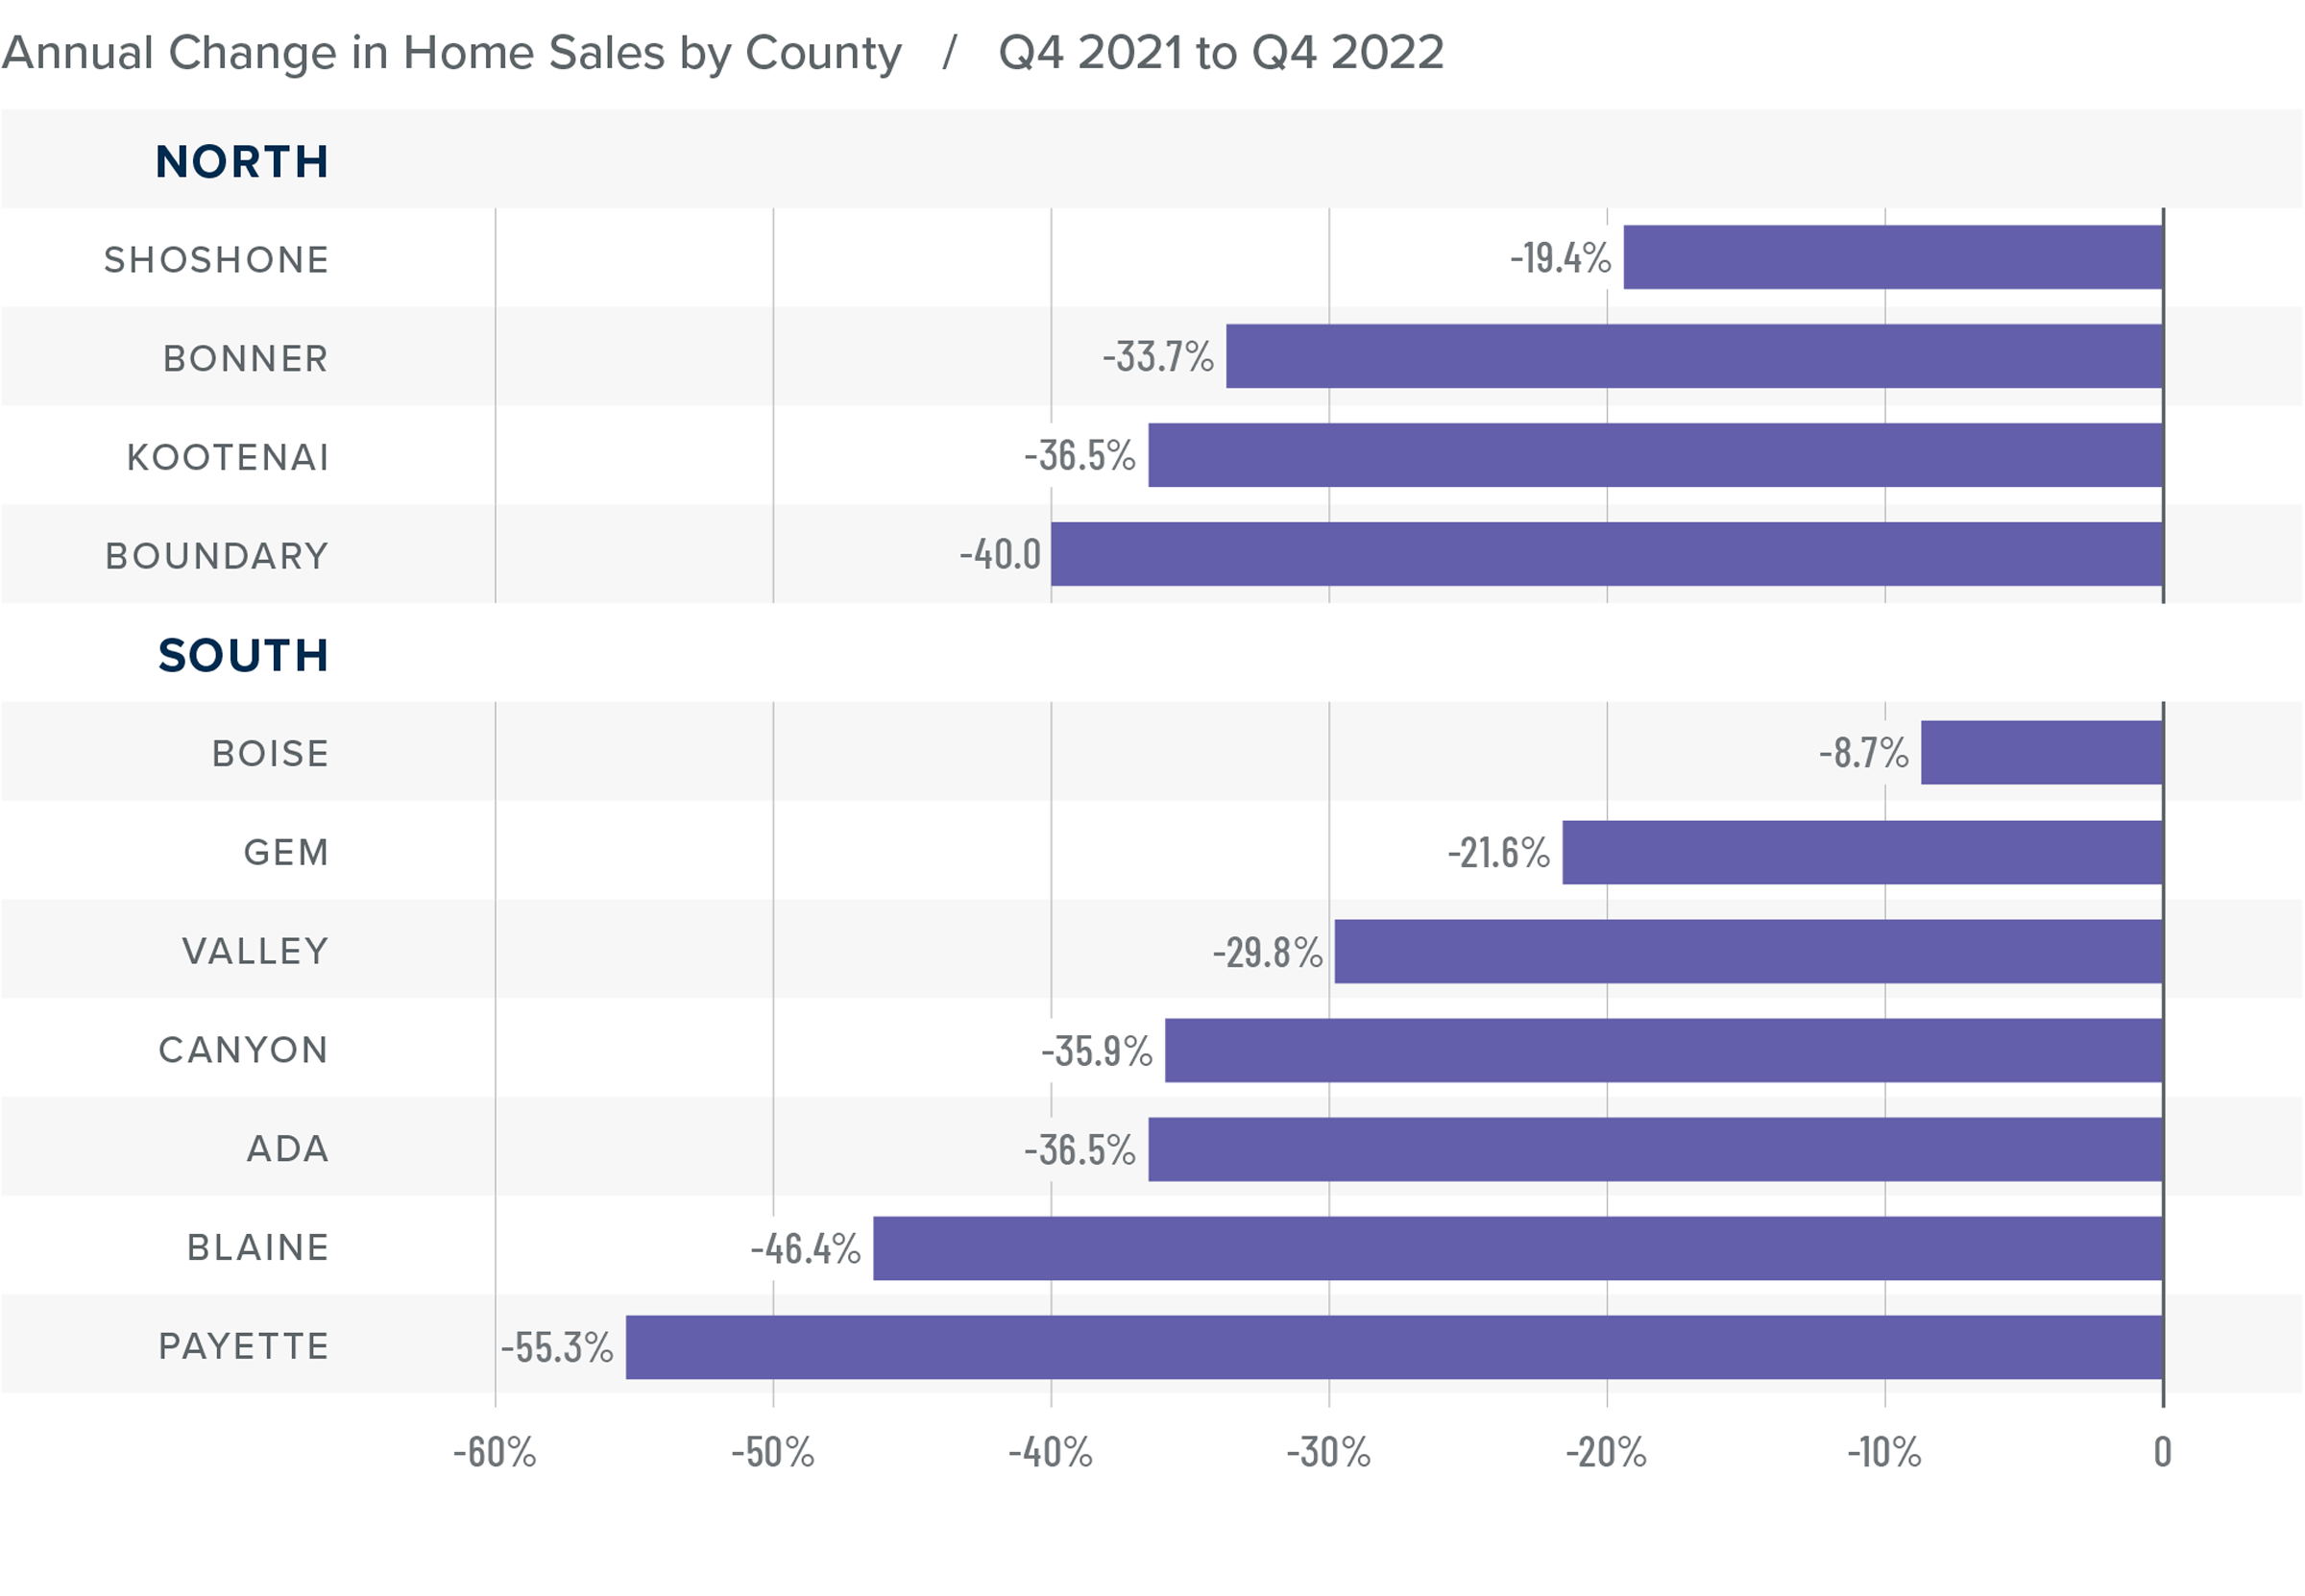
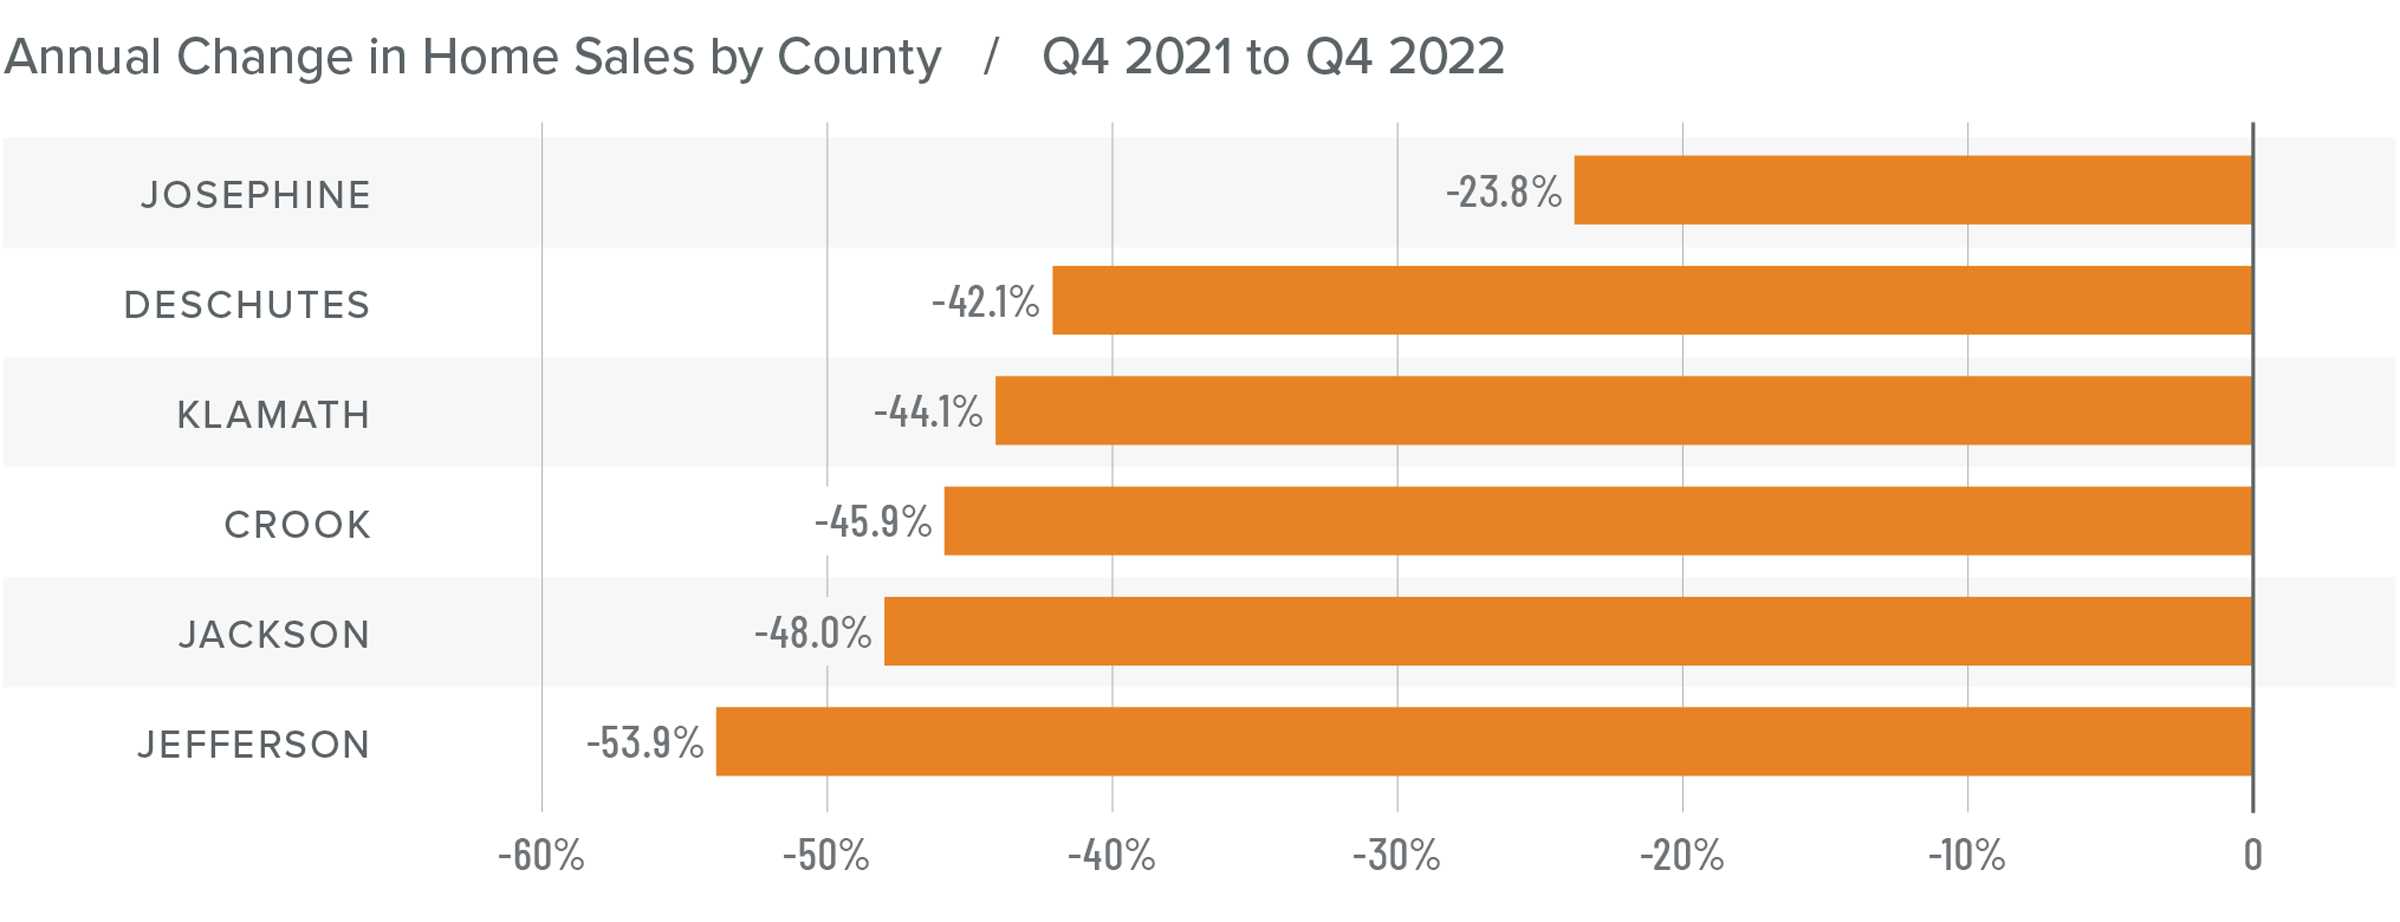
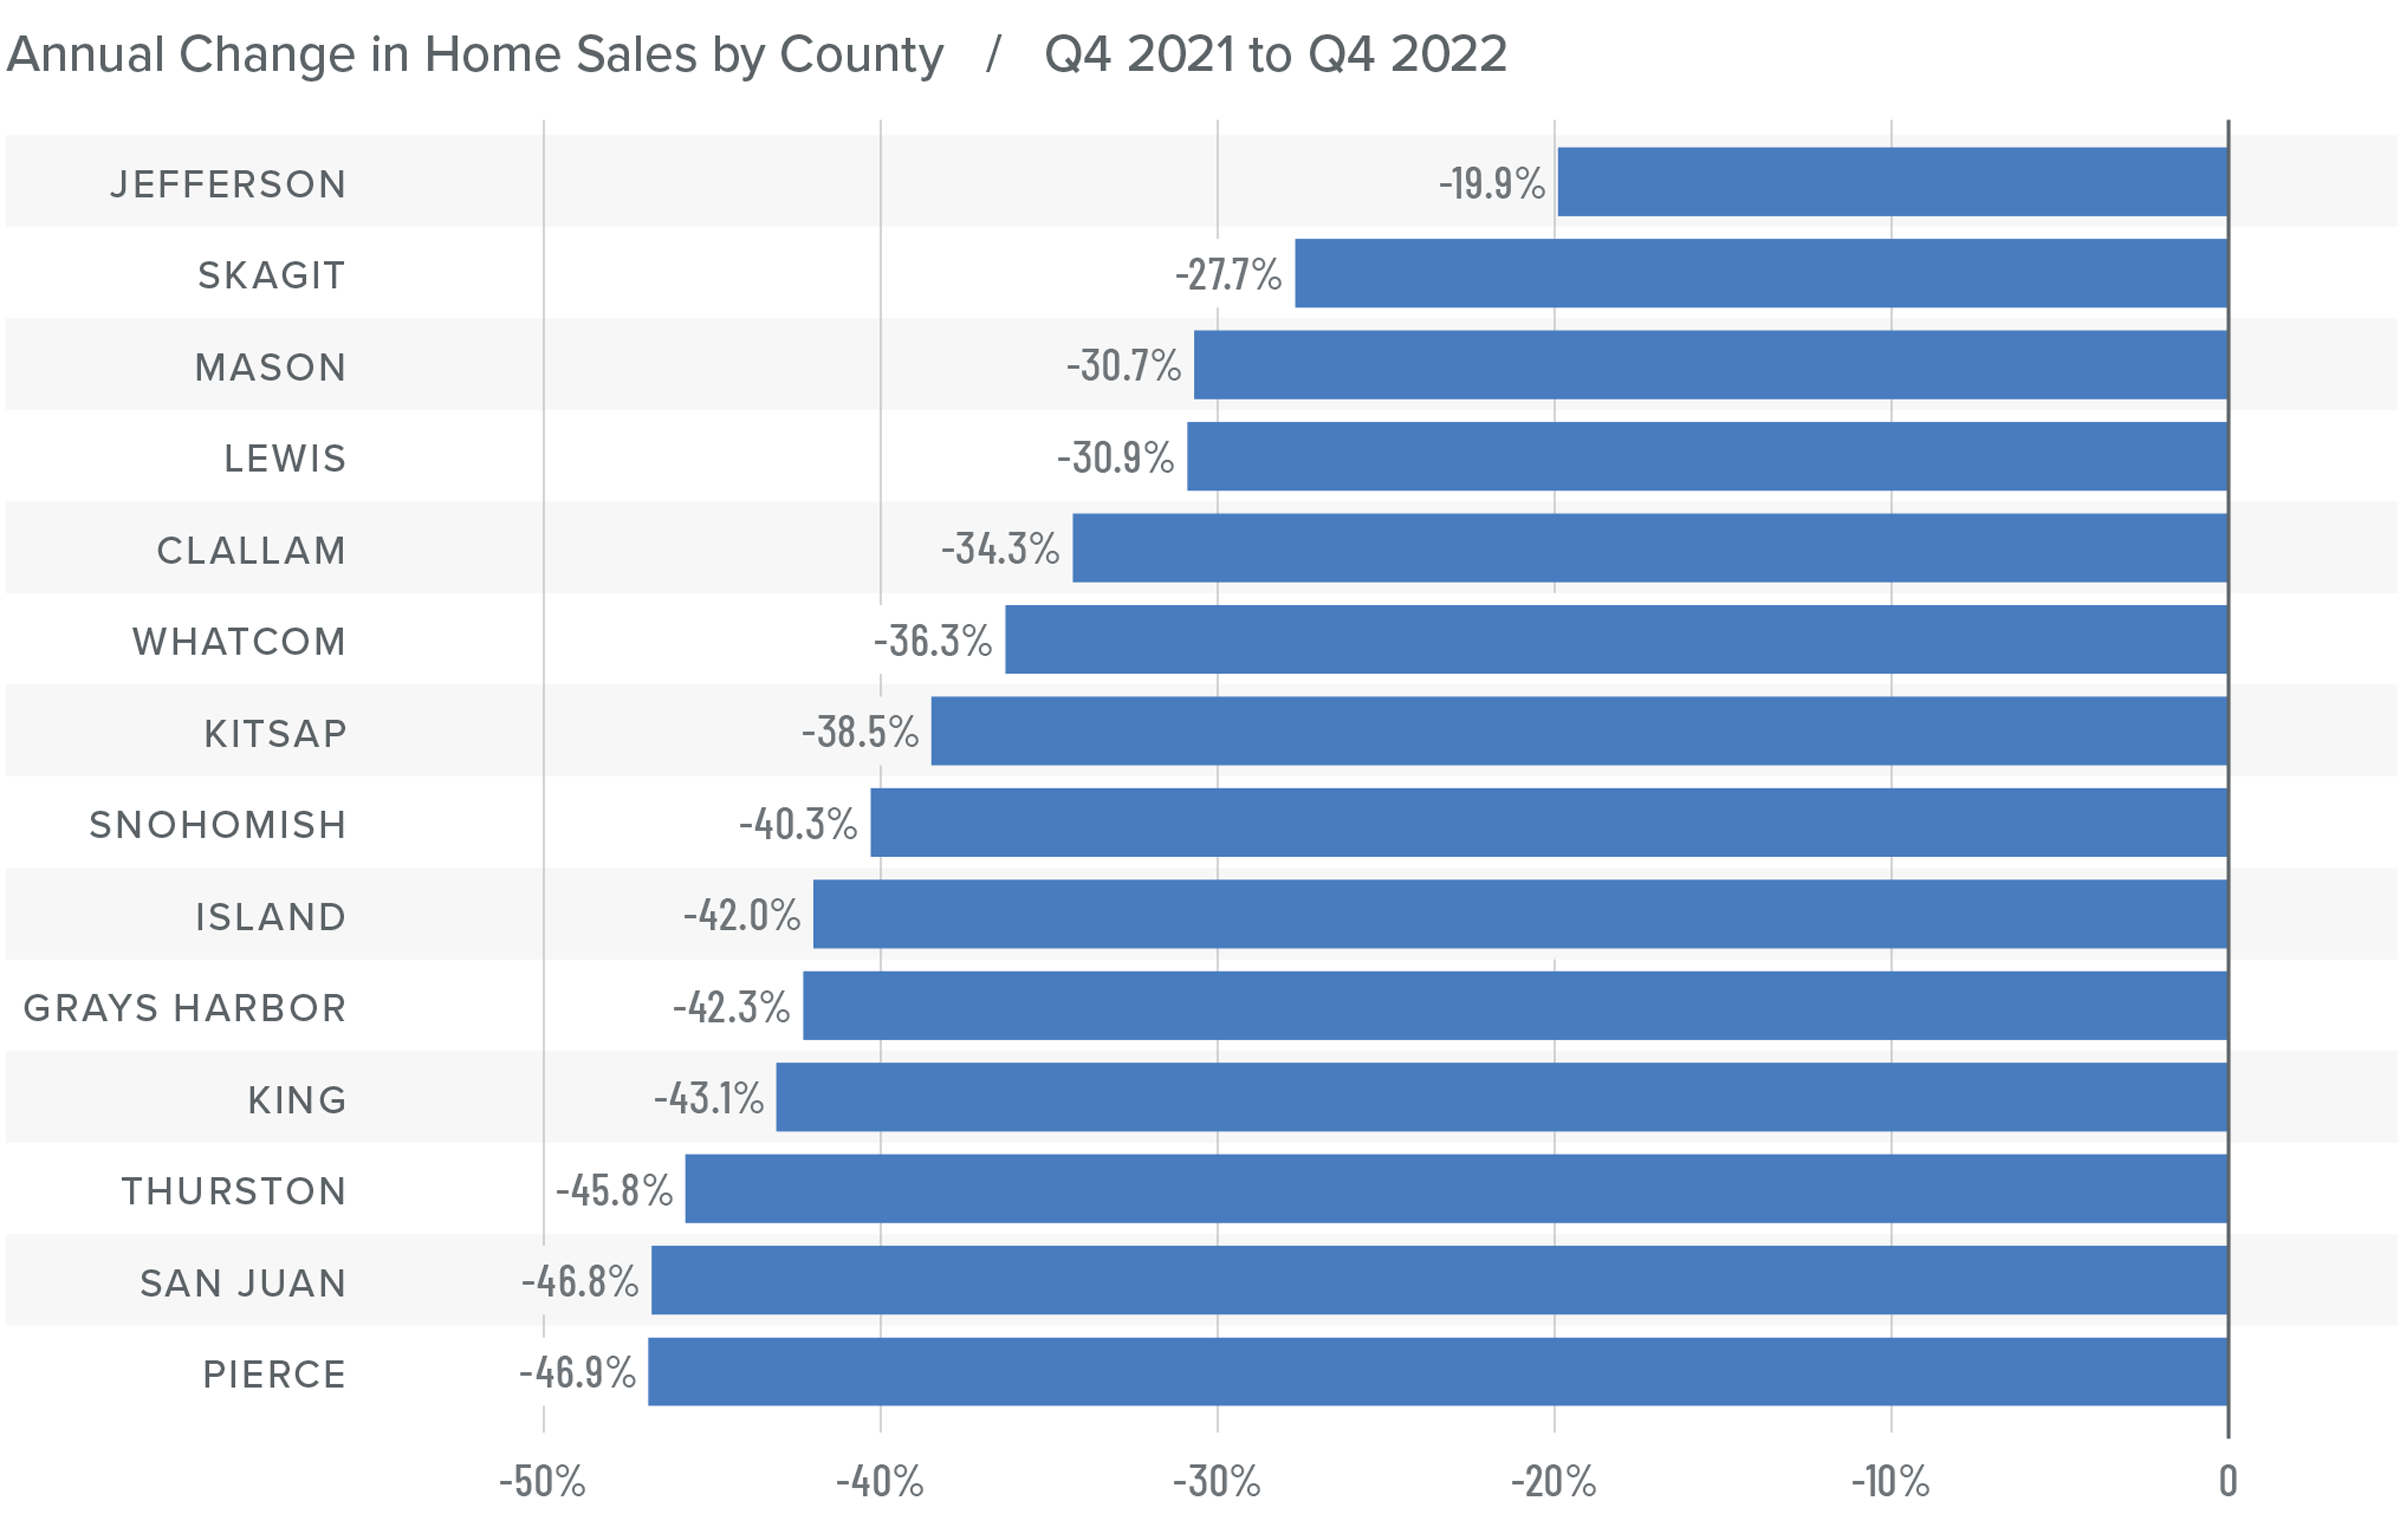
❱ In the final quarter of 2022, 1,203 homes sold in the counties covered by this report. This was a 27% decline from the fourth quarter 2021 and down 40.5% compared to the third quarter of 2022.
❱ Listing activity was 19.3% lower than the same period the prior year and 26.1% lower than in the third quarter. Although a drop in listings is expected as the region enters the winter months, the decline from a year ago was unexpected.
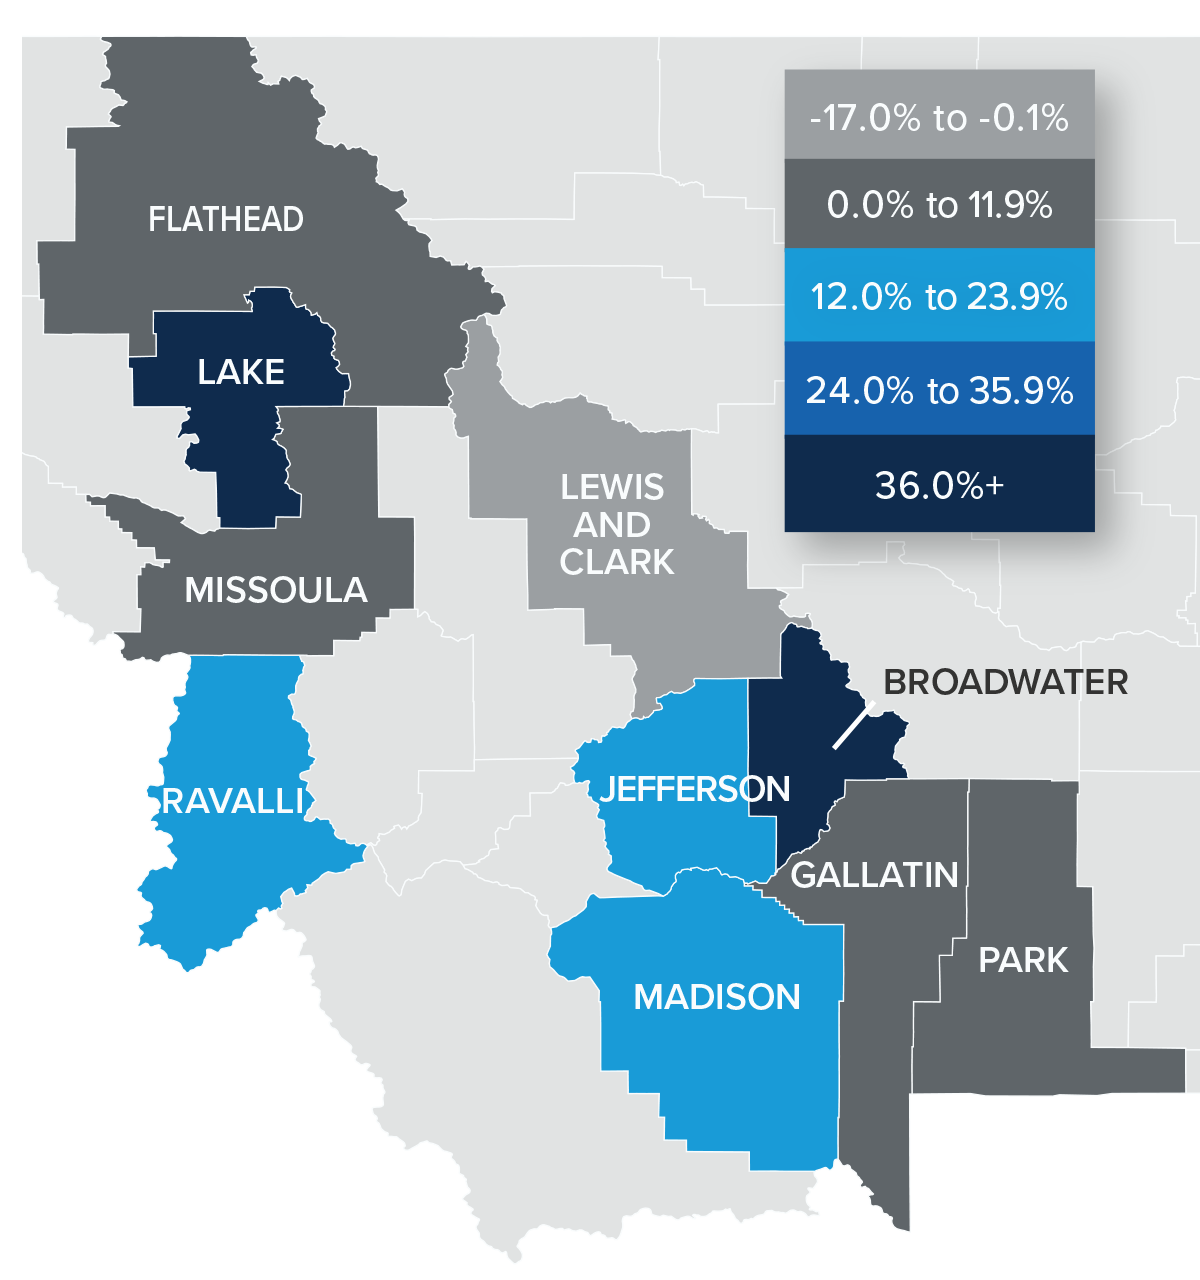
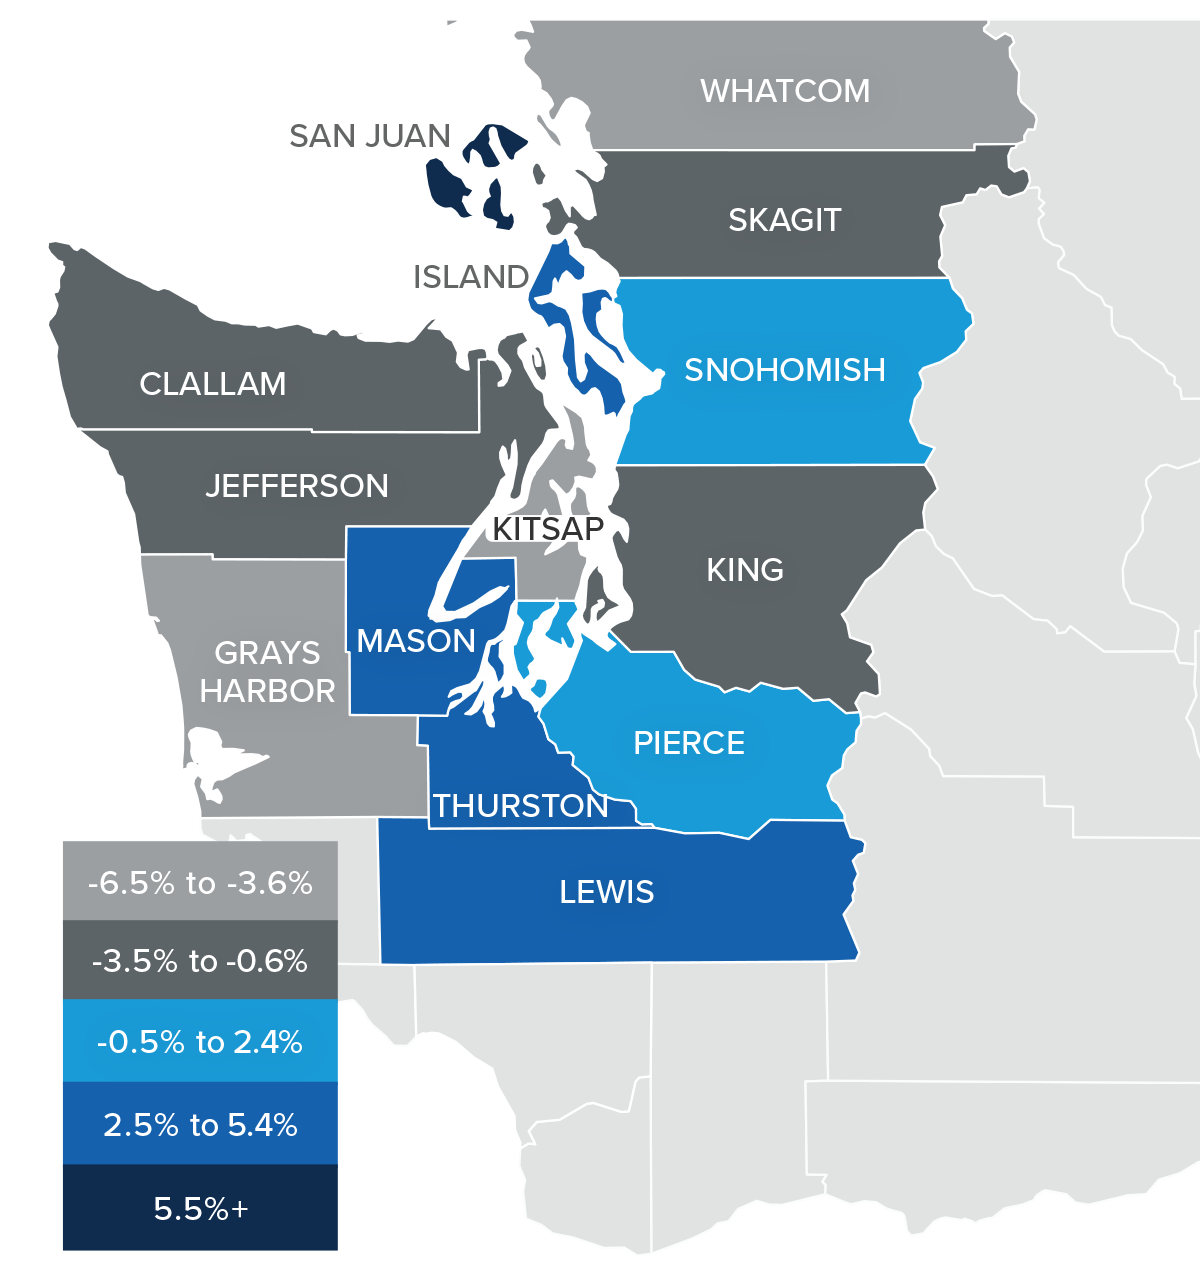
❱ Year over year, sales increased in Broadwater County, were flat in Jefferson and Ravalli counties, and fell in the balance of the markets included in this report. Compared to the third quarter of 2022, sales rose in Broadwater, Jefferson, and Madison counties but fell in all other markets.
❱ Pending sales fell 52.8% from the previous quarter. This may be a function of lower supply levels, but I am noticing that listing prices are starting to pull back in some areas. Higher mortgage rates may have started to affect prices.
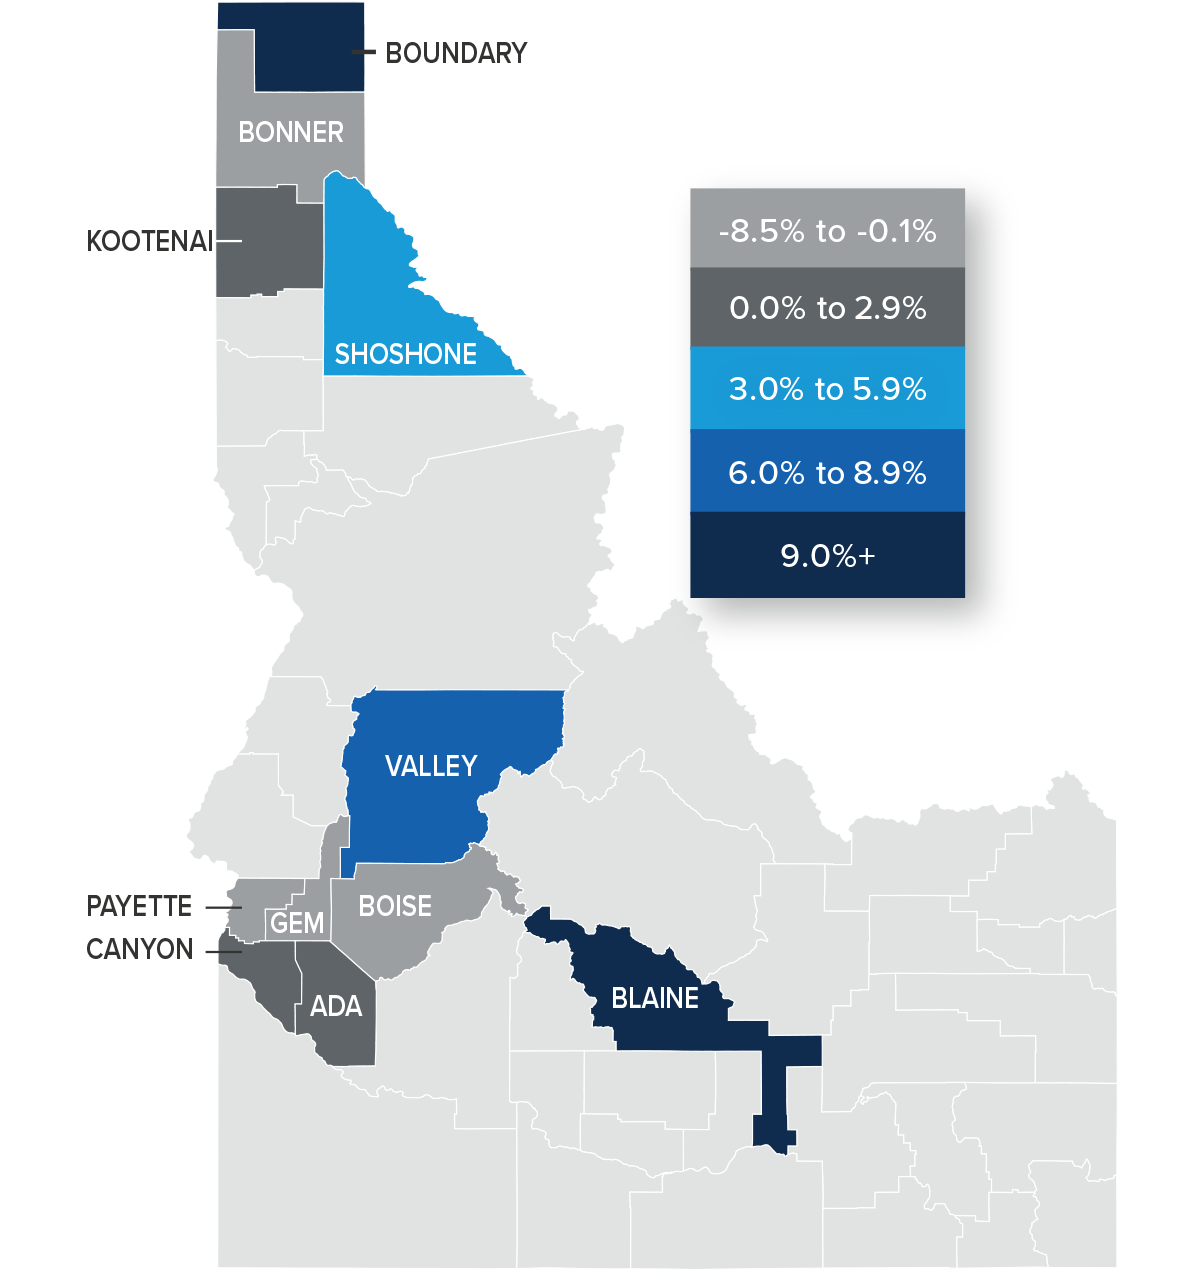
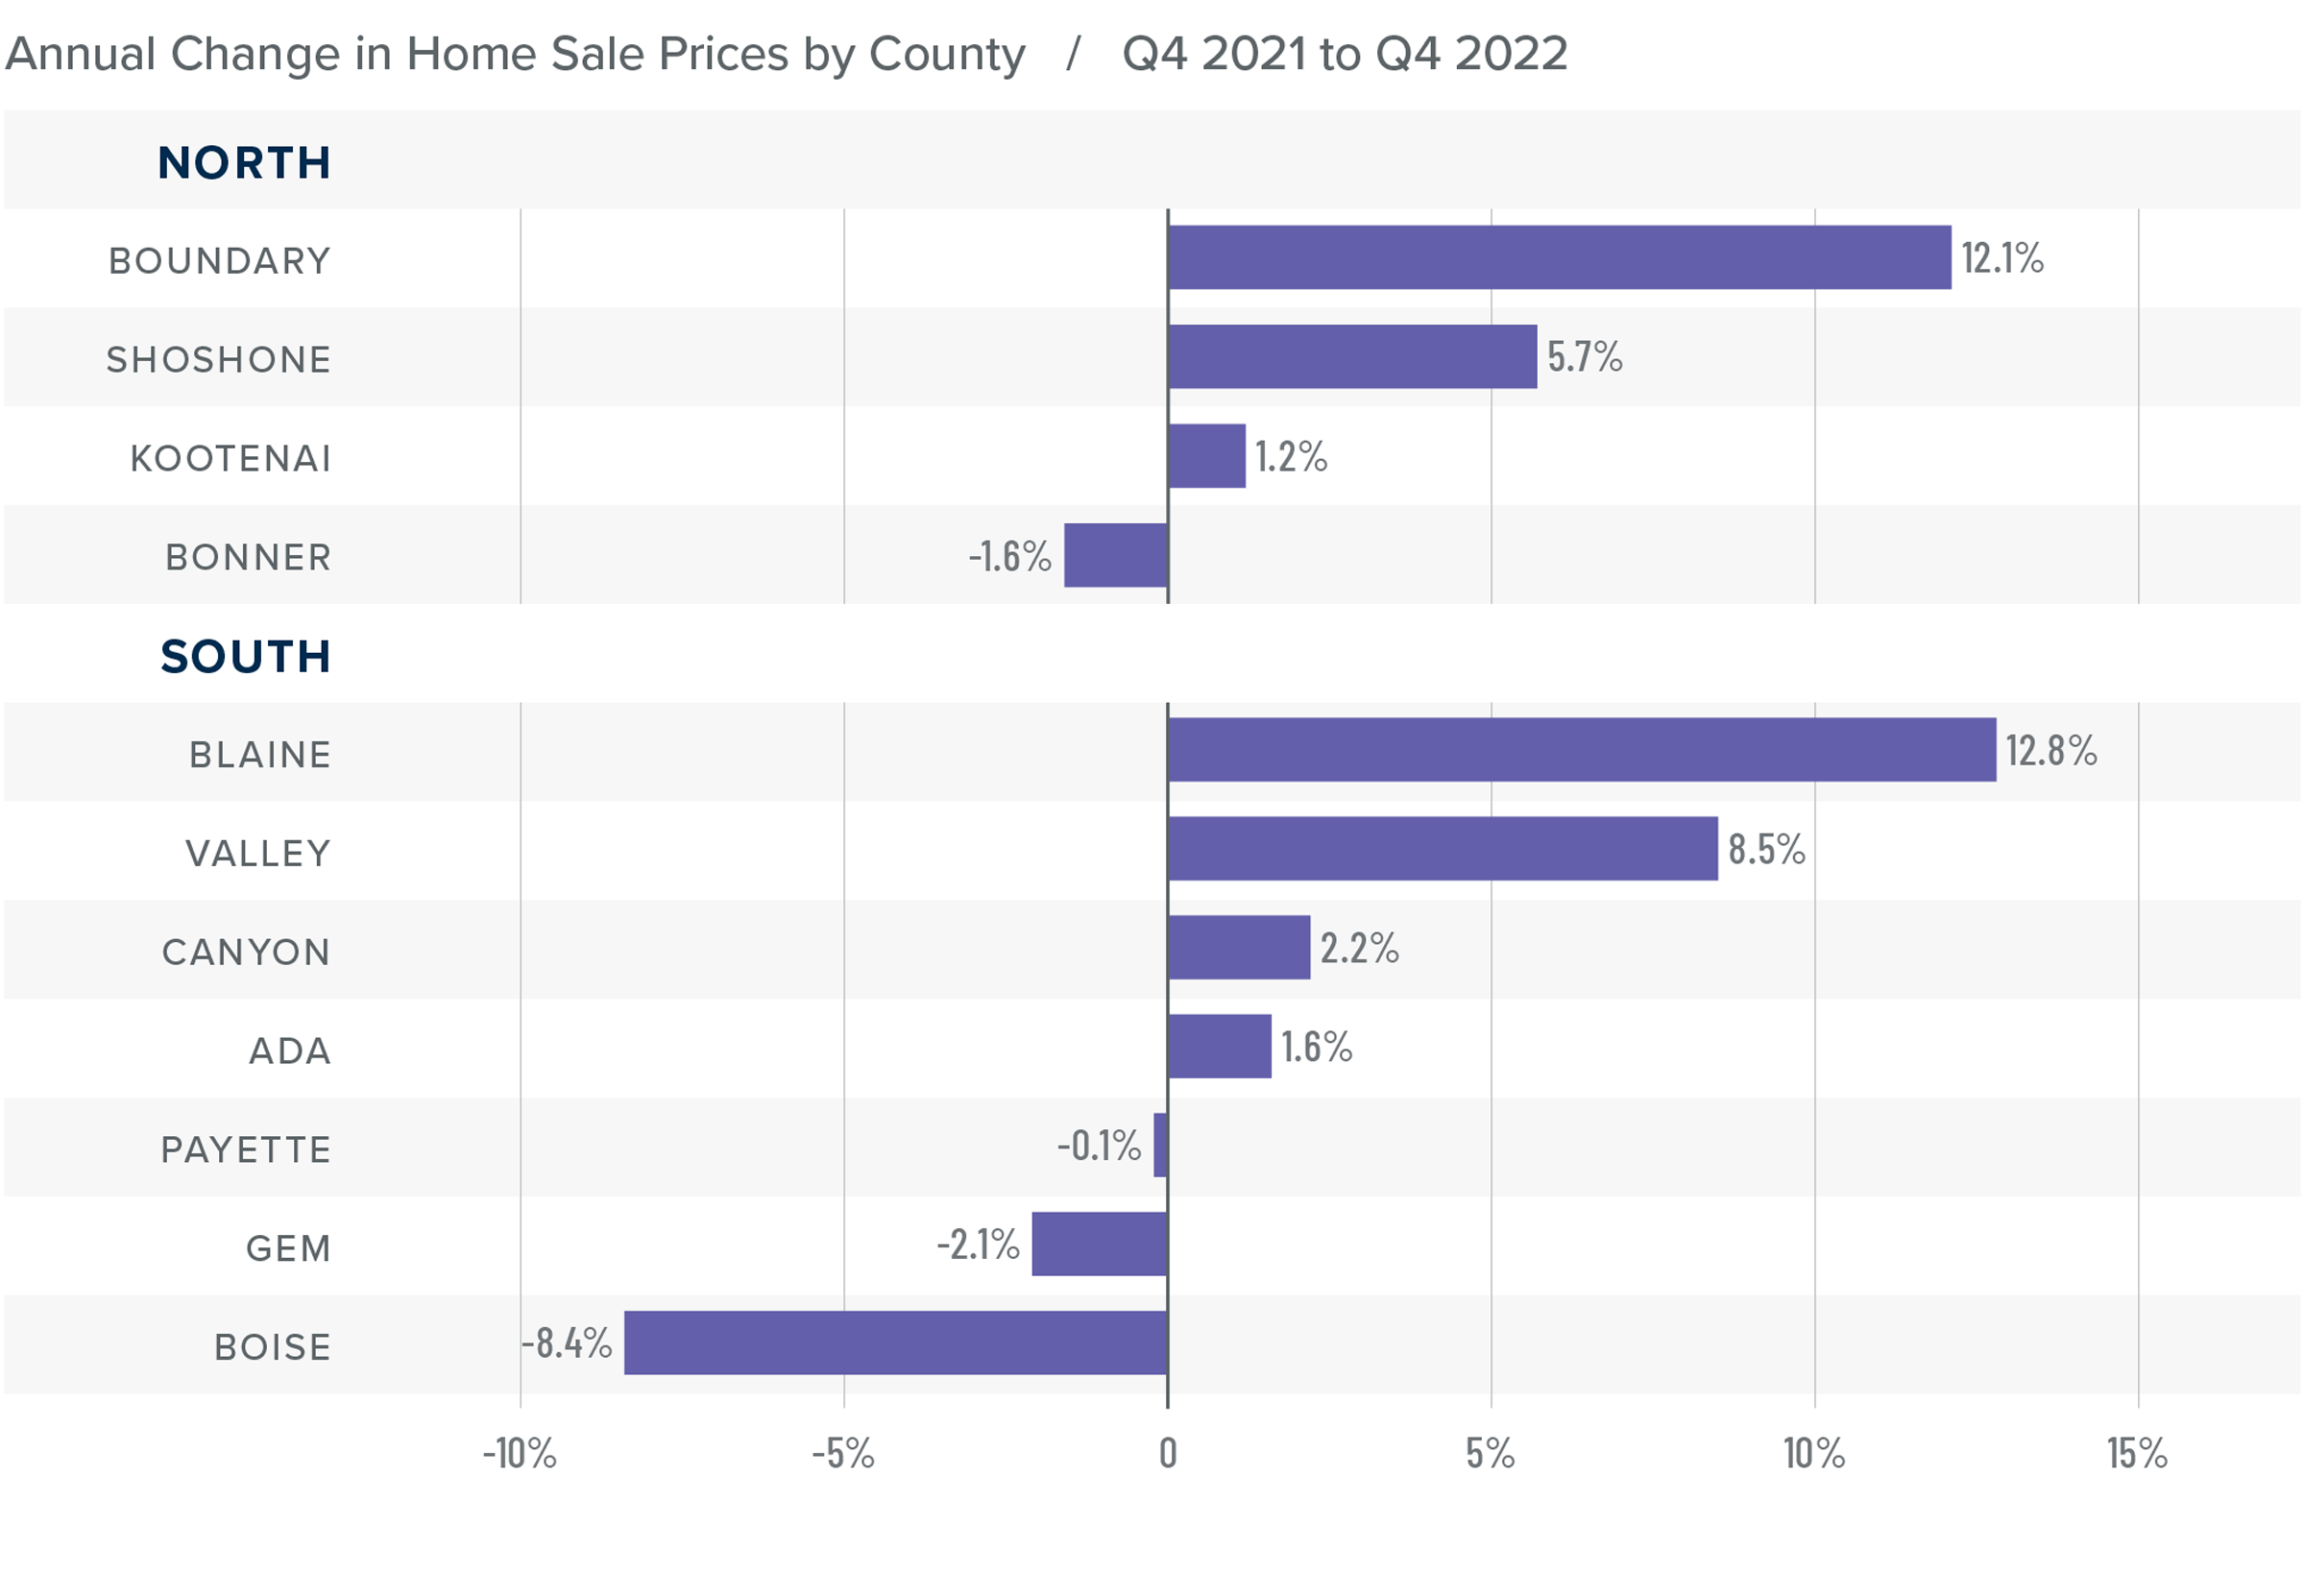
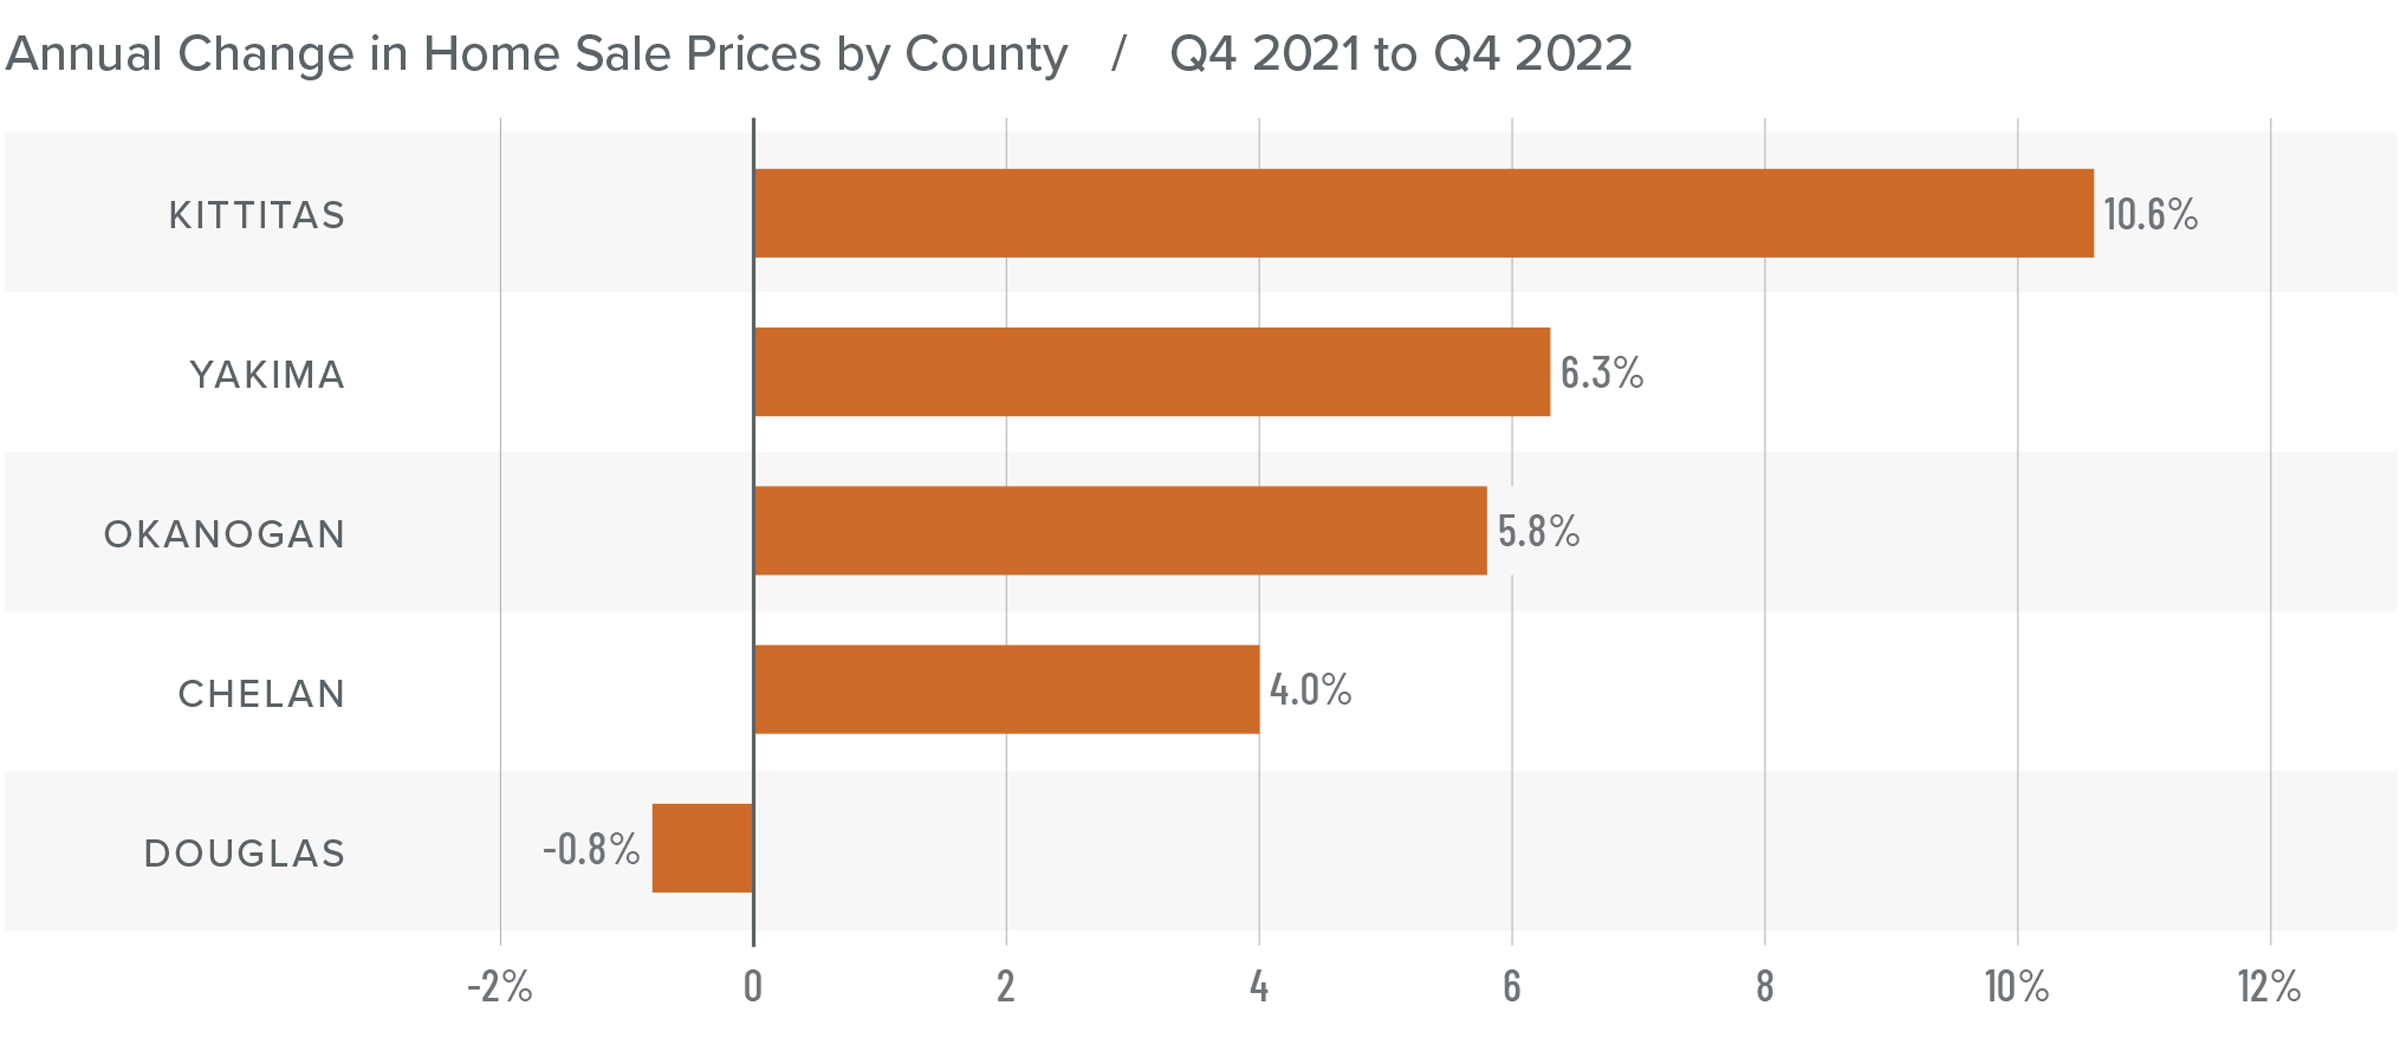
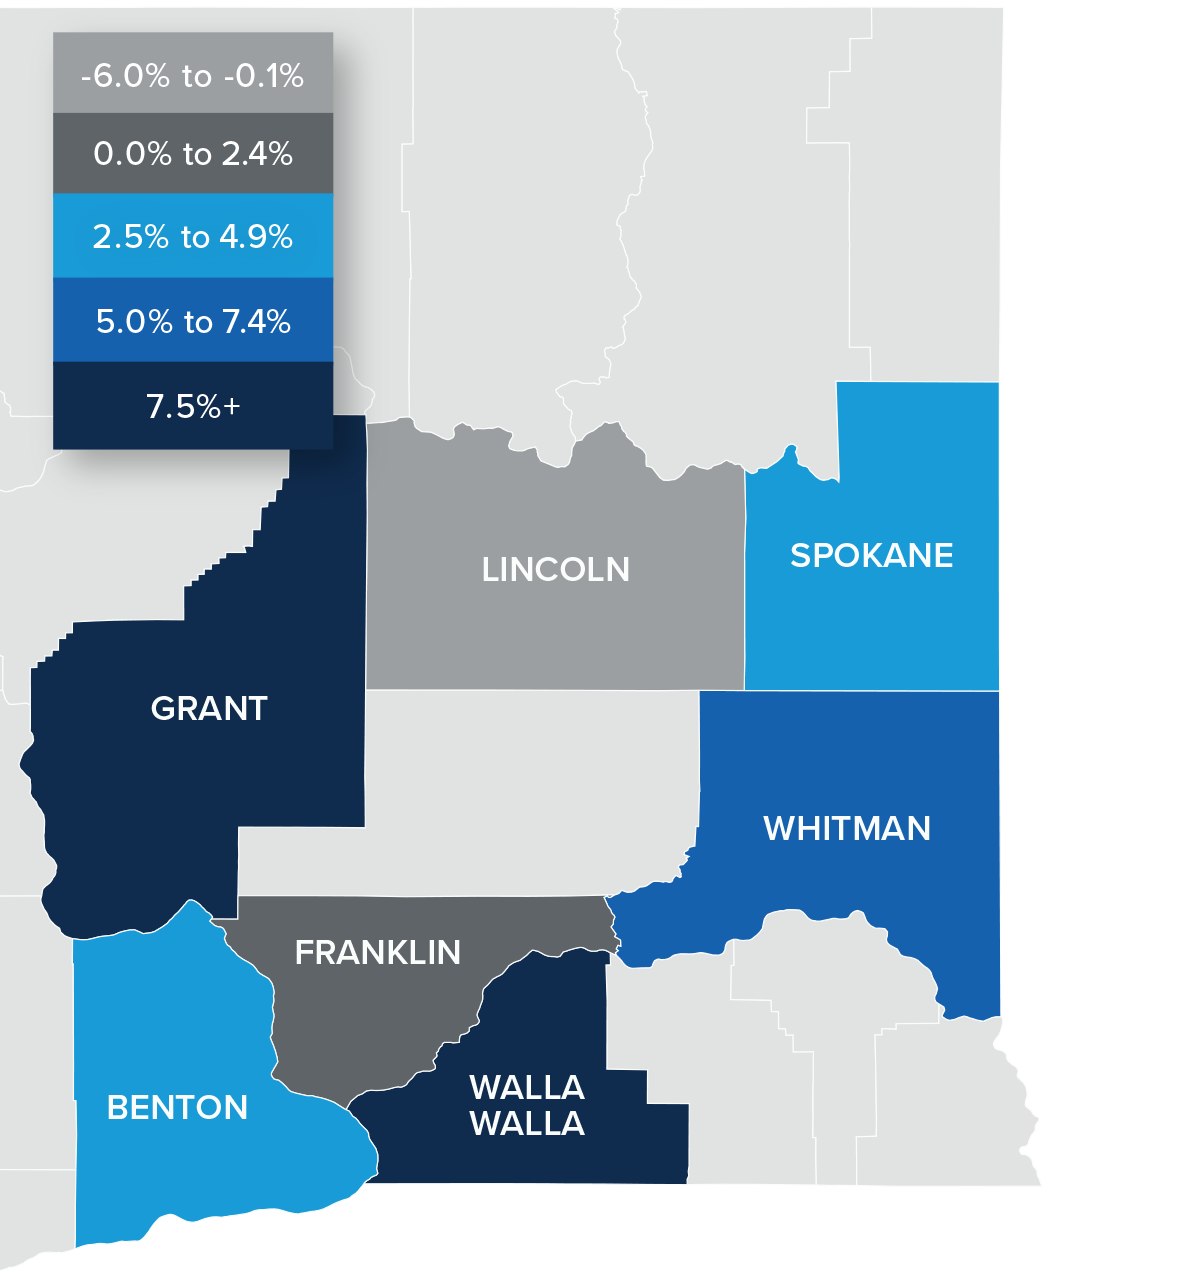
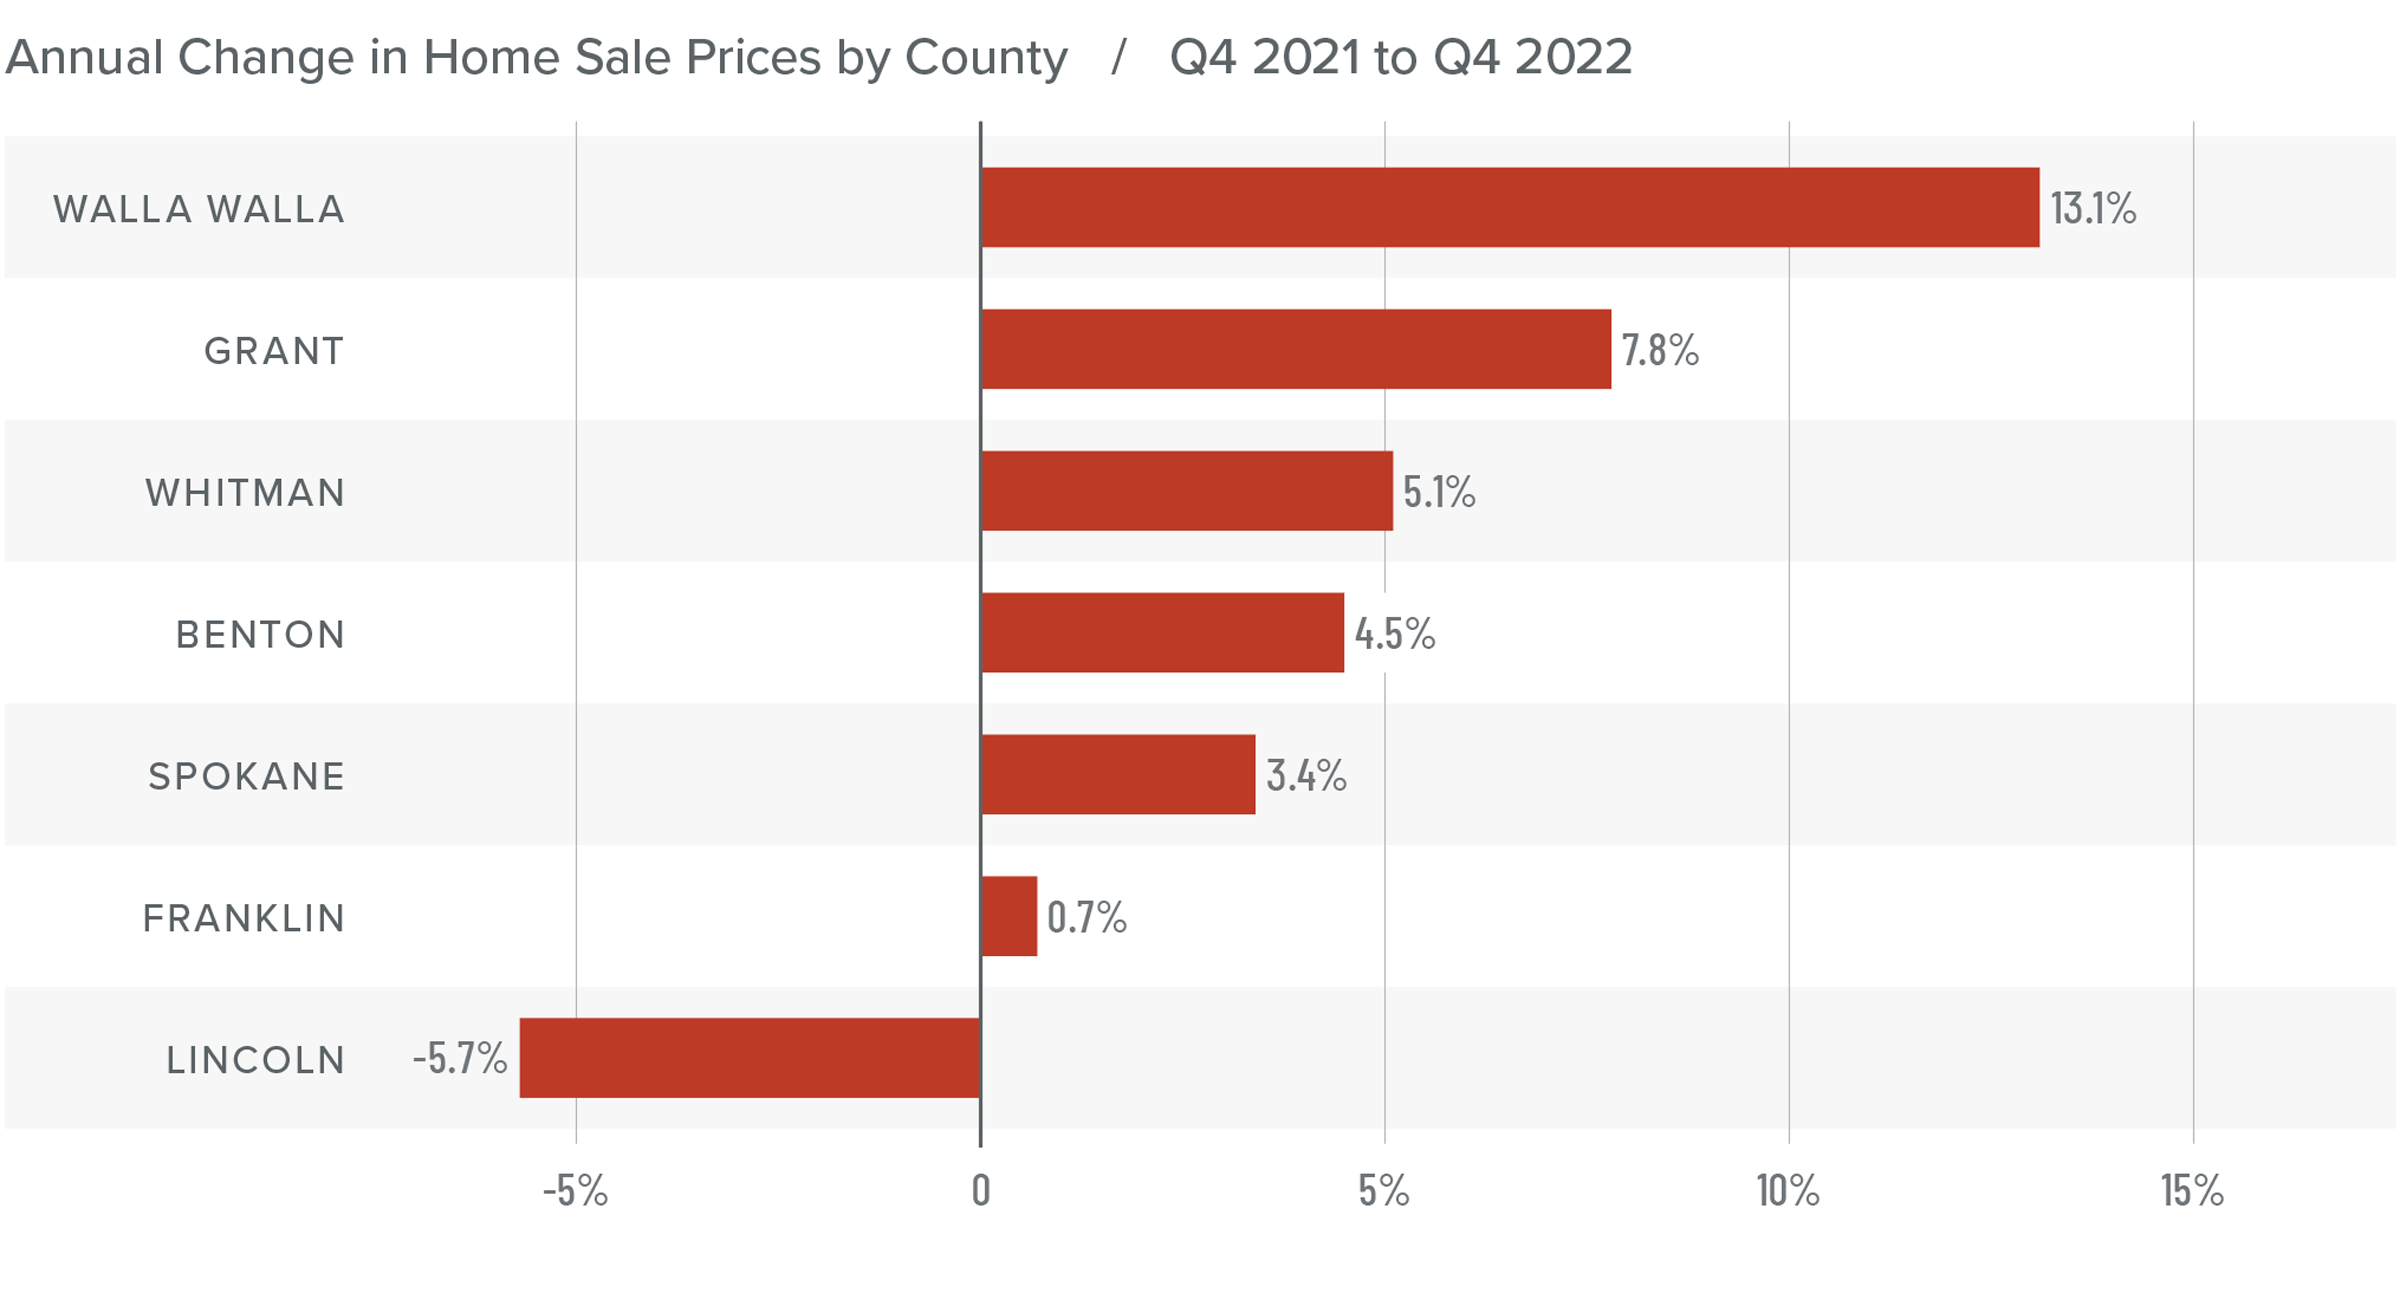
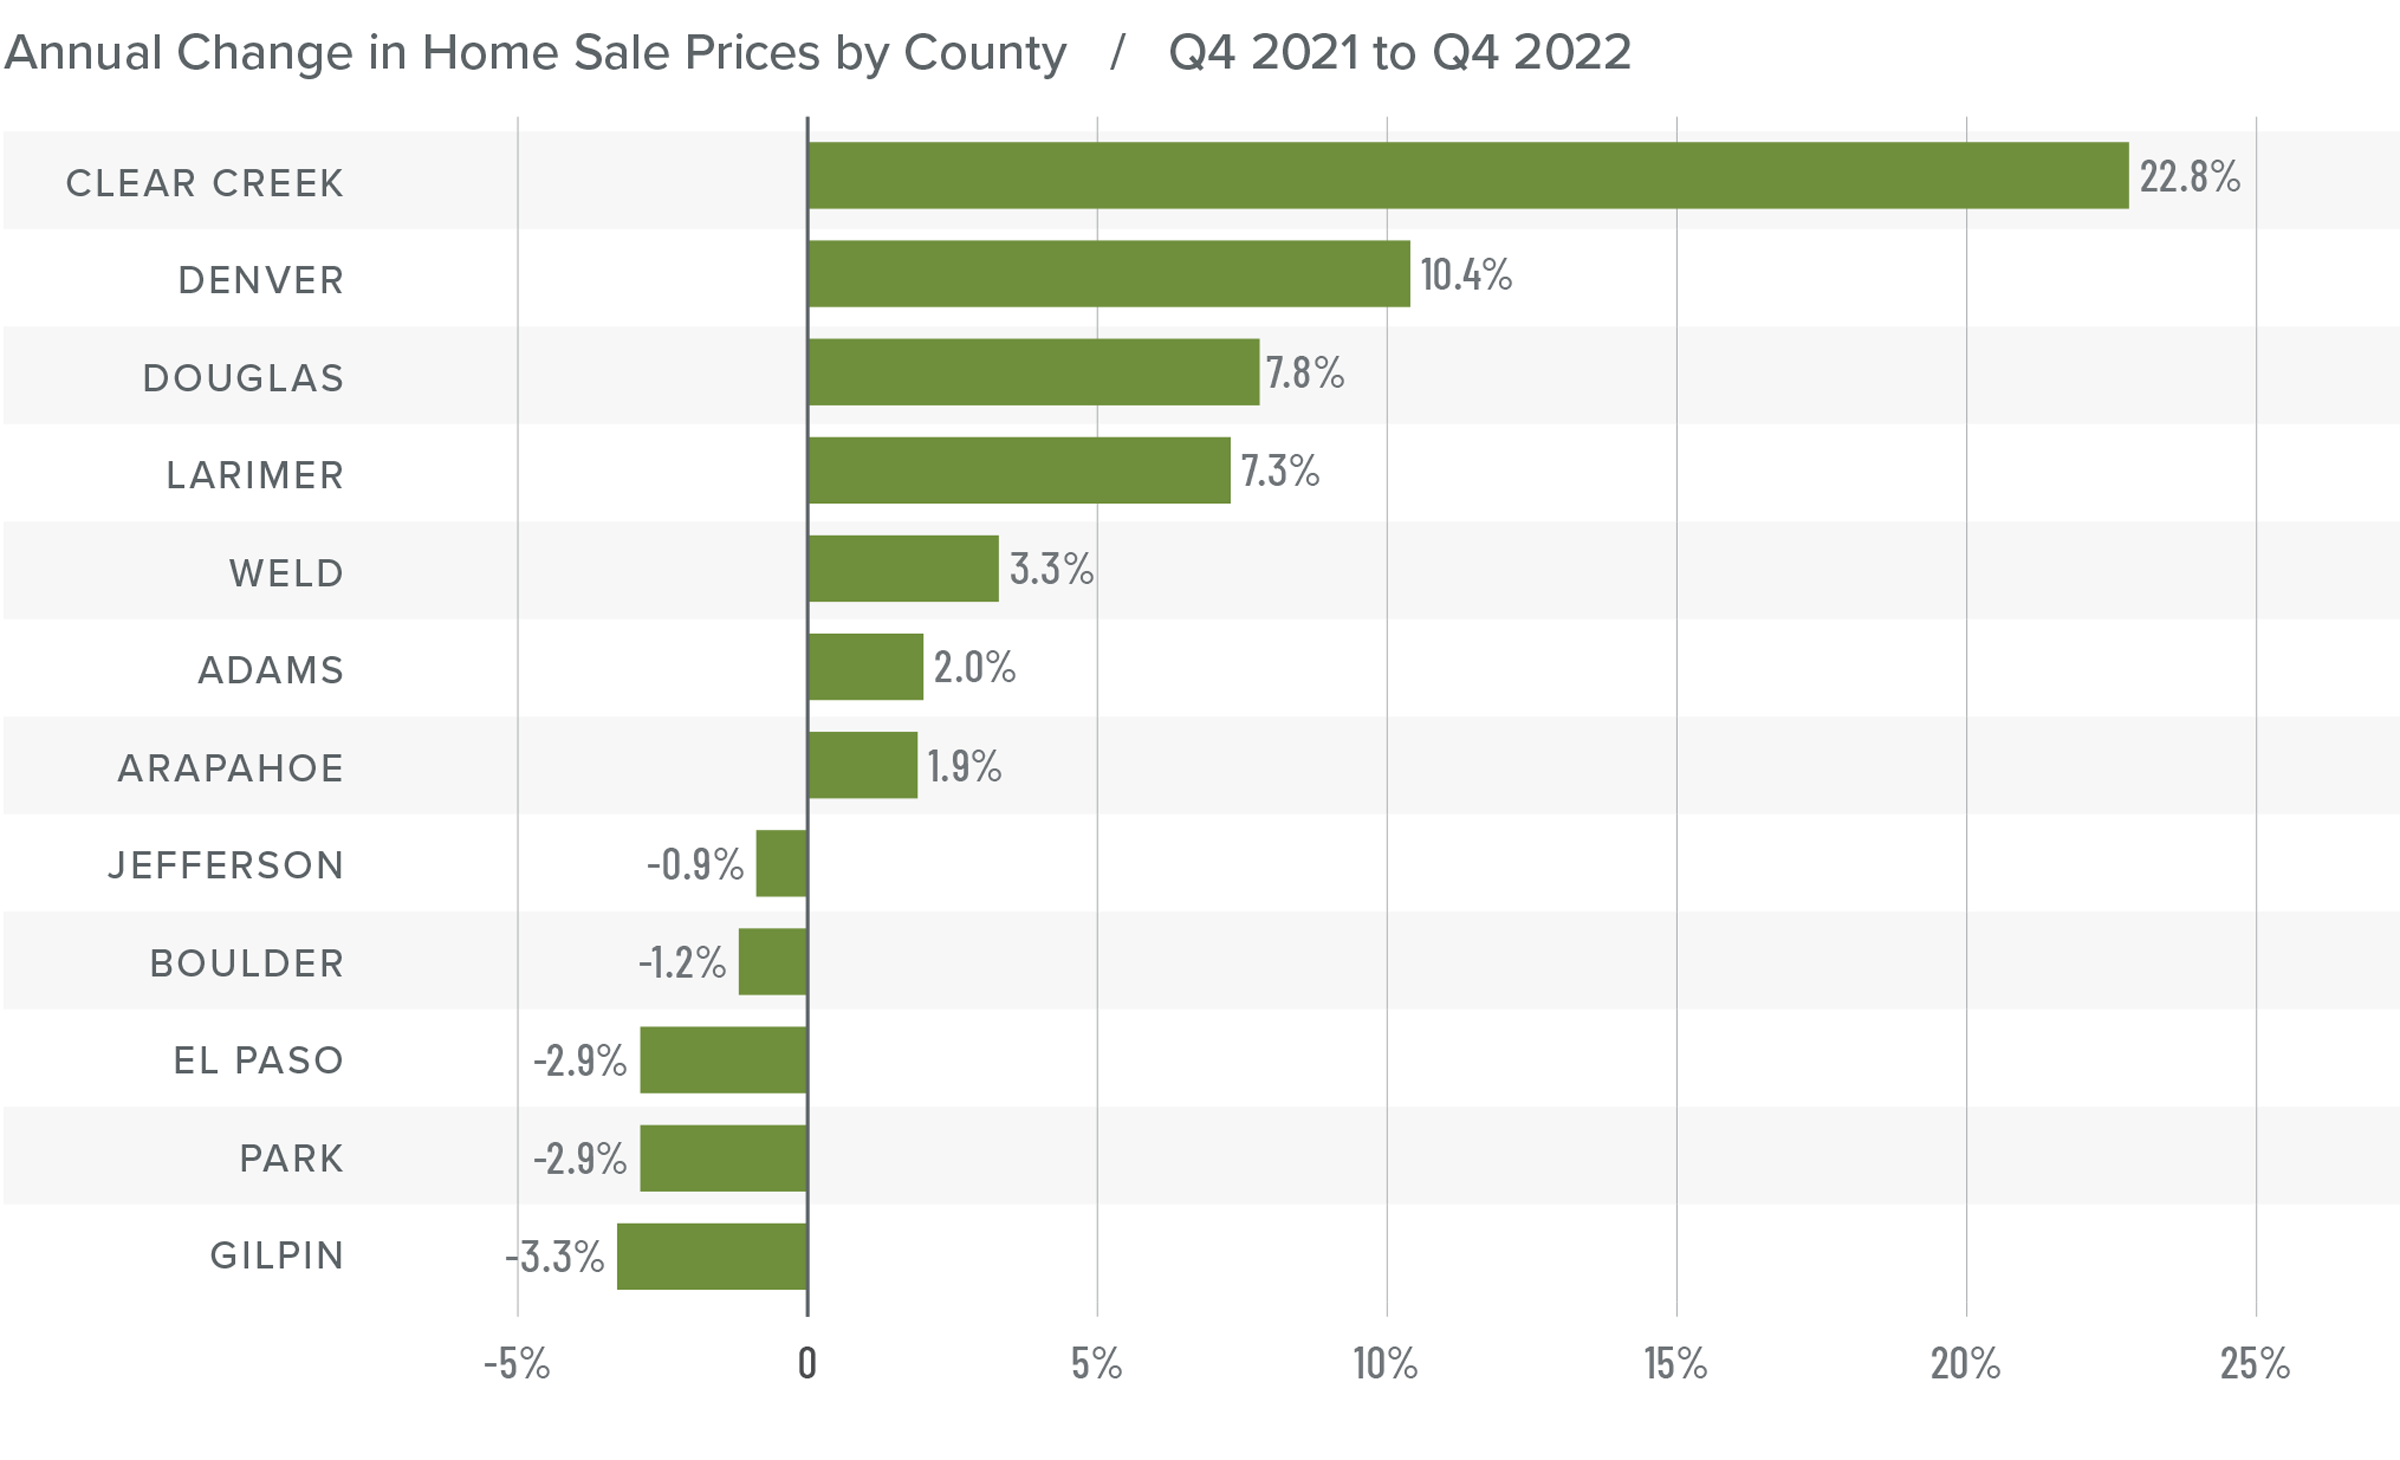
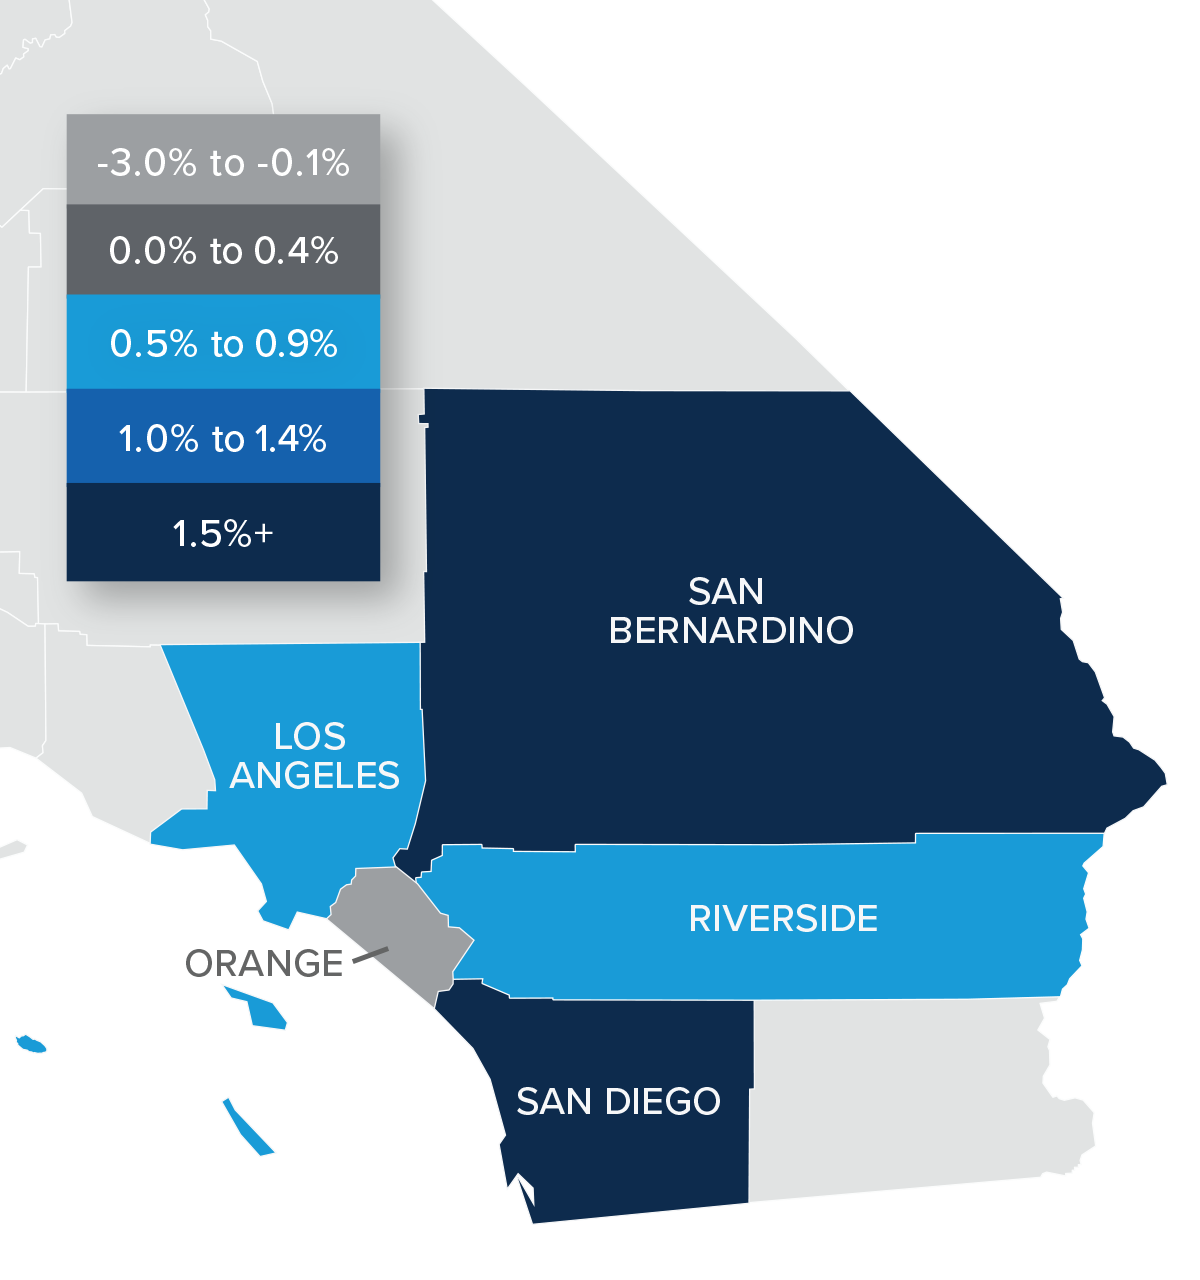
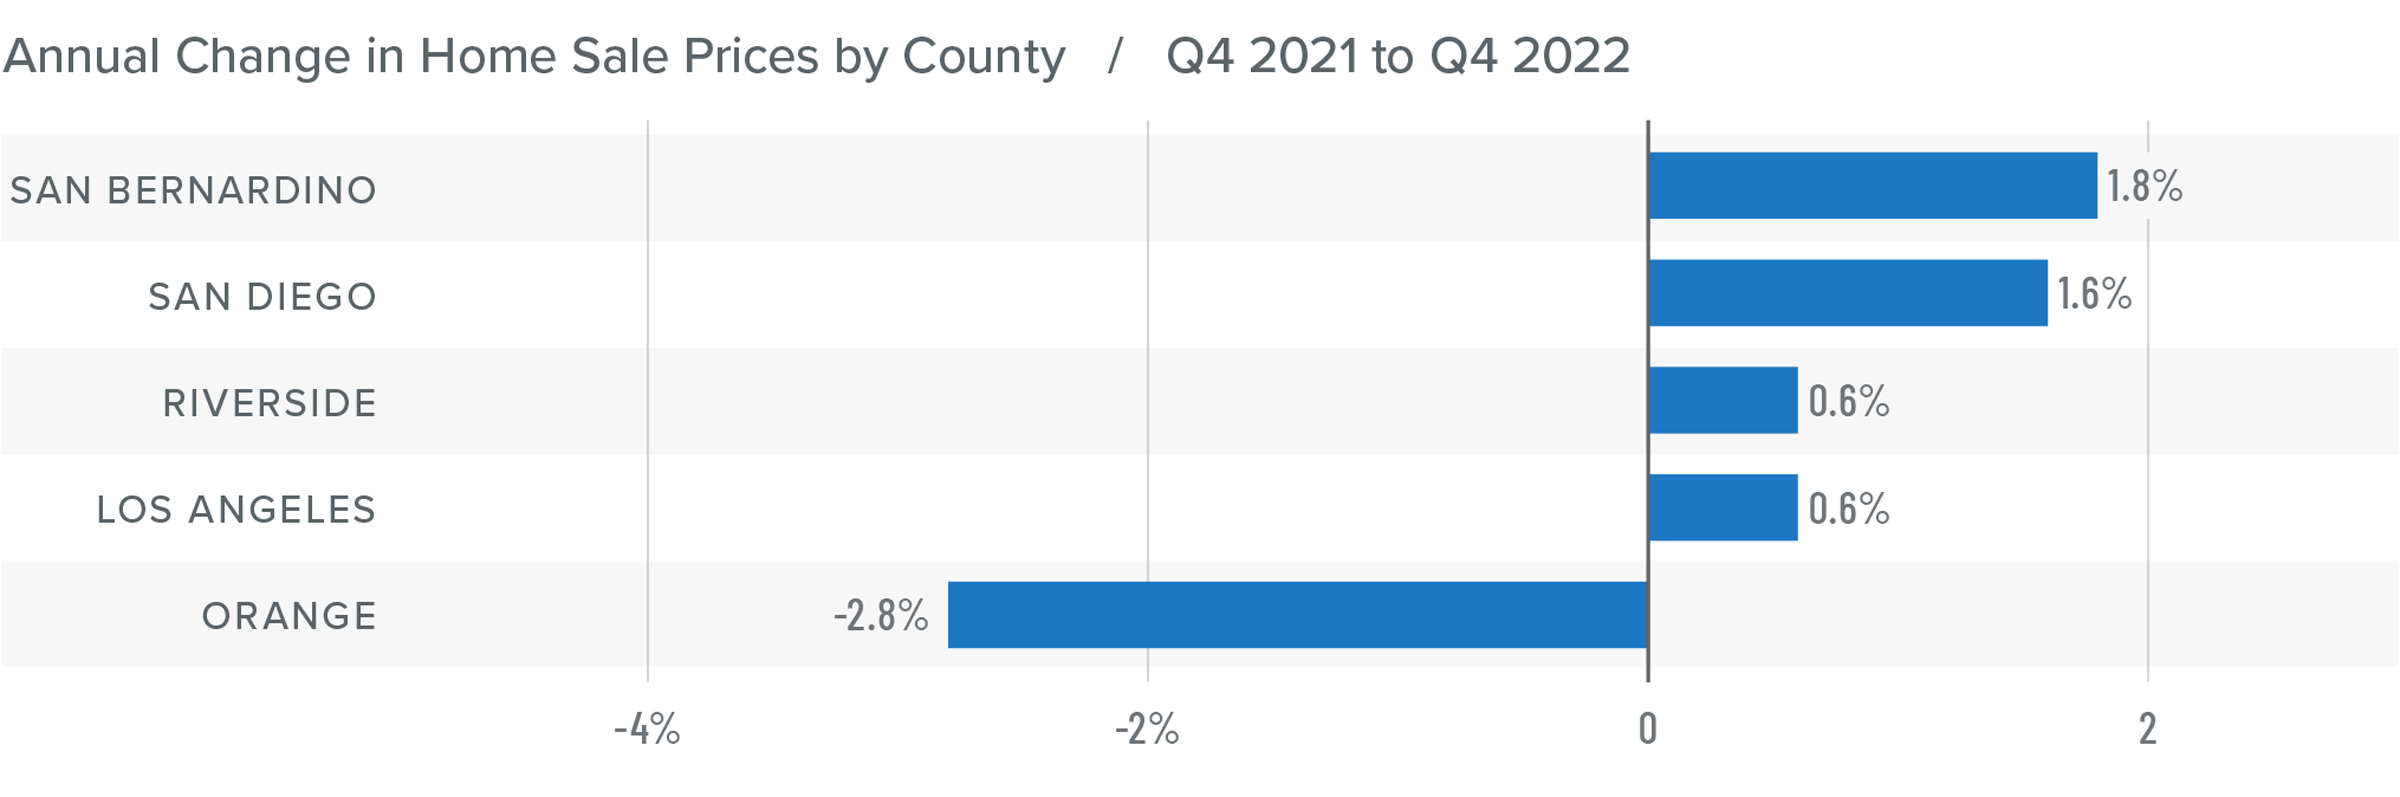
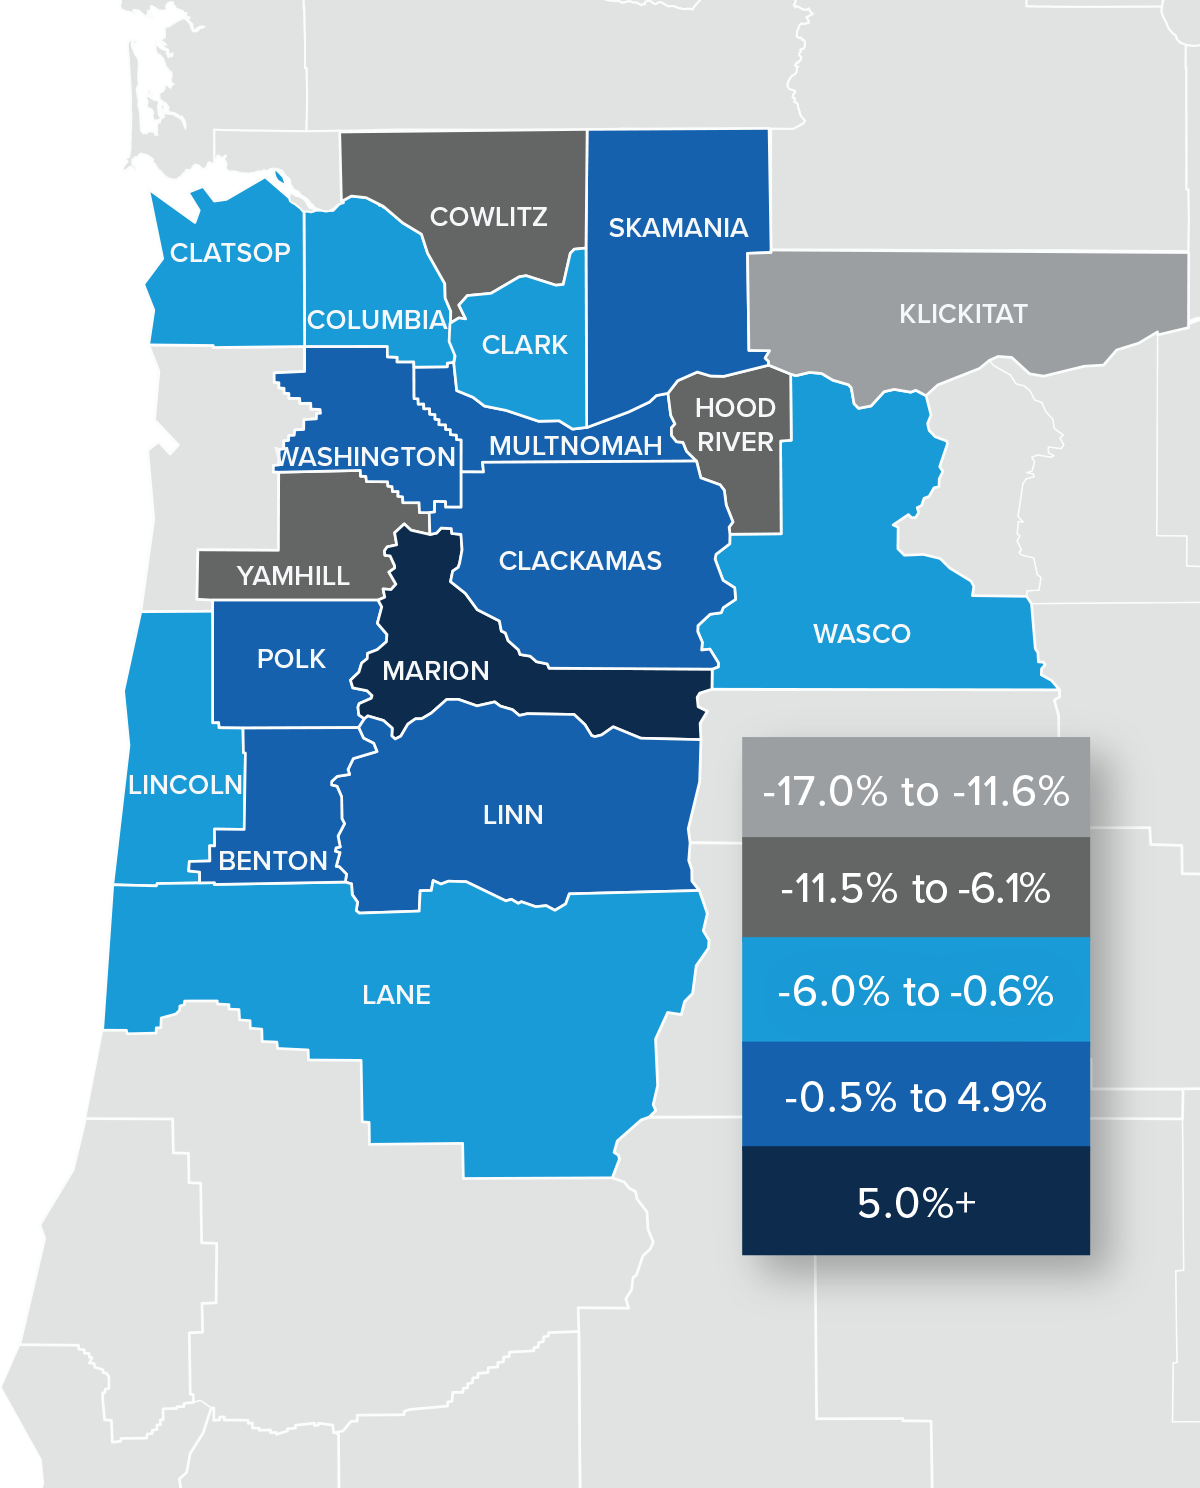
Montana Home Prices
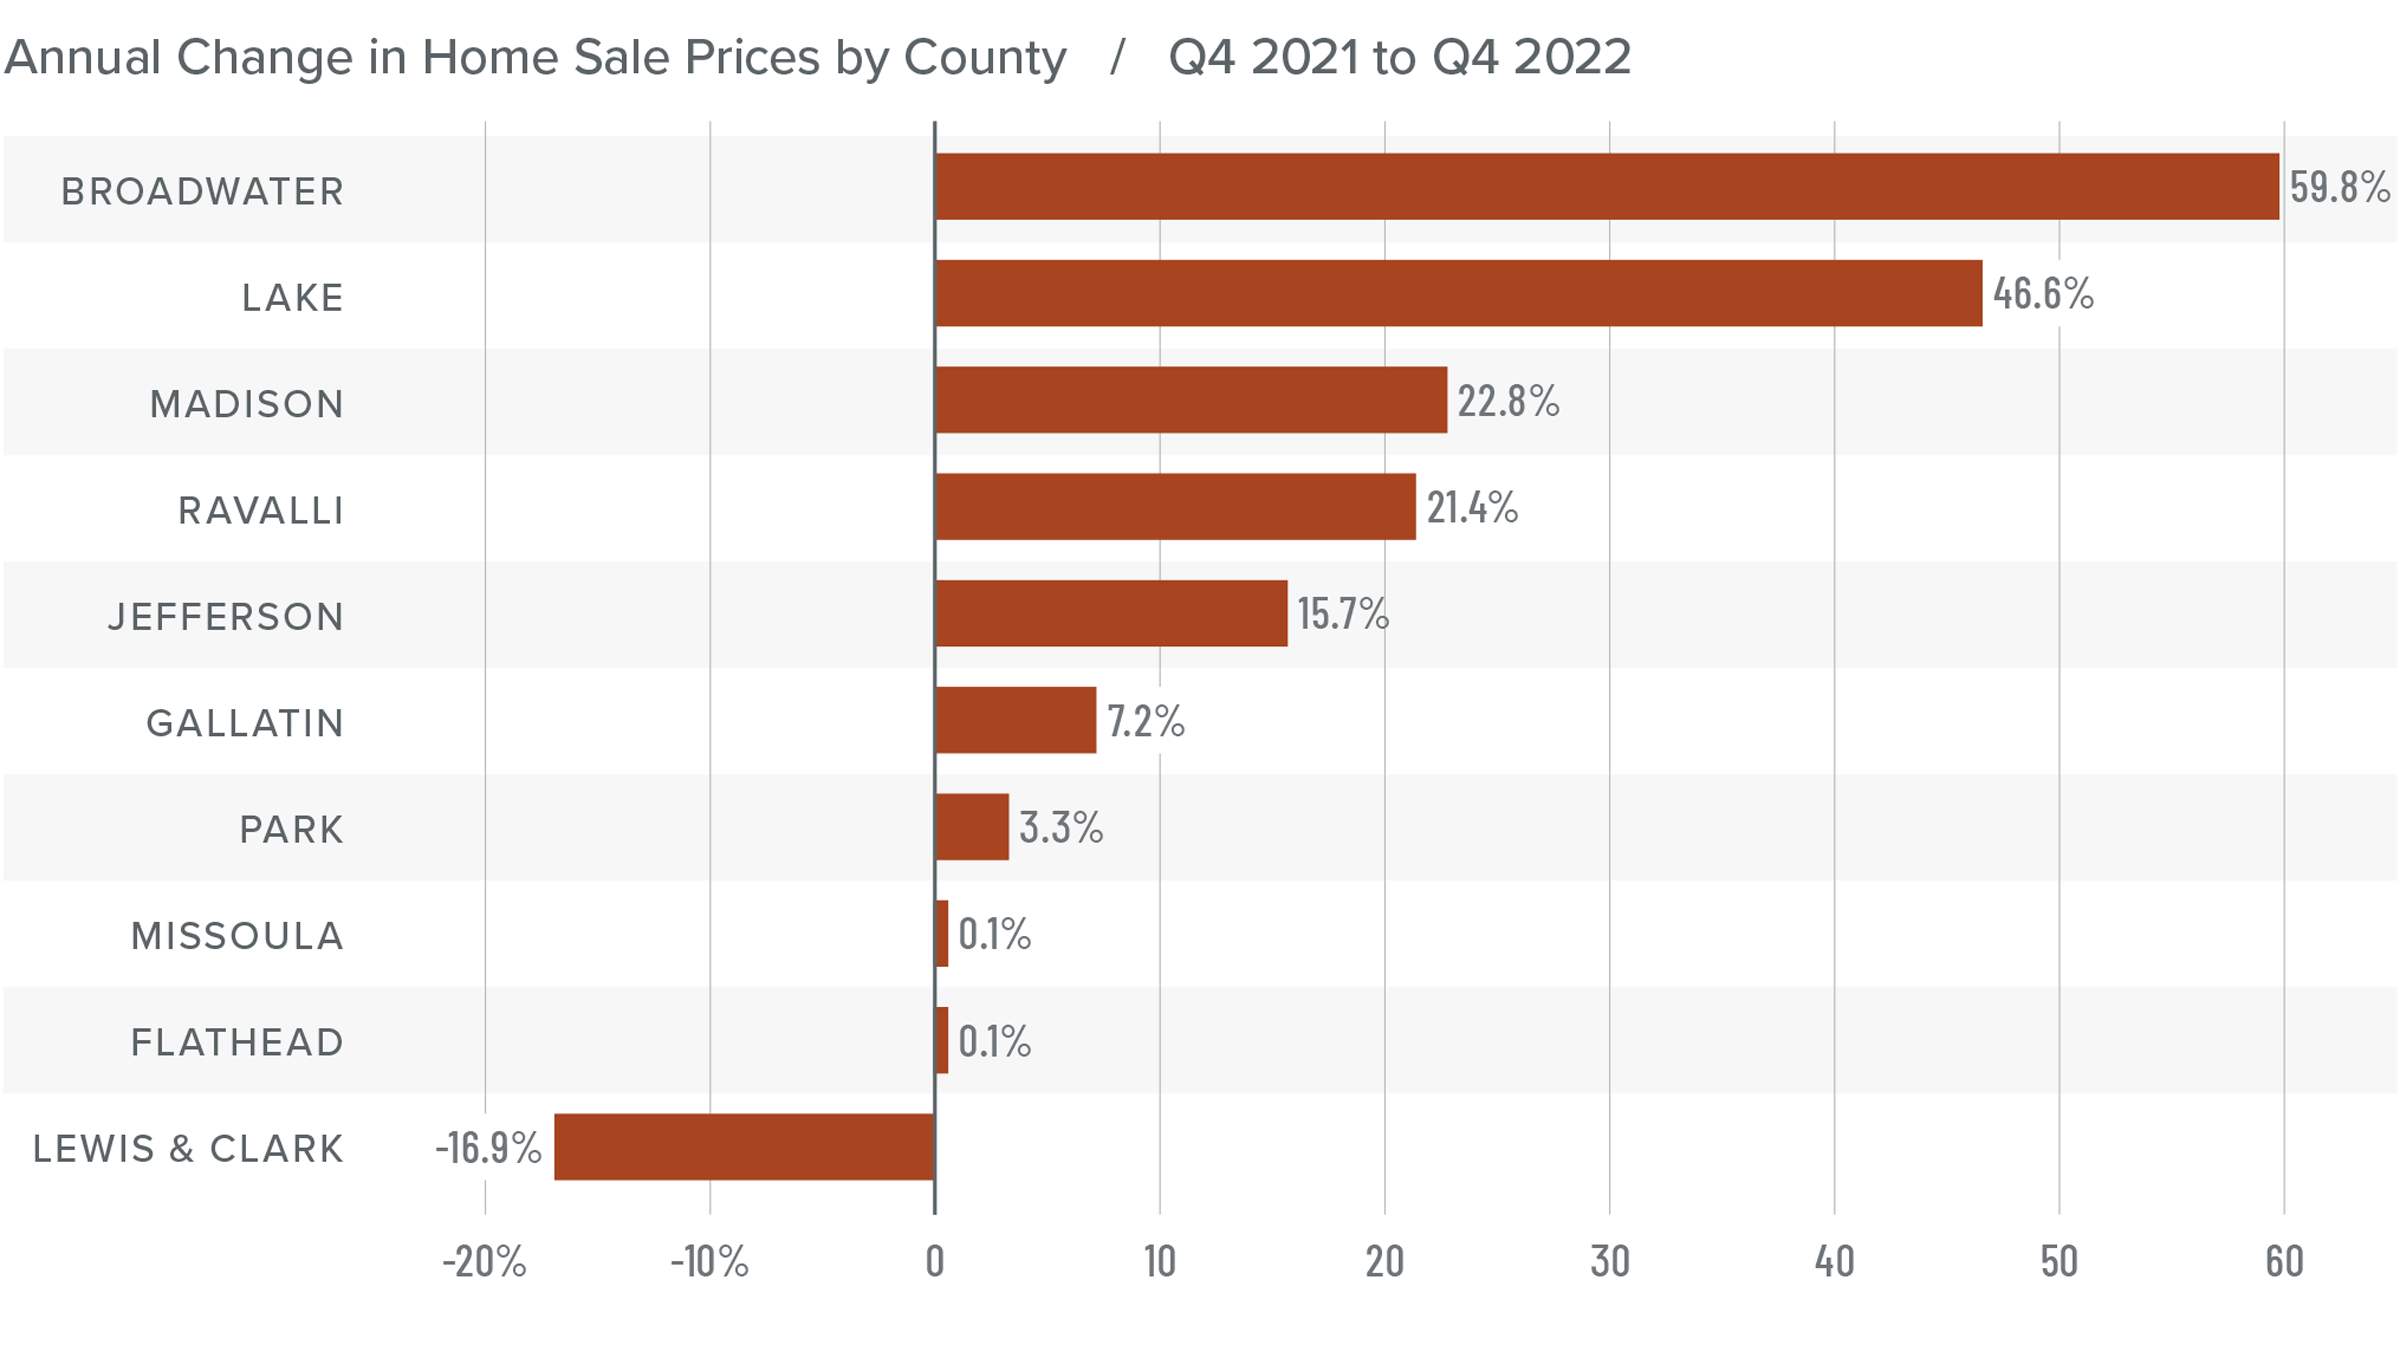
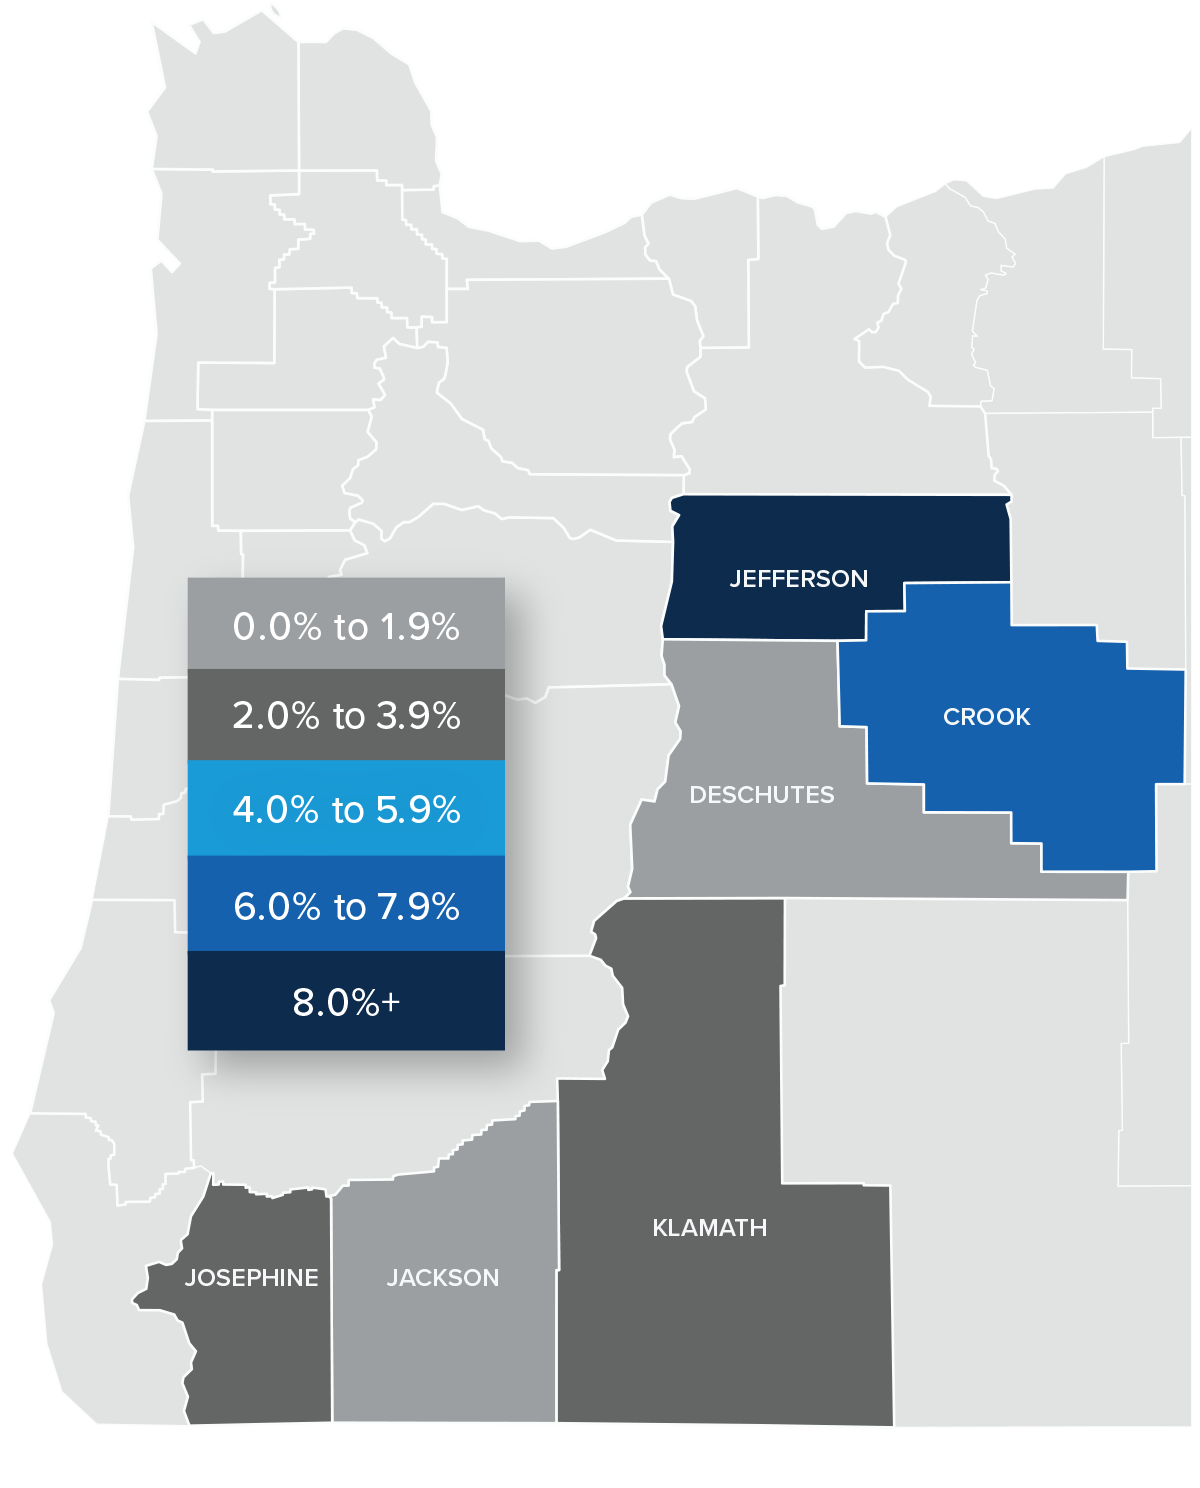
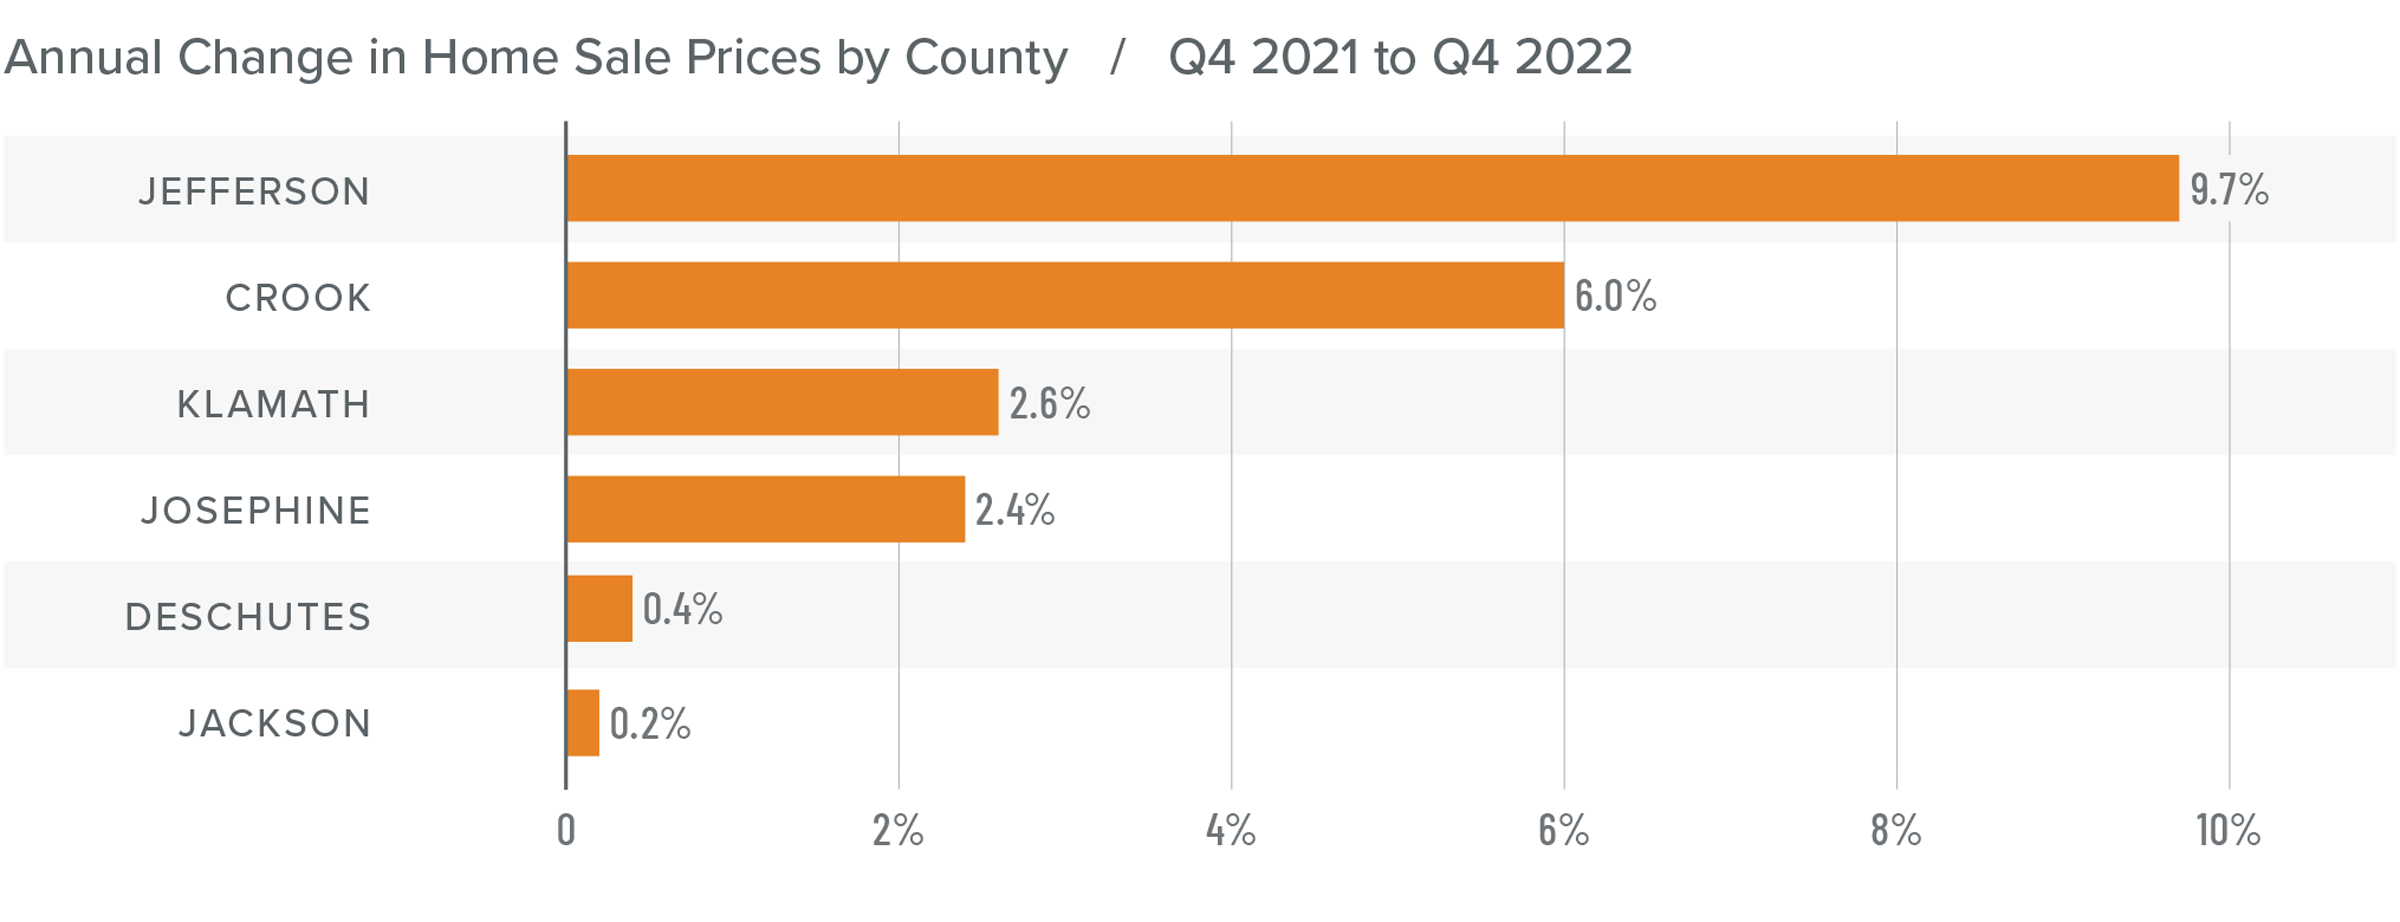
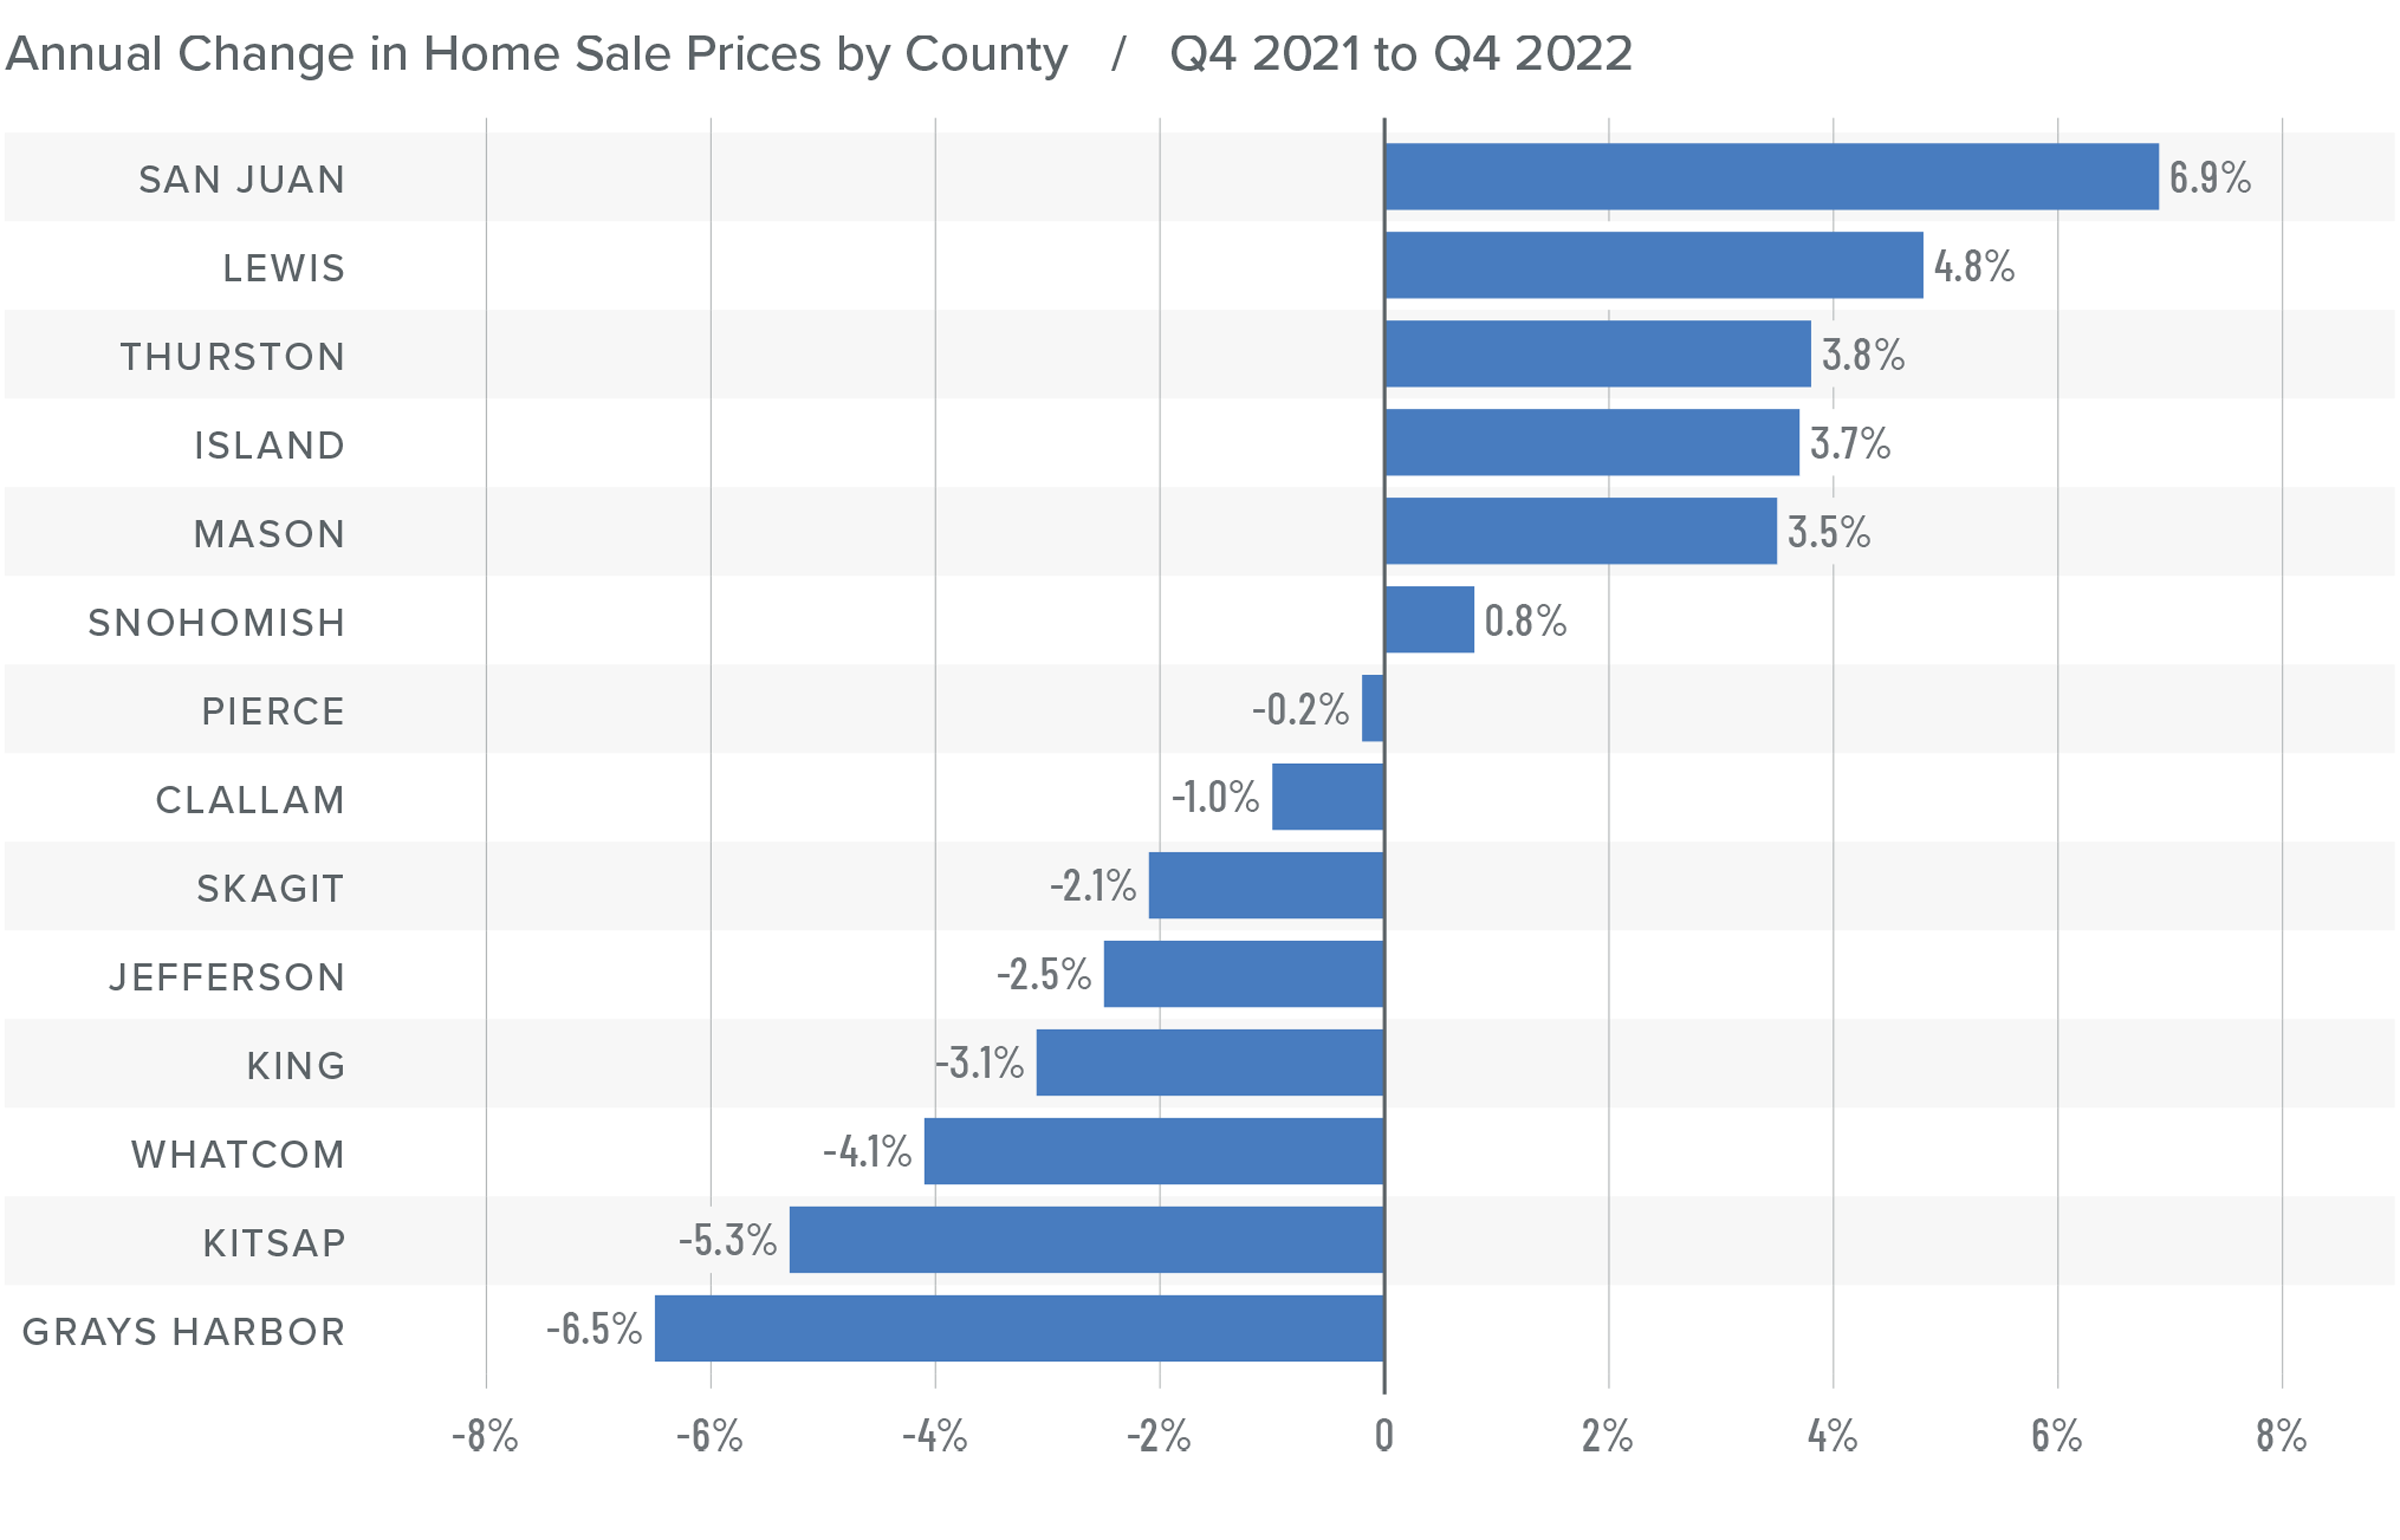
❱ Home prices were up 5.5% year over year to an average of $783,588. Prices were 10.5% higher than in the third quarter of 2022.
❱ I still expect price growth to slow as we move through 2023. The question is whether prices will experience a tangible fall or if they will be able to hold onto modest gains while waiting for mortgage rates to fall, which would stimulate demand.
❱ In many parts of the country, prices have started to soften due to higher mortgage rates, so it was surprising to see the region’s home prices increase from the third quarter. While median listing prices were higher across the board, they did drop in Broadwater, Ravalli, Park, and Gallatin counties.
❱ The Montana housing market is faring much better than most of the country. Whether this can continue, however, is still uncertain.
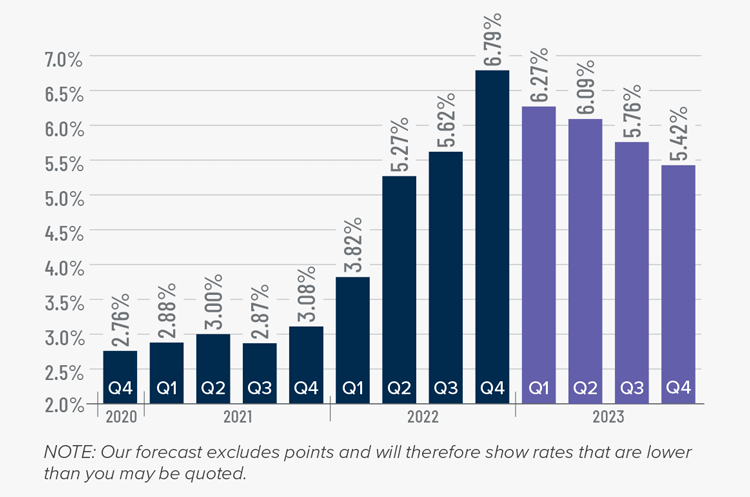
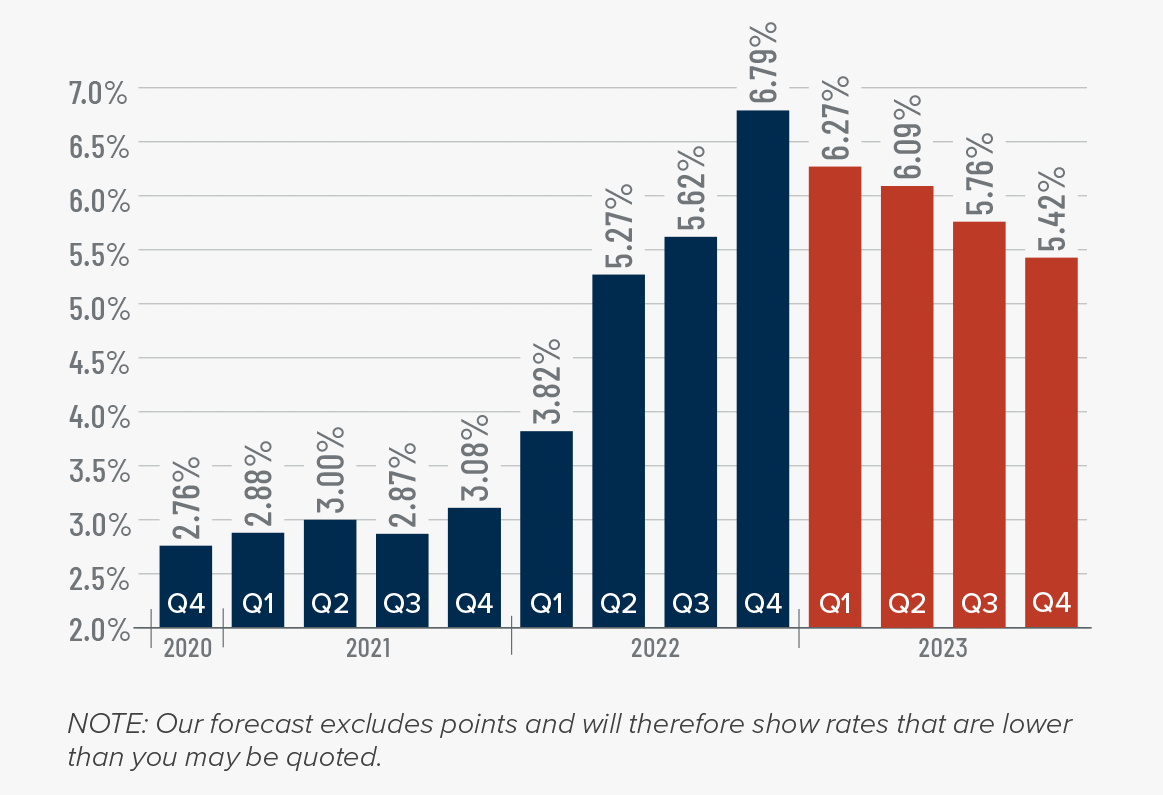
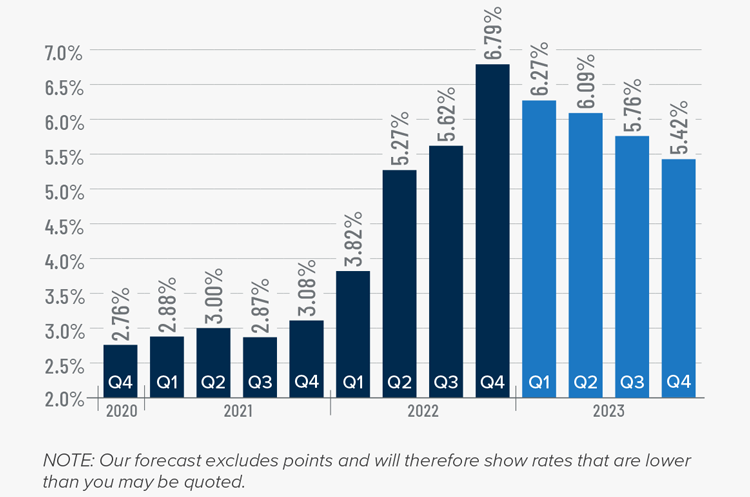
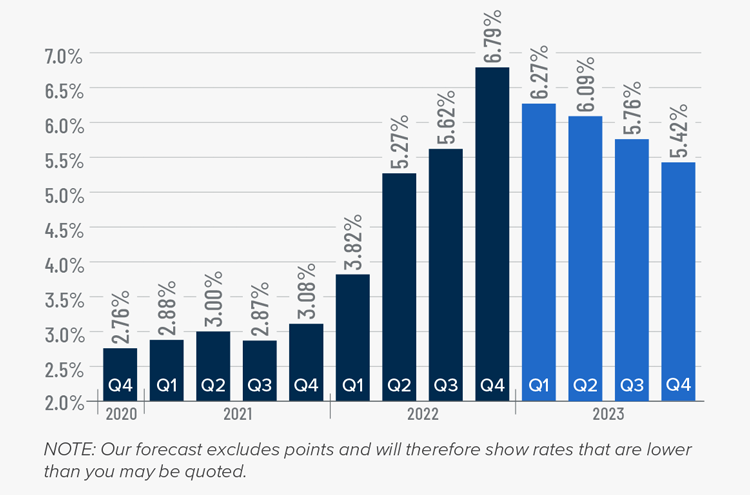
Mortgage Rates
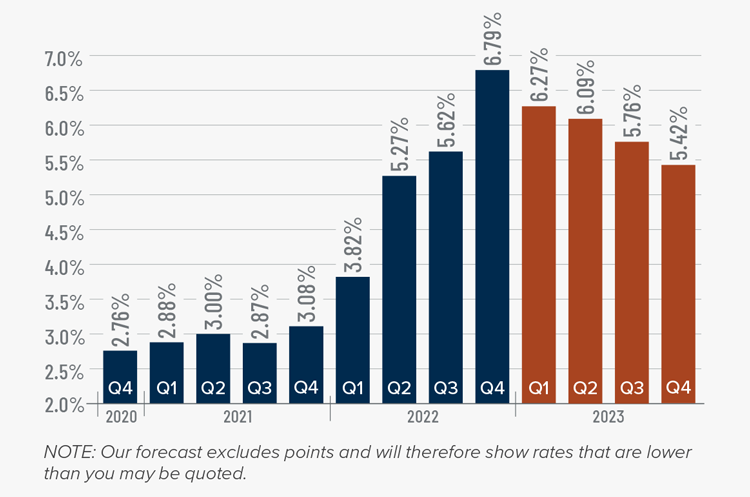
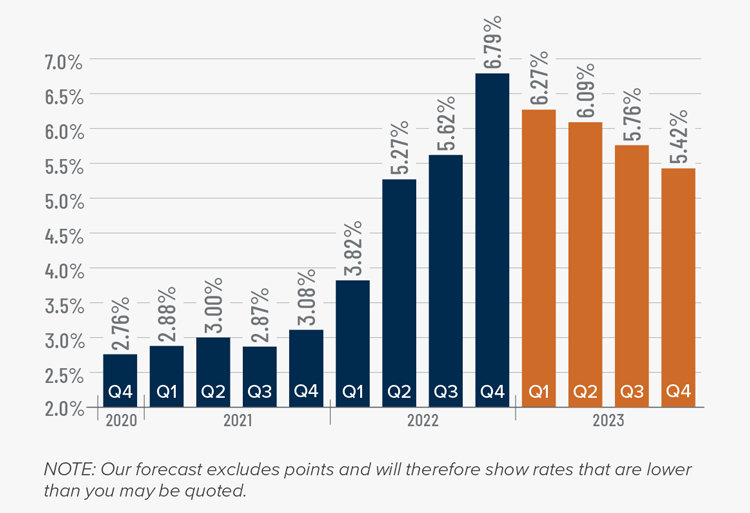
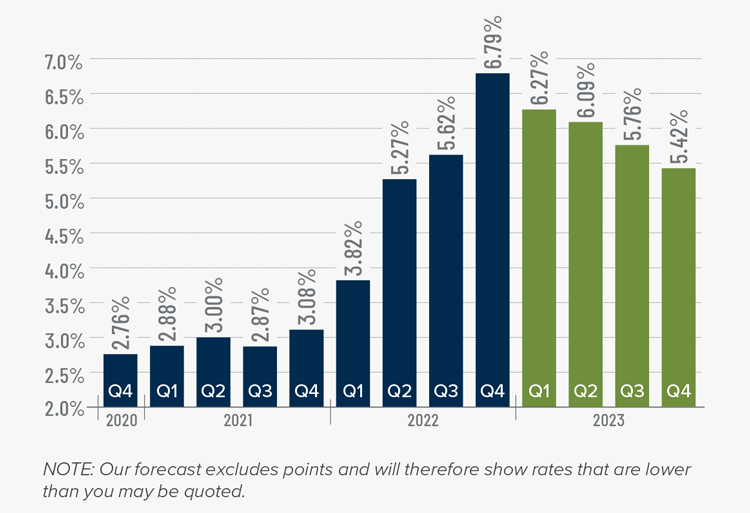
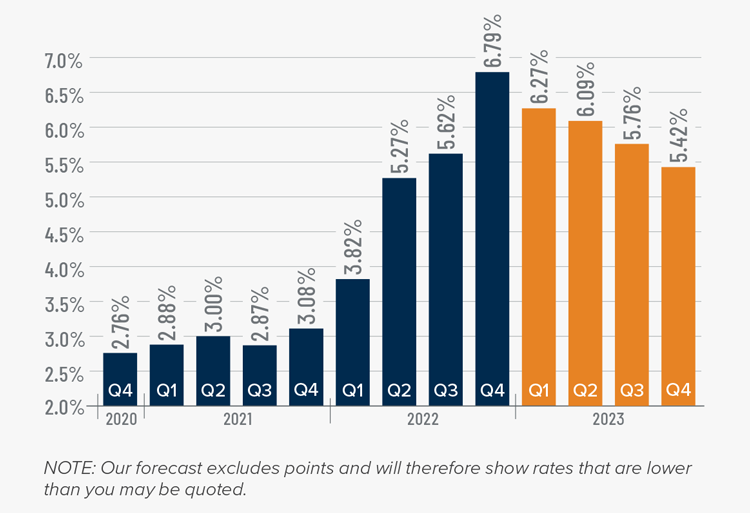
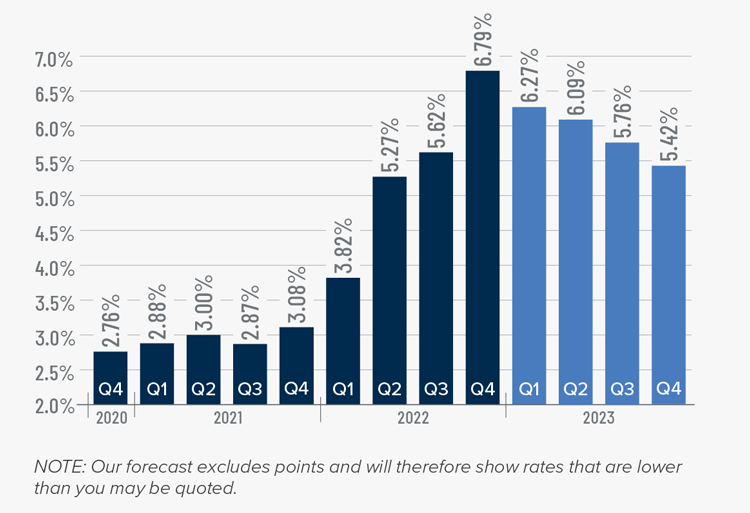
Rates rose dramatically in 2022, but I believe that they have now peaked. Mortgage rates are primarily based on the prices and yields of bonds, and while bonds take cues from several places, they are always impacted by inflation and the economy at large. If inflation continues to fall, as I expect it will, rates will continue to drop.
My current forecast is that mortgage rates will trend lower as we move through the year. While this may be good news for home buyers, rates will still be higher than they have become accustomed to. Even as the cost of borrowing falls, home prices in expensive markets will probably fall a bit more to compensate for rates that will likely hold above 6% until early summer.
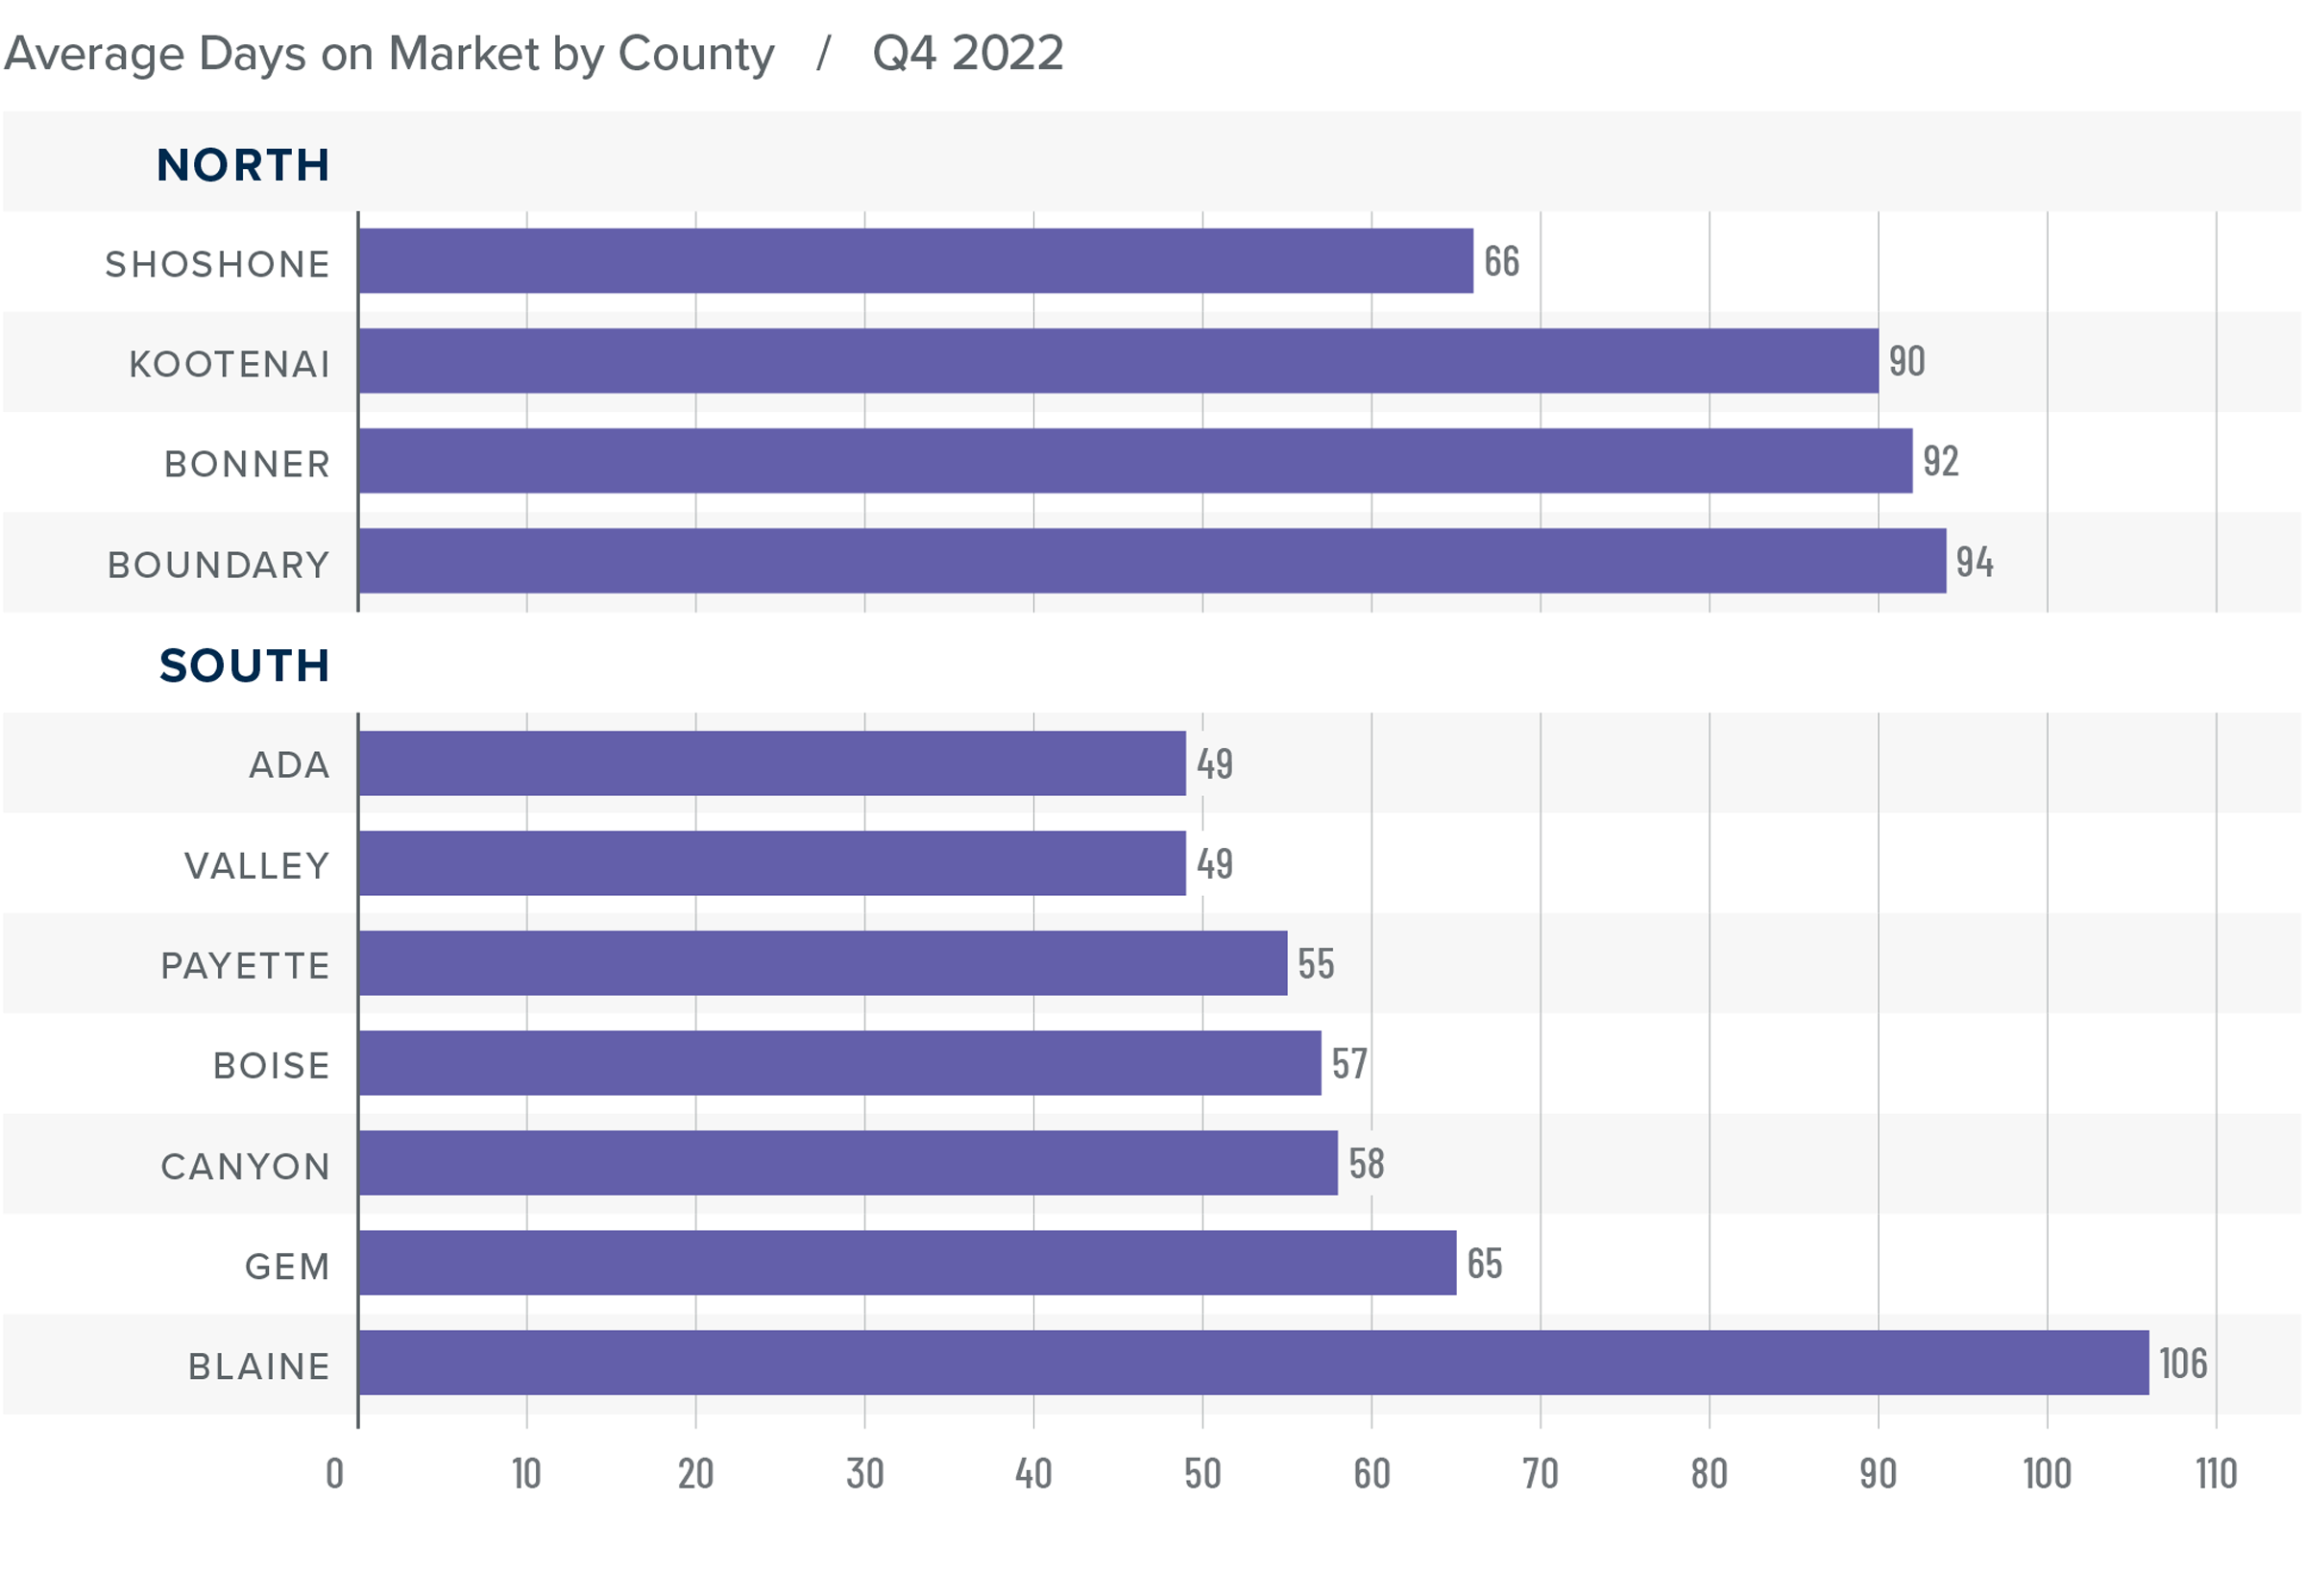
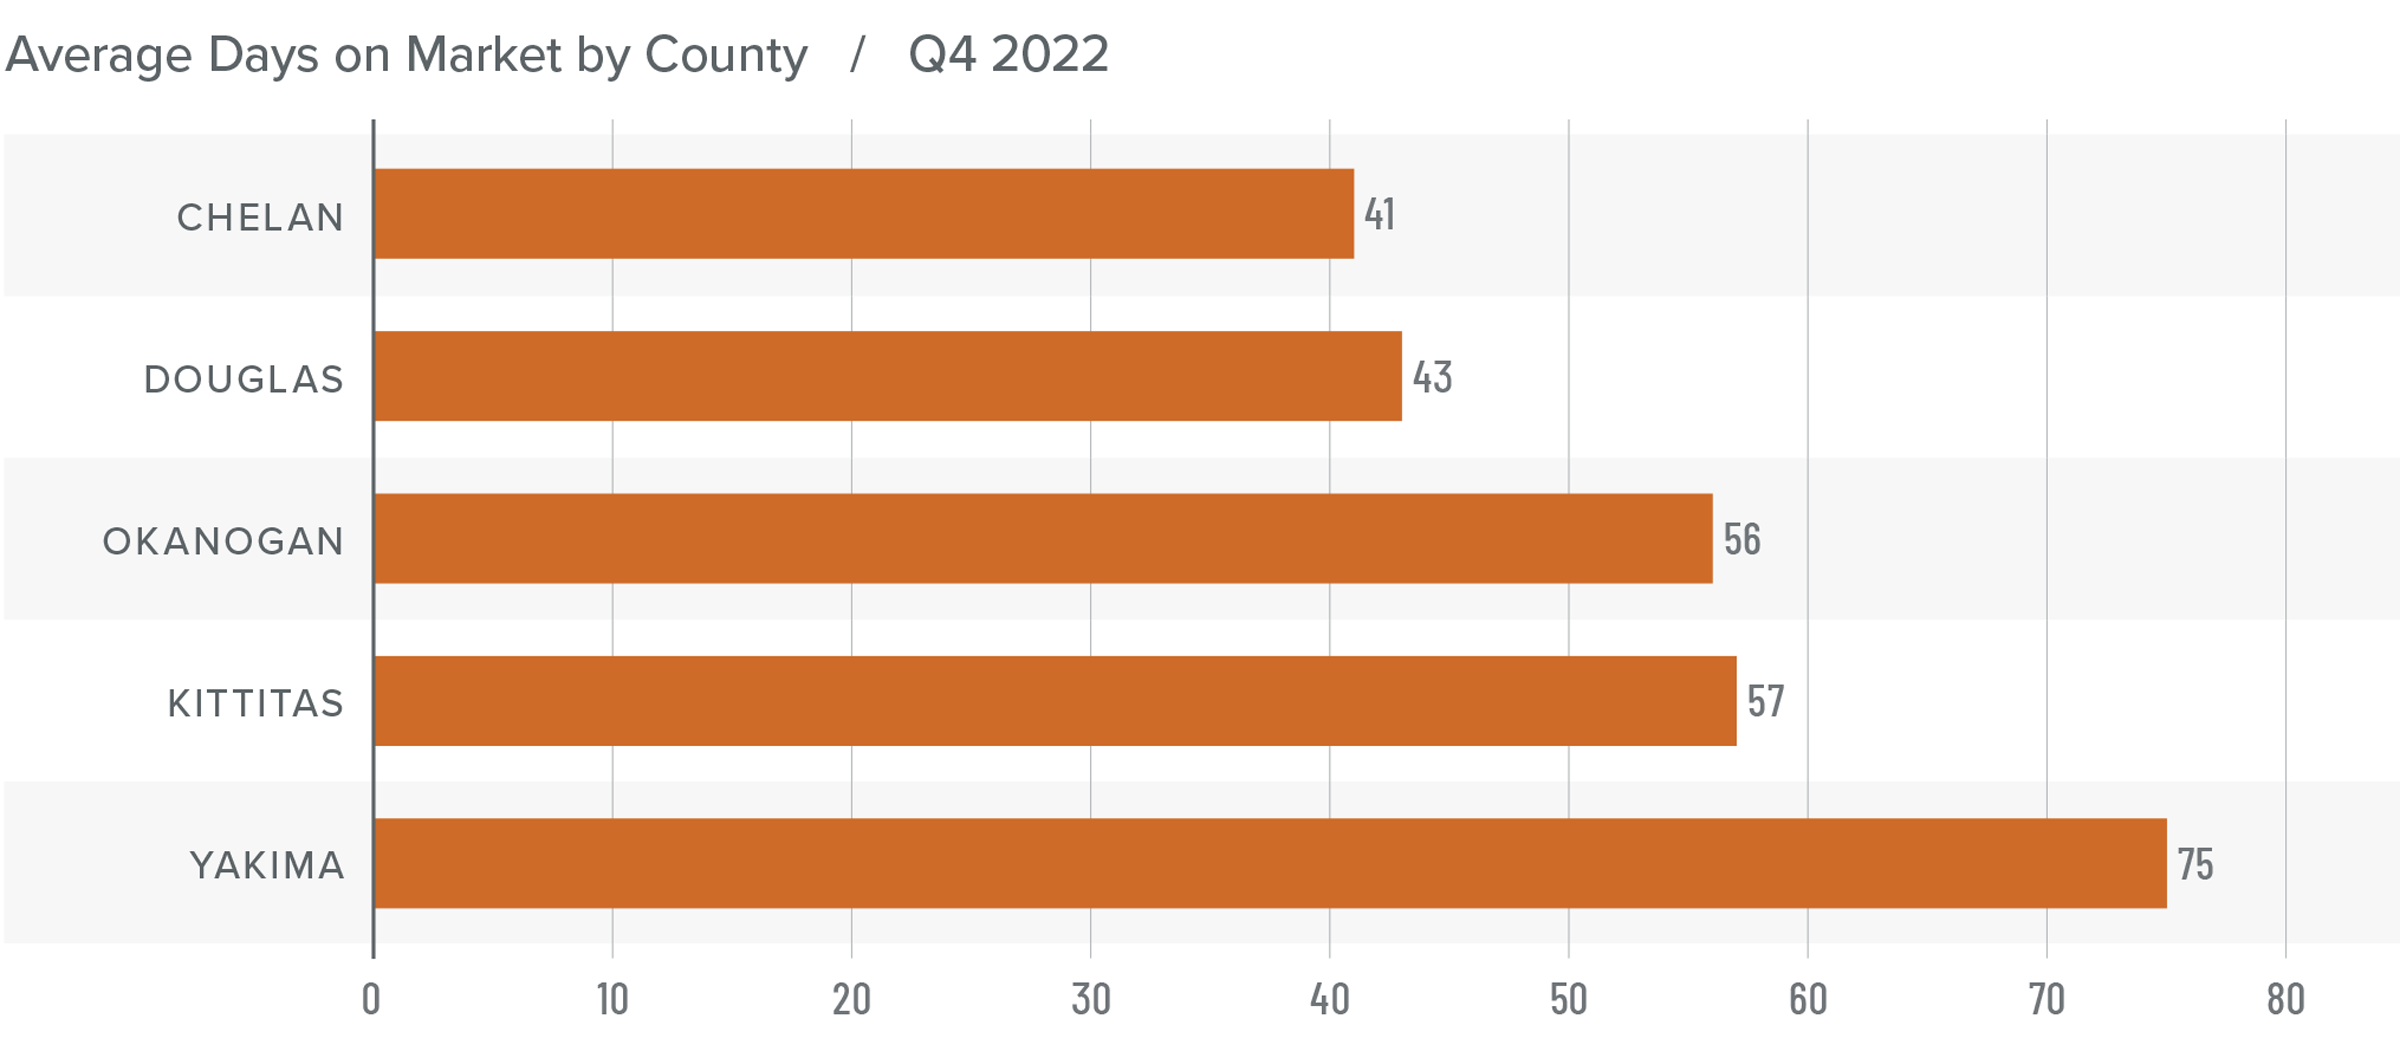
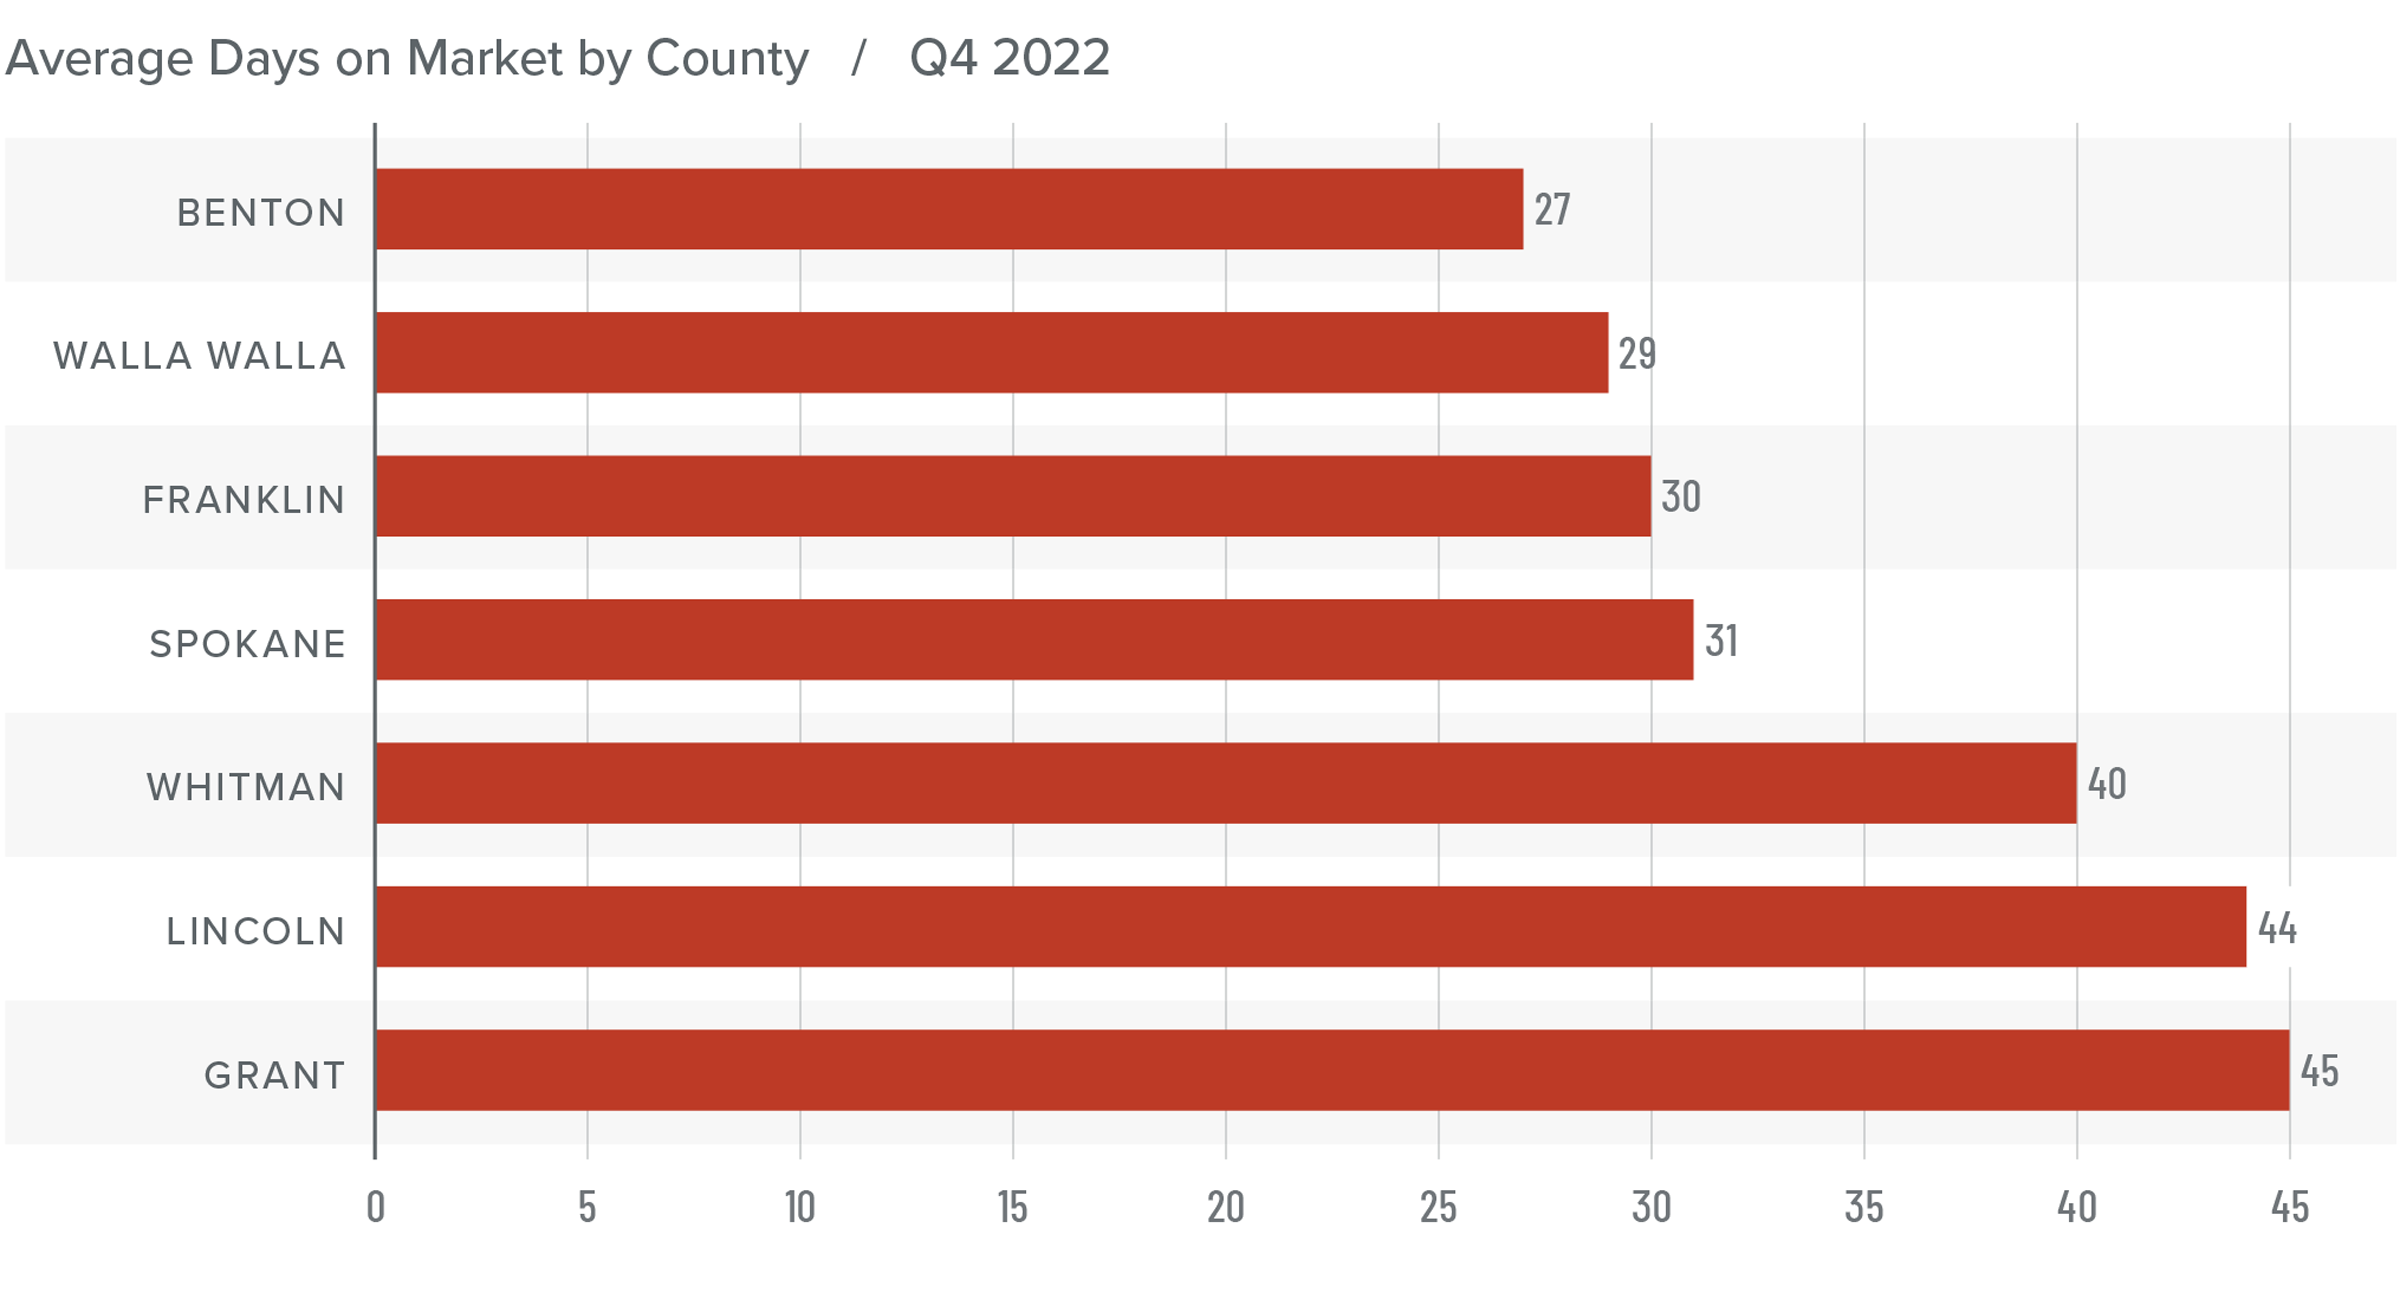
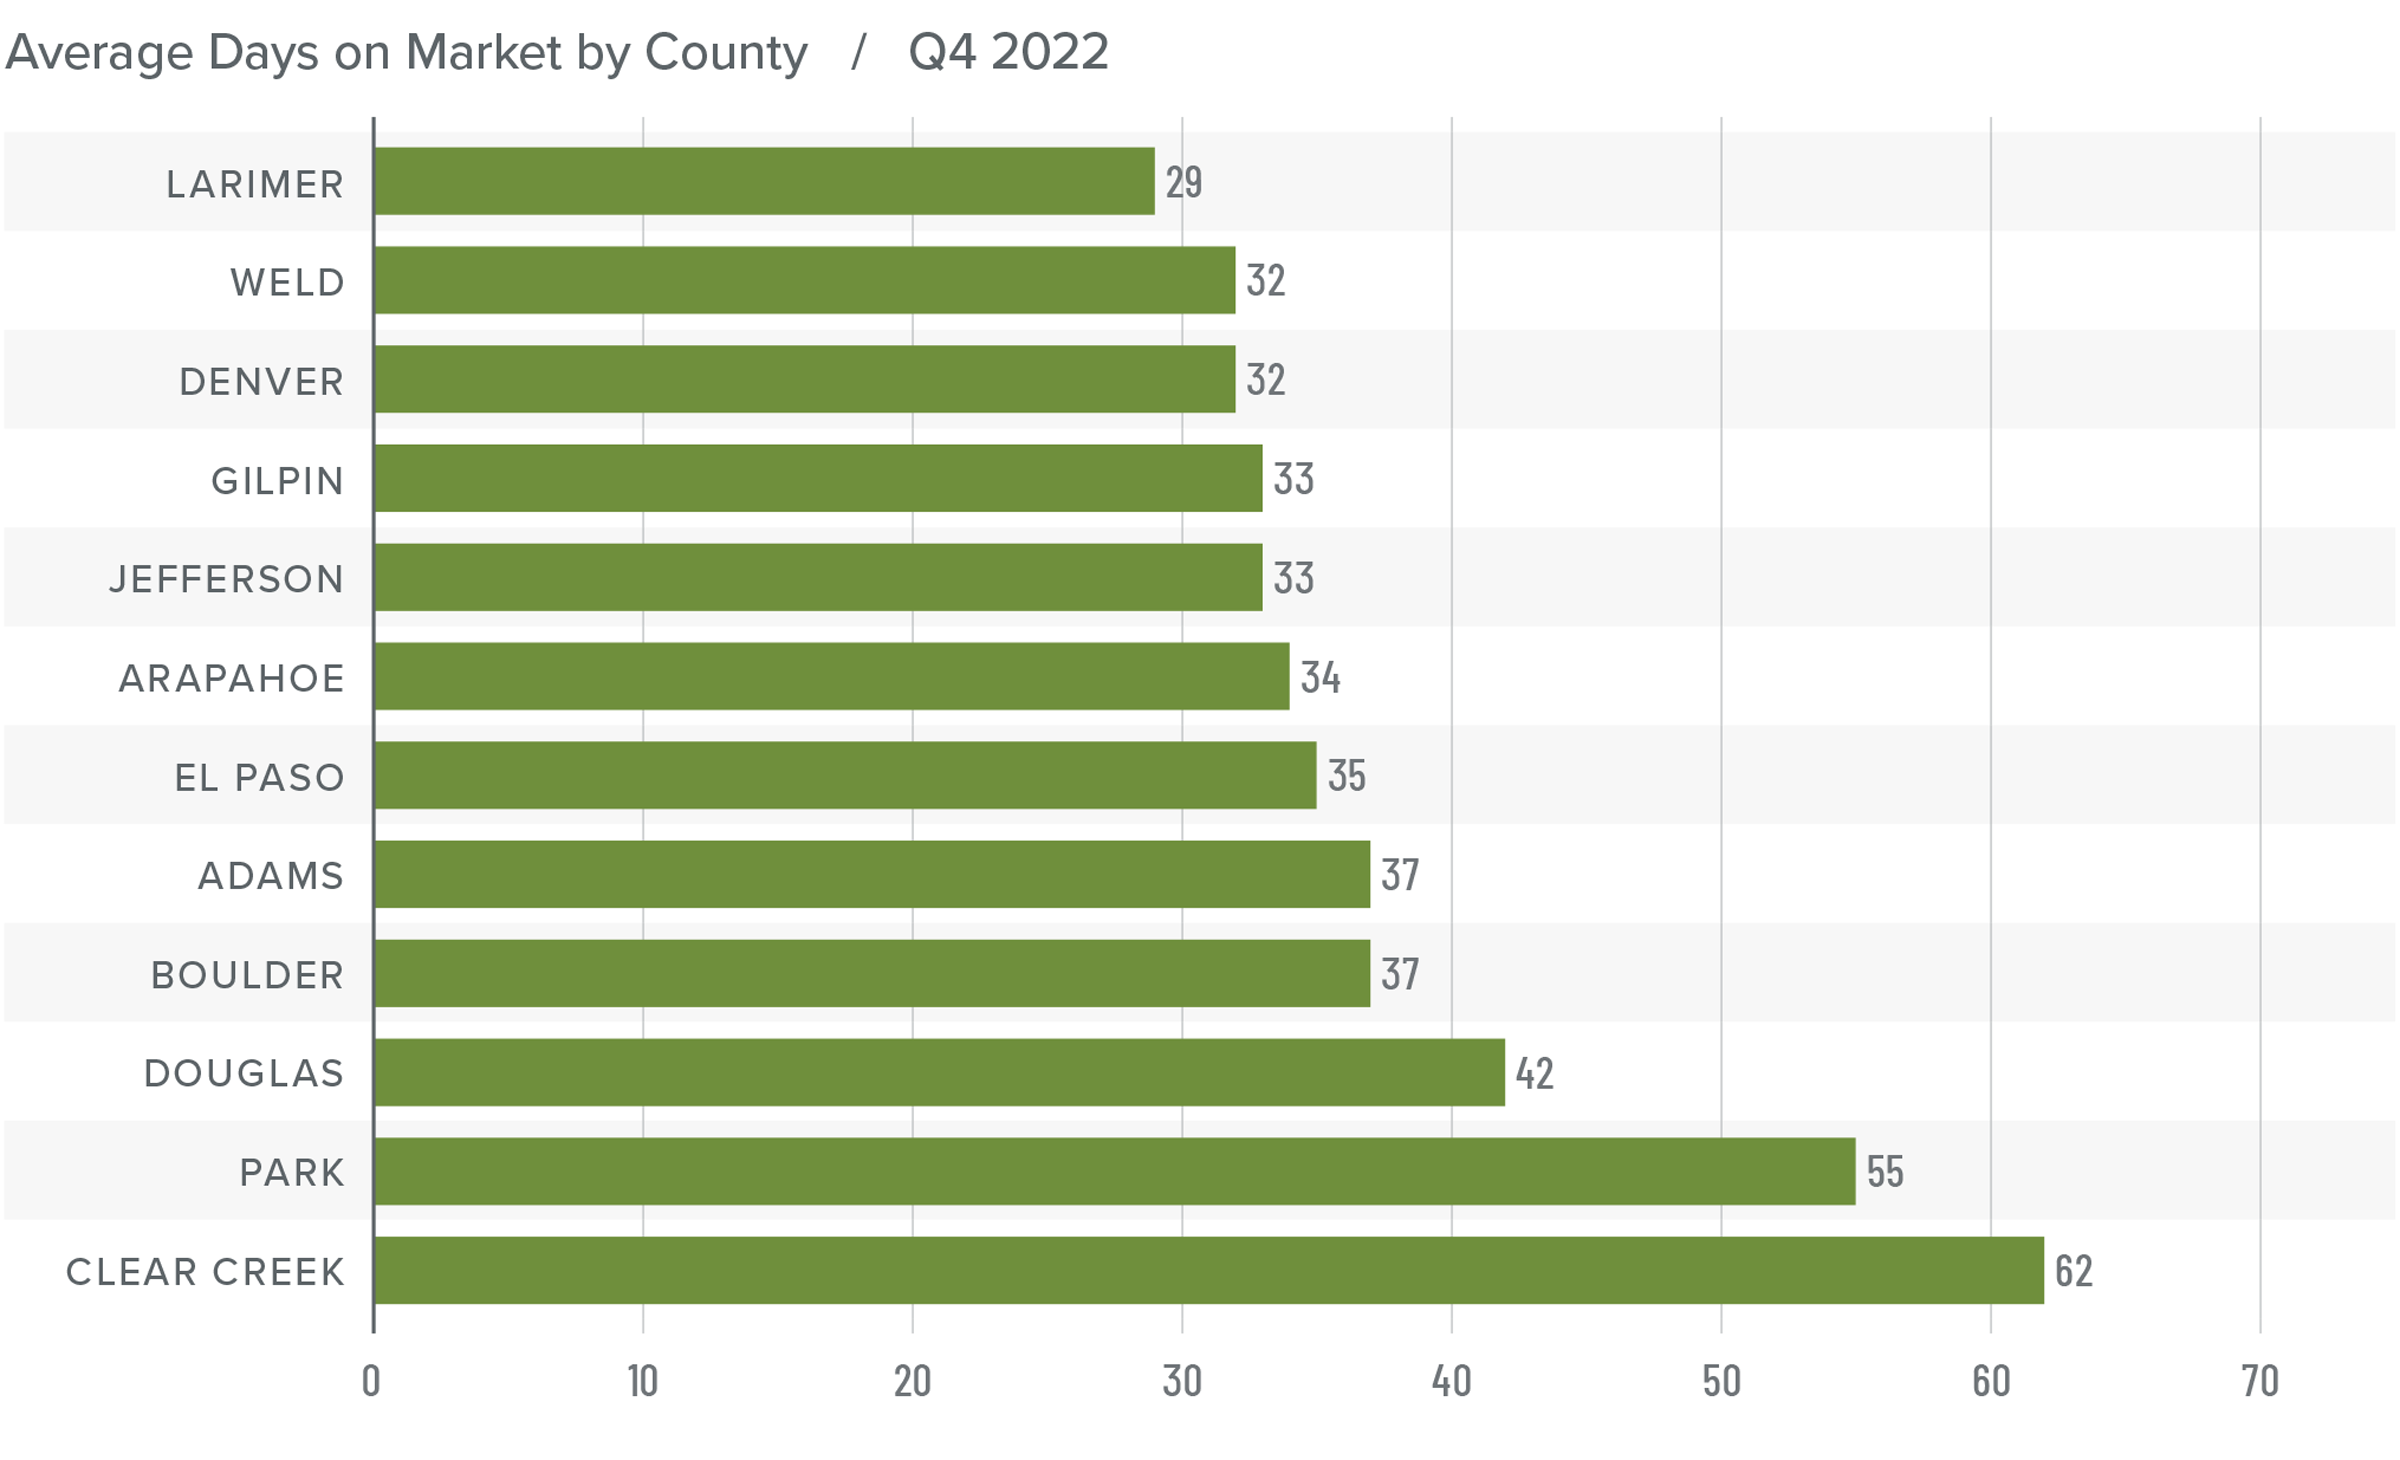
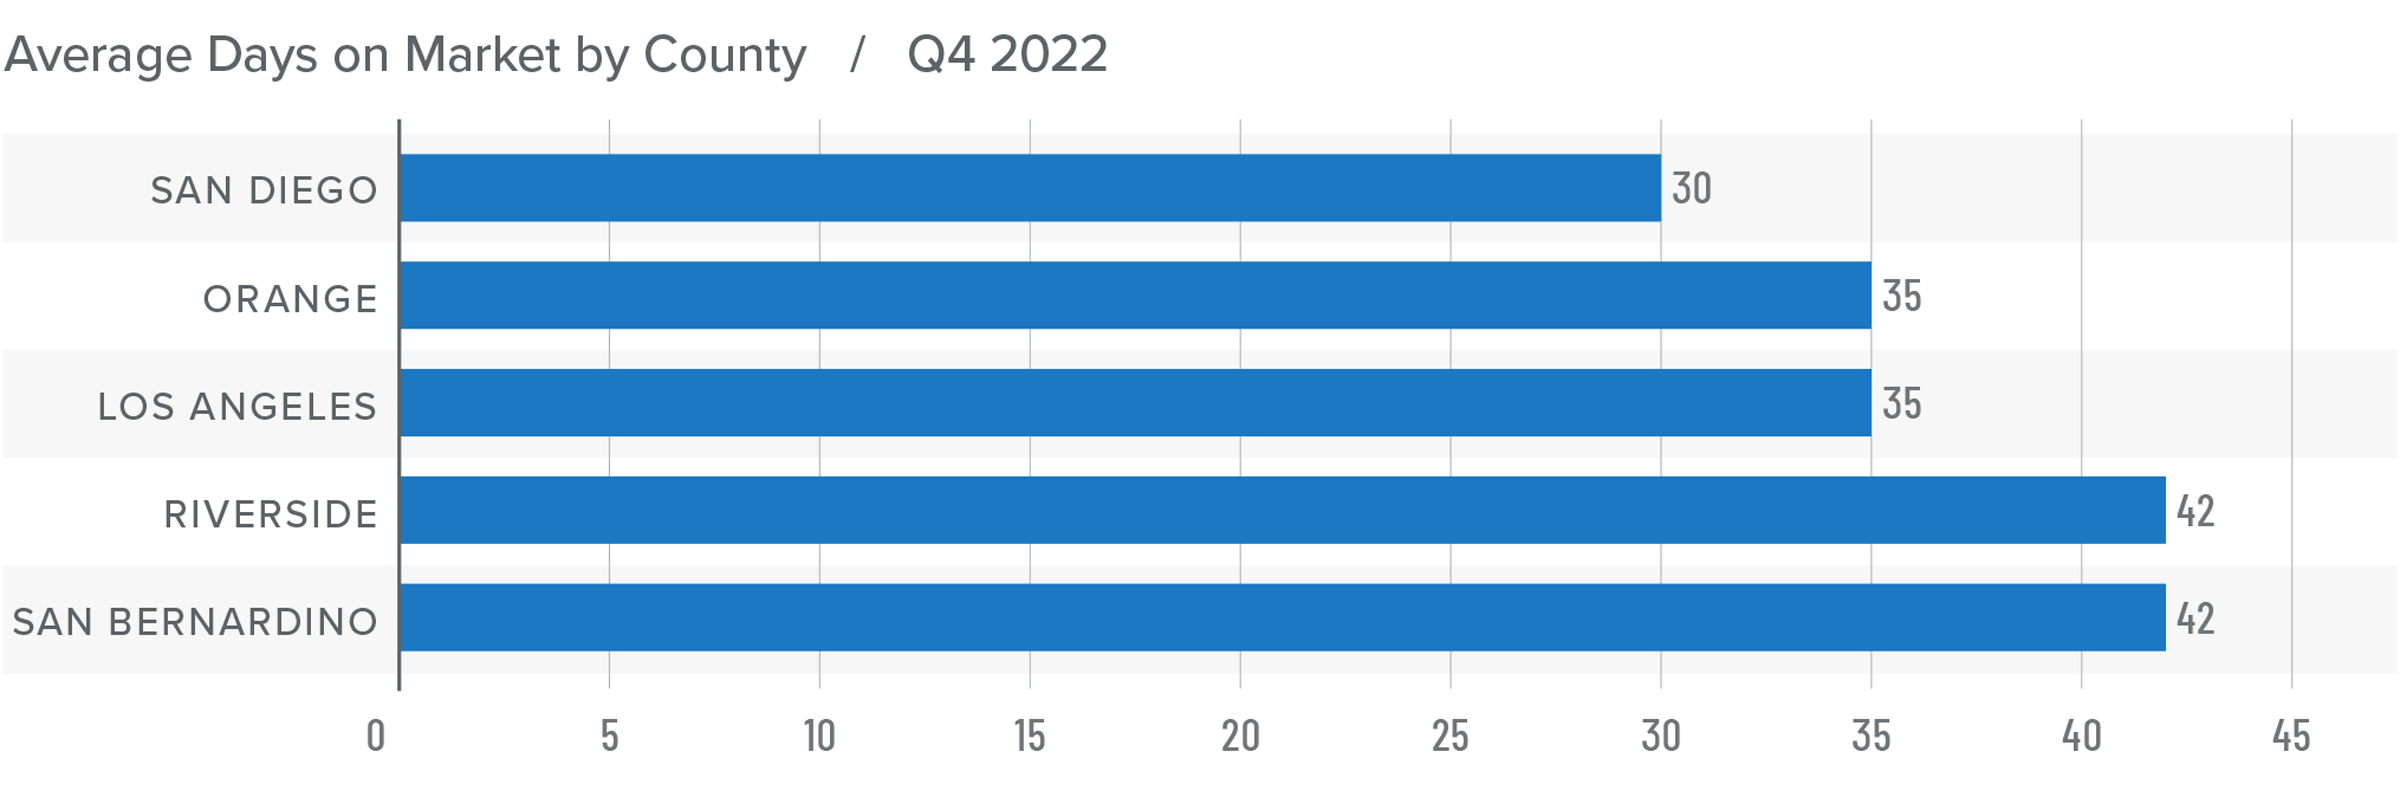
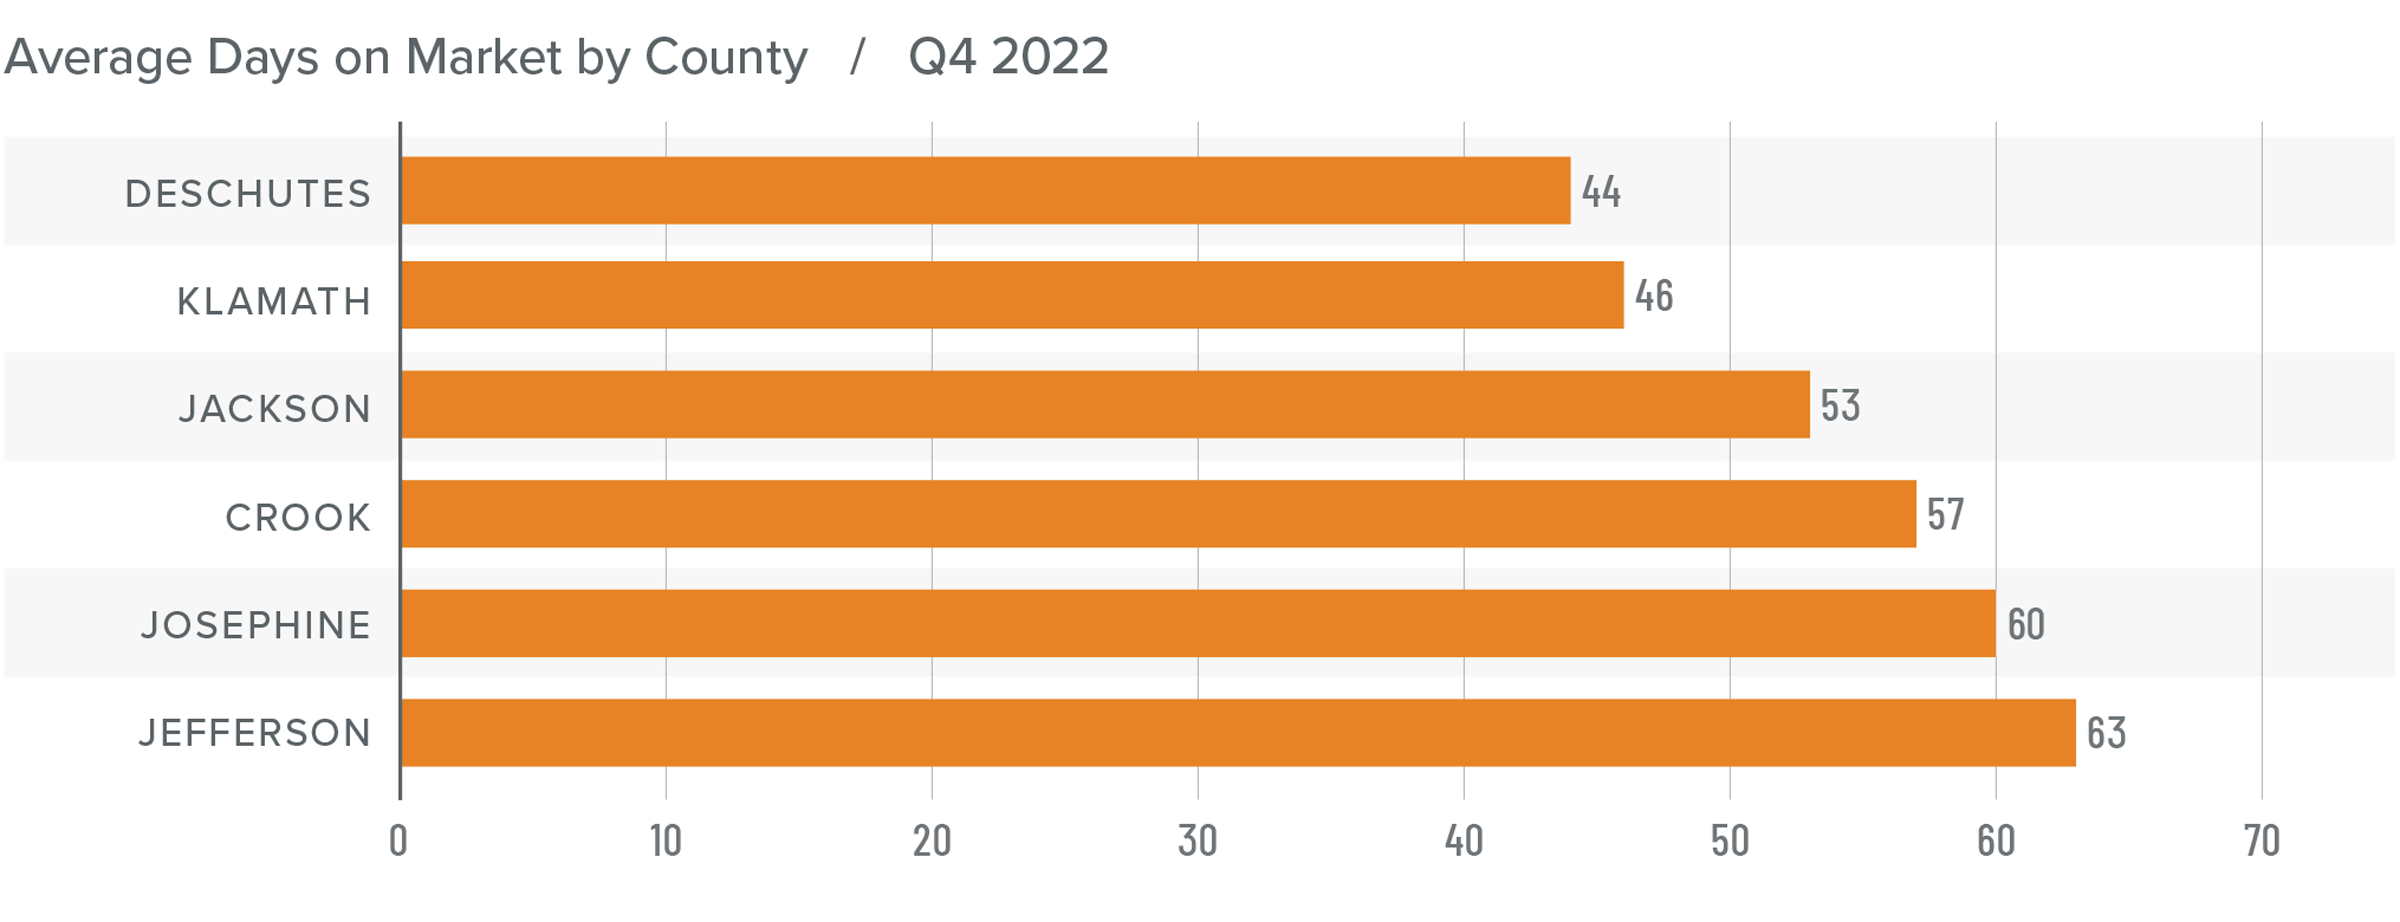
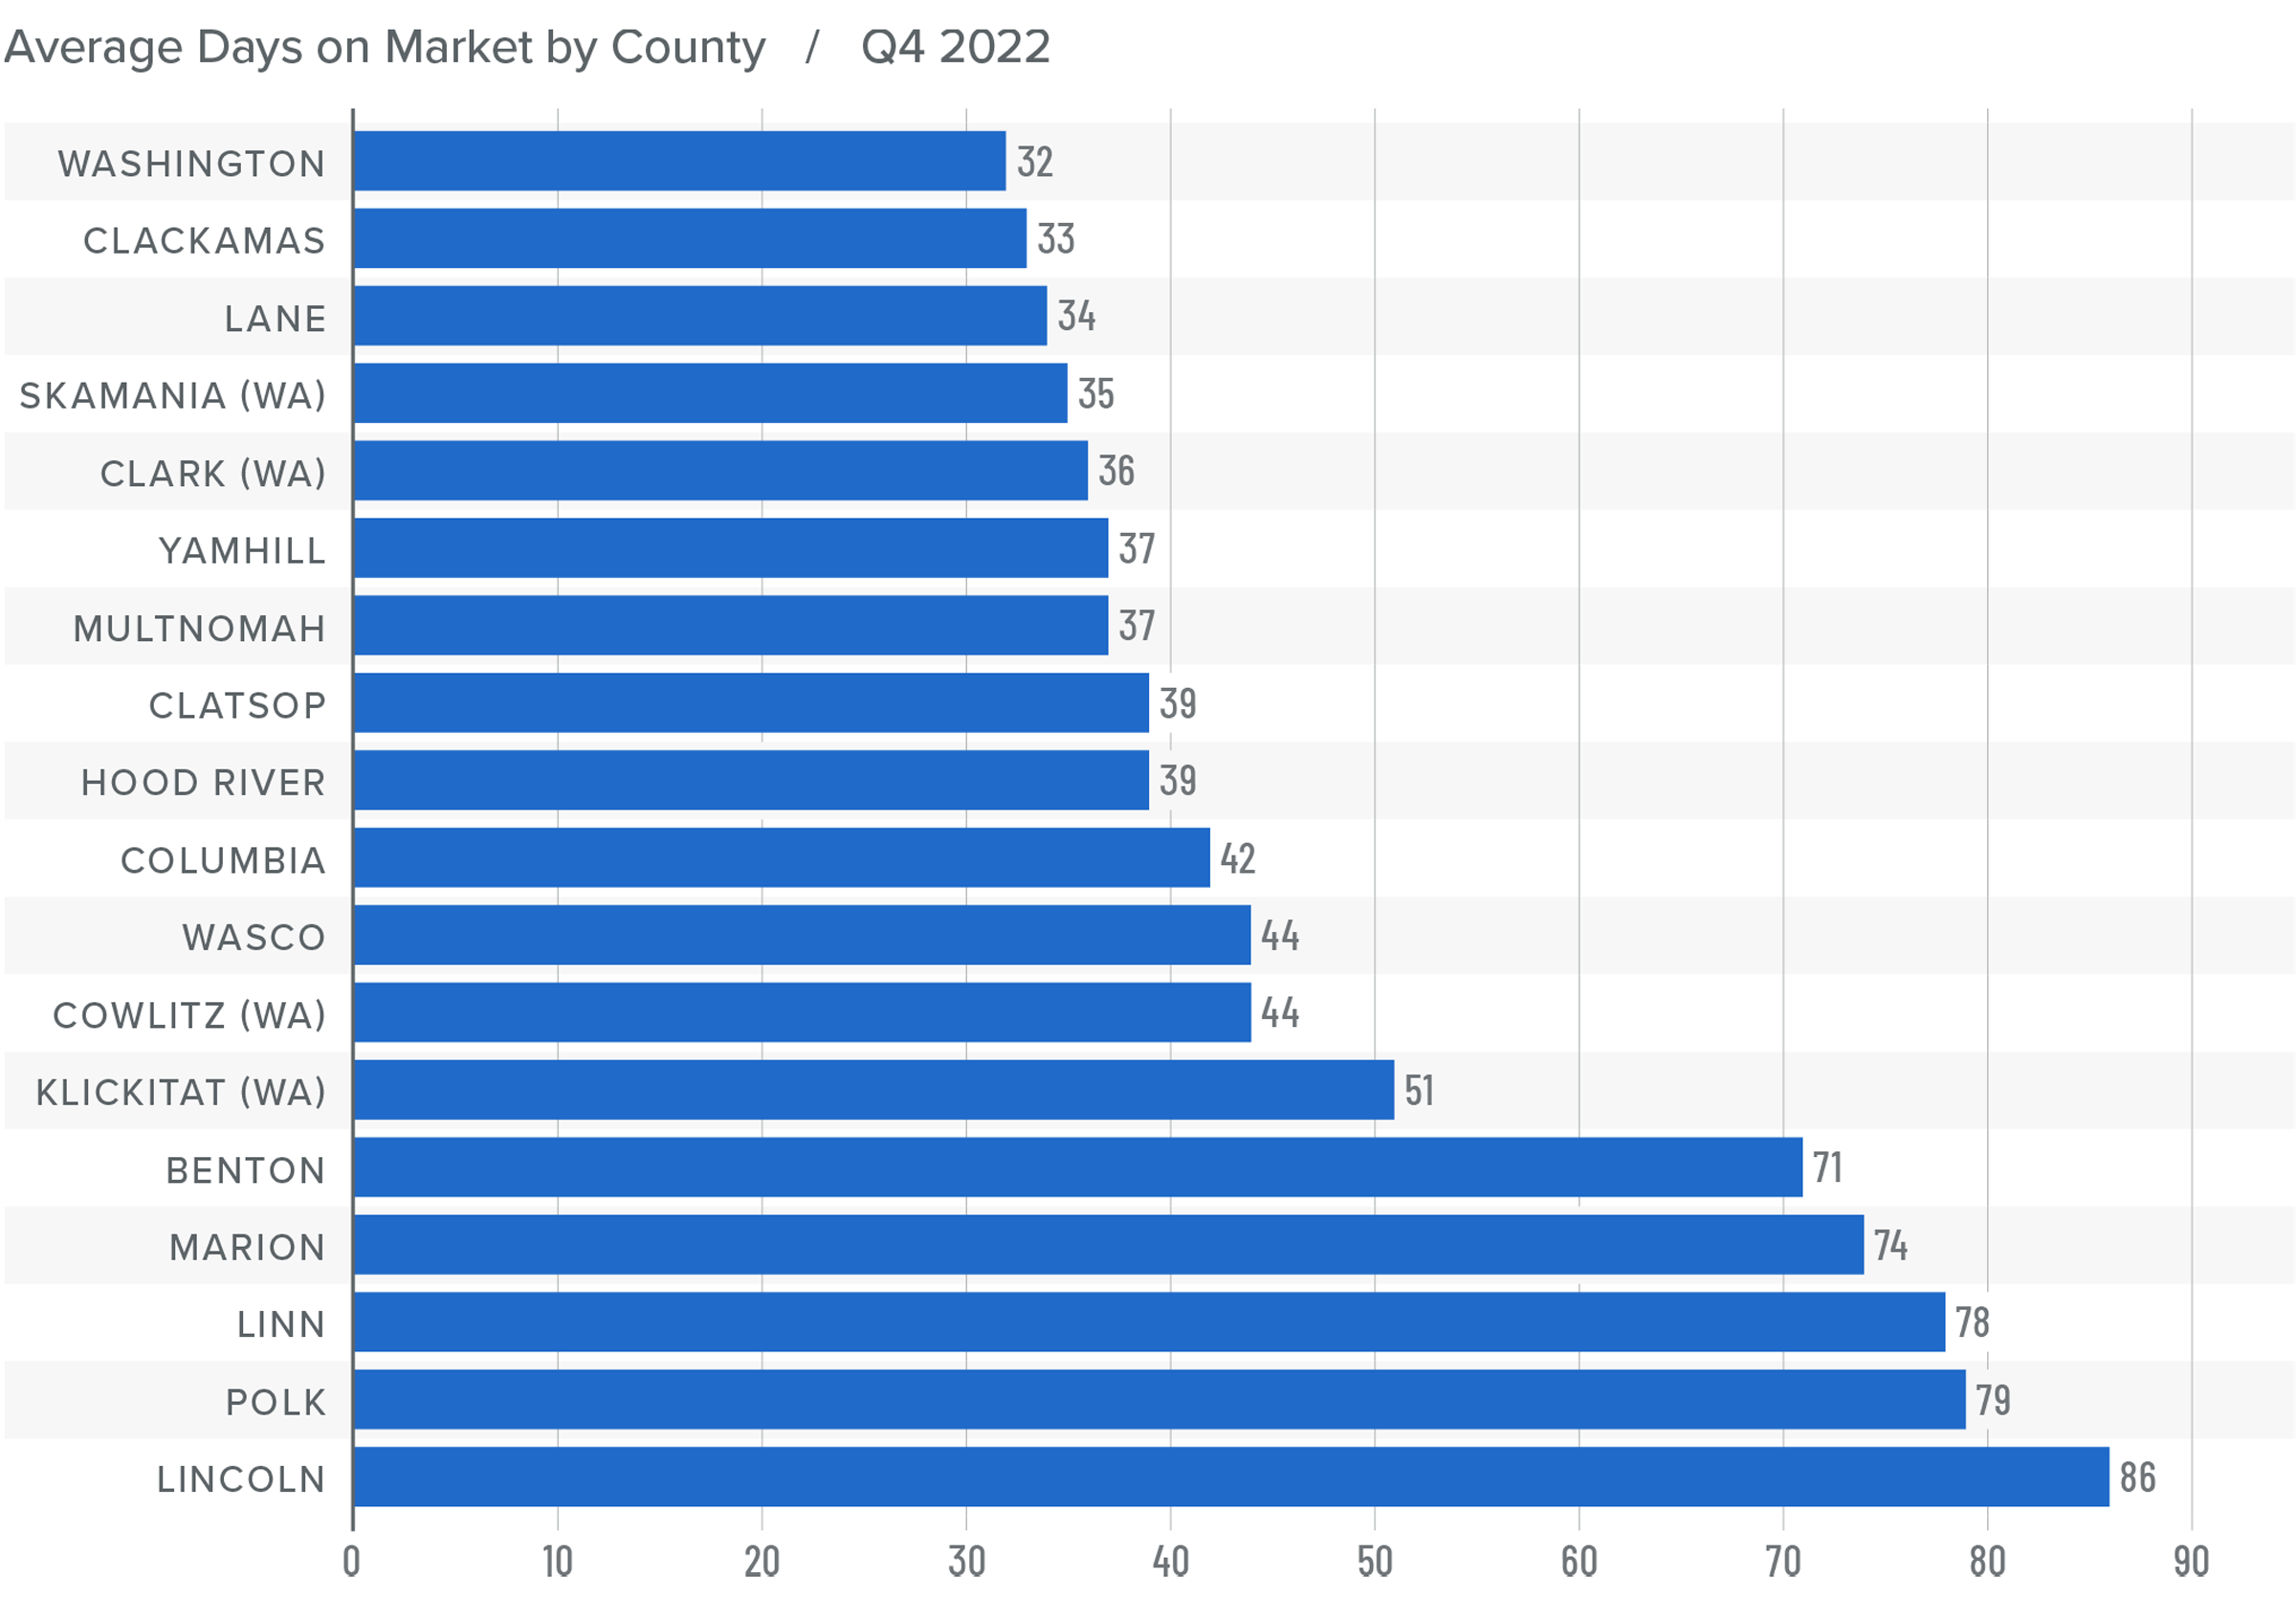
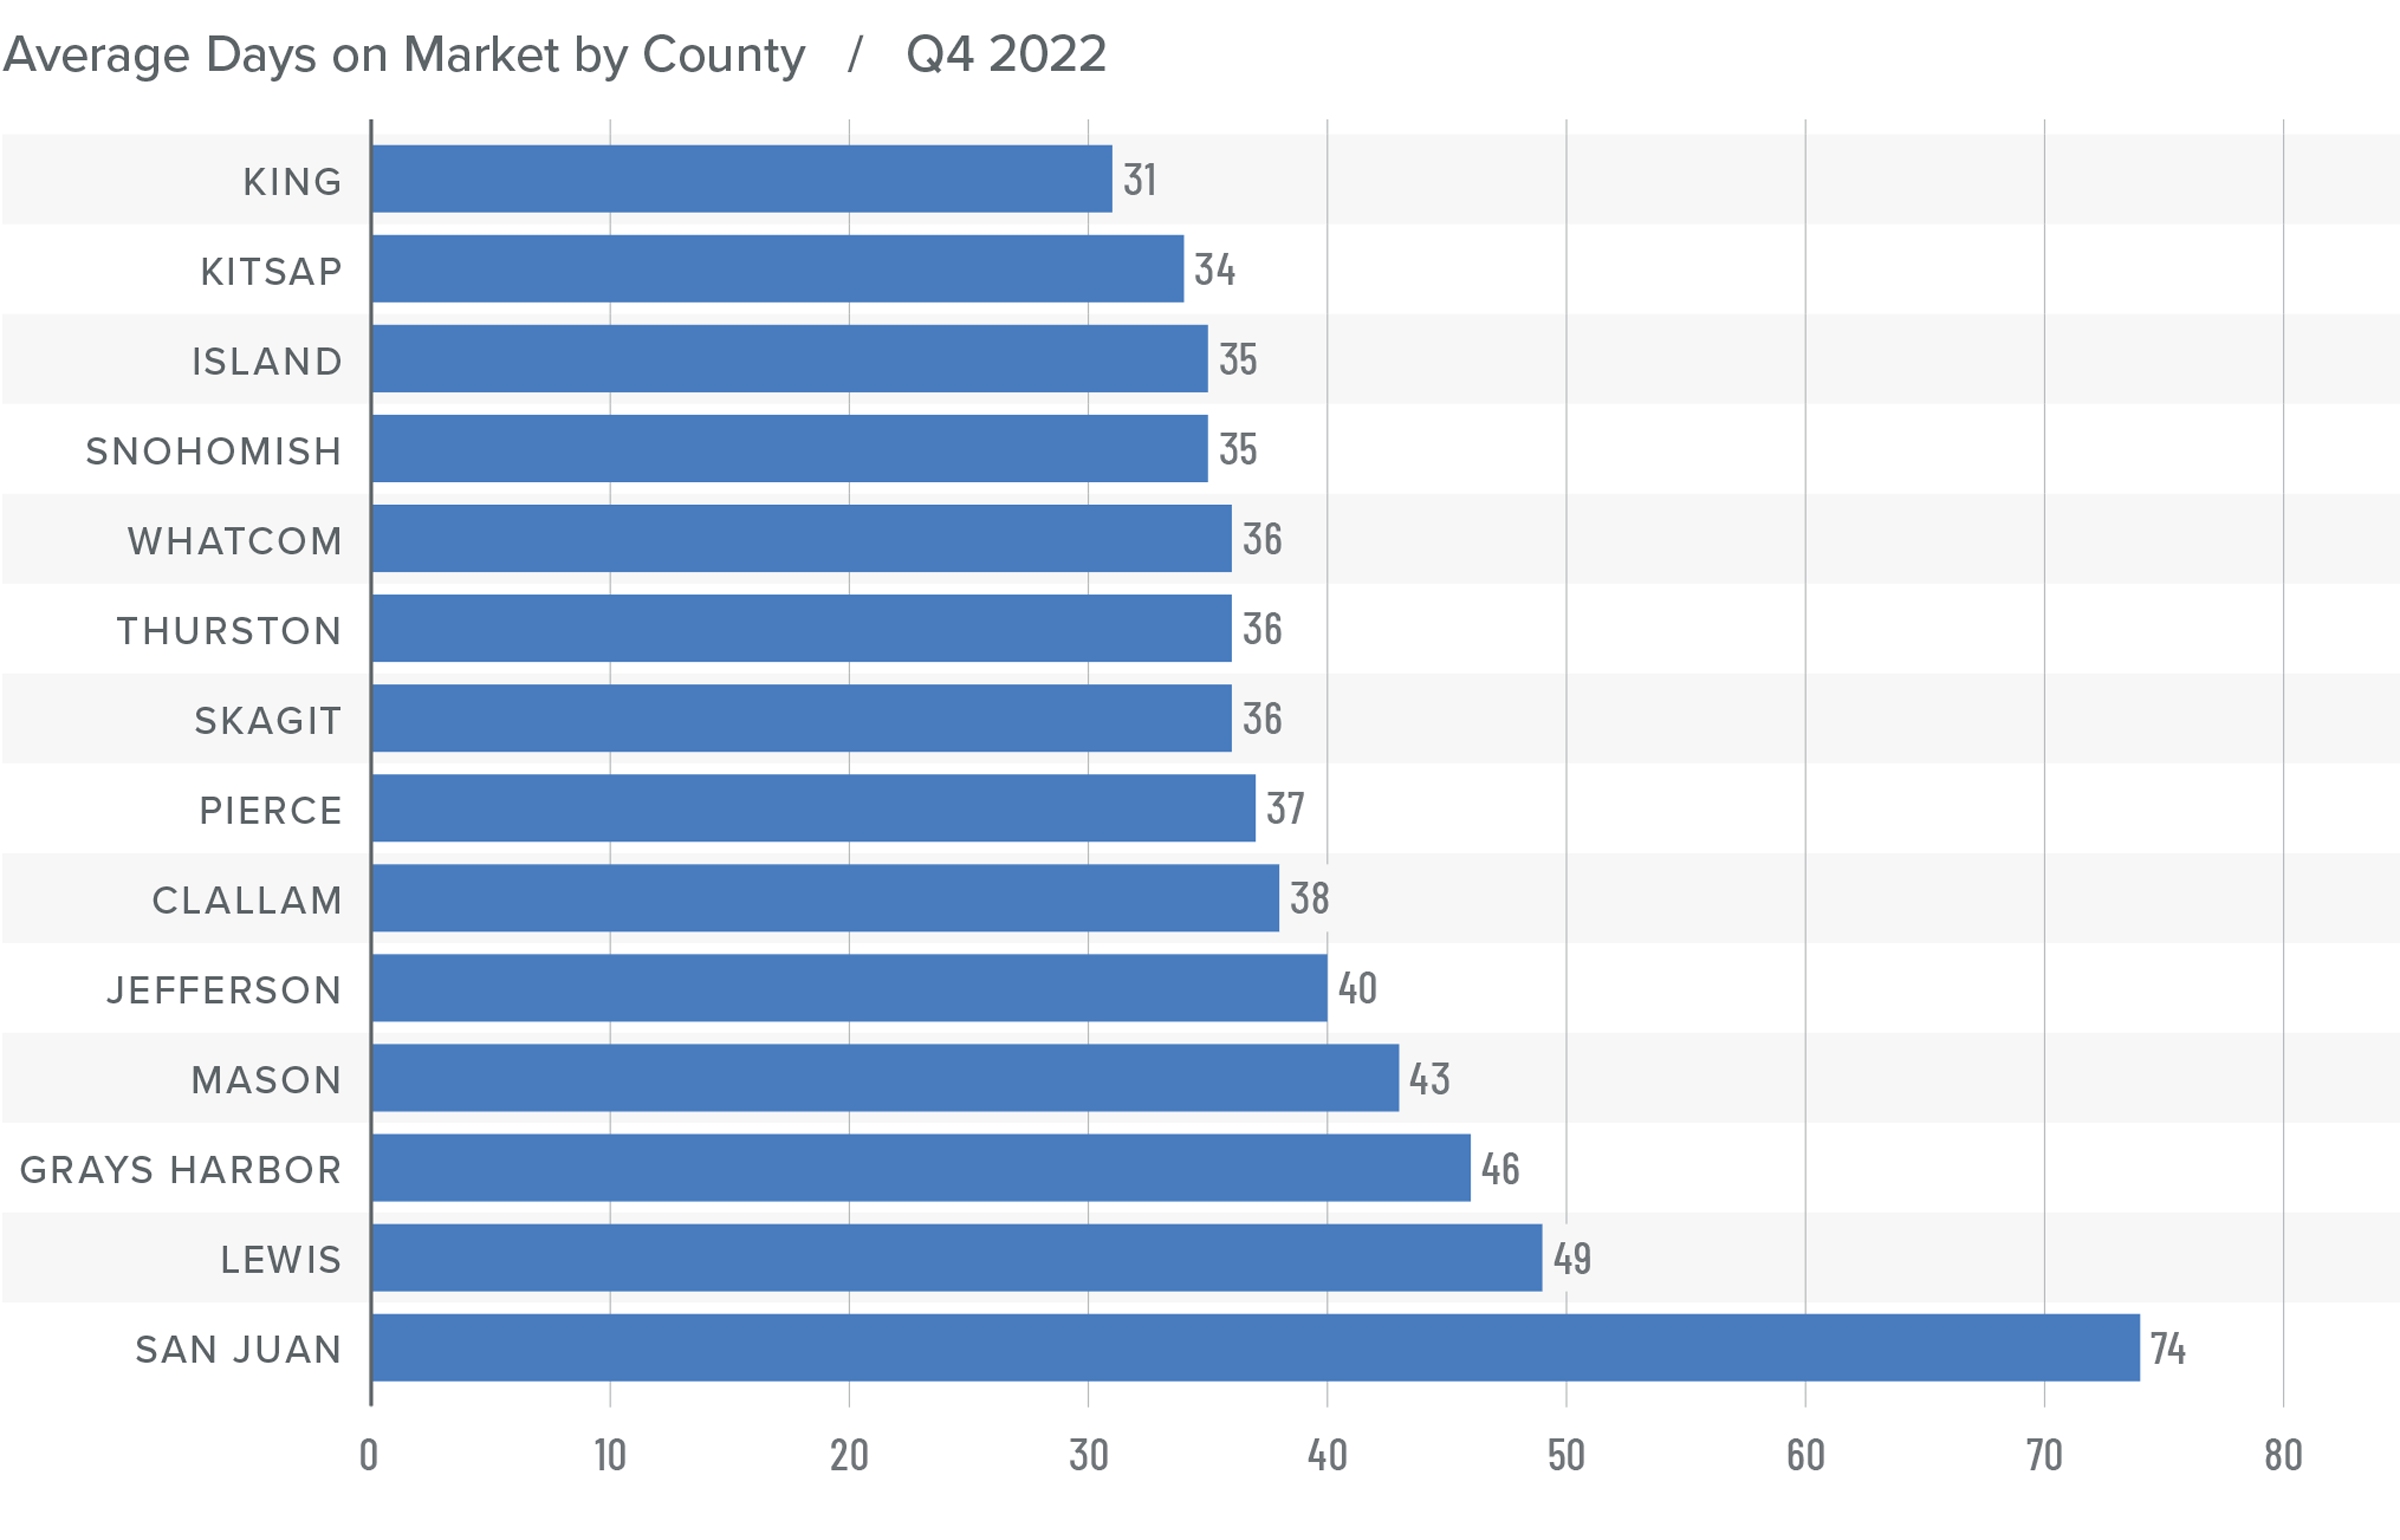
Montana Days on Market
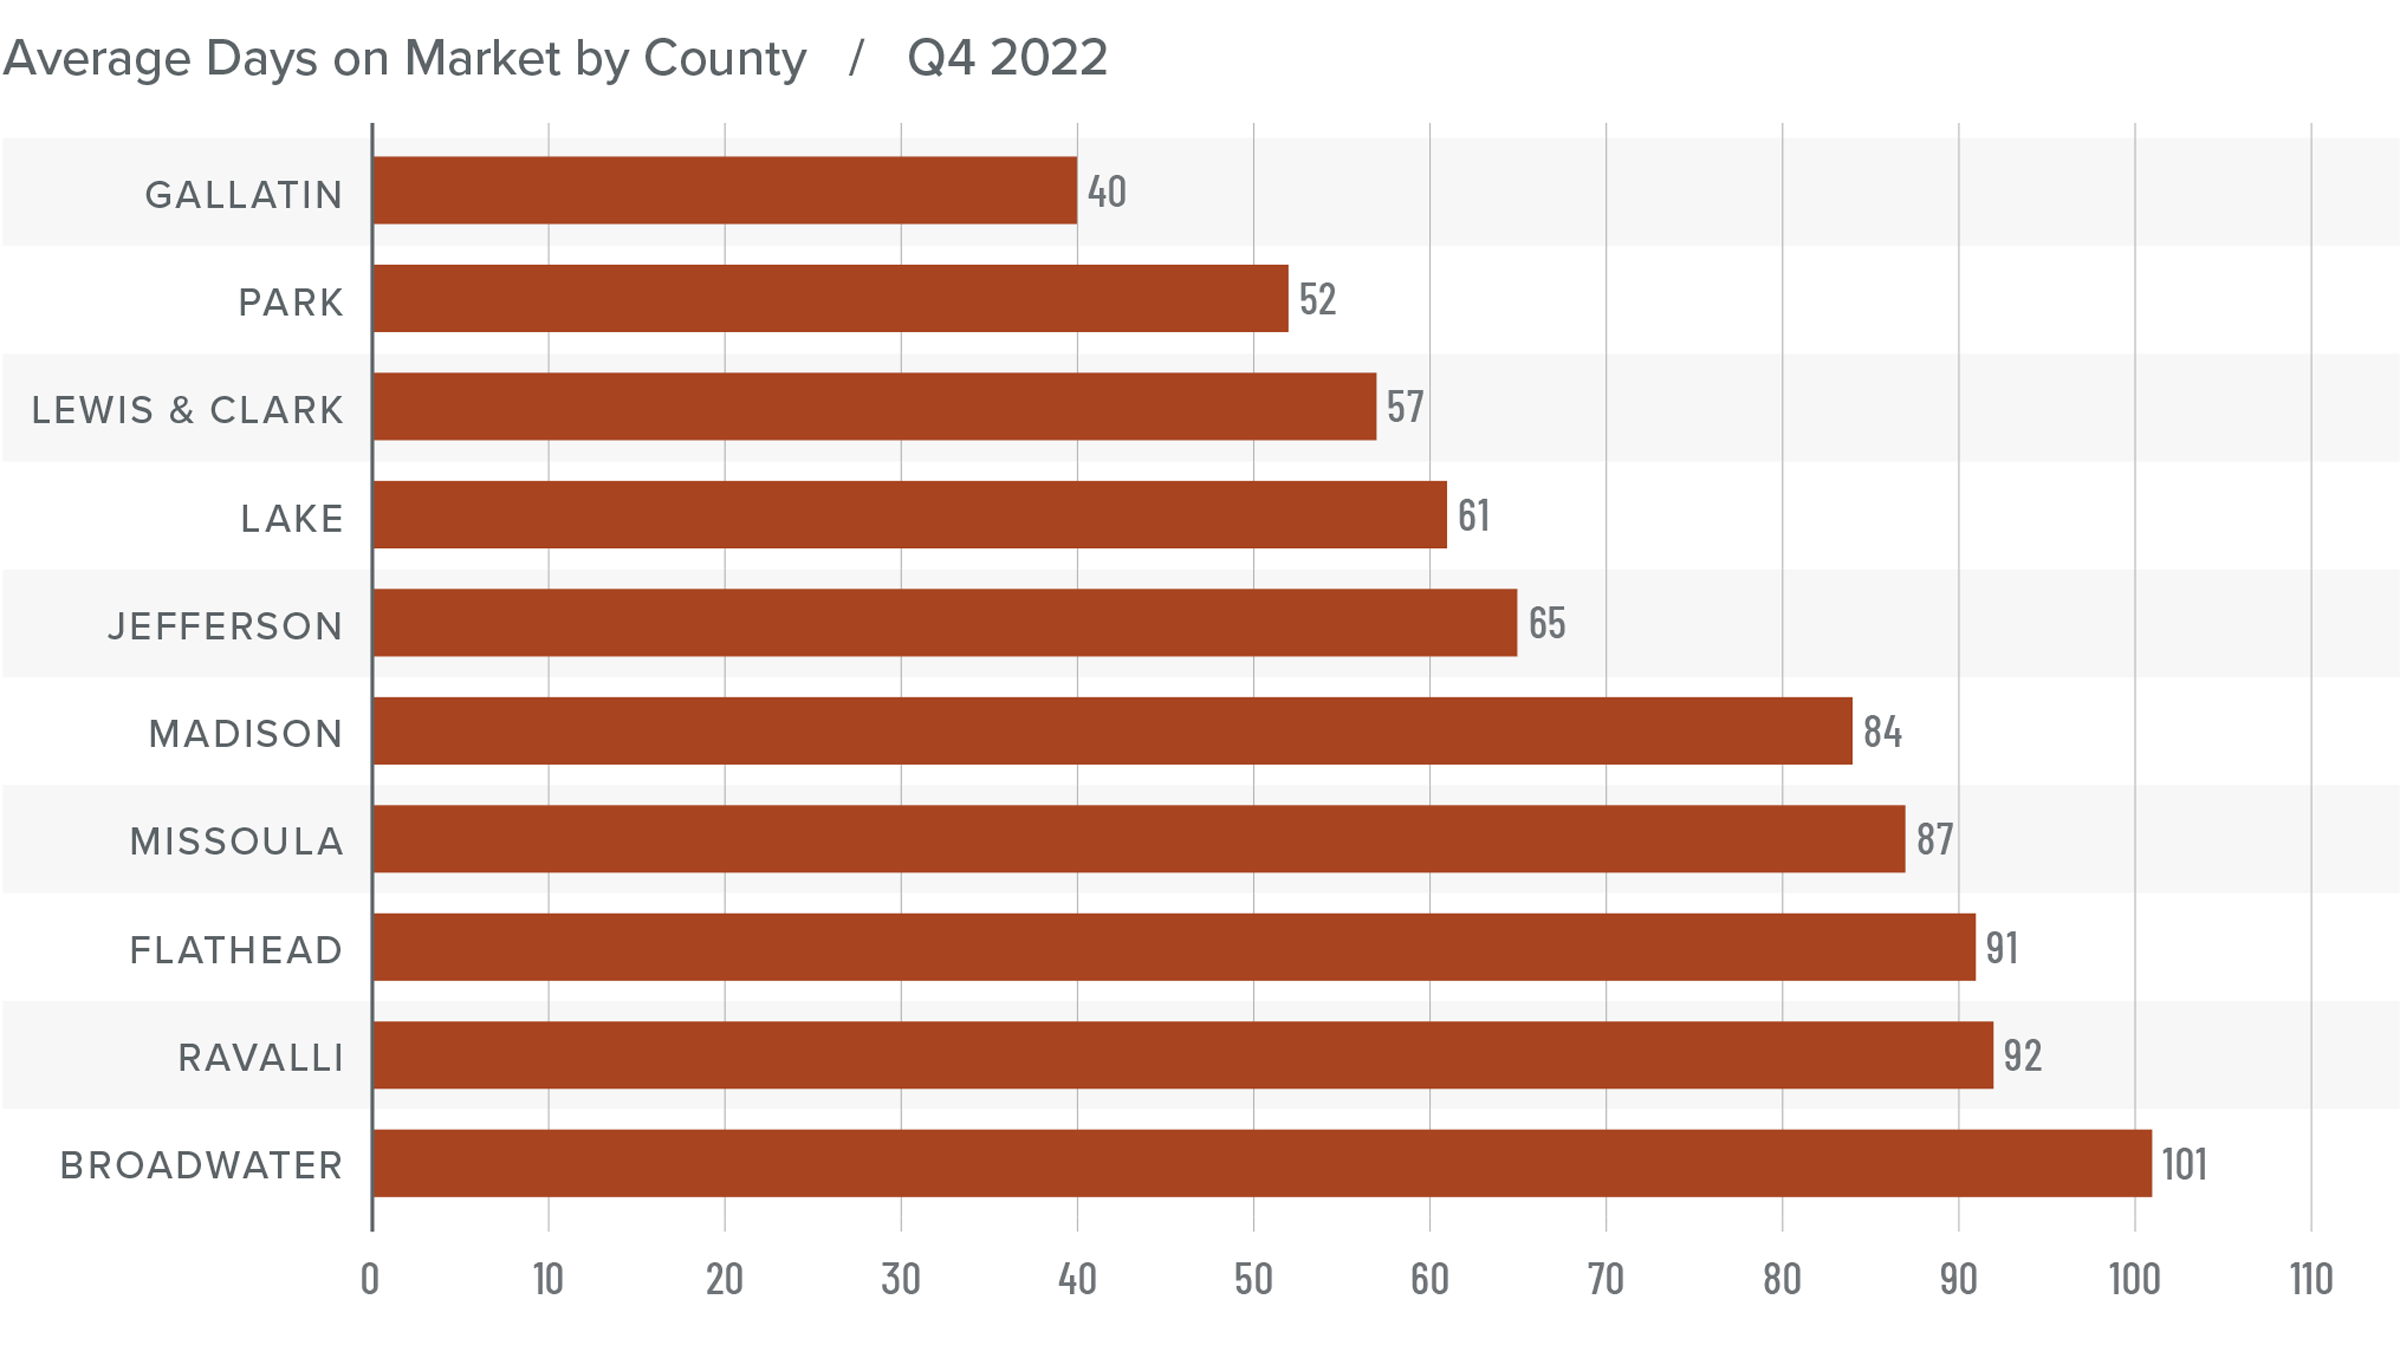
❱ The average time it took to sell a home rose eight days compared to the same period the prior year.
❱ Homes sold fastest in Gallatin County while homes in Broadwater County took the longest time to sell. Missoula, Lake, Lewis and Clark, and Jefferson counties saw market time fall year over year. Market time rose in the rest of the region.
❱ During the fourth quarter, it took an average of 73 days to sell a home in the markets covered by this report.
❱ Compared to the third quarter of 2022, average market time rose in all counties other than Lake, where it took an average of four fewer days to find a buyer.
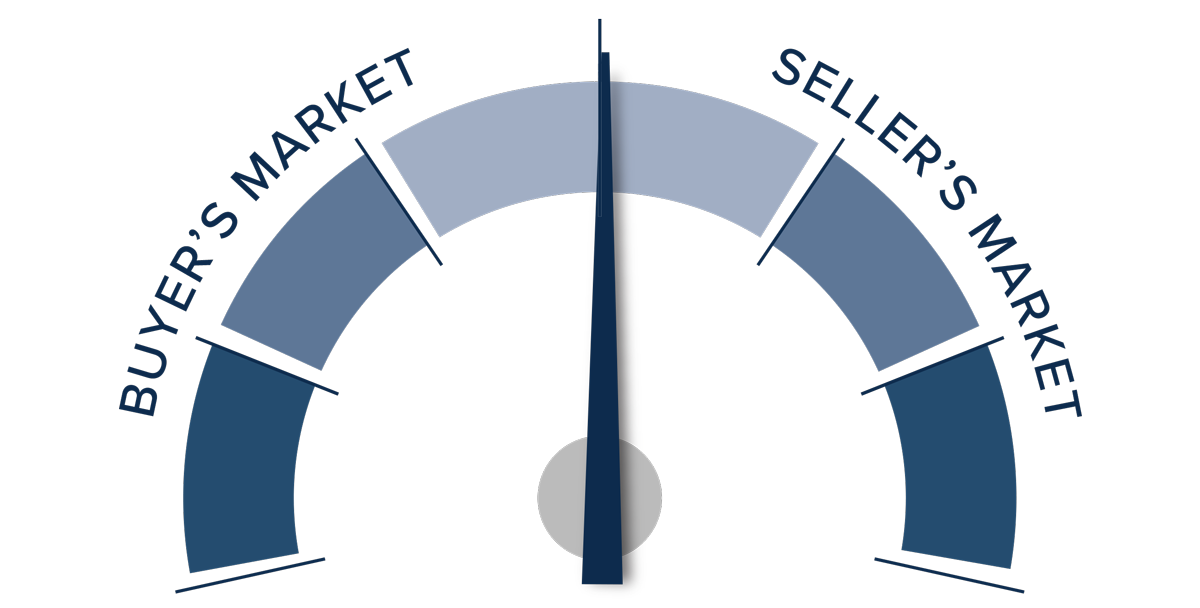
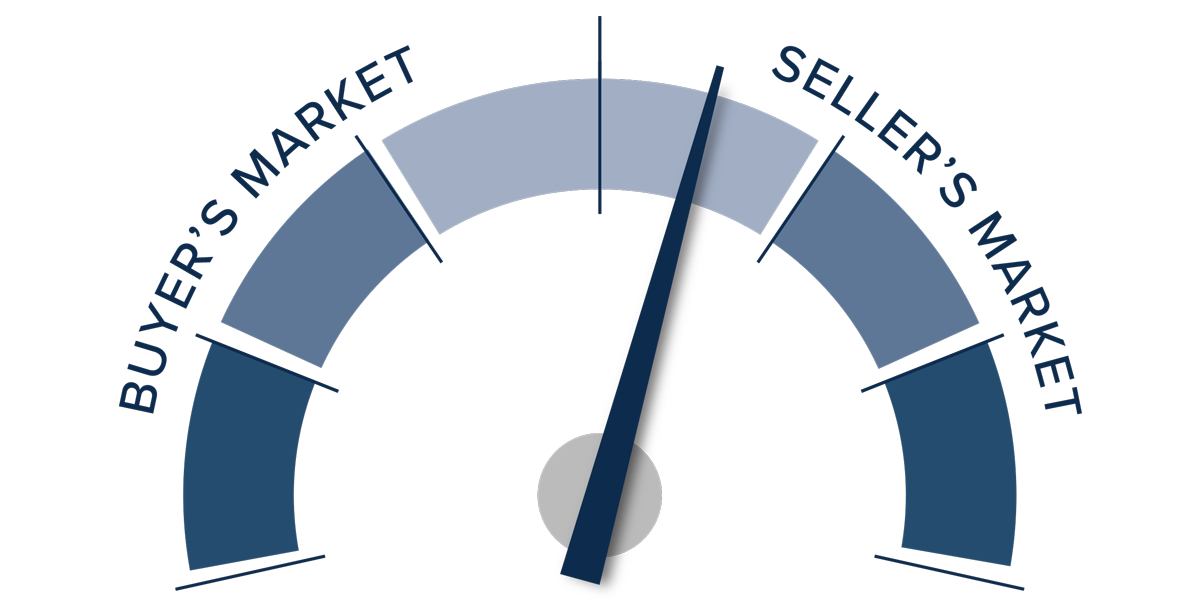
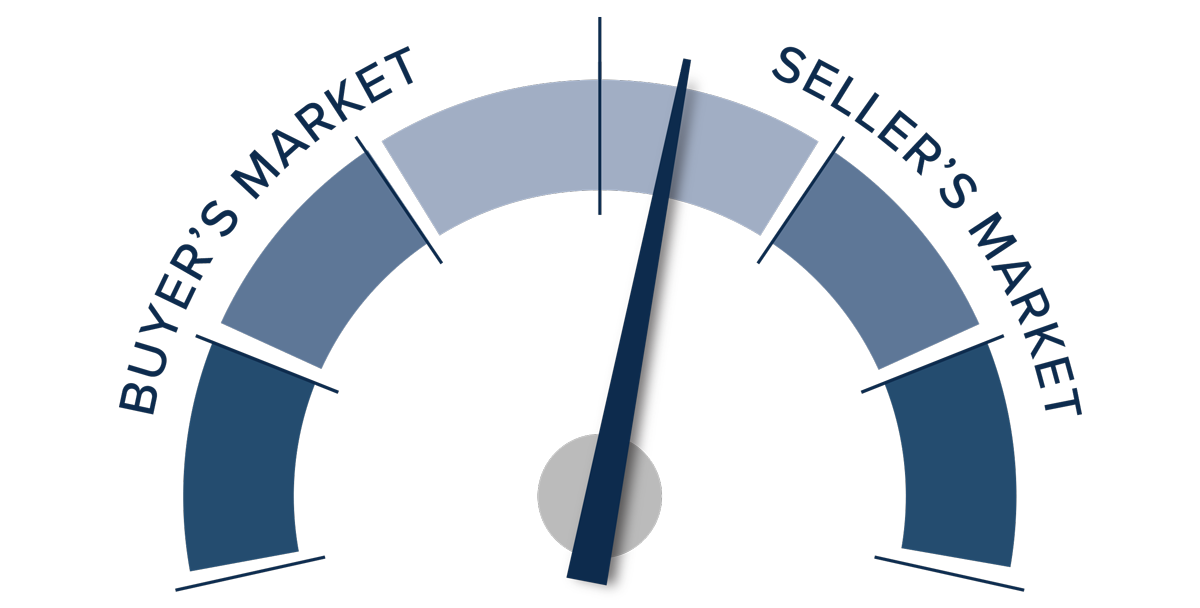
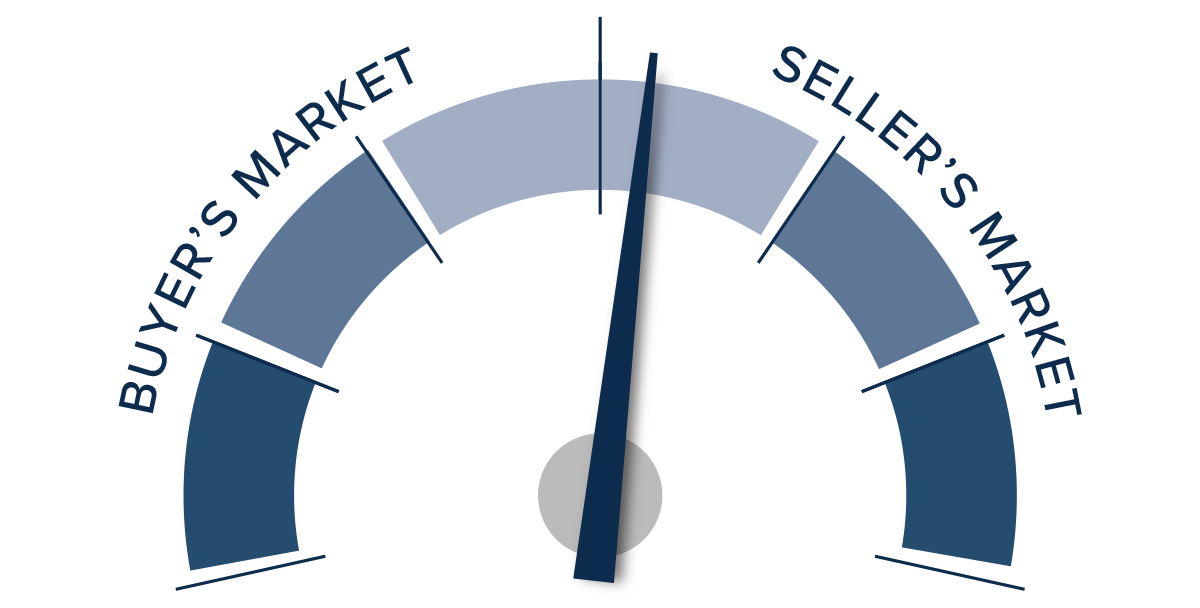
Conclusions
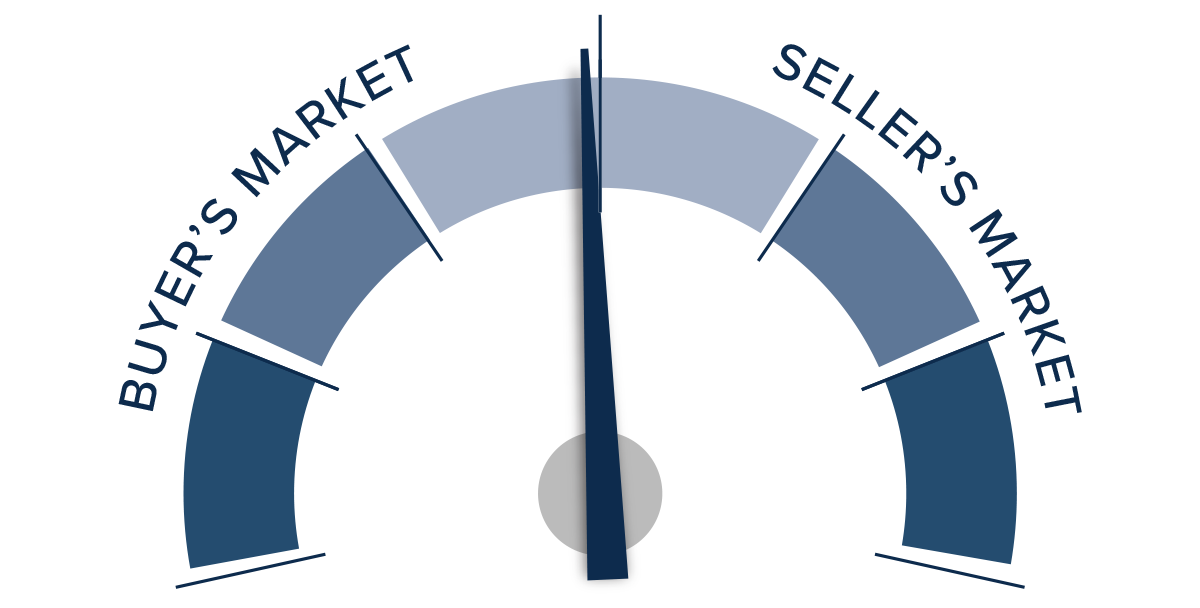
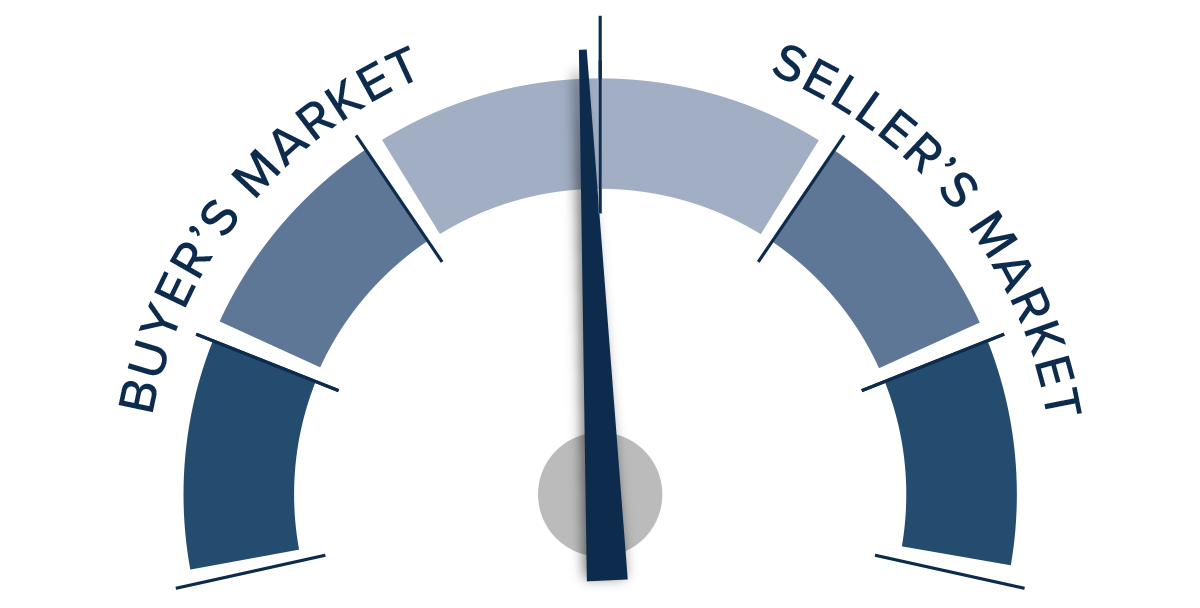
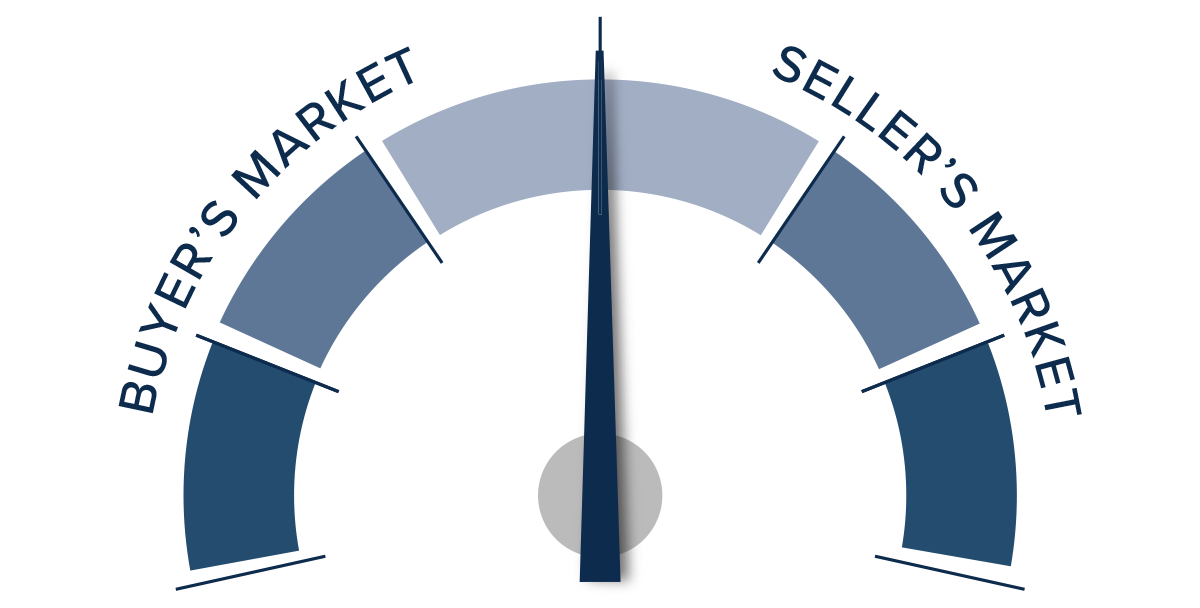
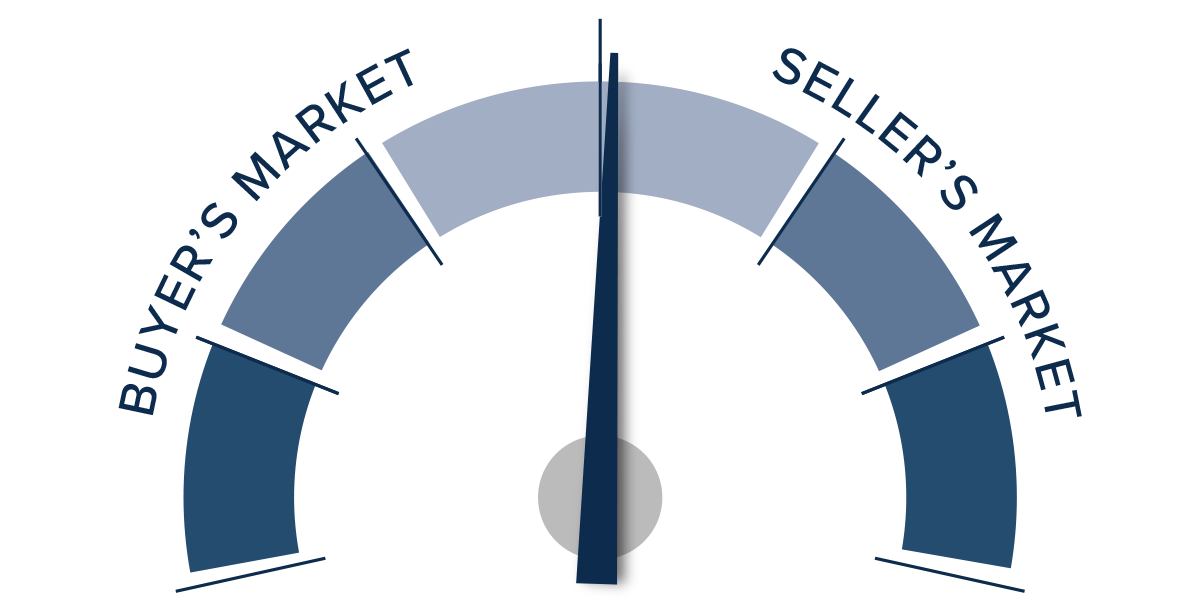
This speedometer reflects the state of the region’s real estate market using housing inventory, price gains, home sales, interest rates, and larger economic factors.
So far, the Montana housing market has been unaffected by the significantly higher financing costs that have led home prices to fall across much of the country. Whether the region can continue to move through 2023 without seeing any substantial drop in home values remains to be seen, but it appears to be in a far better position today than most states. Pending sales in the quarter fell across most counties contained in this report, but whether this can be attributed to slower demand or simply the fact that inventory levels have pulled back is also unclear.
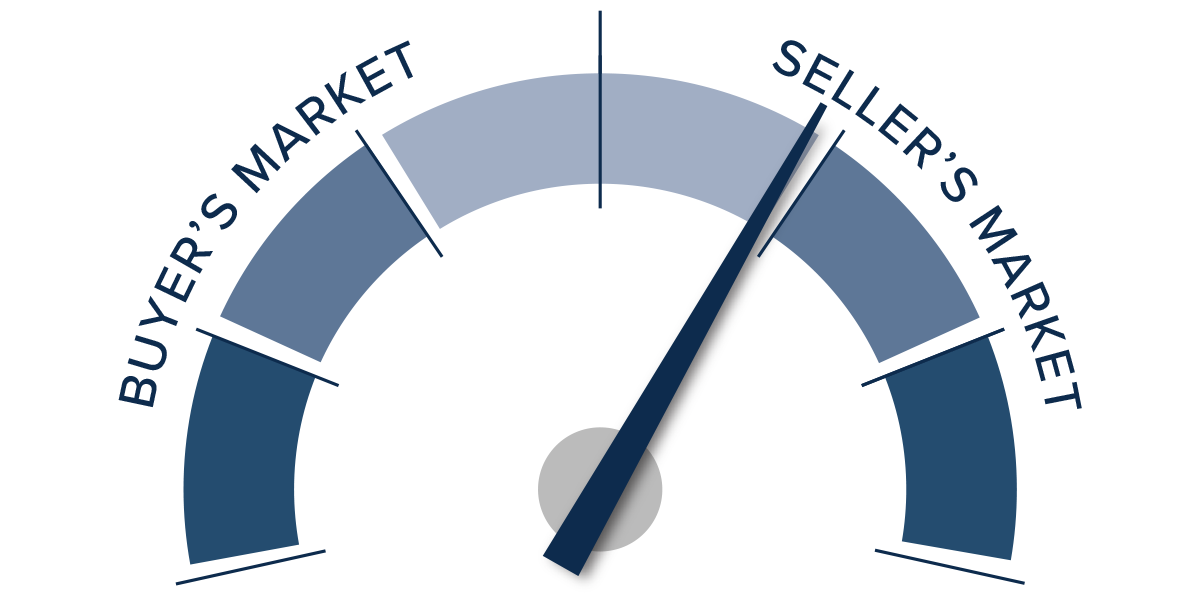
What is clear is that the market remains resilient. For this reason I am not moving the needle more in favor of buyers, unlike most markets across the U.S. Instead, I am leaving it in the same position as the third quarter of 2022. Hopefully, the spring market will provide more clarity about what we can expect from the rest of the year.
About Matthew Gardner

As Chief Economist for Windermere Real Estate, Matthew Gardner is responsible for analyzing and interpreting economic data and its impact on the real estate market on both a local and national level. Matthew has over 30 years of professional experience both in the U.S. and U.K.
In addition to his day-to-day responsibilities, Matthew sits on the Washington State Governors Council of Economic Advisors; chairs the Board of Trustees at the Washington Center for Real Estate Research at the University of Washington; and is an Advisory Board Member at the Runstad Center for Real Estate Studies at the University of Washington where he also lectures in real estate economics.


")


