
 Facebook
 X
X
 Pinterest
 Copy Link

The following analysis of select counties of the Montana real estate market is provided by Windermere Real Estate Chief Economist Matthew Gardner. We hope that this information may assist you with making better-informed real estate decisions. For further information about the housing market in your area, please don’t hesitate to contact your Windermere Real Estate agent.
Regional Economic Overview
Year over year, Montana added 7,100 jobs. This represents an annual growth rate of 1.4%, which is the slowest pace of growth the state has seen since pandemic influences started to come into play. Regionally, there were significant variations: Employment fell .7% in Billings while it rose 3.4% in Missoula. Montana’s unemployment rate in May was 2.3%, which was down from 2.6% during the same period in 2022 and may explain slowing job growth. The state has a significant labor shortage. In the metro areas covered in this report, the lowest jobless rate was in Billings at 2.2%, followed by Missoula at 2.3%, and Great Falls at 2.4%.
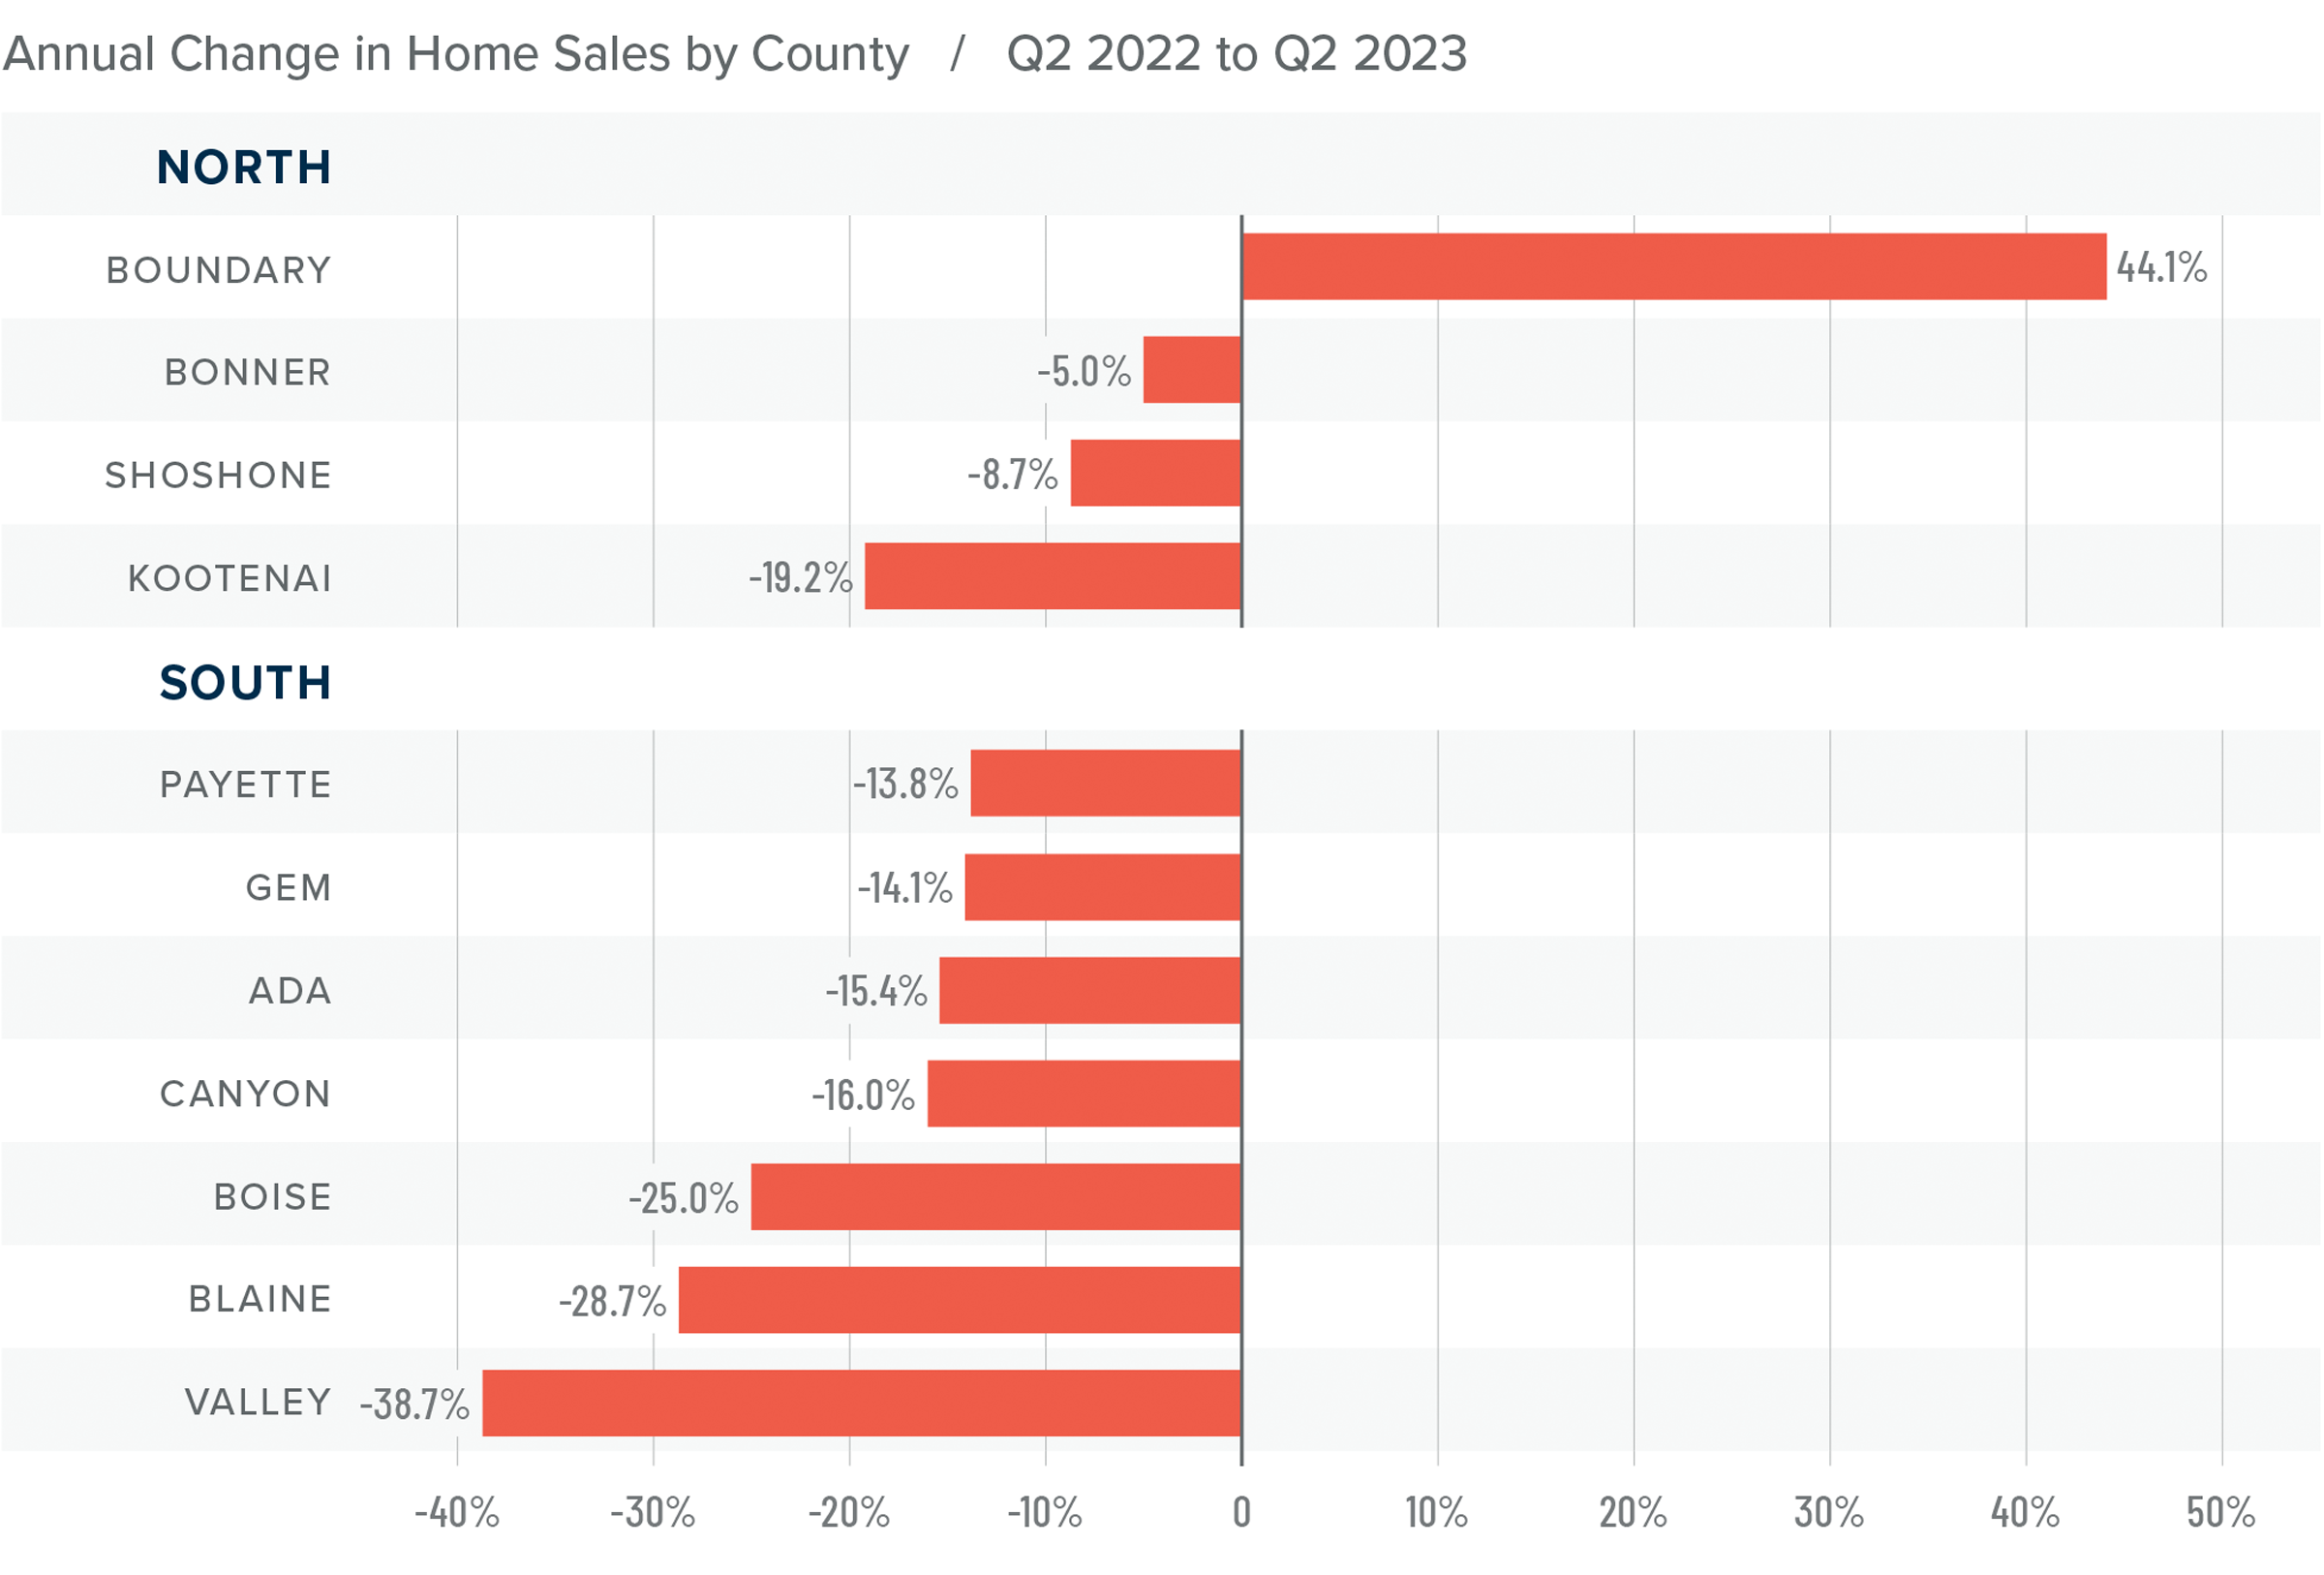
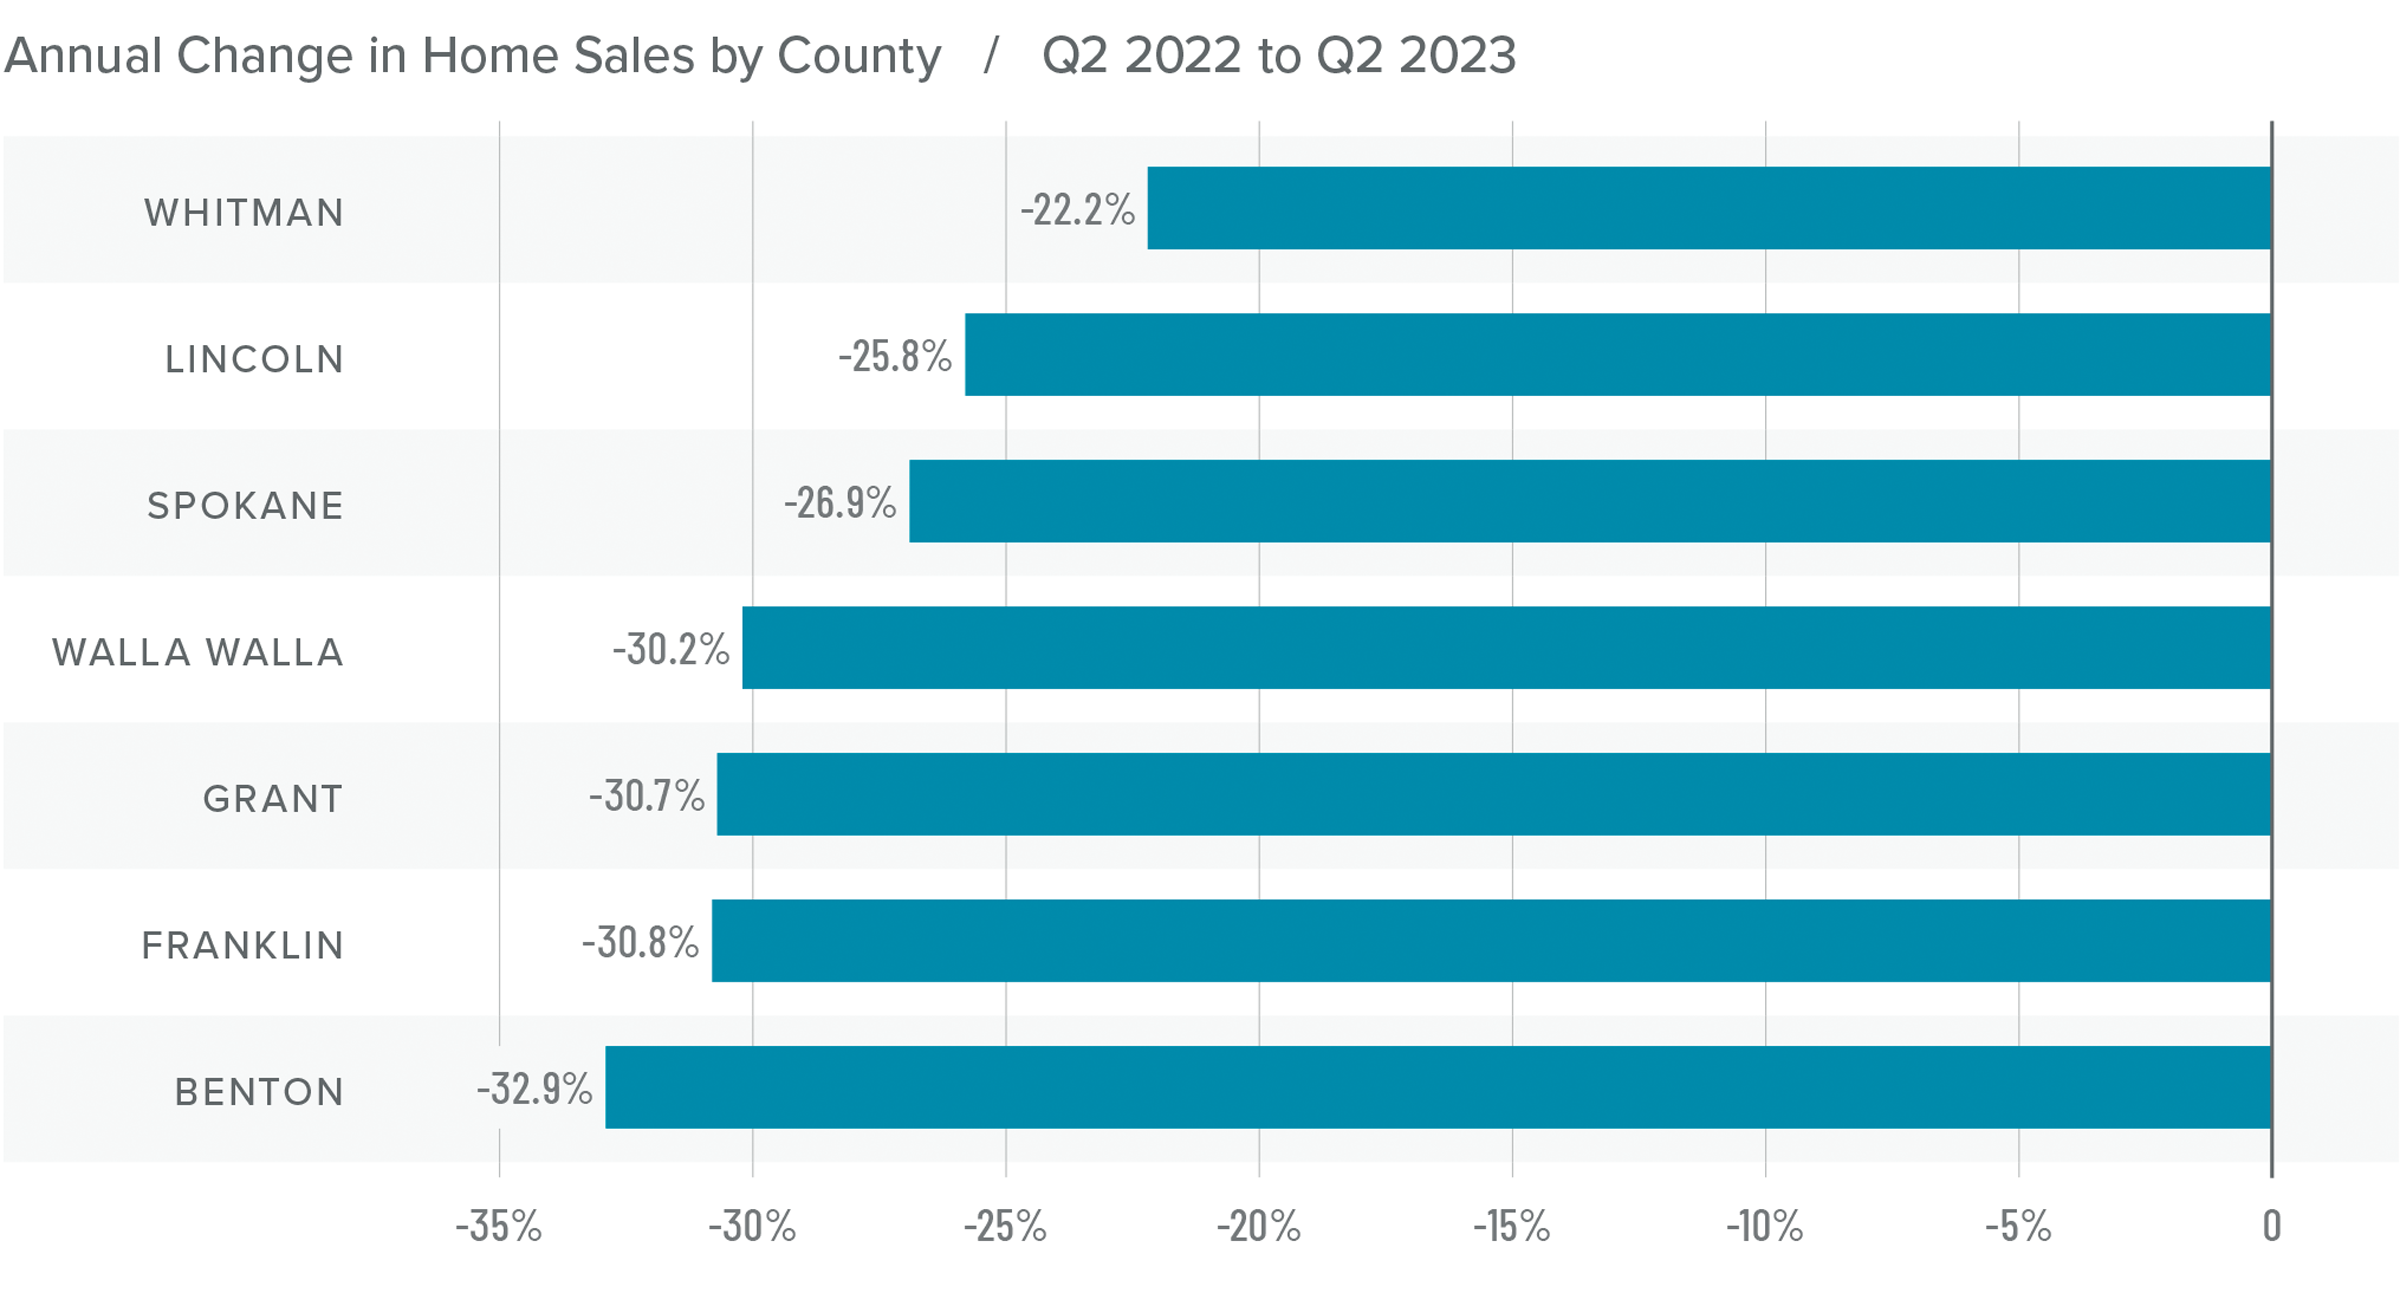
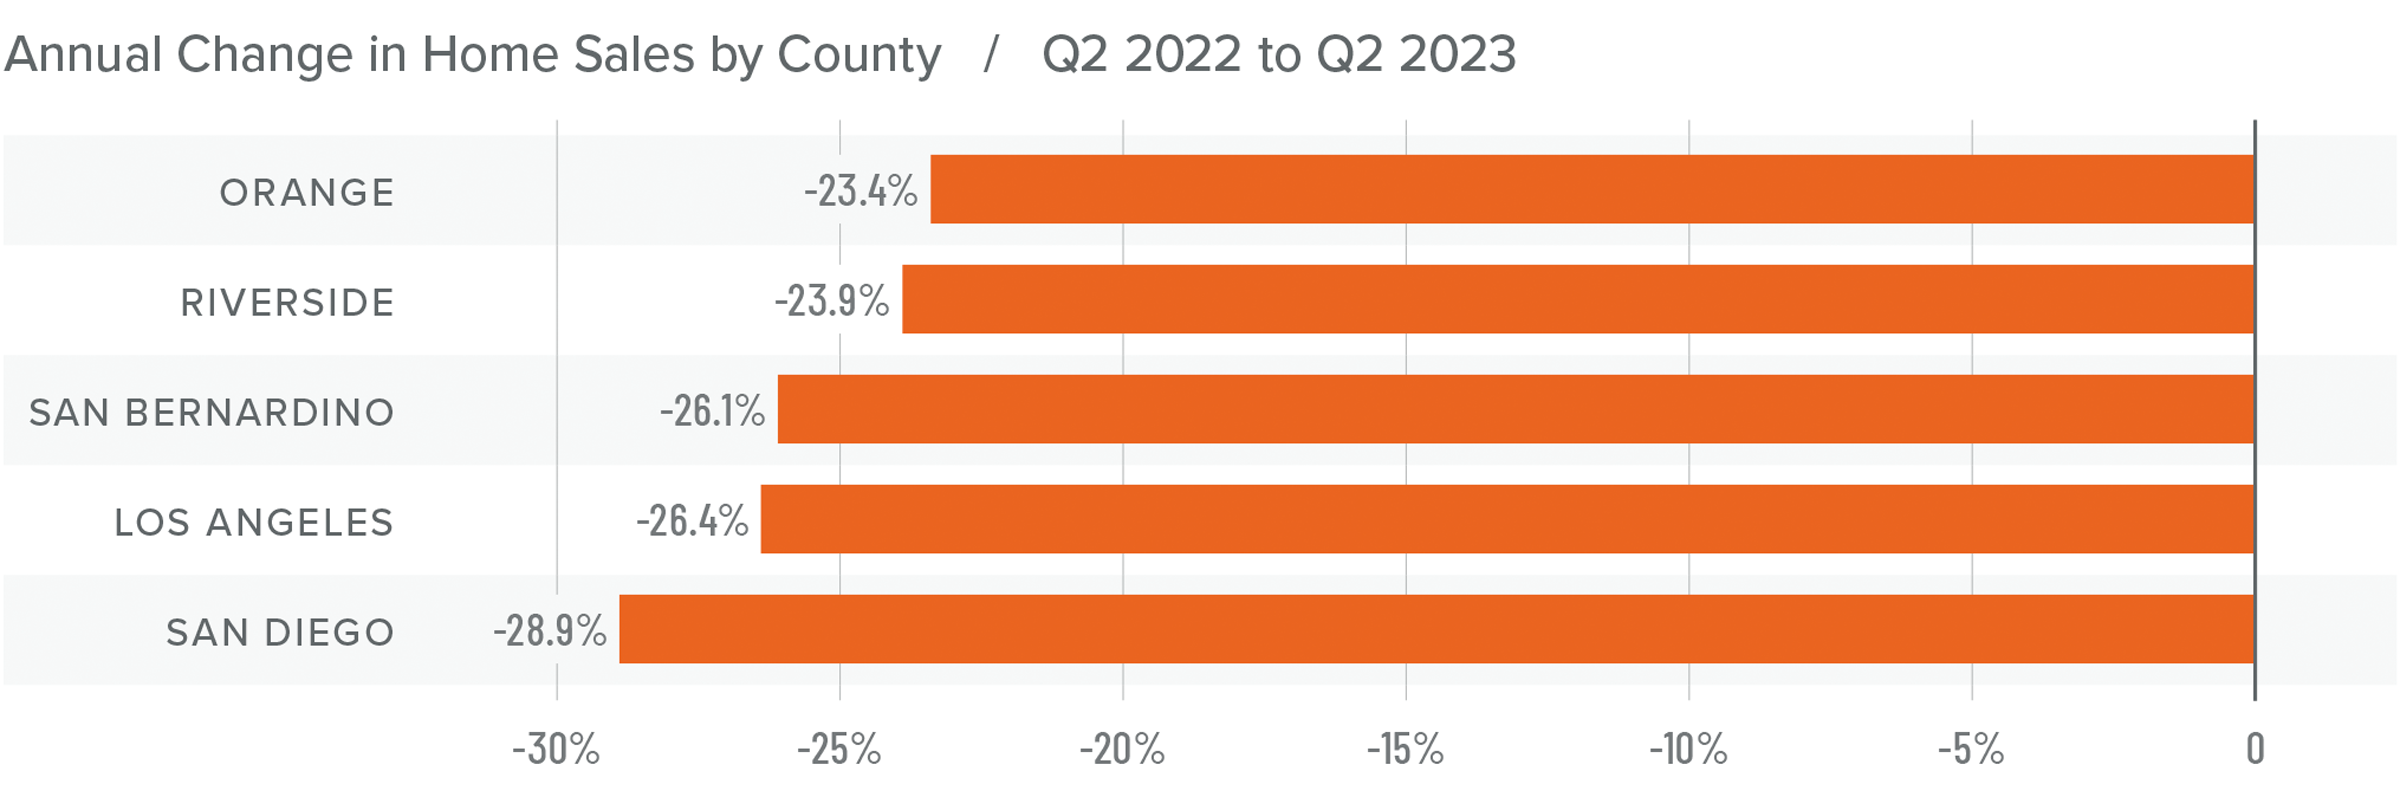
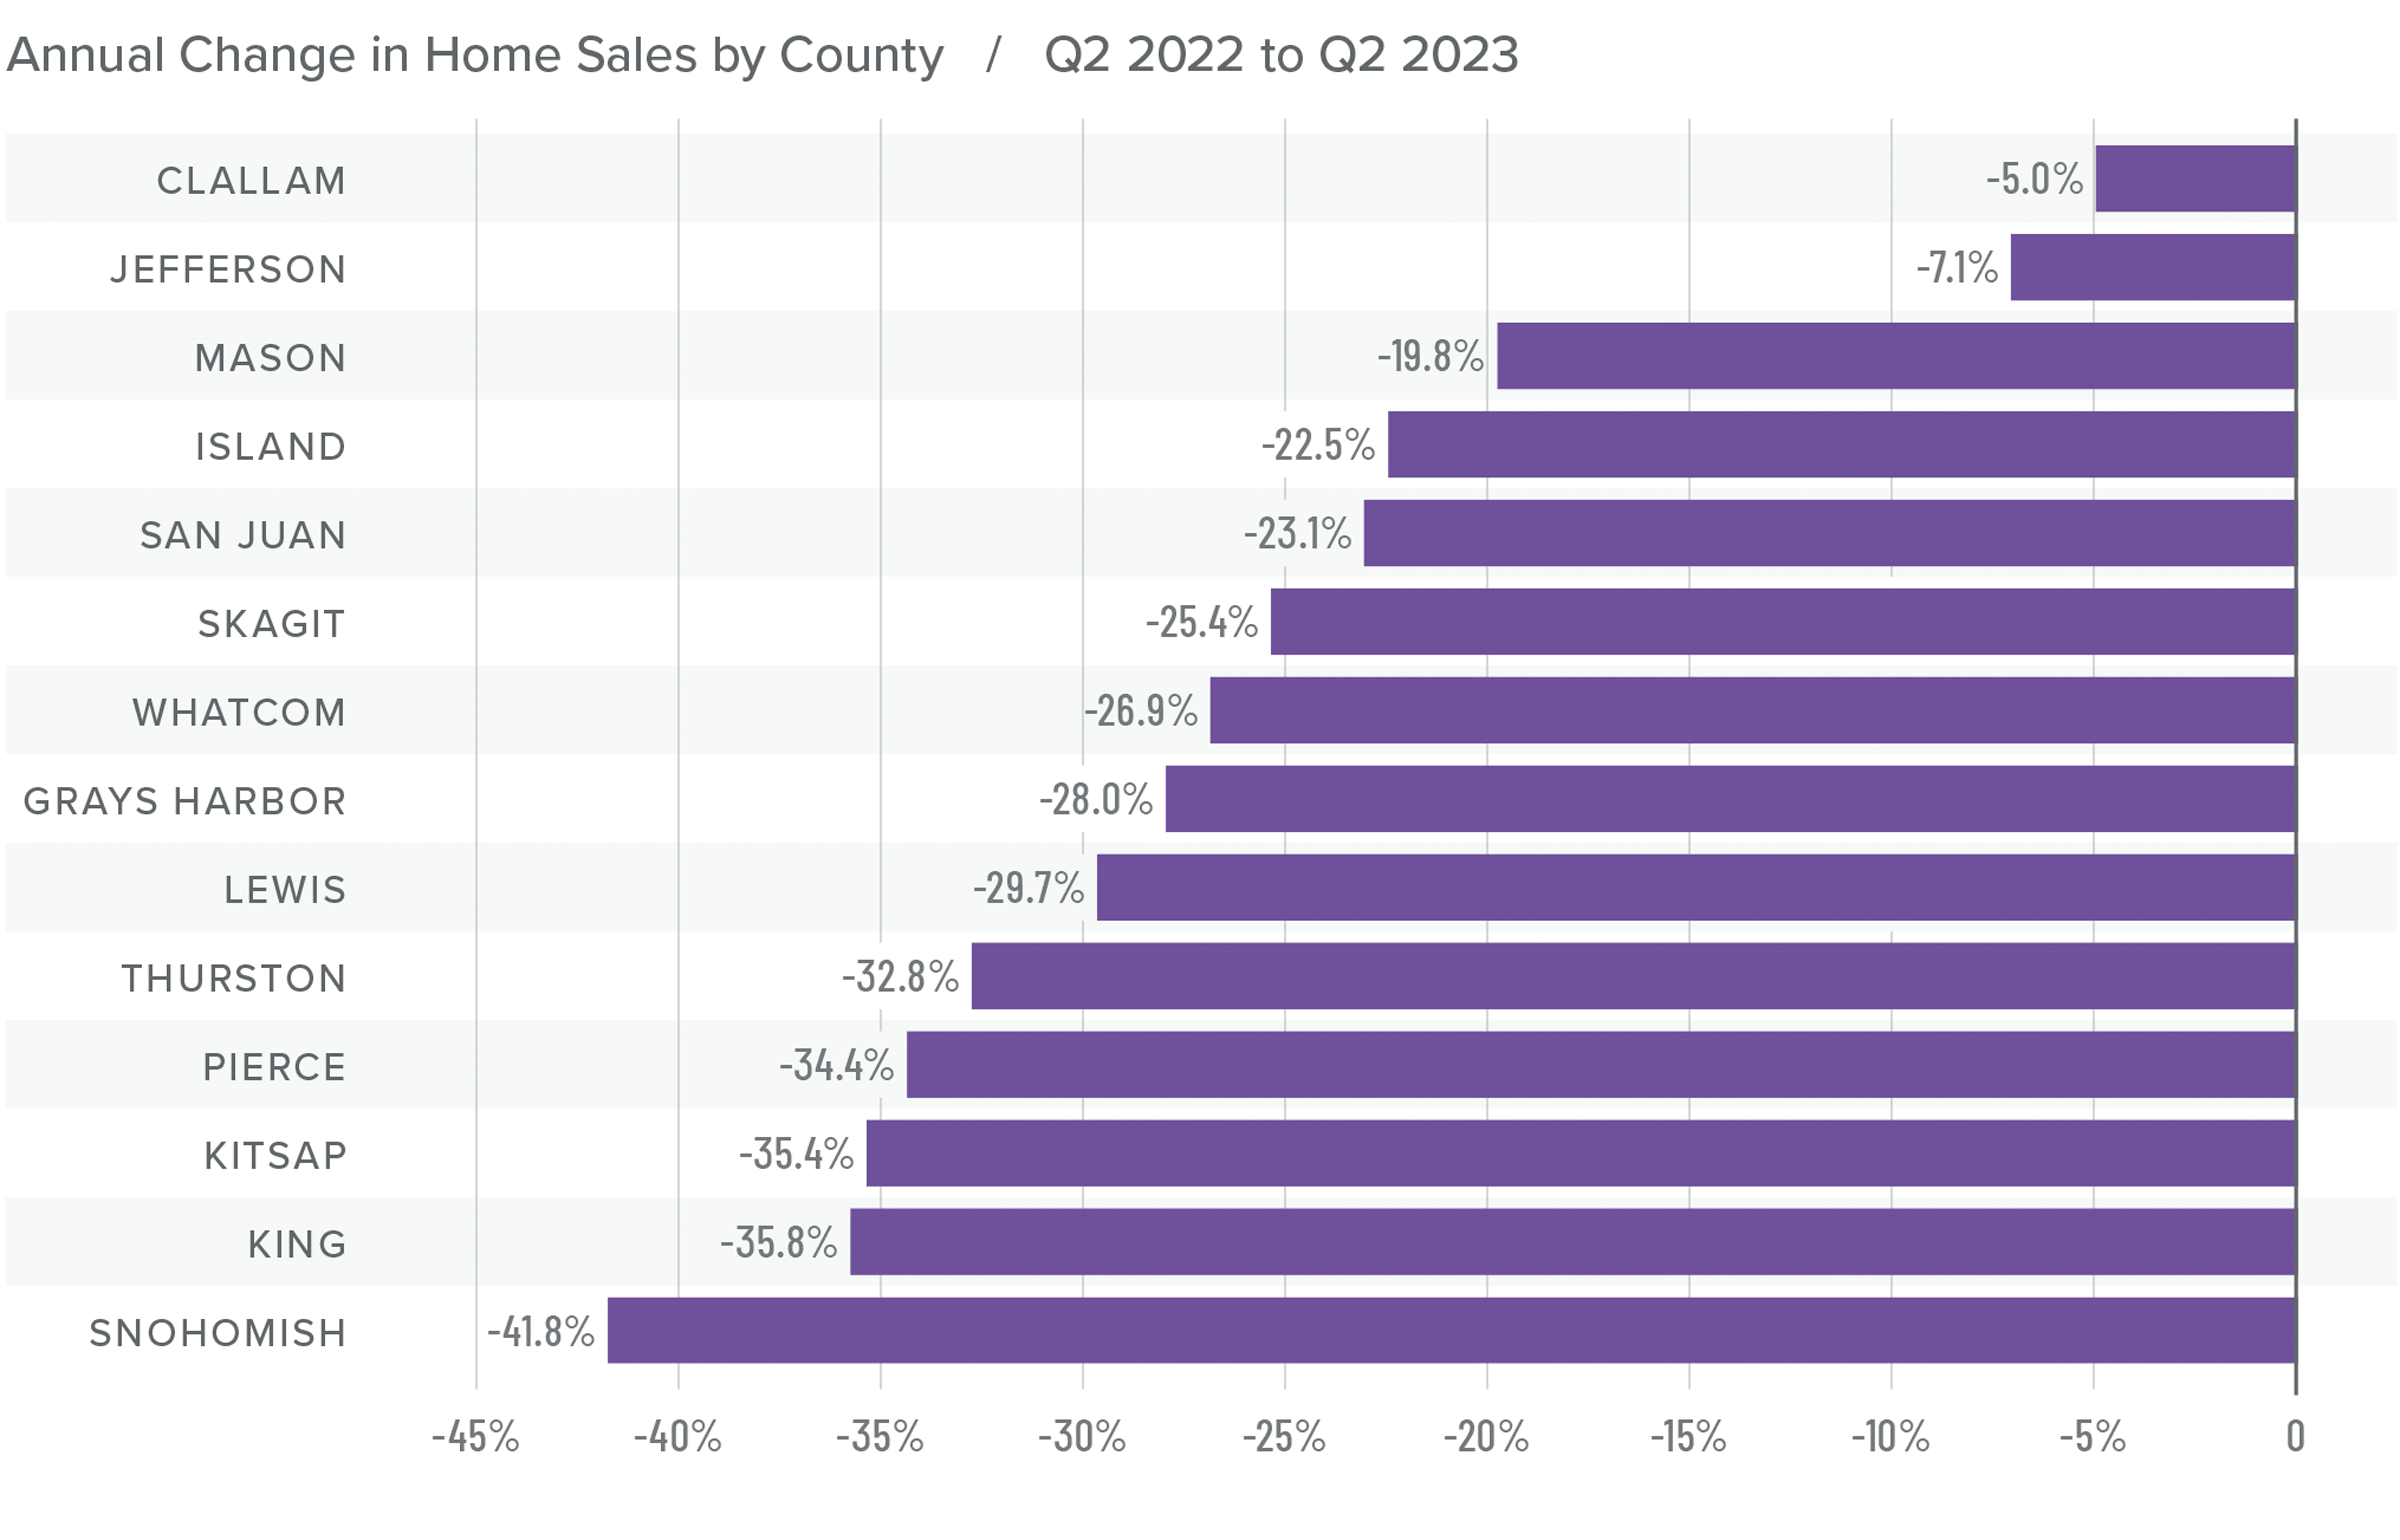
Montana Home Sales
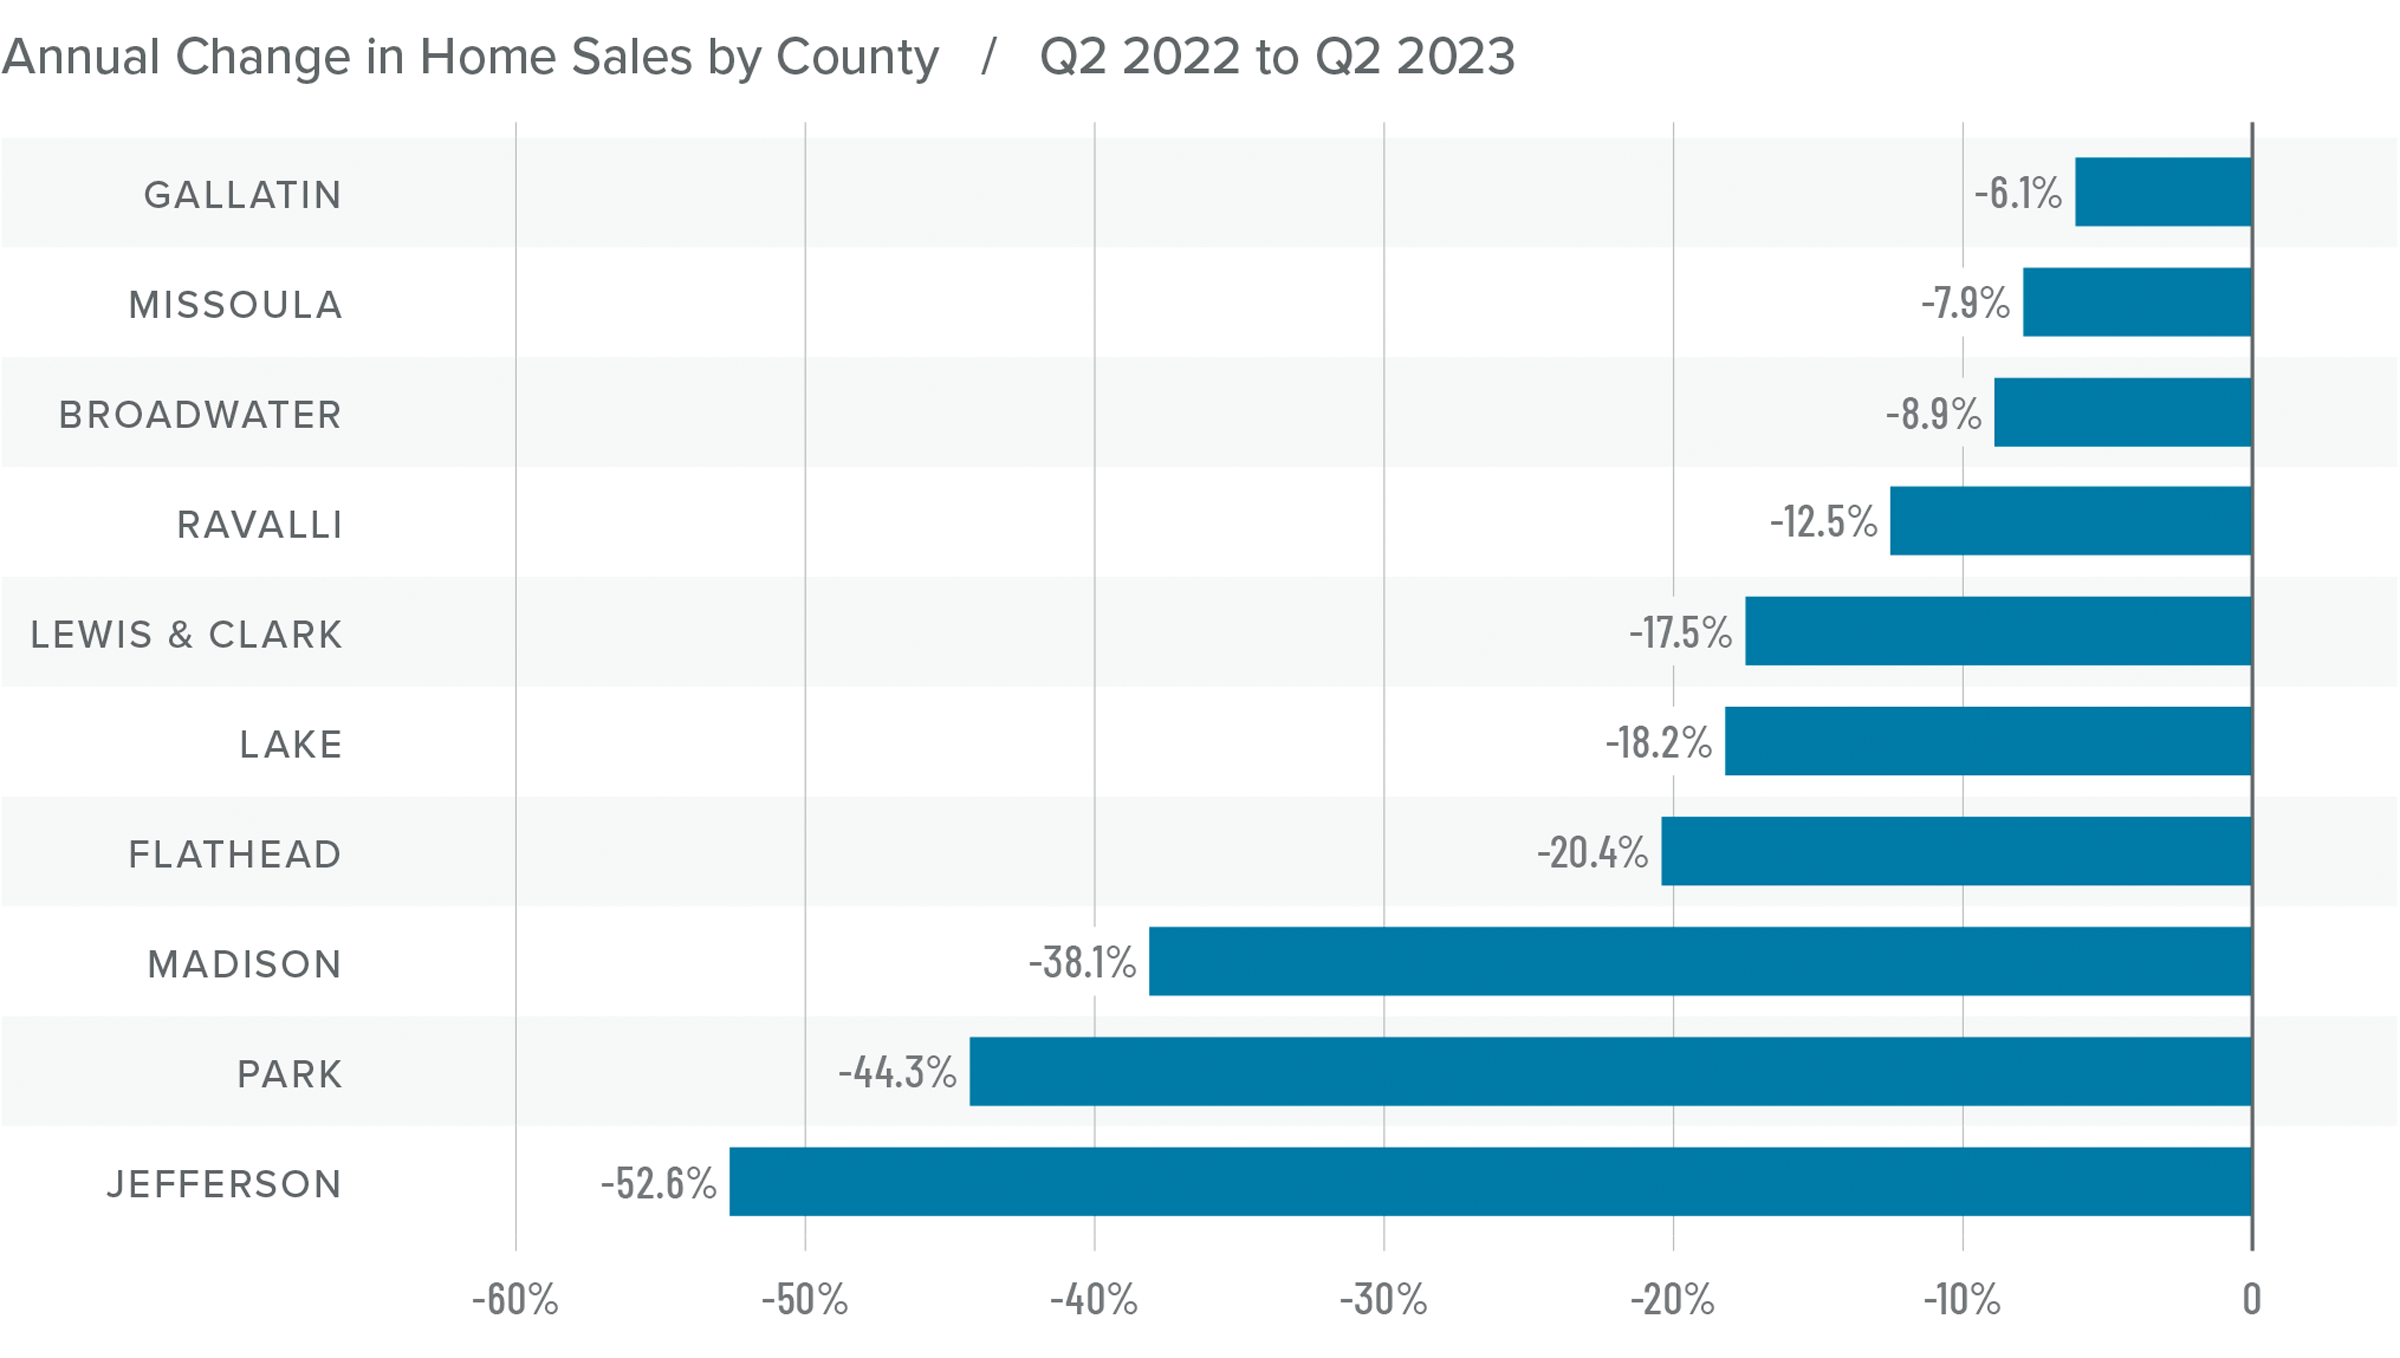
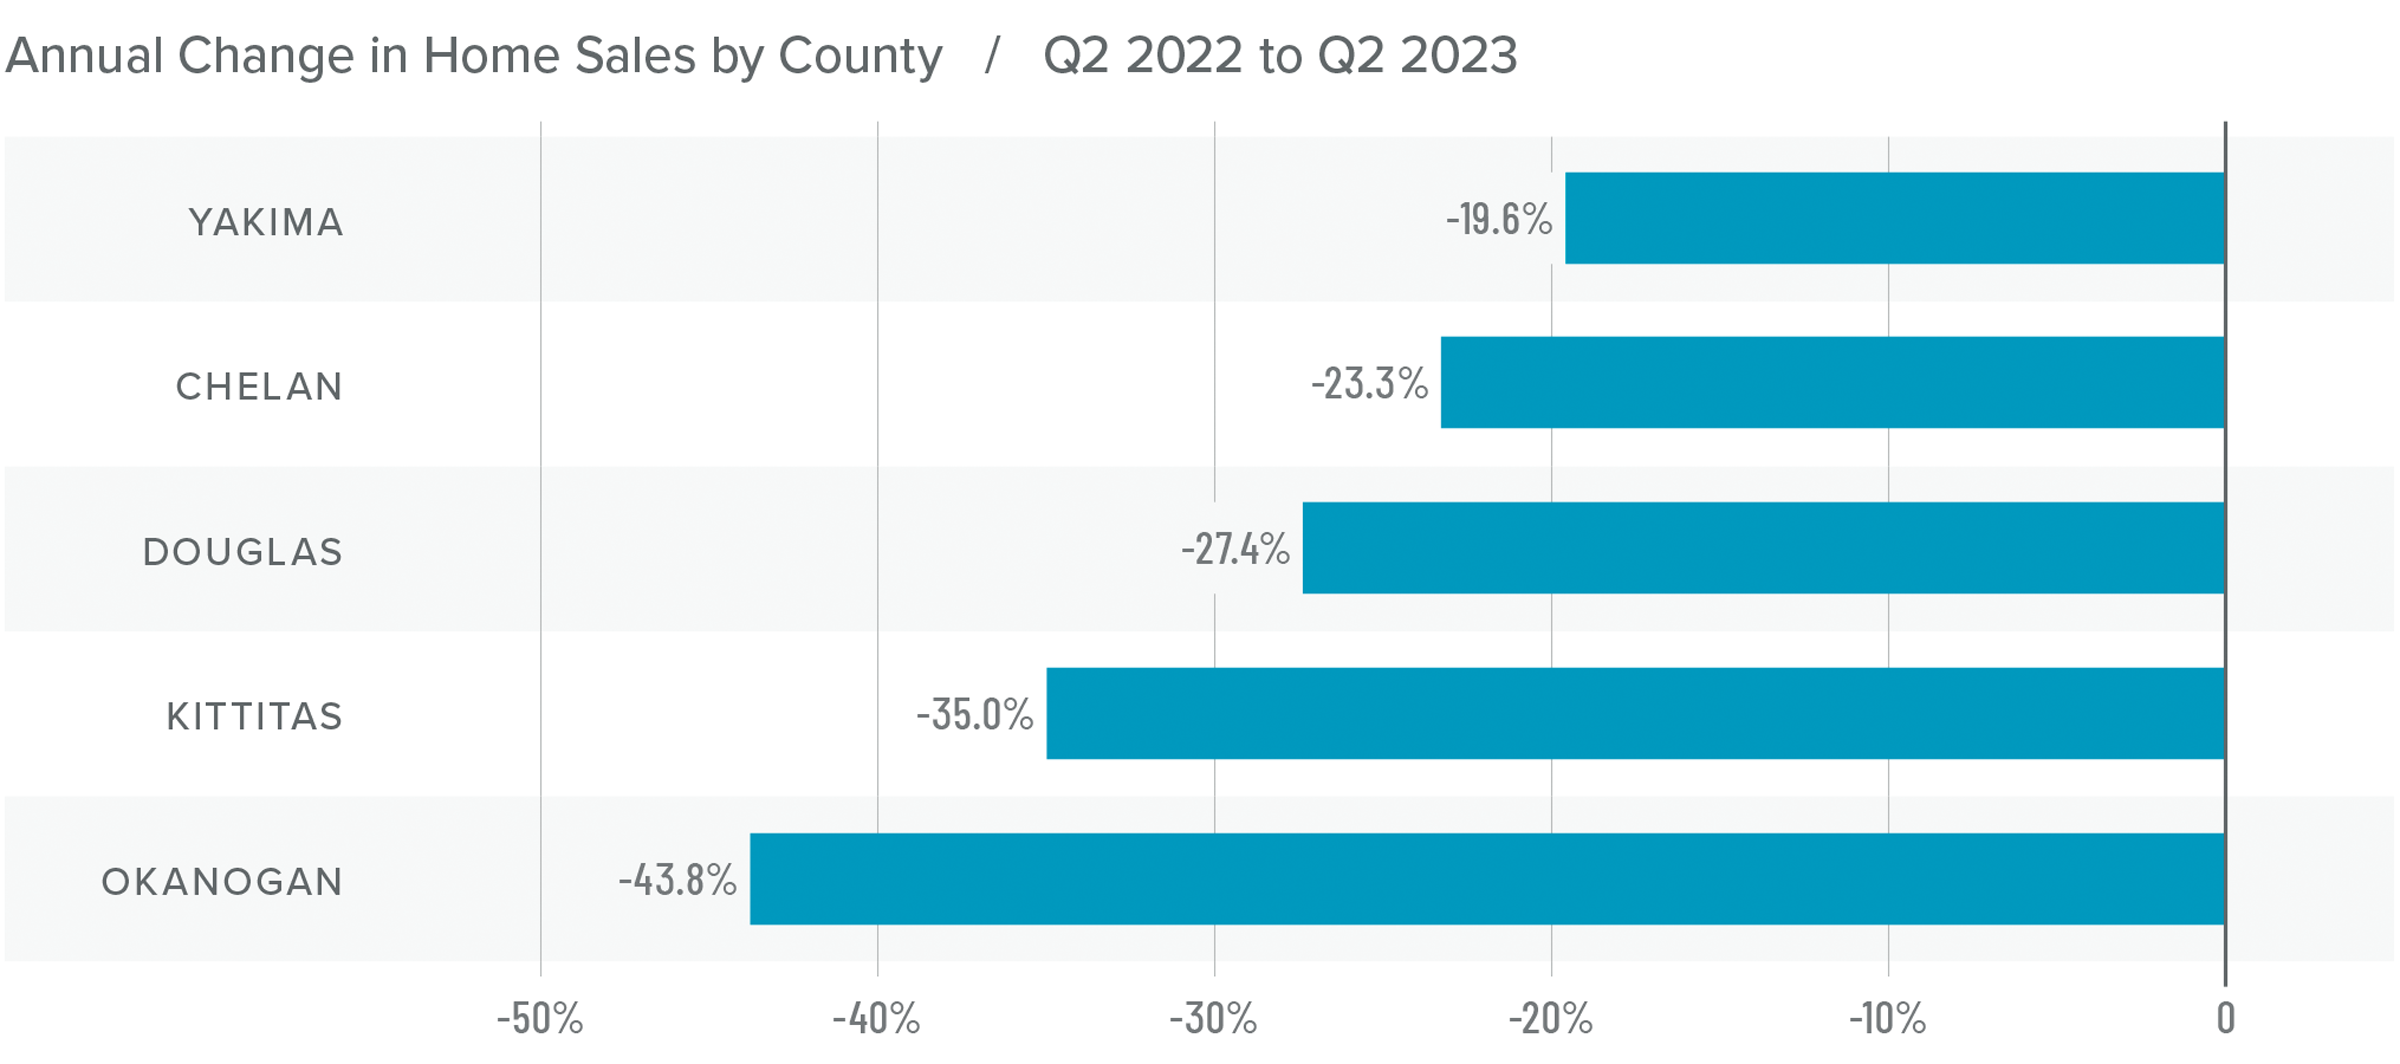
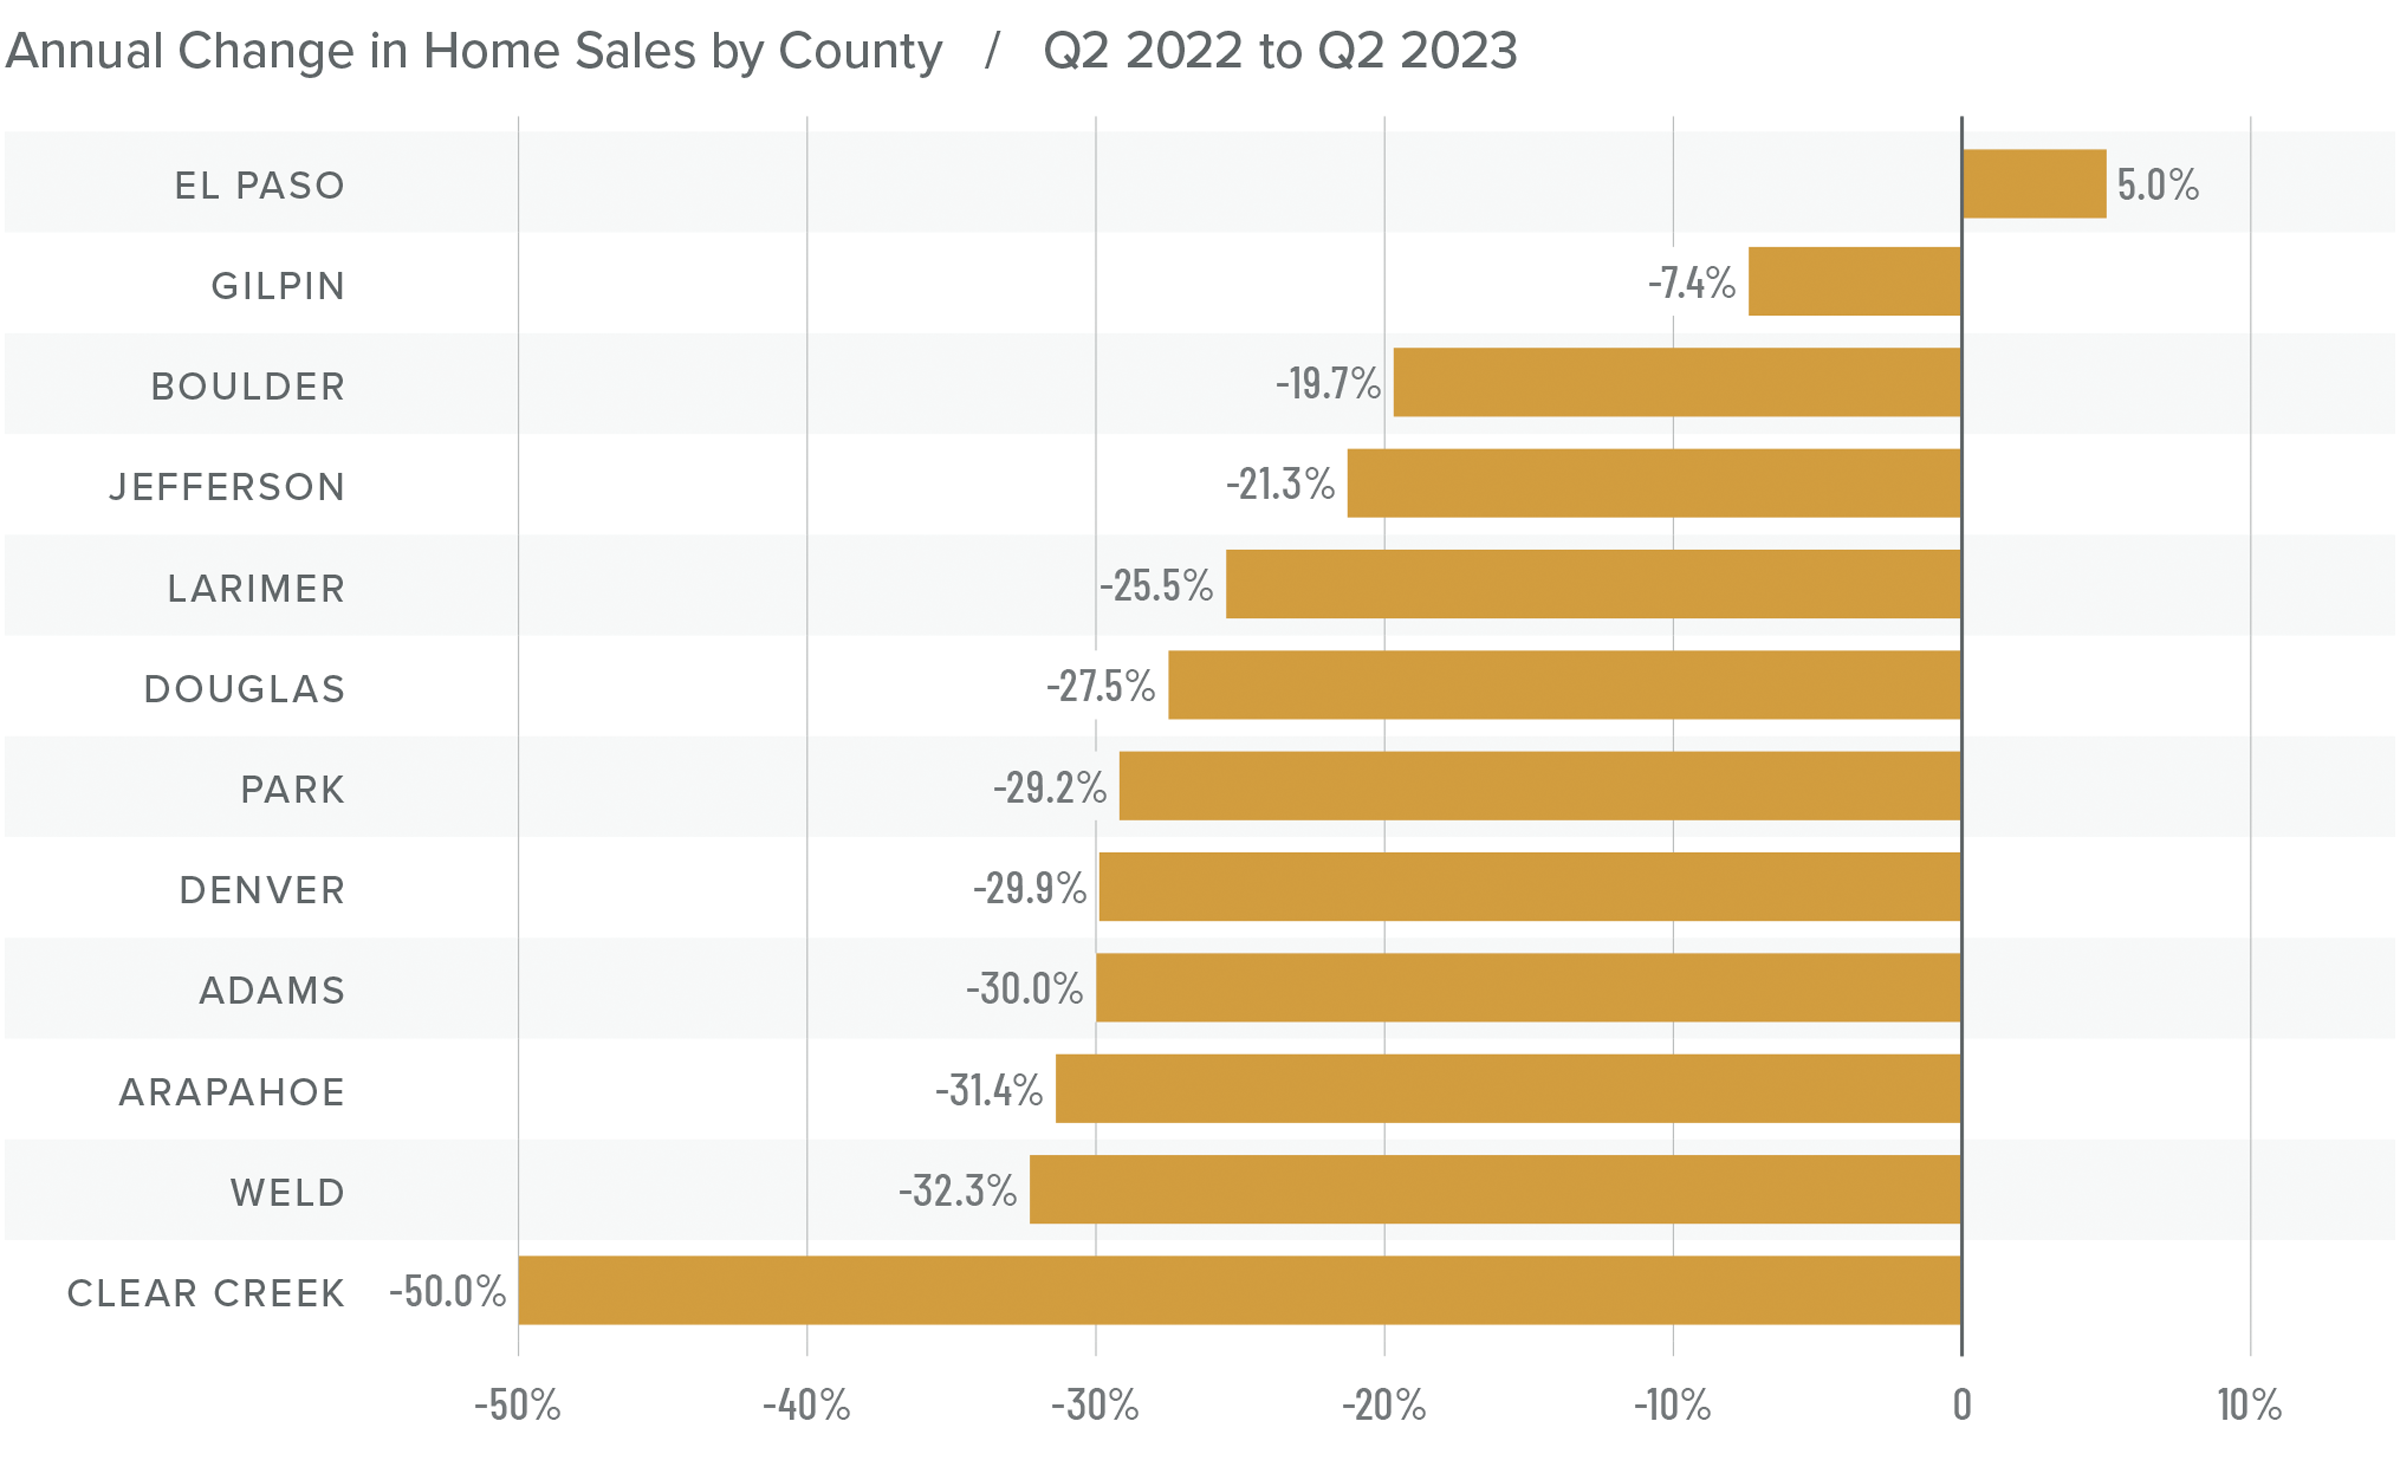
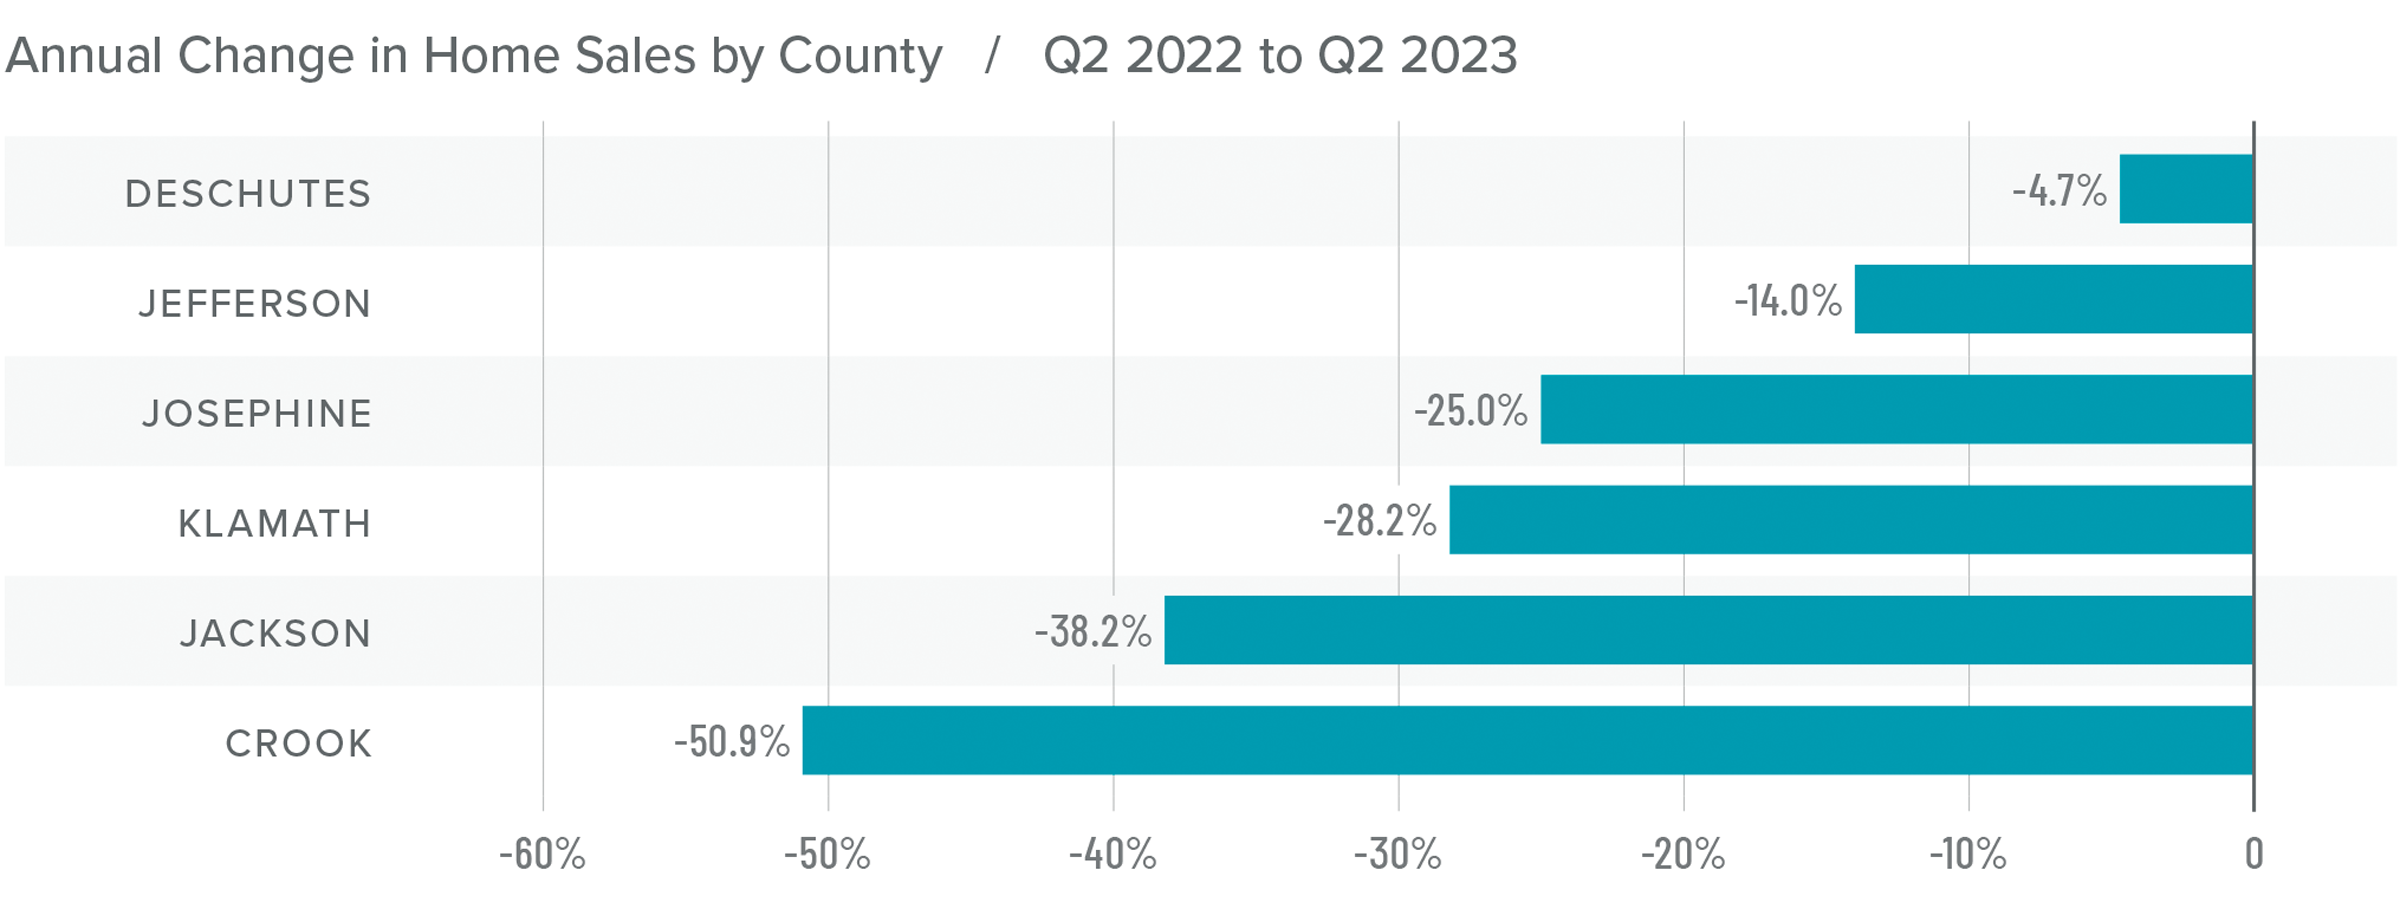
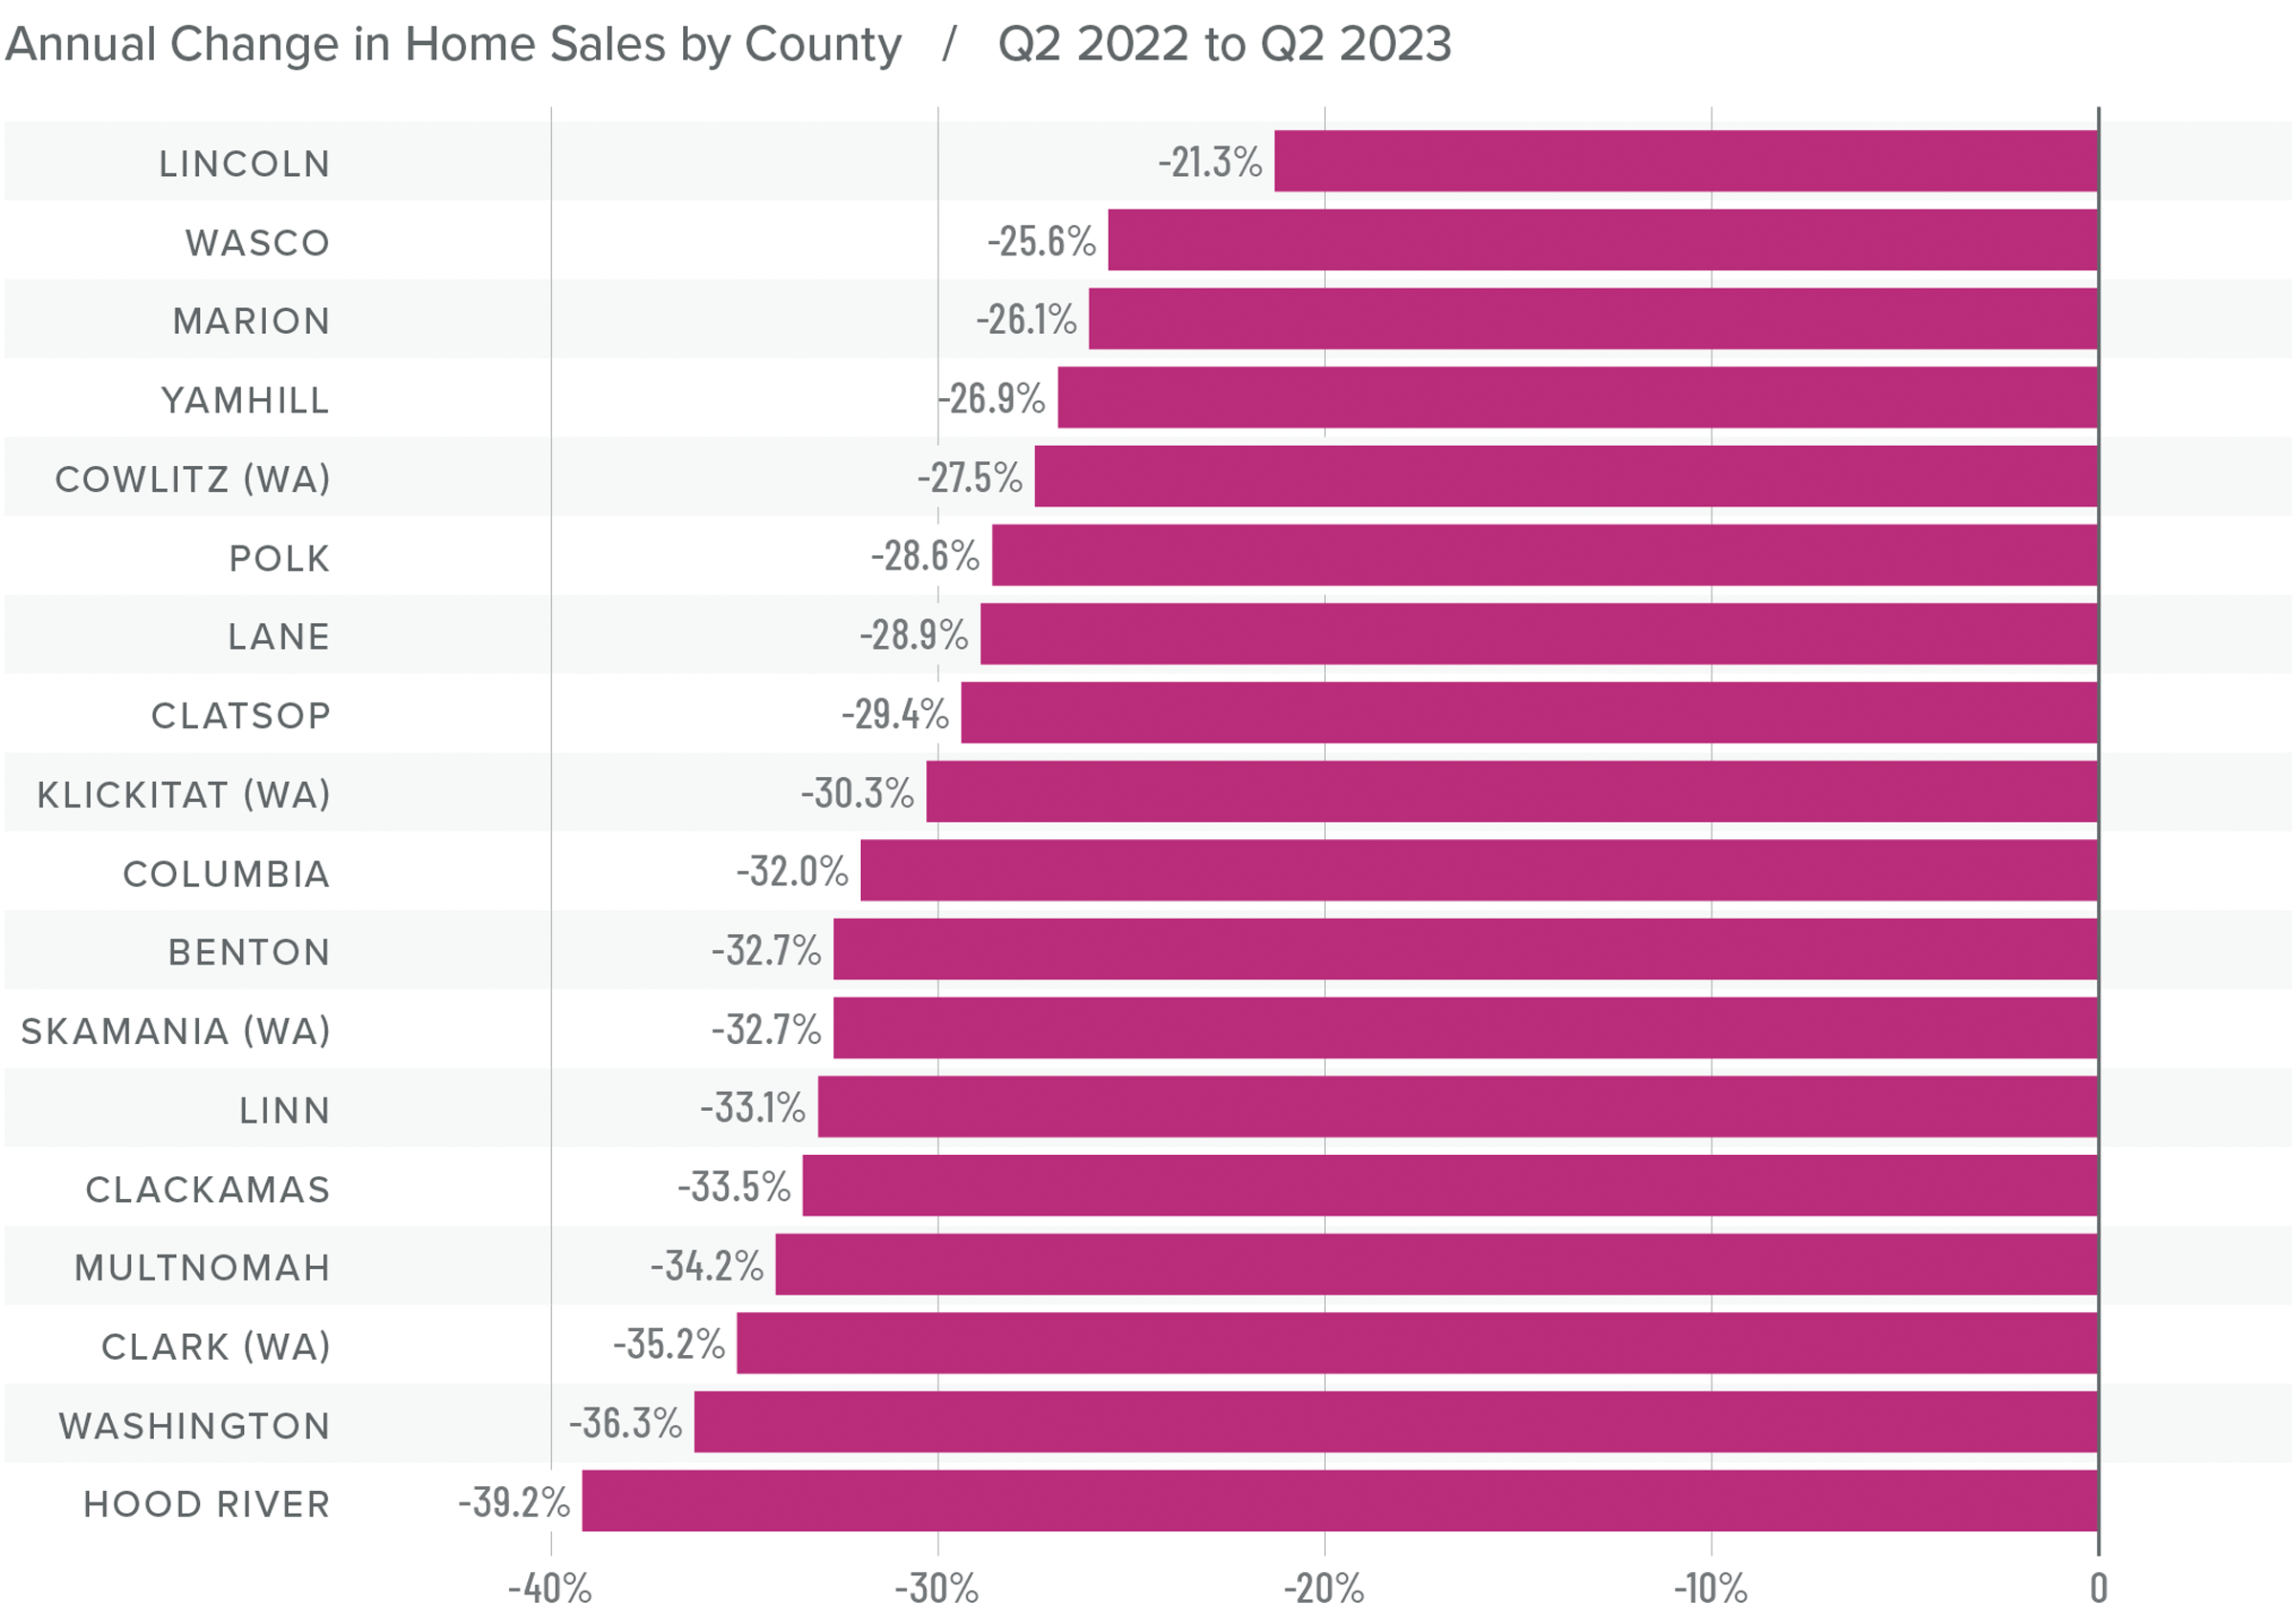
❱ In the first quarter of 2023, 1,518 homes sold in the counties covered by this report. This represents a 16.1% decline from the second quarter of 2022 but an increase of 58.6% compared to the first quarter of 2023.
❱ Listing activity was 24.8% higher than in the second quarter of 2022 and 17.1% higher than in the first quarter of this year.
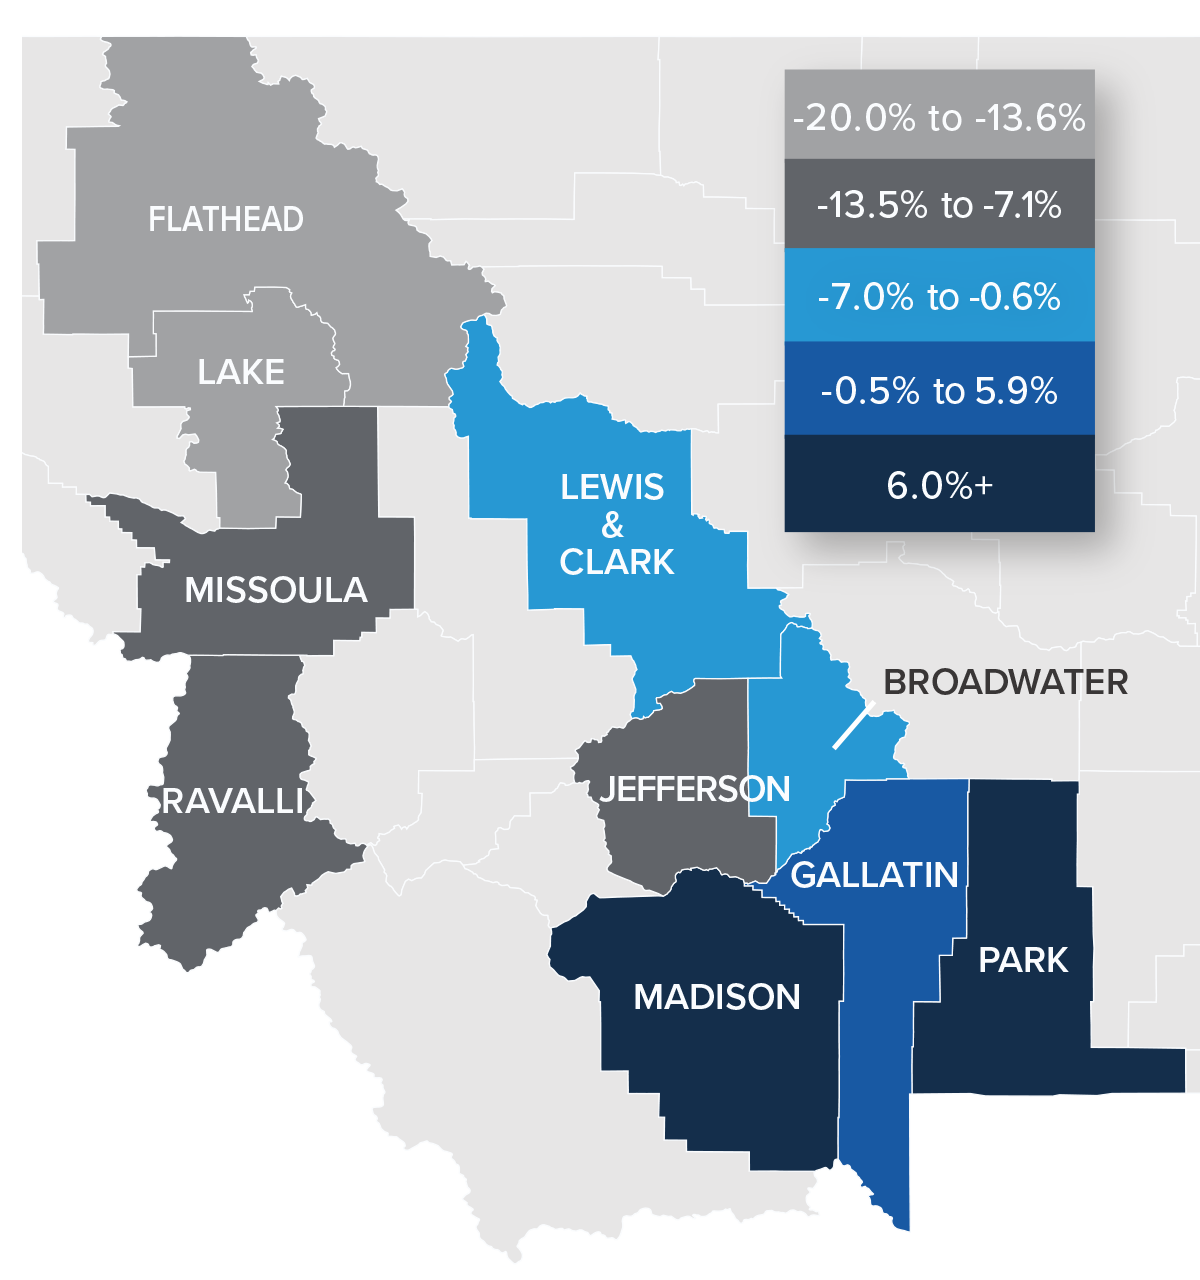
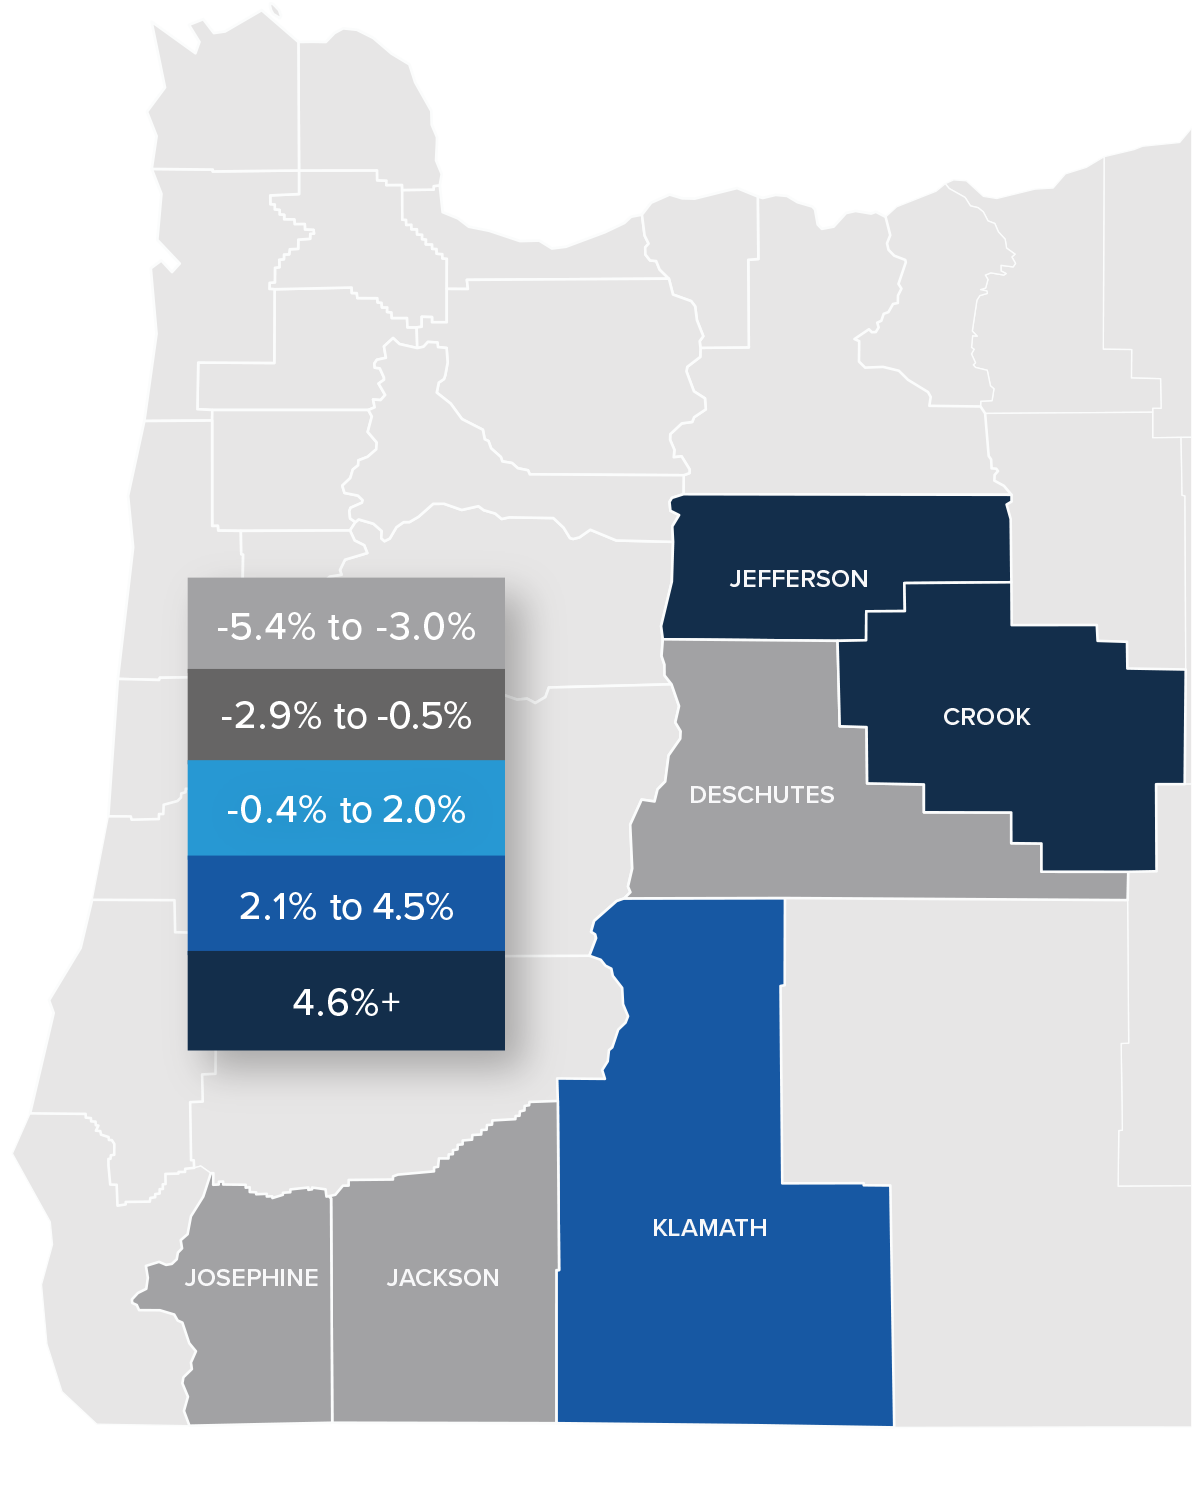
❱ Sales fell across the board from the second quarter of 2022. Compared to the first quarter of this year, sales were up in every county other than Jefferson, which is prone to significant swings given that very few homes sell there.
❱ Pending sales rose 15.4% quarter over quarter, suggesting that closings in the third quarter could show additional improvement.
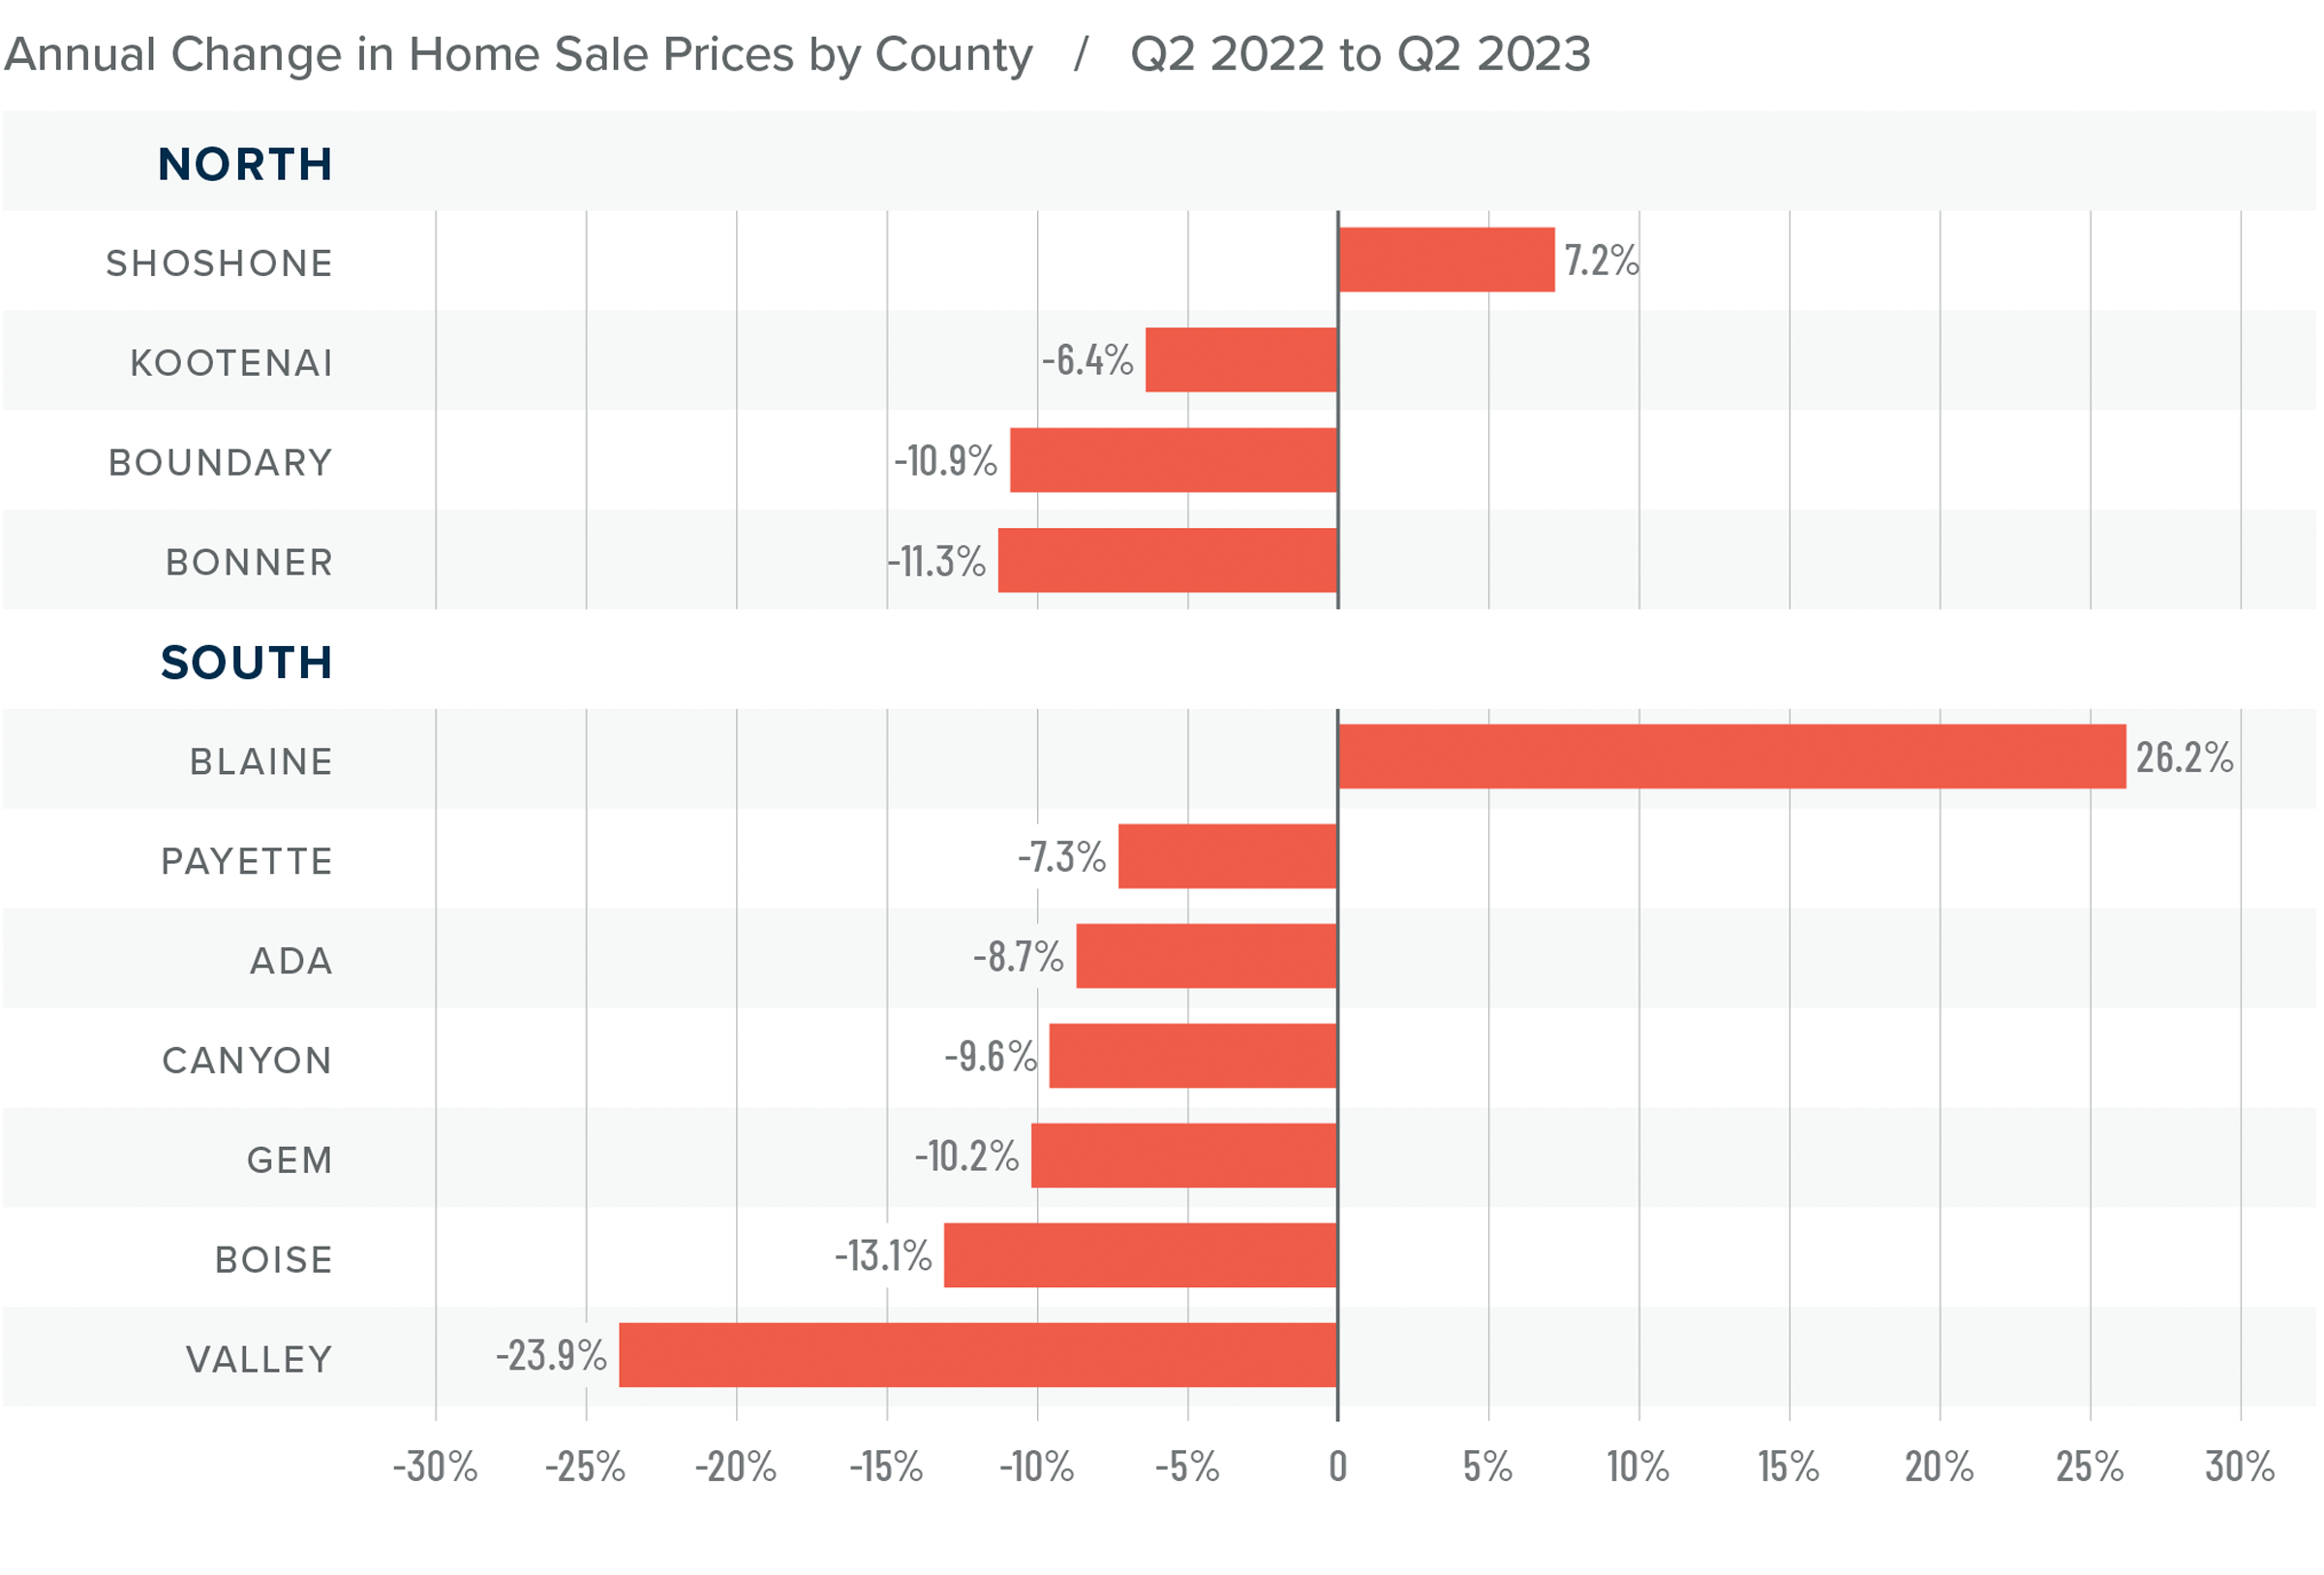
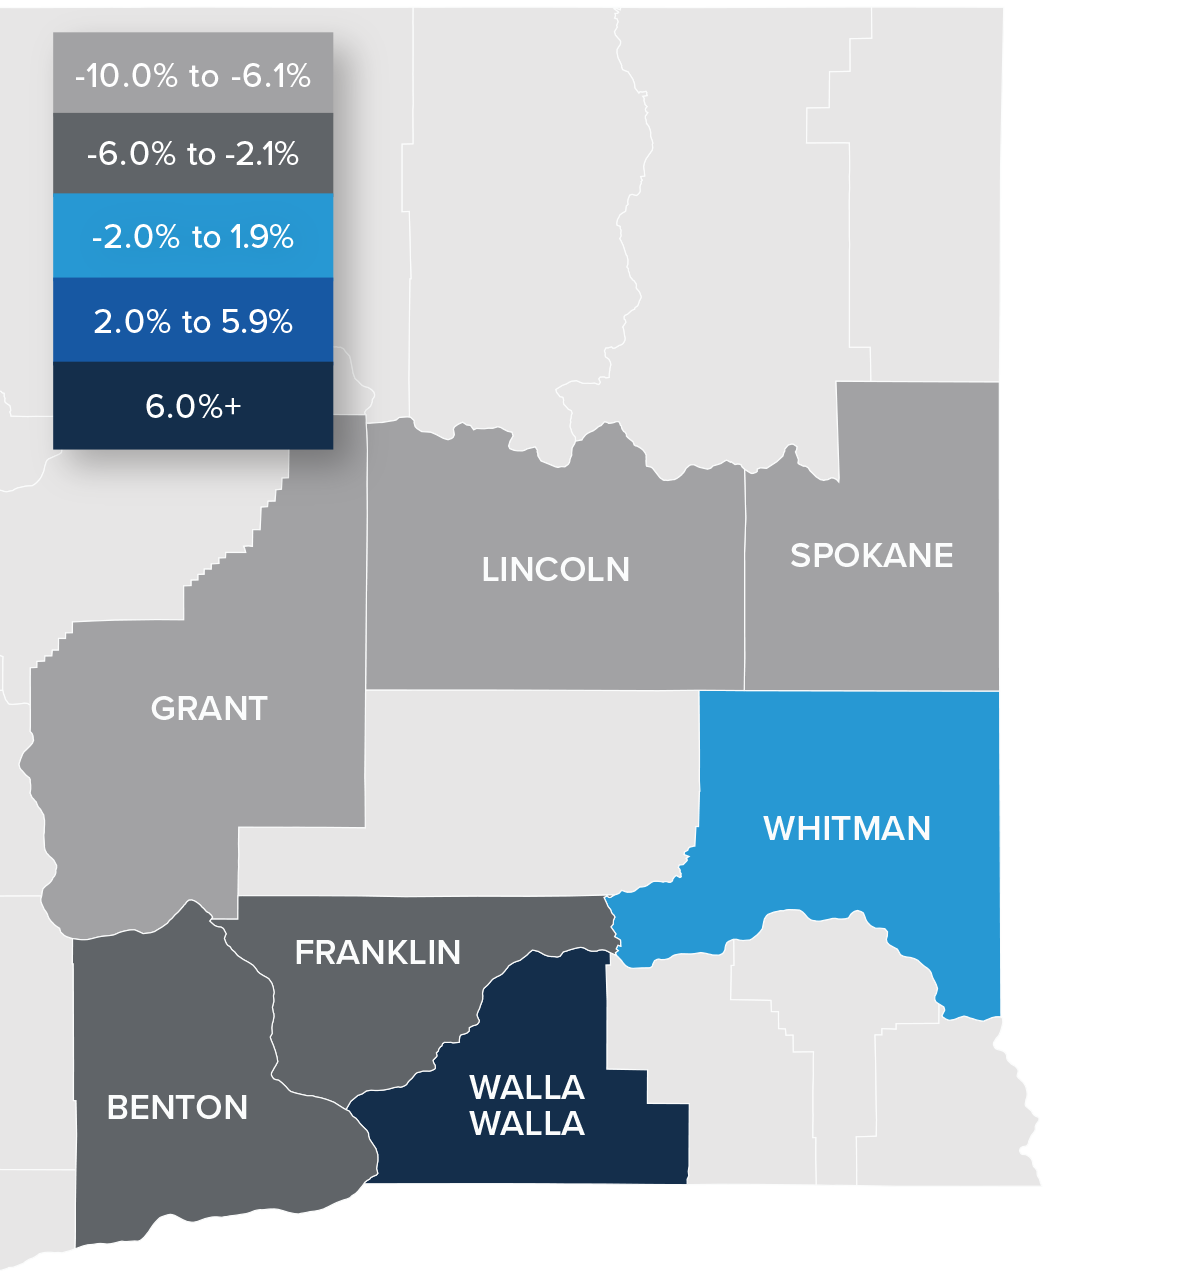
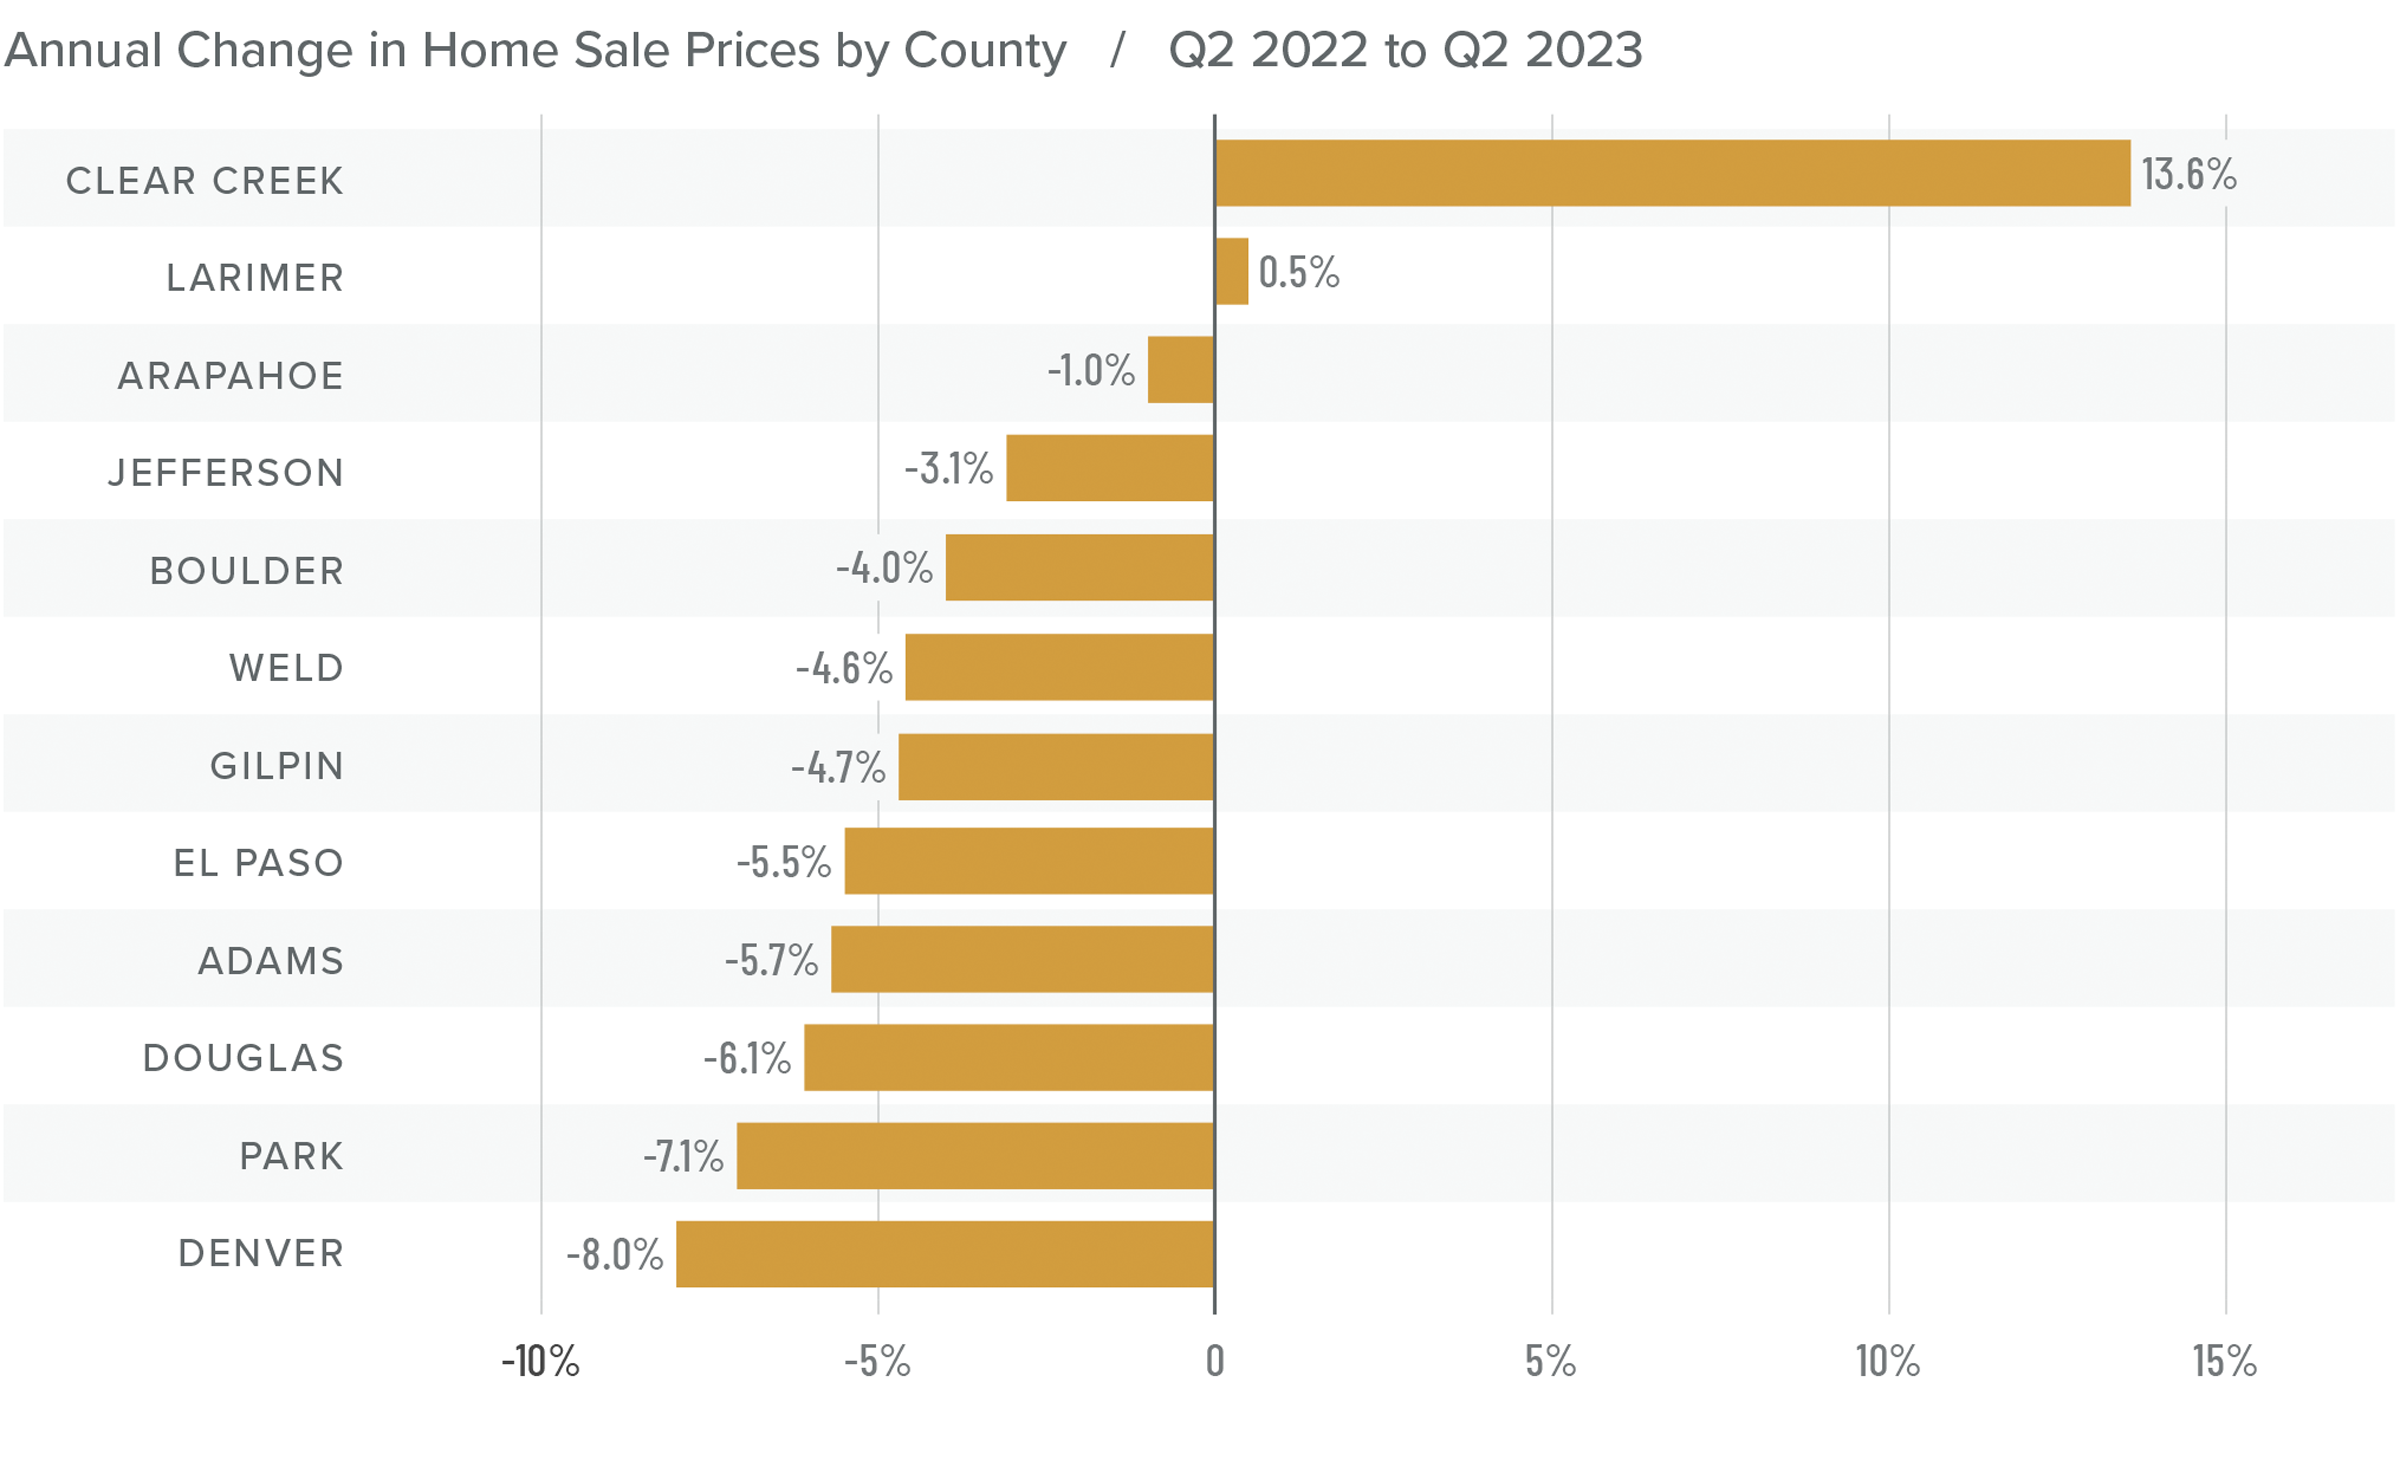
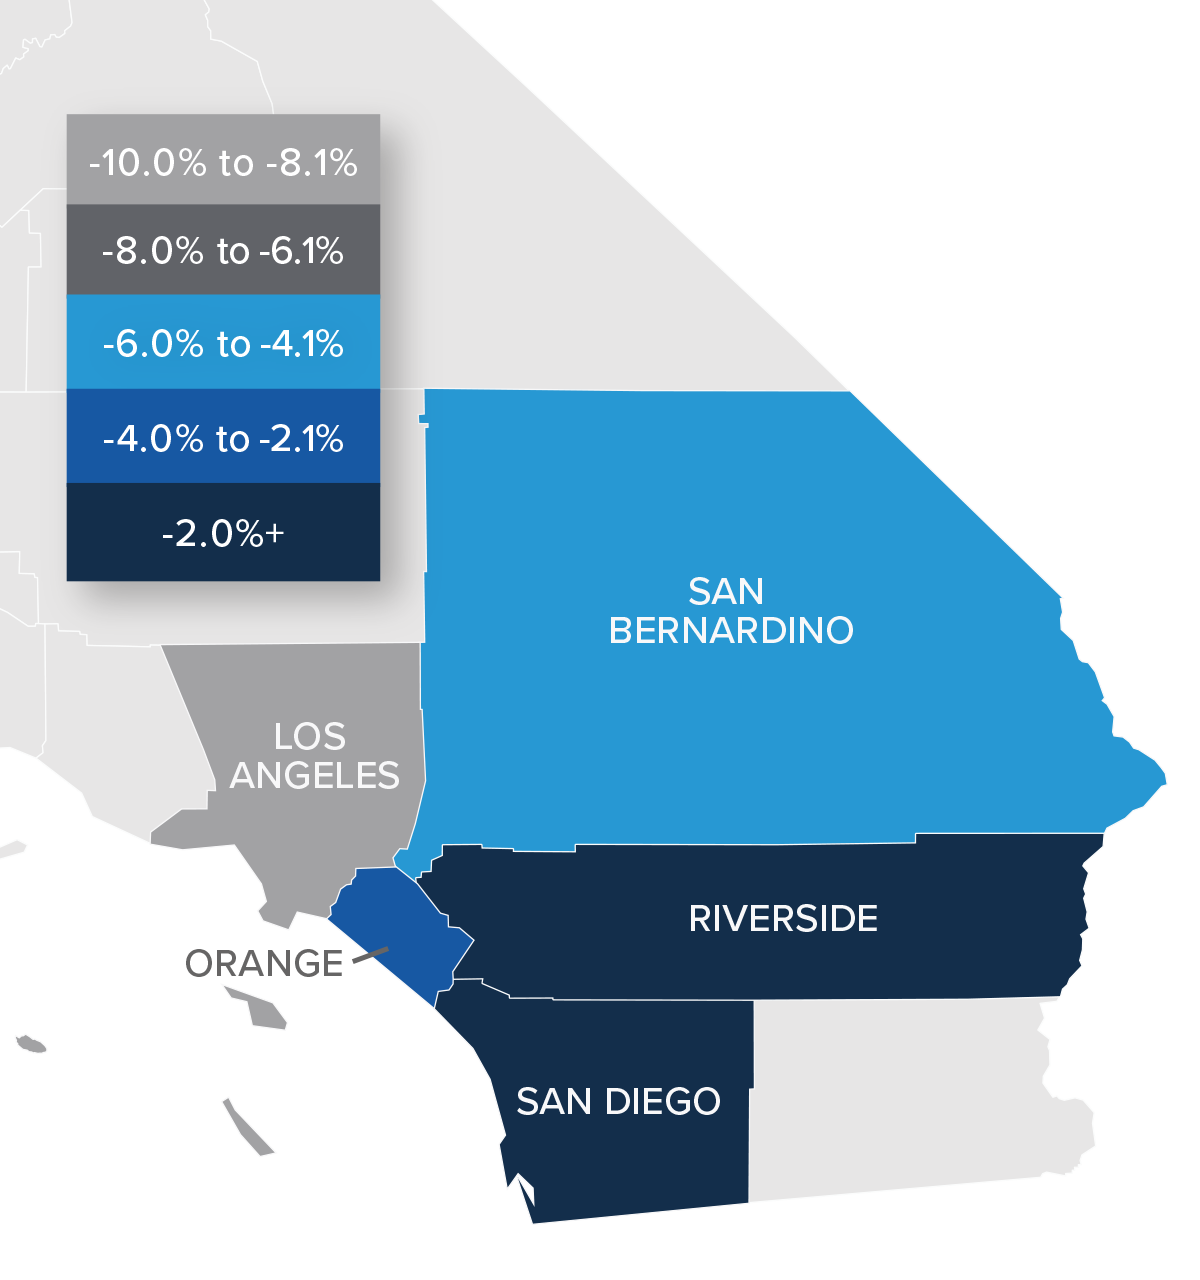
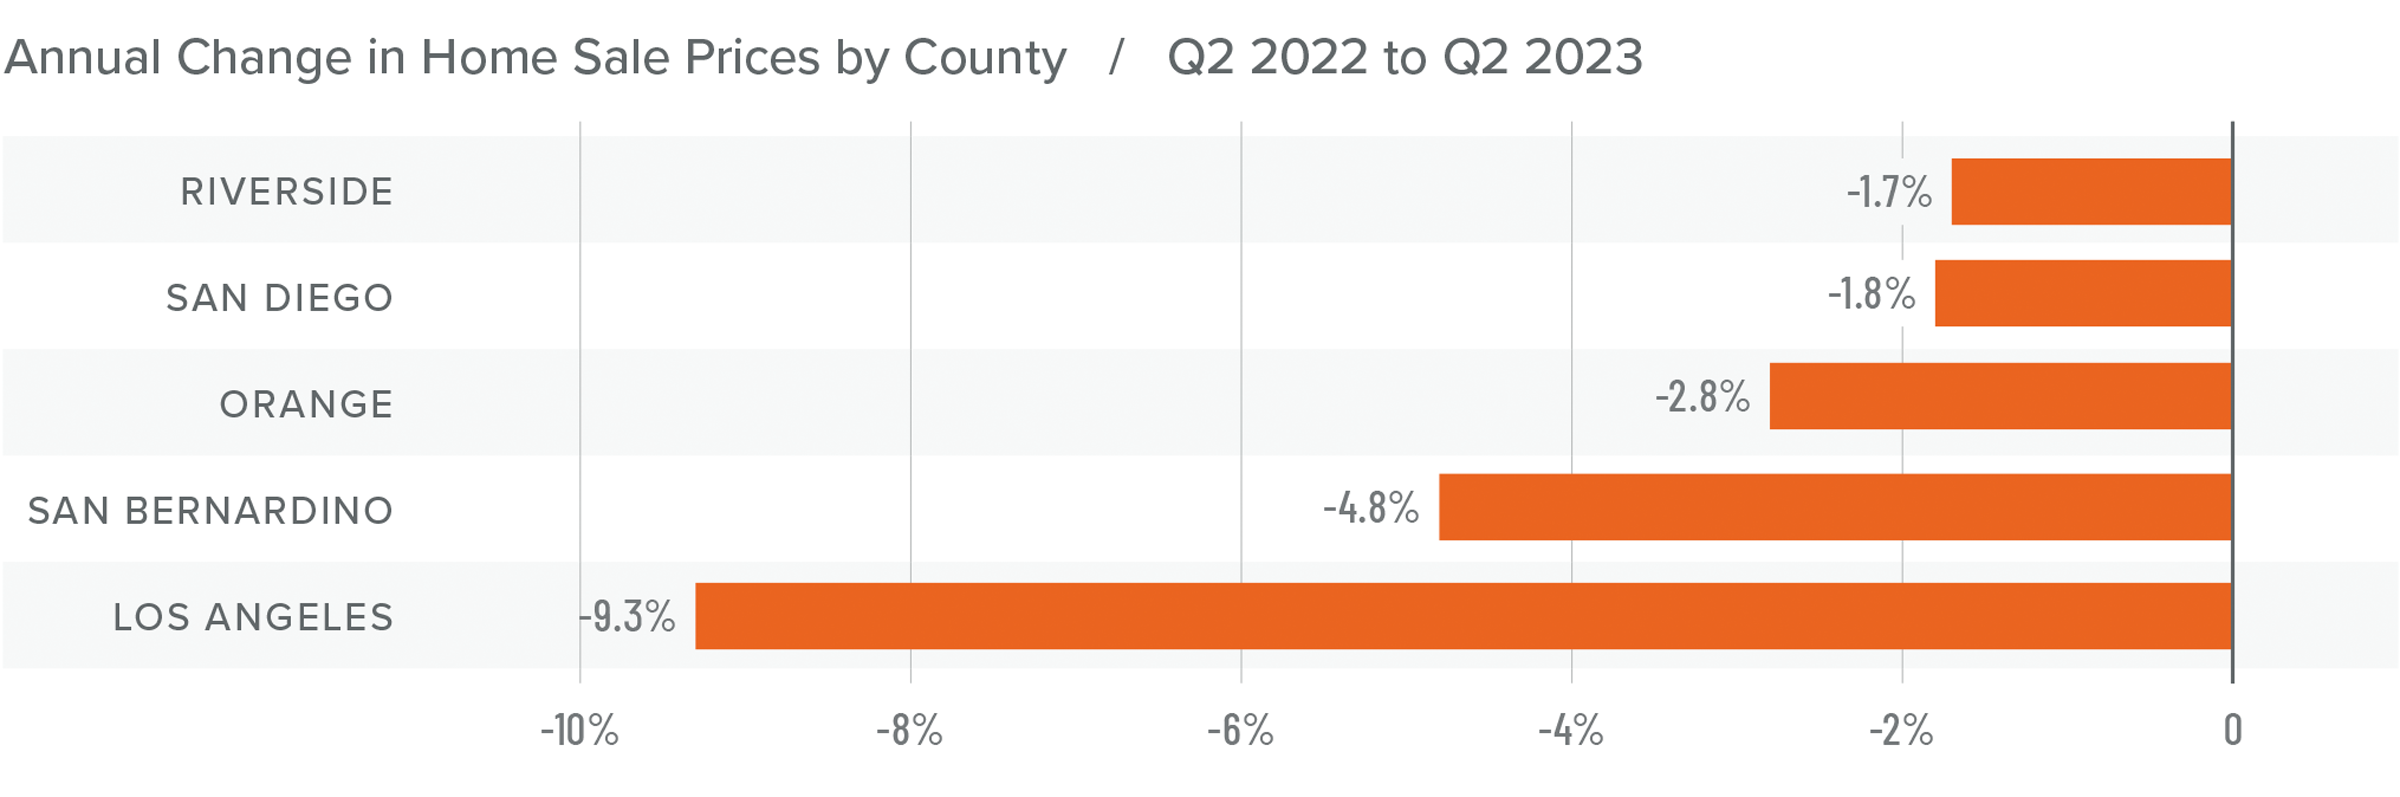
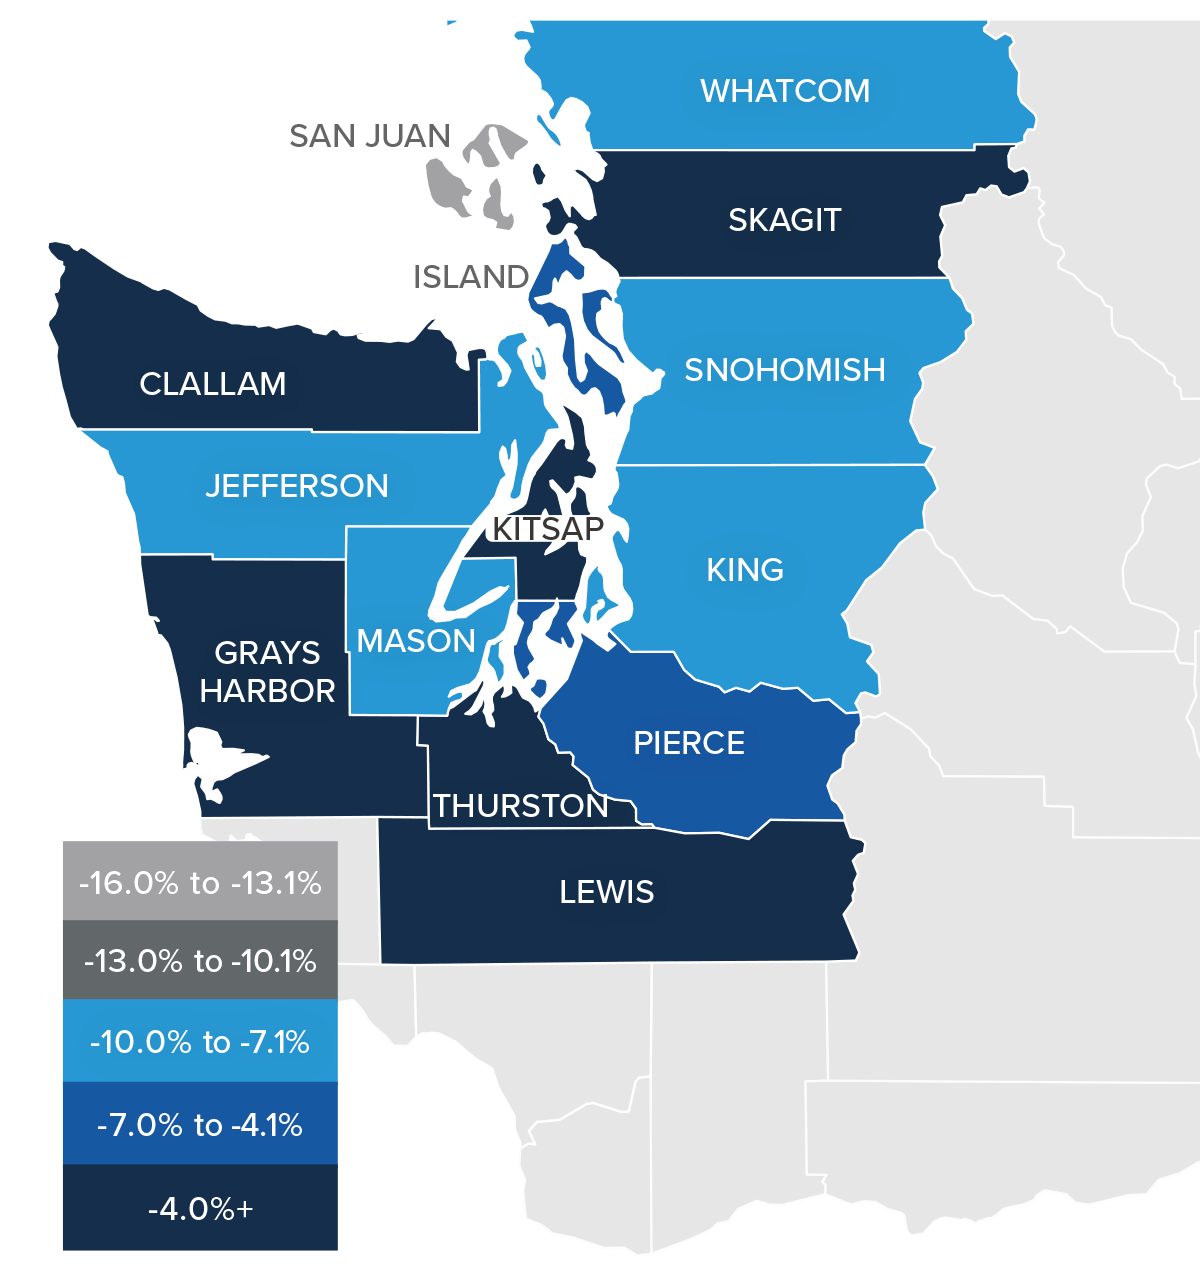
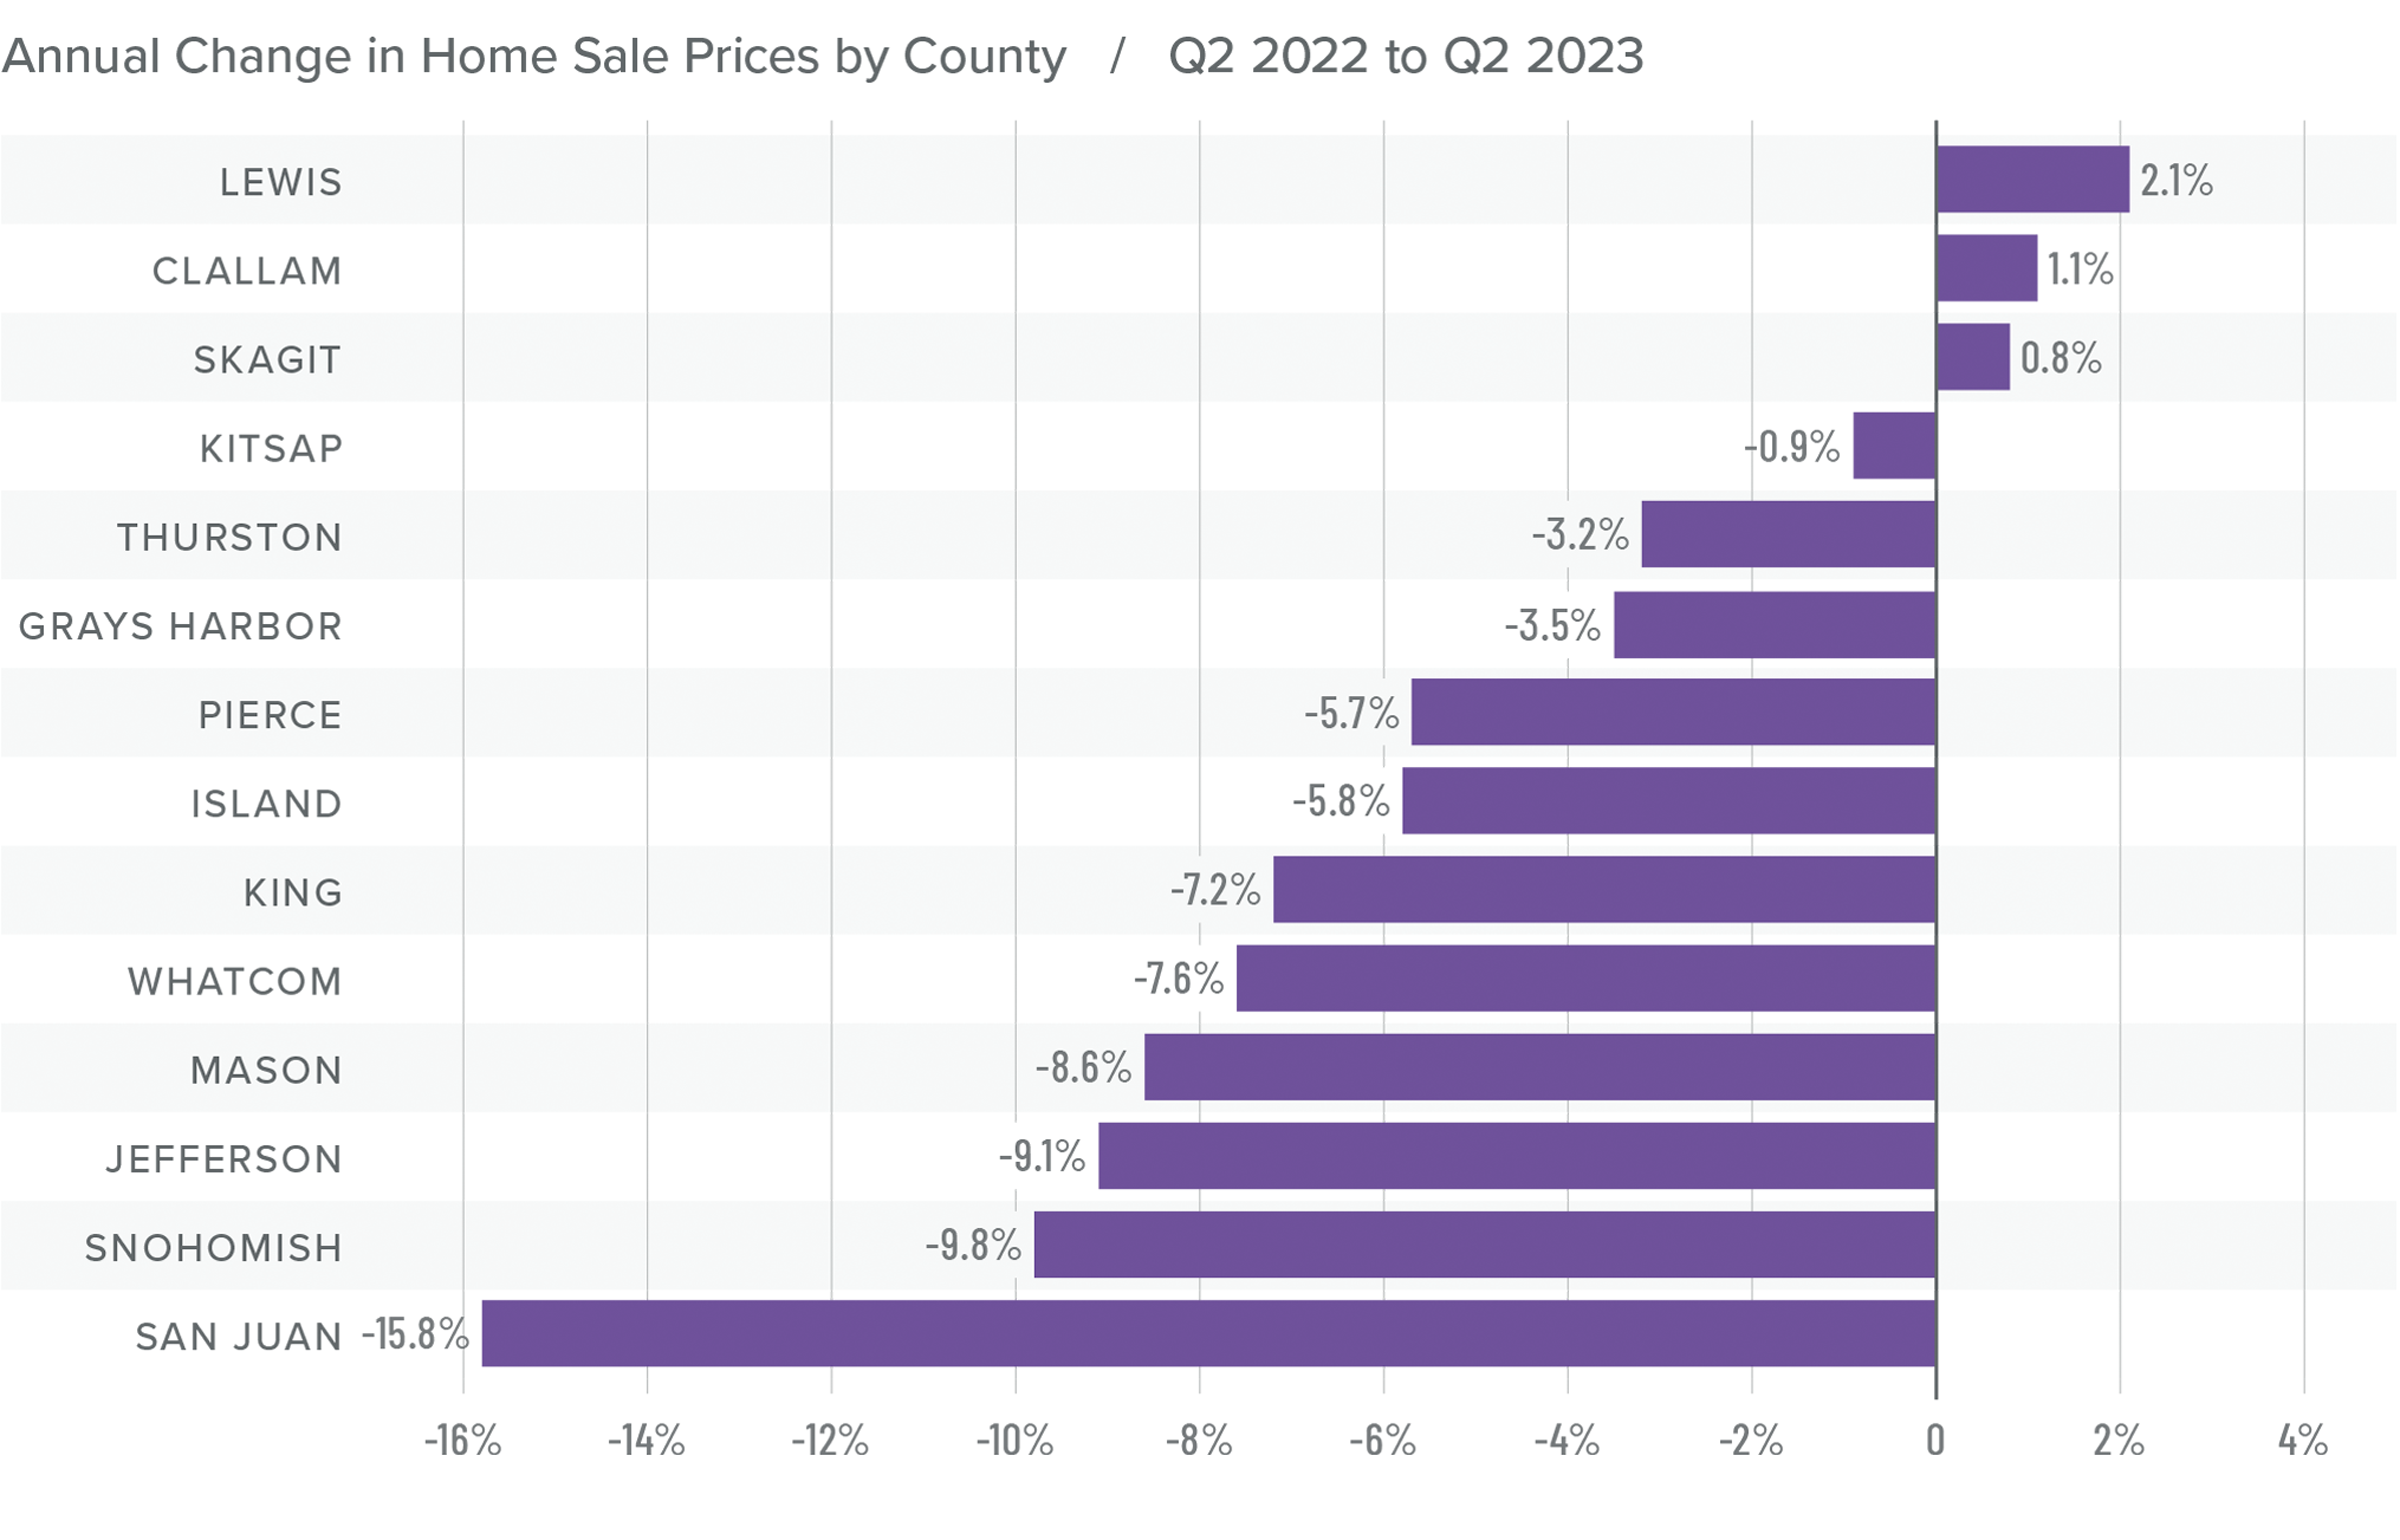
Montana Home Prices
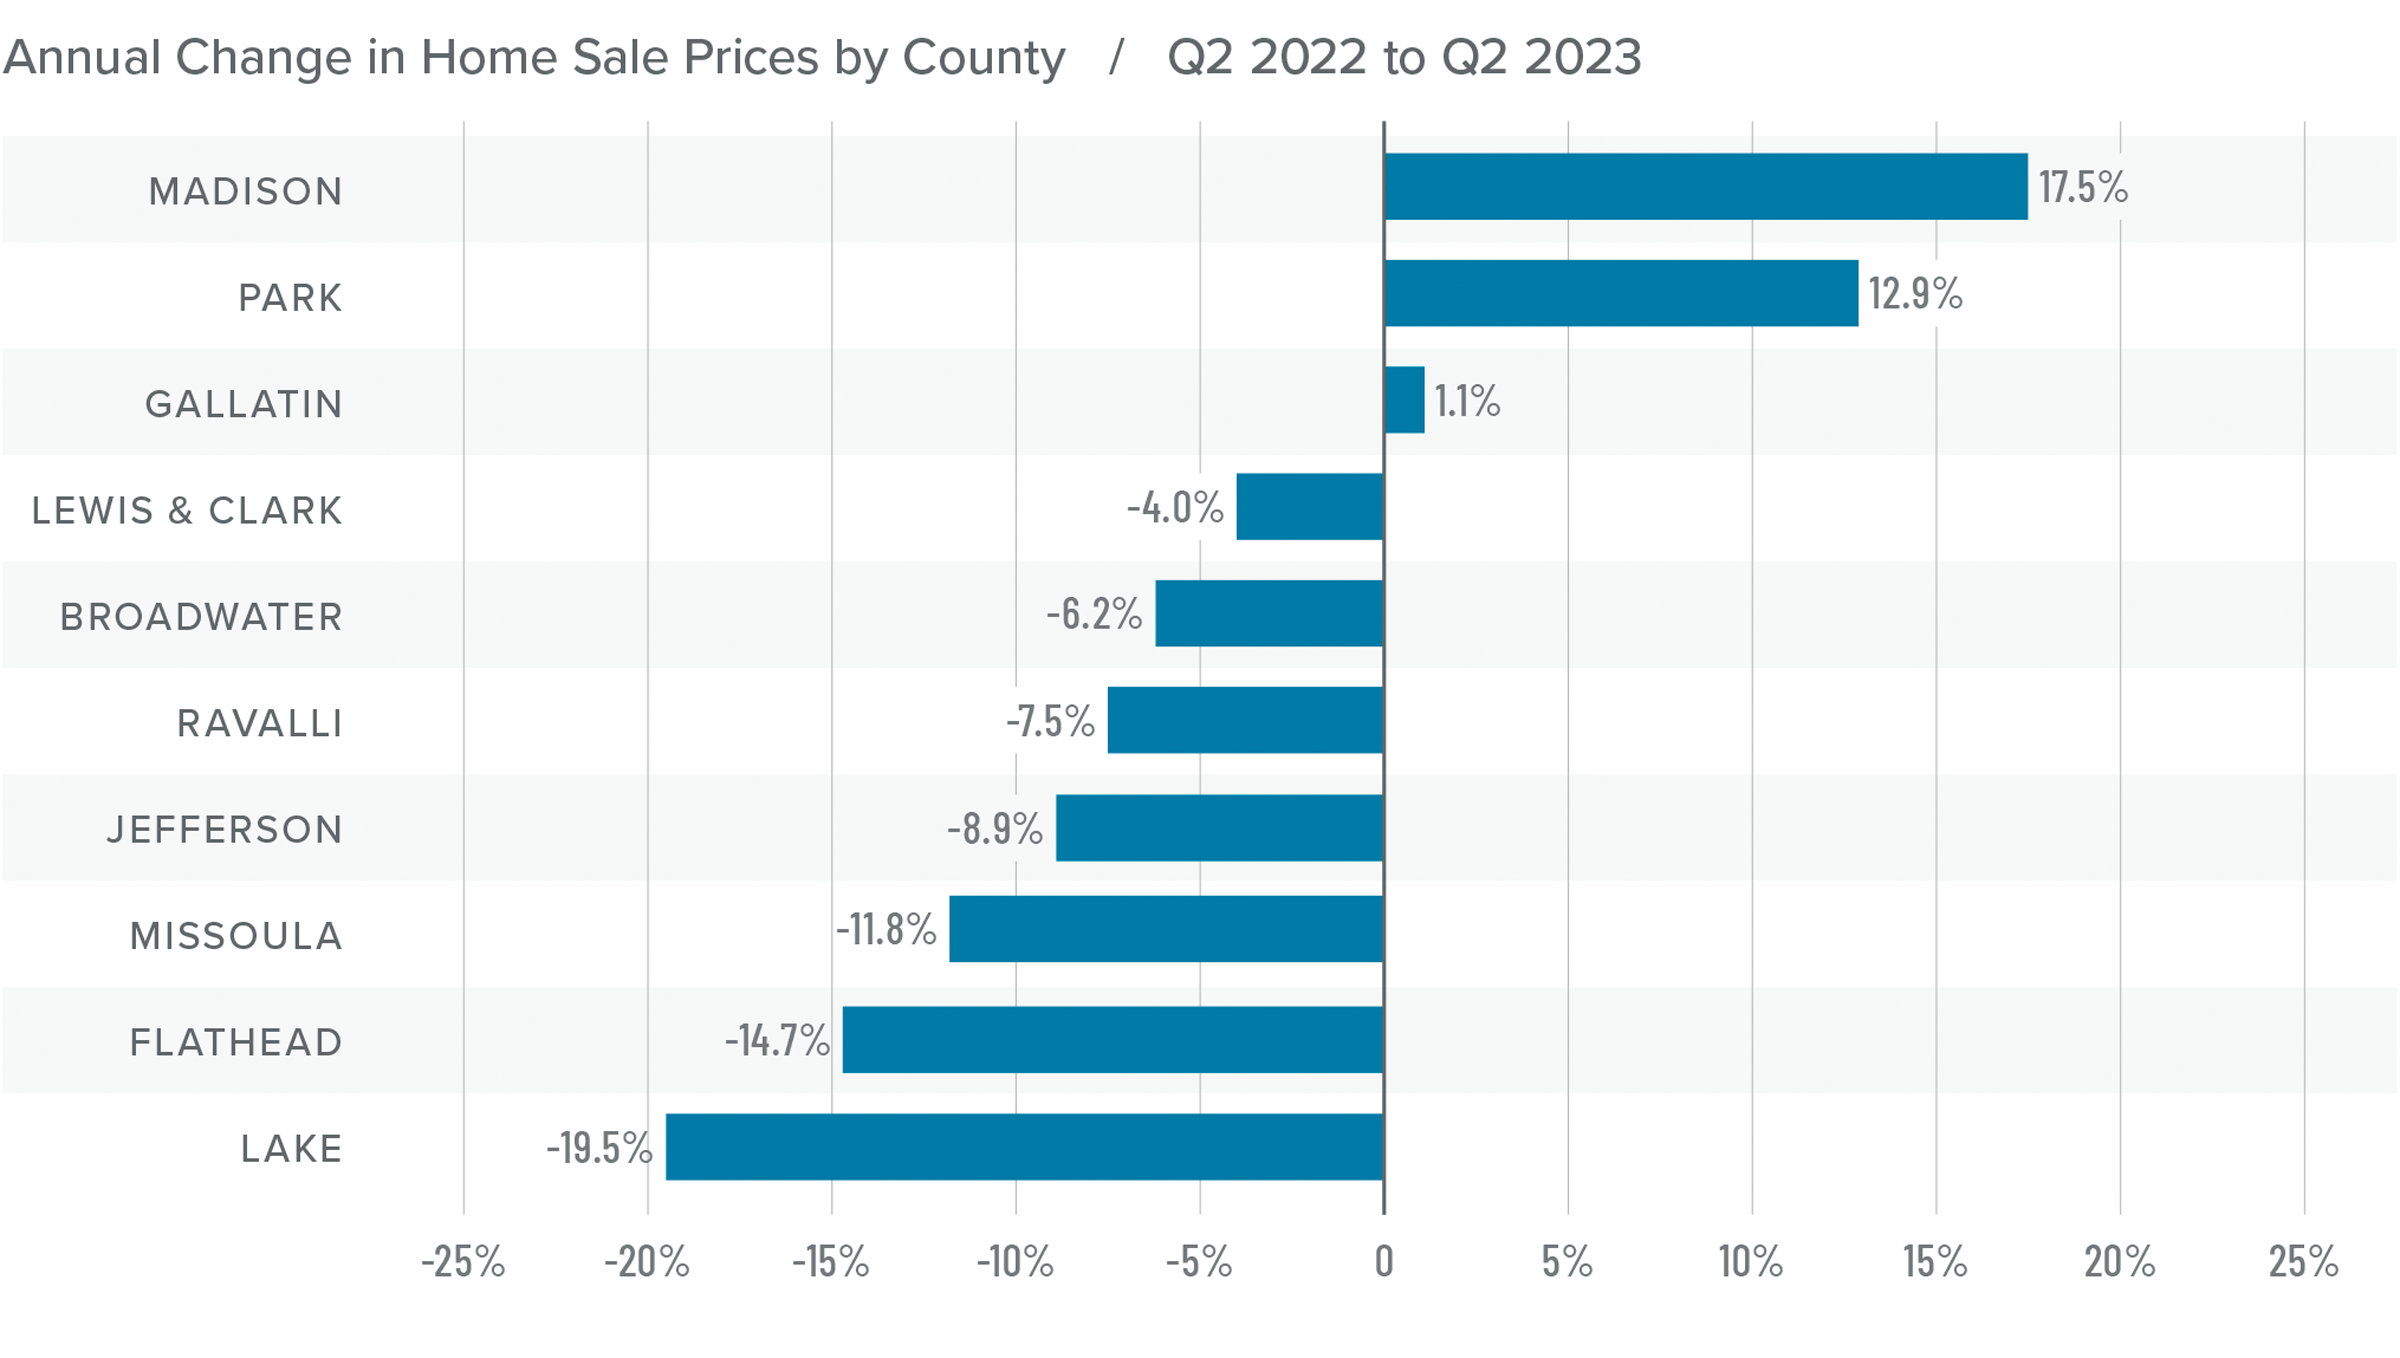
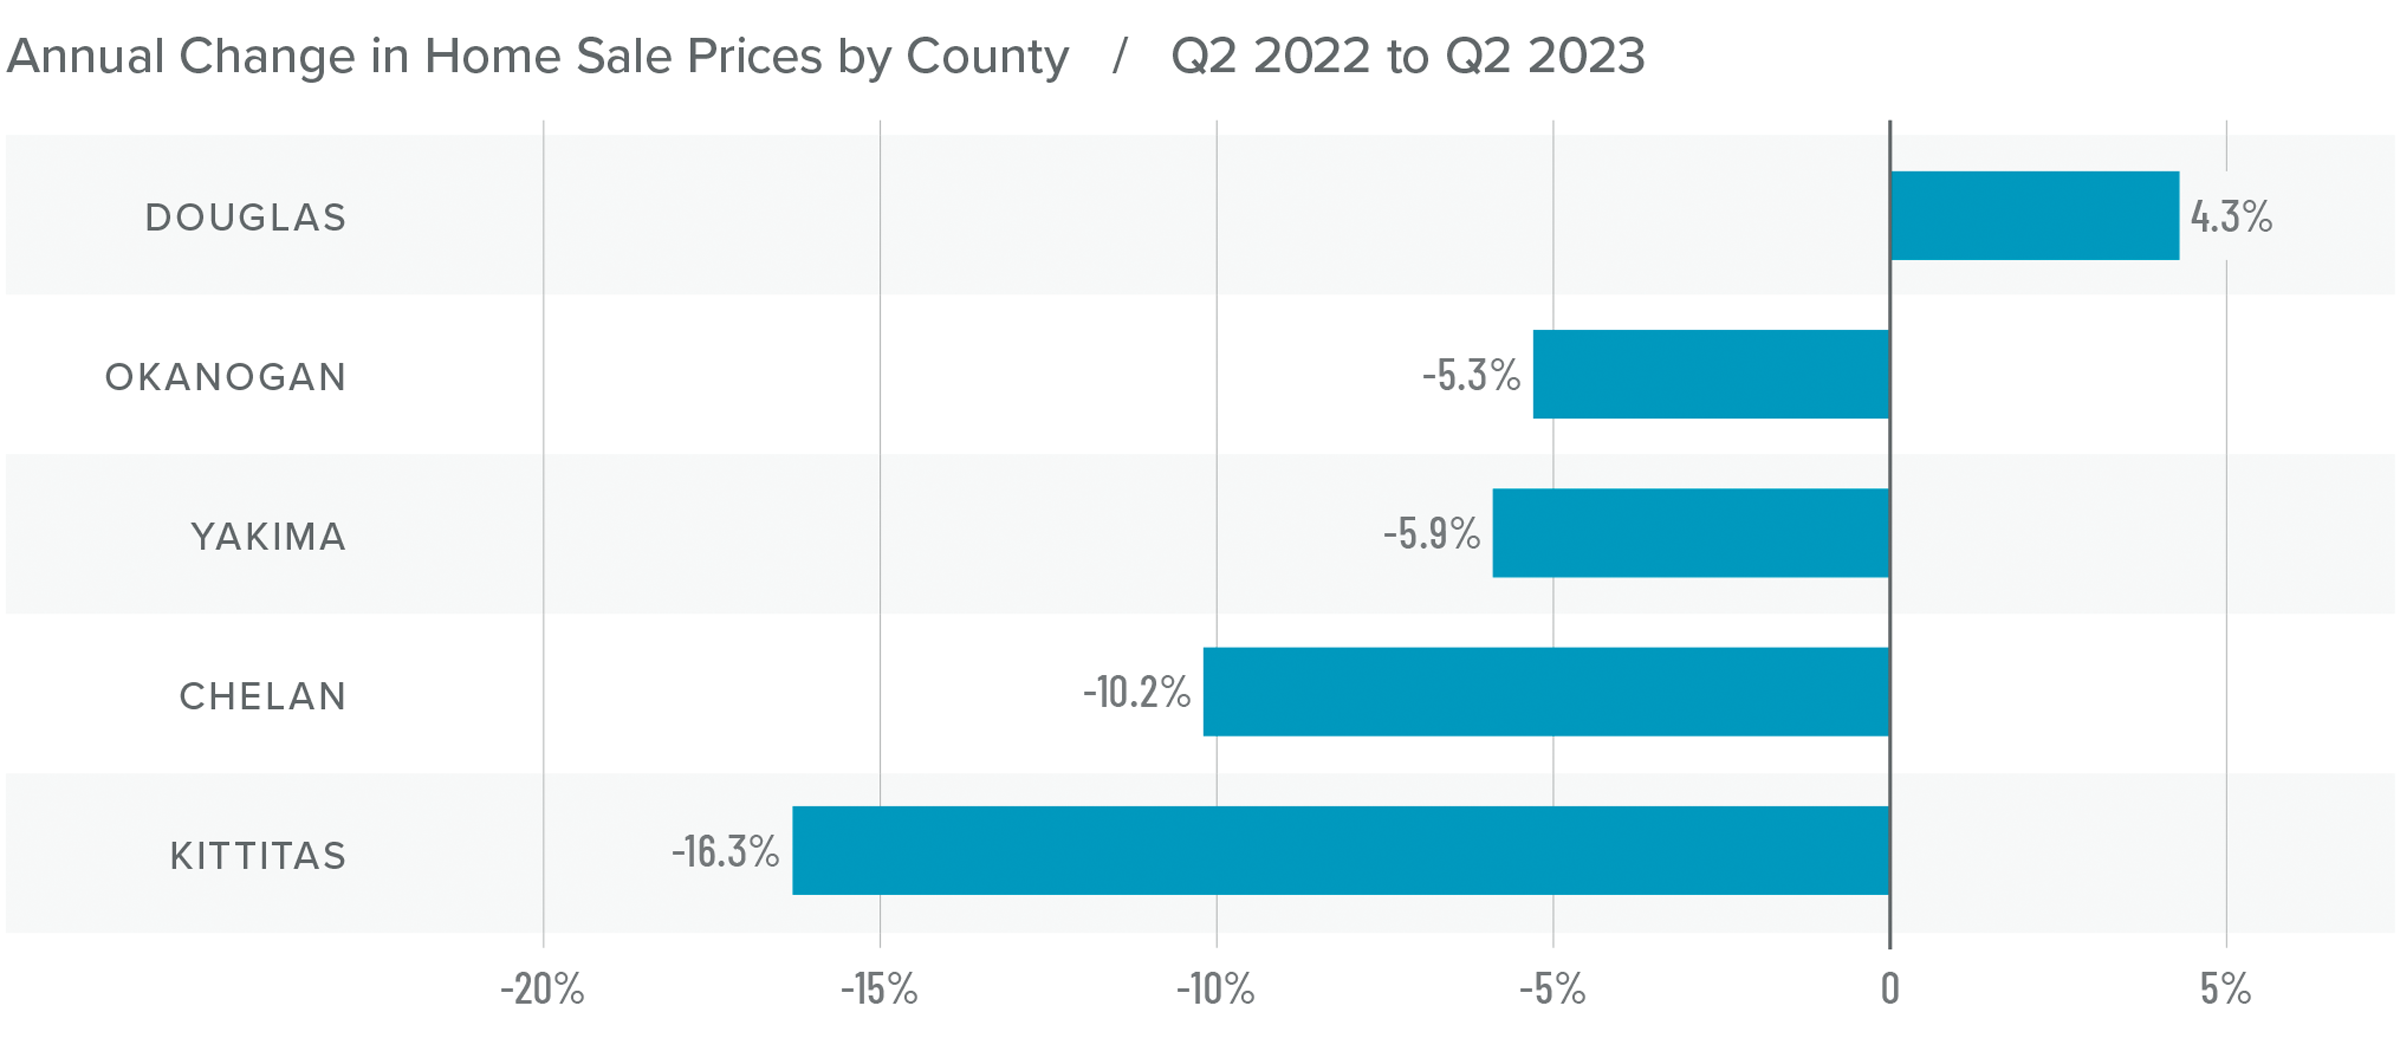
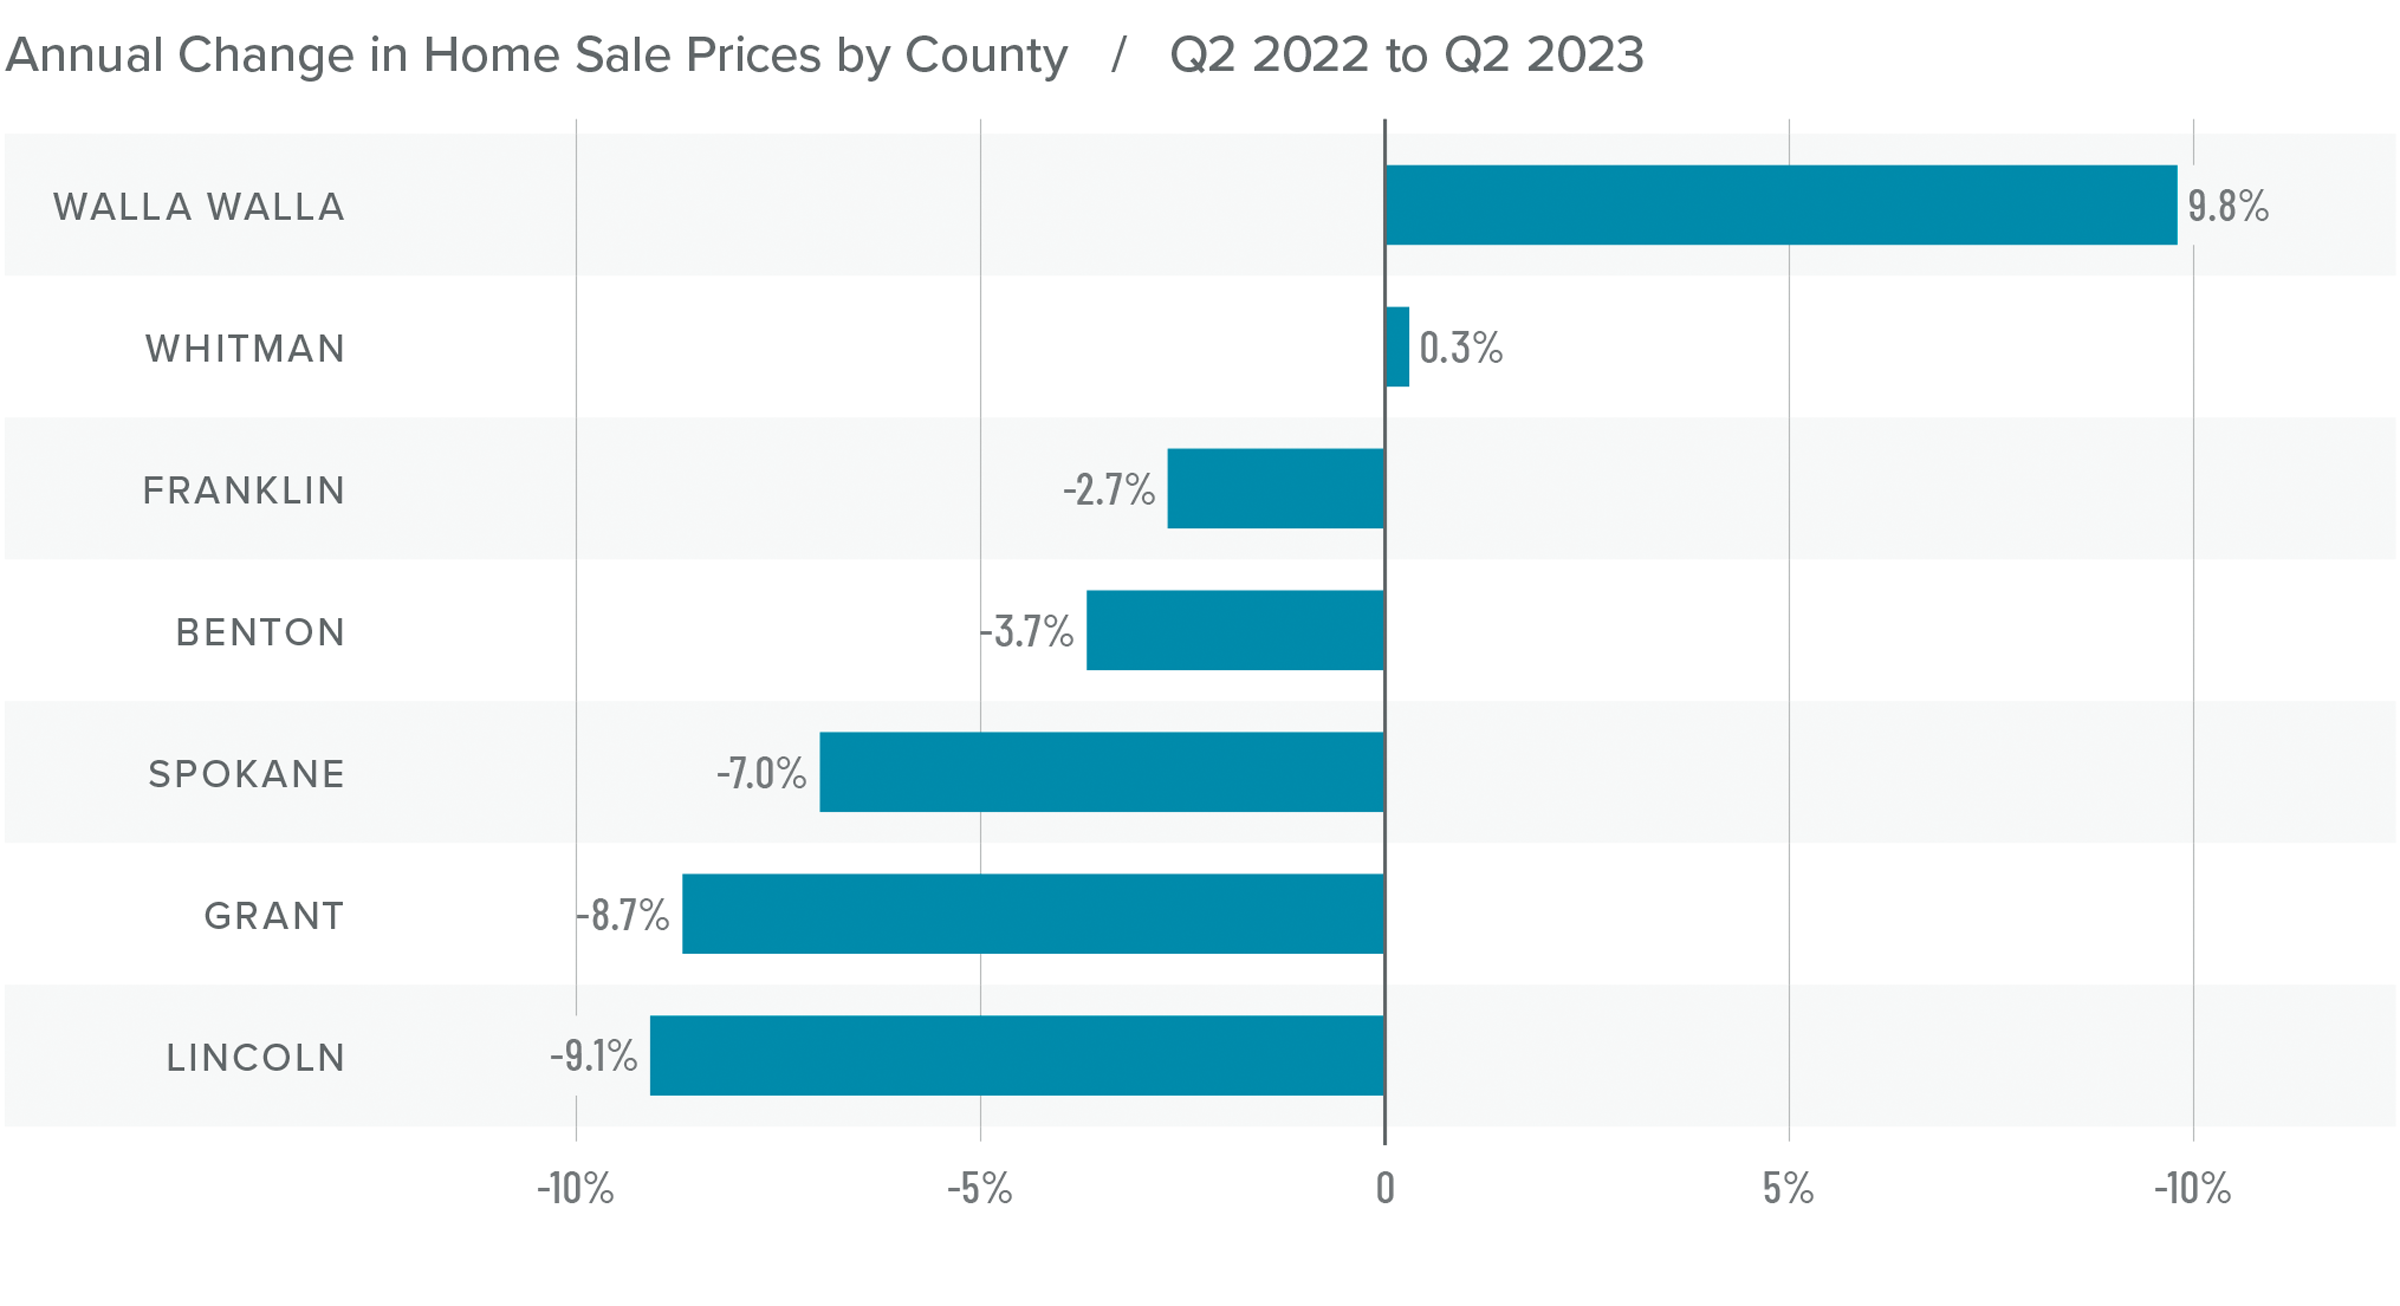
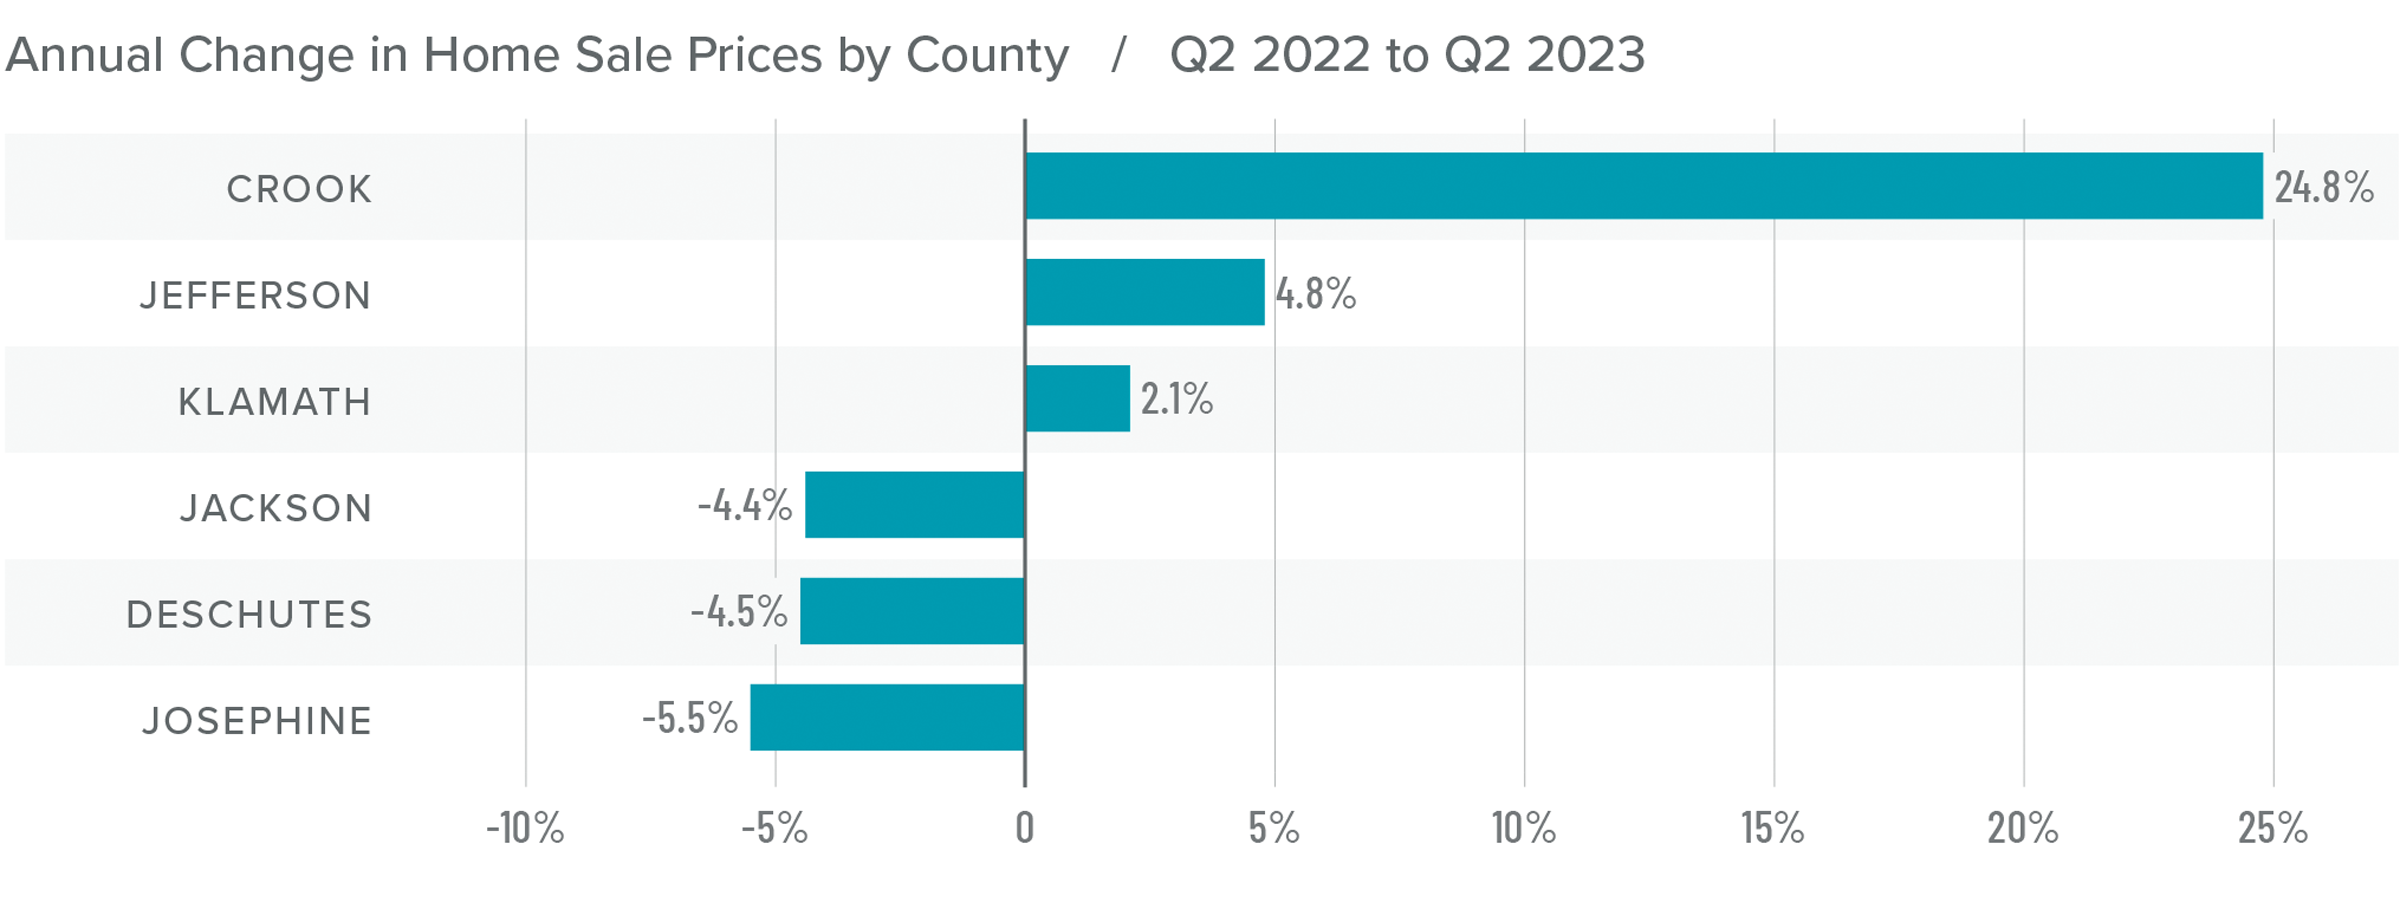
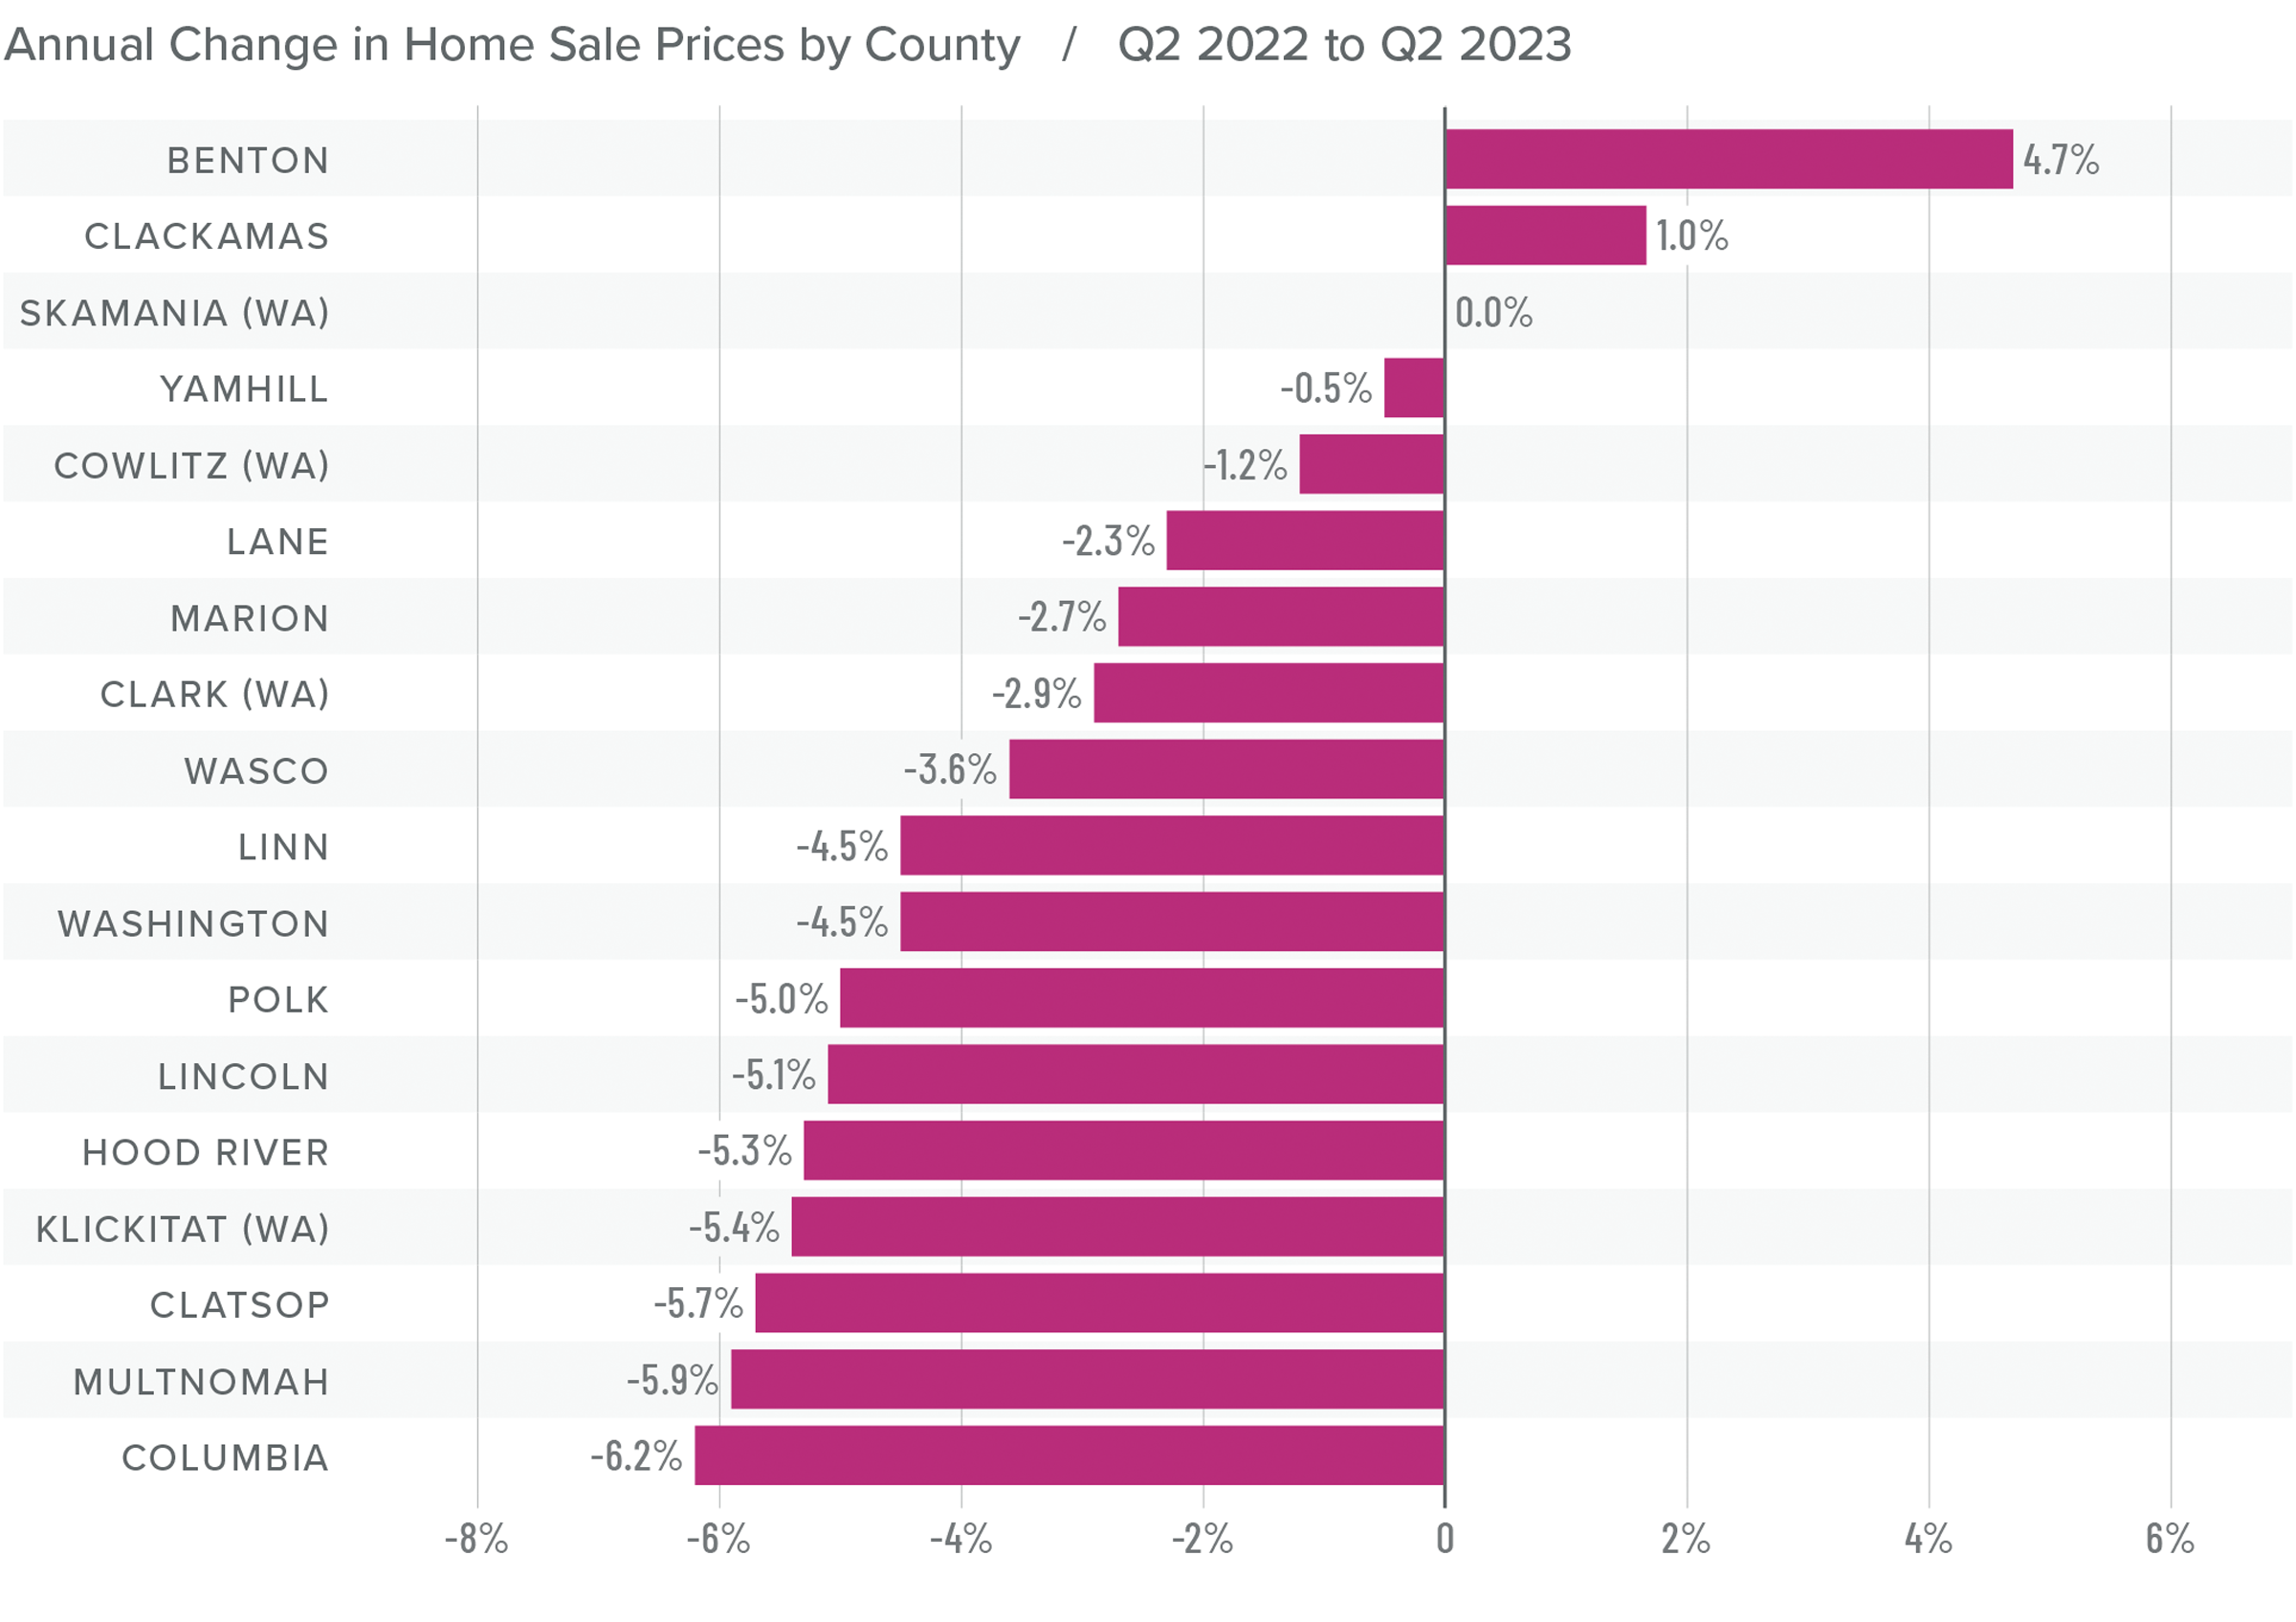
❱ Home prices were down 5% year over year, with an average sale price of $760,428. The average home price rose .1% compared to the first quarter of 2022.
❱ I wasn’t surprised that home prices fell in most areas compared to the same period in 2022. A year ago home buyers were scrambling to buy before mortgage rates skyrocketed.
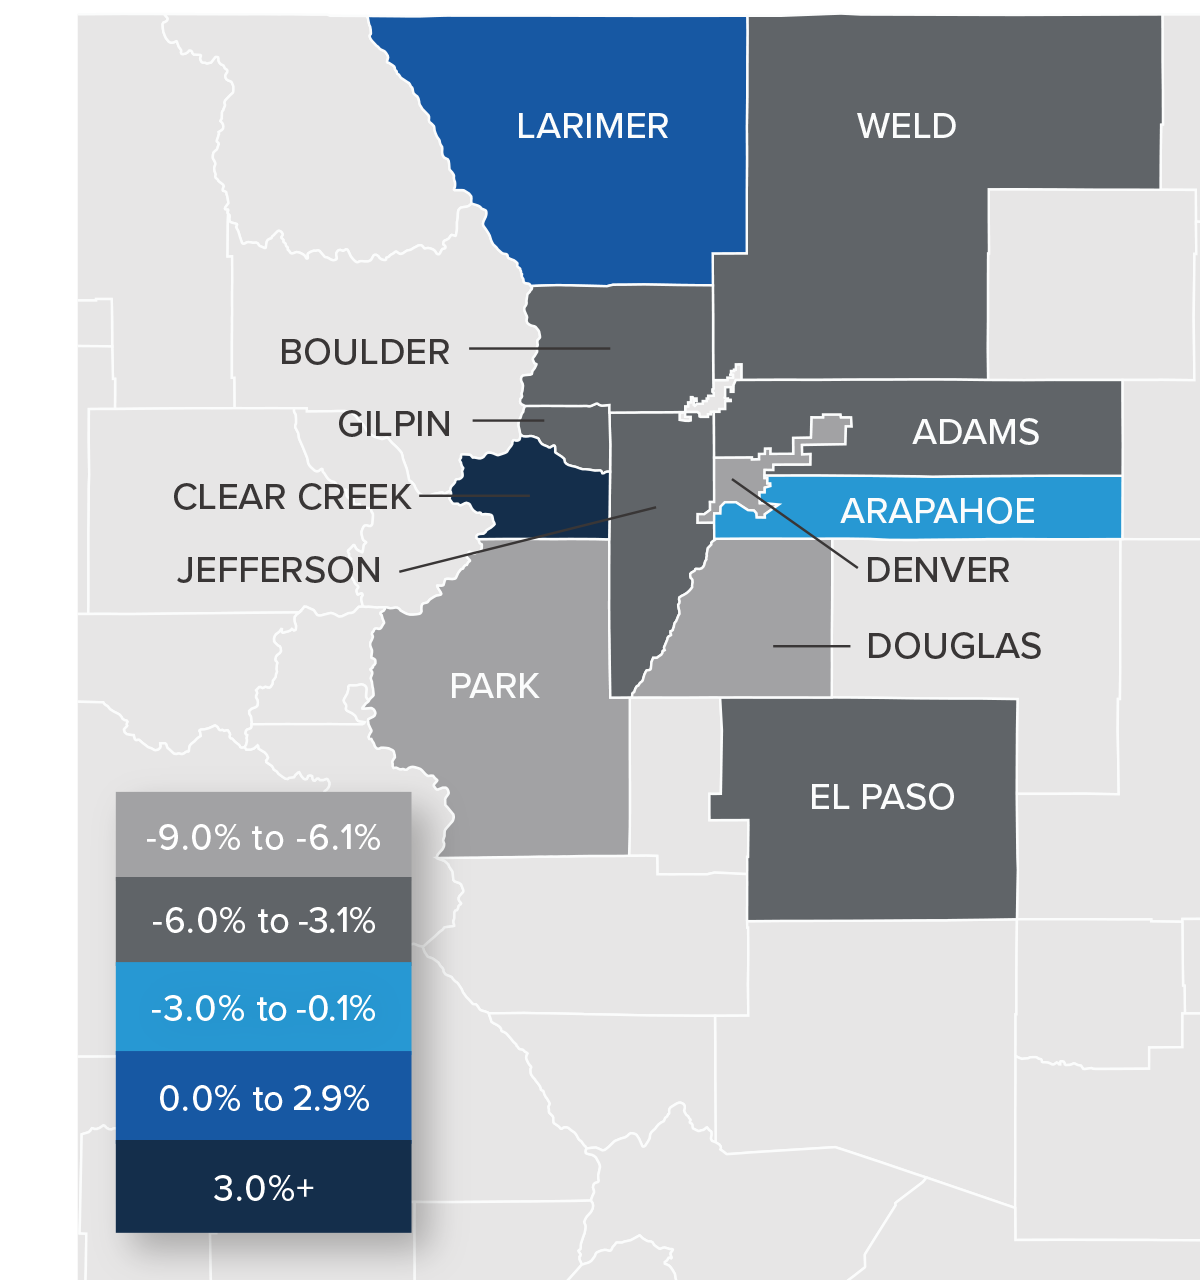
❱ Year over year, prices rose in three counties and fell in seven. Compared to the first quarter of this year, every county other than Lake, Lewis & Clark, and Flathead saw prices rise.
❱ Mortgage rates remain high, and it’s now likely they will remain higher for longer than anticipated. That will take some steam out of price growth in the second half of the year. This is also supported by lower median list prices than in the first quarter. Sellers seem to understand that higher borrowing costs are having an impact on buyers.
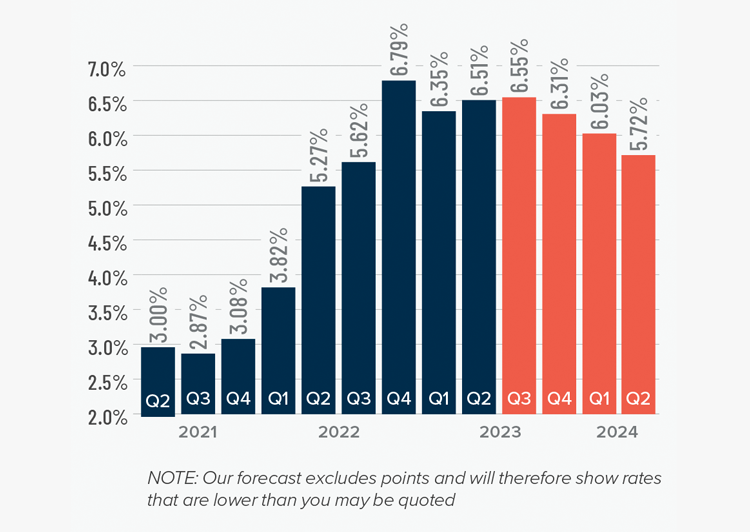
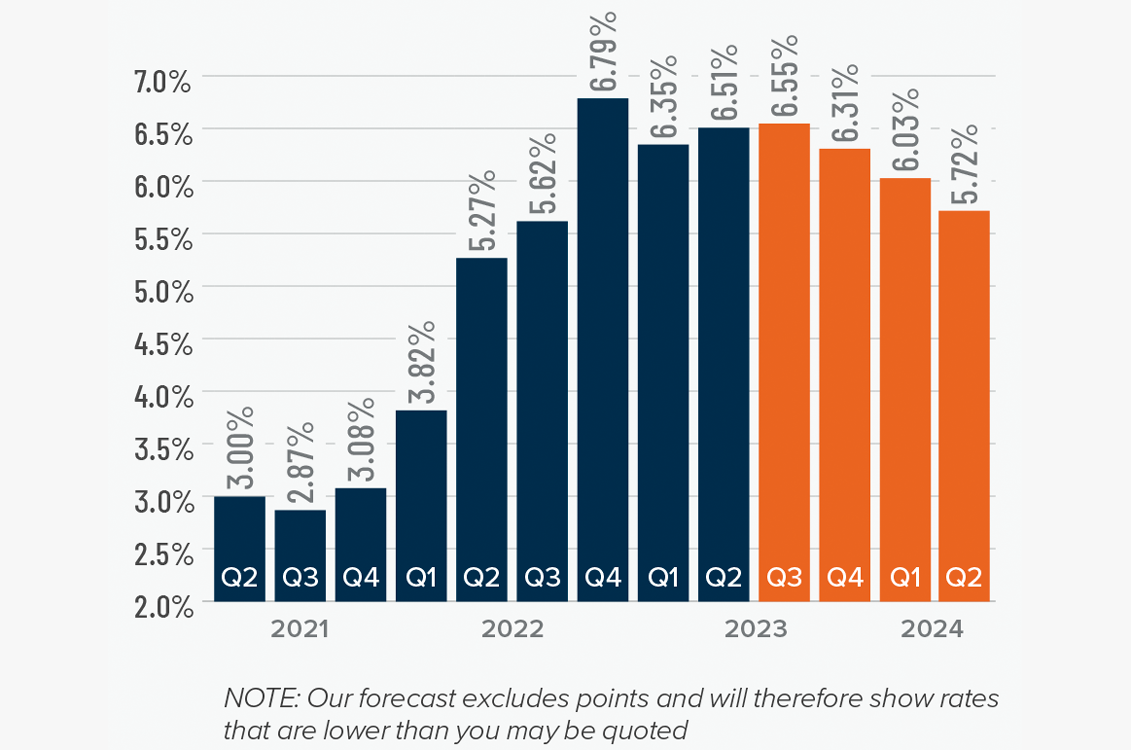
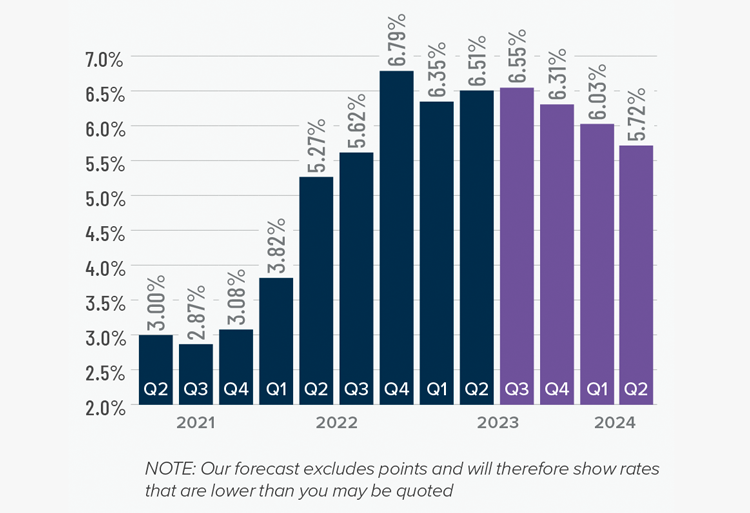
Mortgage Rates
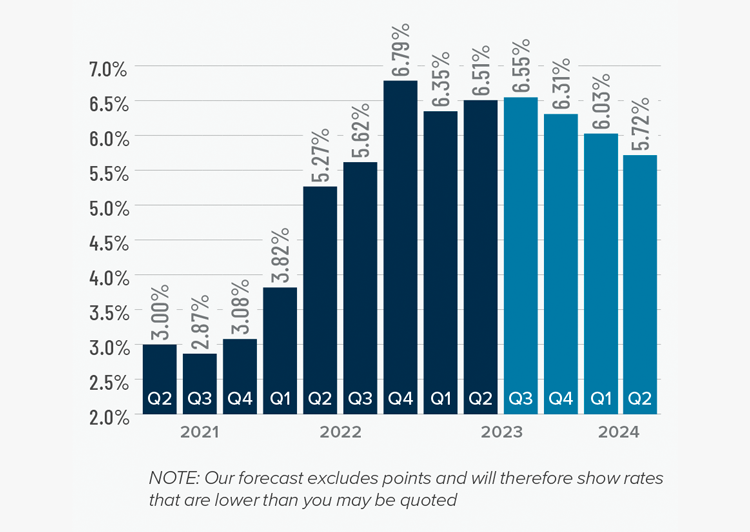
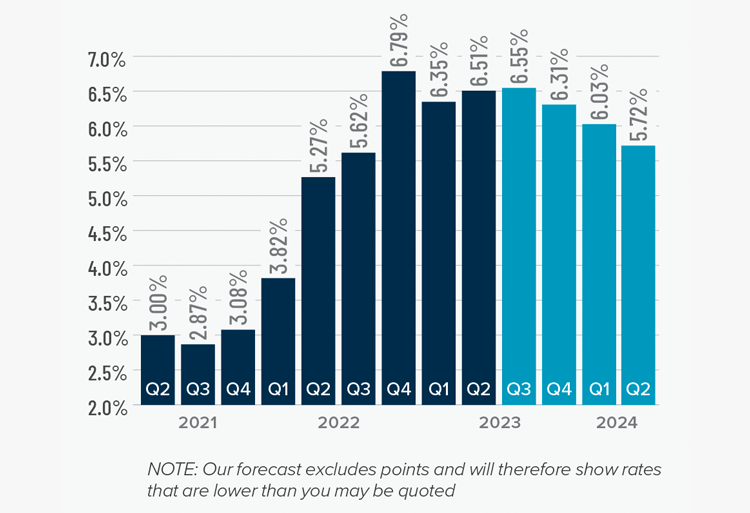
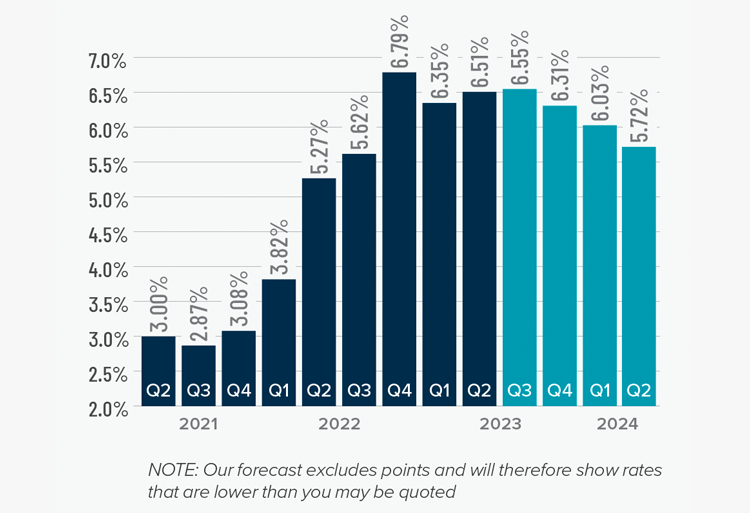
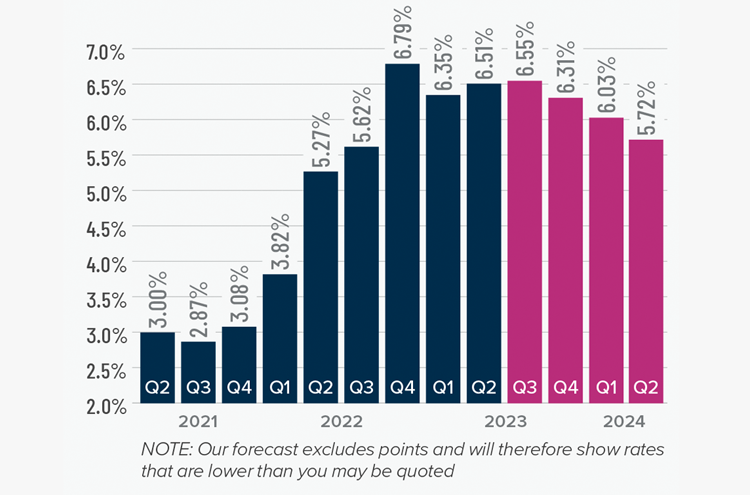
Although they were less erratic than the first quarter, mortgage rates unfortunately trended higher and ended the quarter above 7%. This was due to the short debt ceiling impasse, as well as several economic datasets that suggested the U.S. economy was not slowing at the speed required by the Federal Reserve.
While the June employment report showed fewer jobs created than earlier in the year, as well as downward revisions to prior gains, inflation has not sufficiently slowed. Until it does, rates cannot start to trend consistently lower. With the economy not slowing as fast as expected, I have adjusted my forecast: Rates will hold at current levels in third quarter and then start to trend lower through the fall. Although there are sure to be occasional spikes, my model now shows the 30-year fixed rate breaking below 6% next spring.
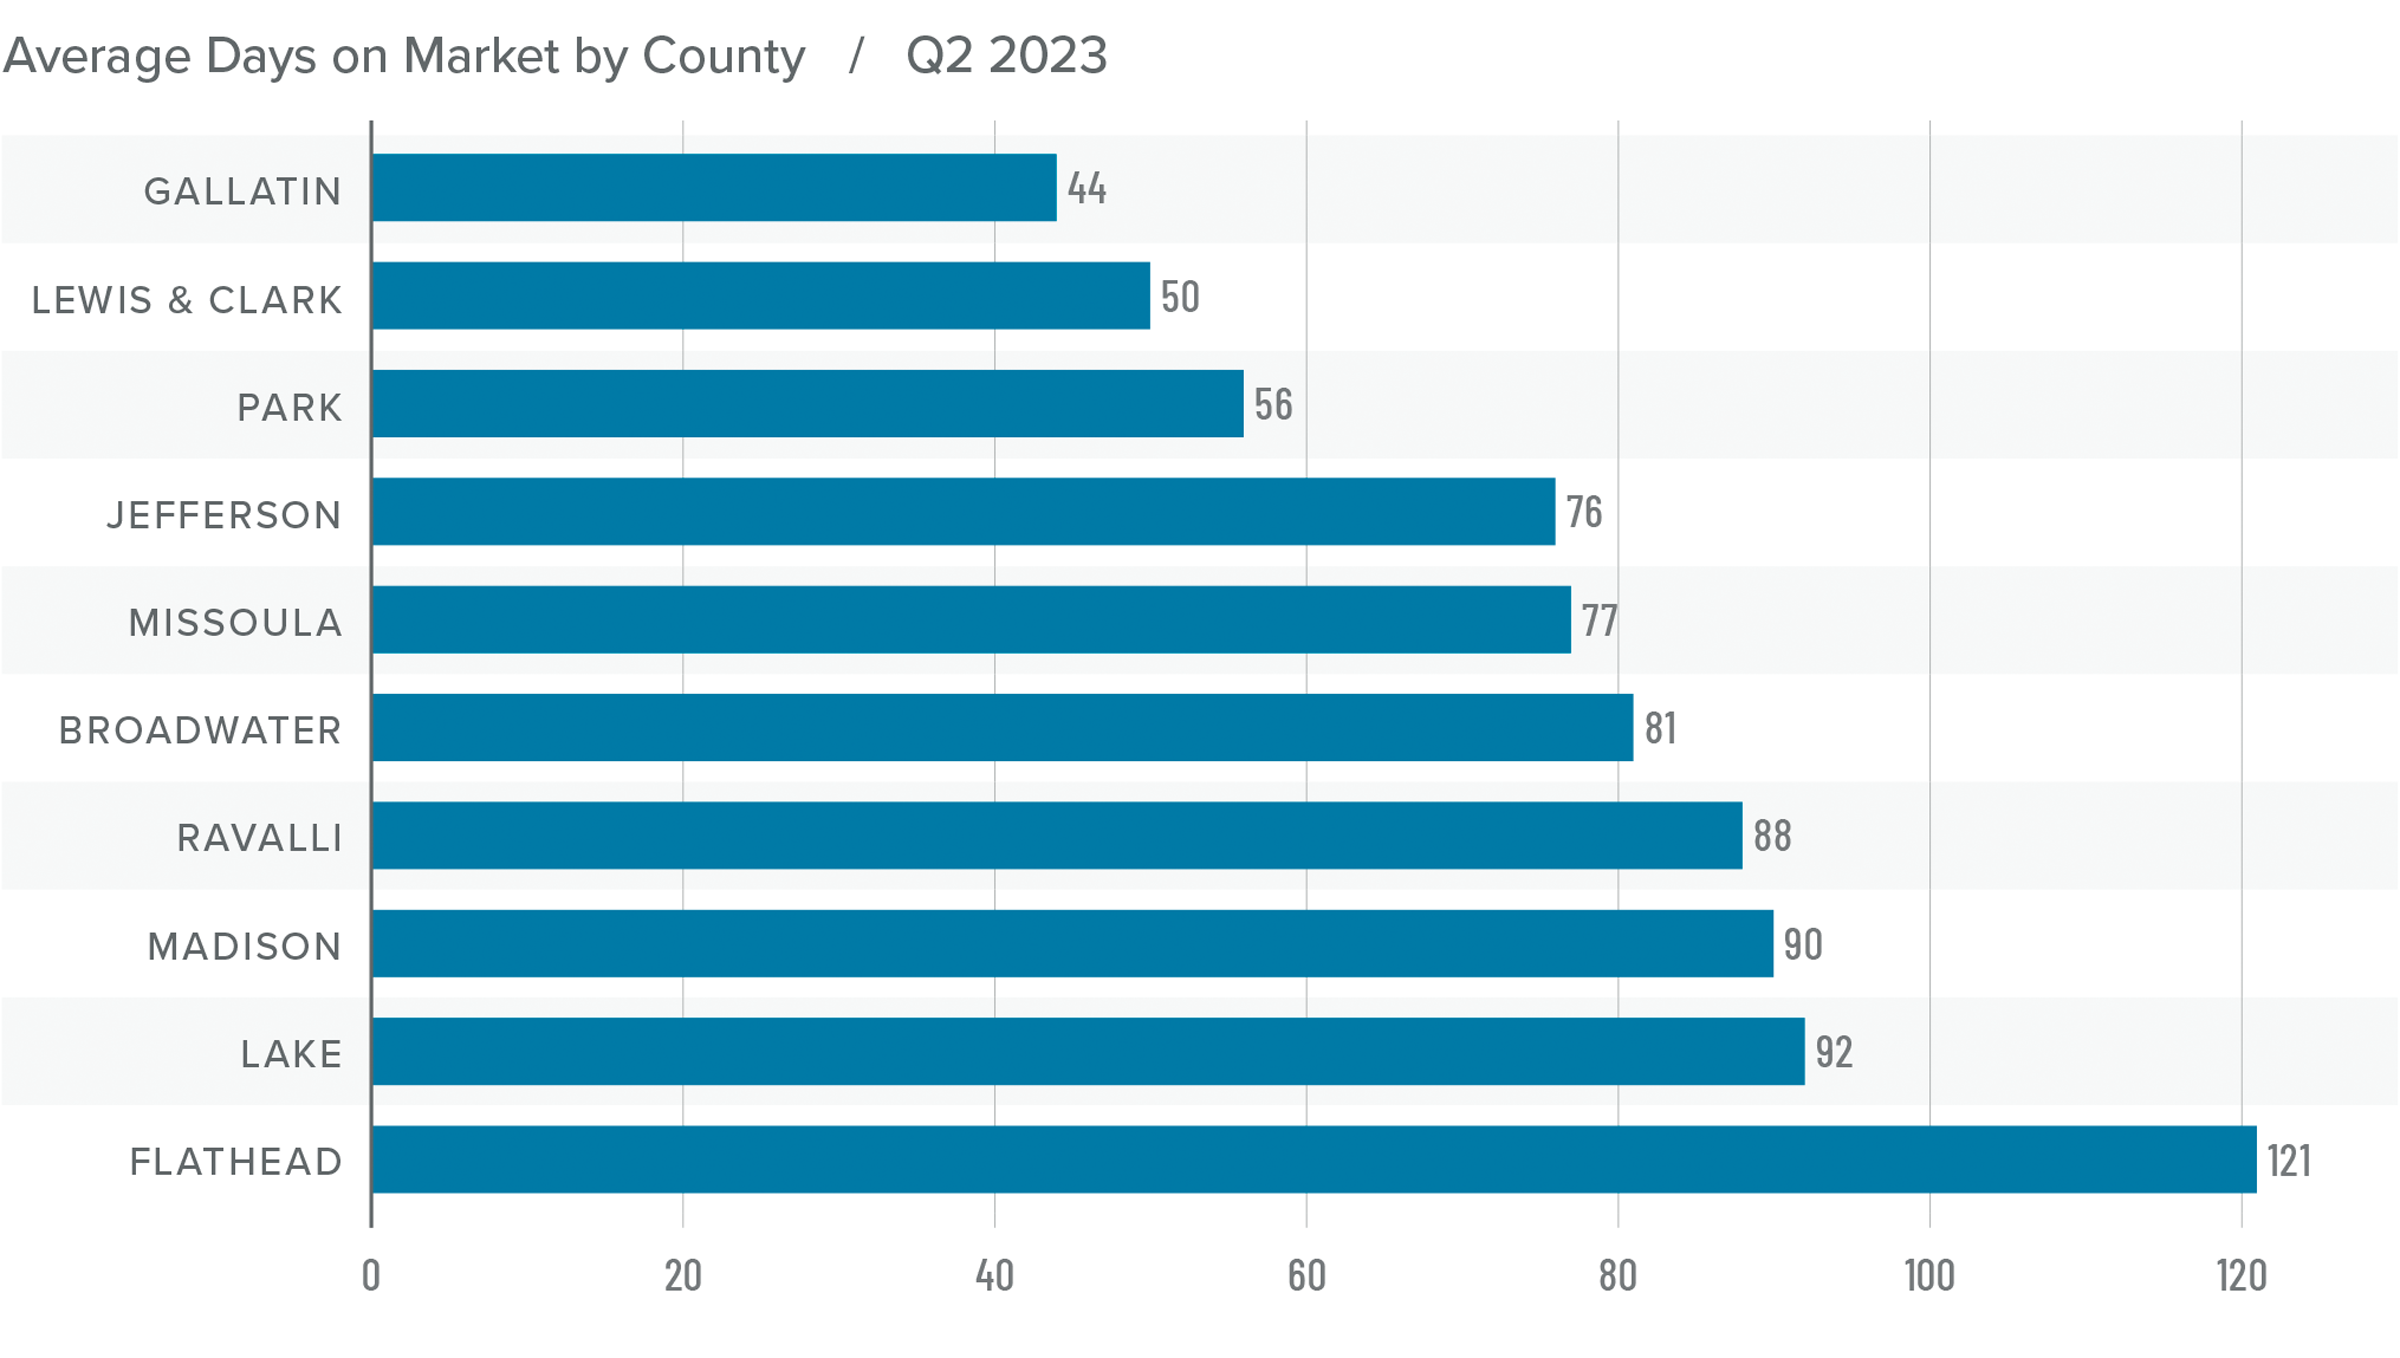
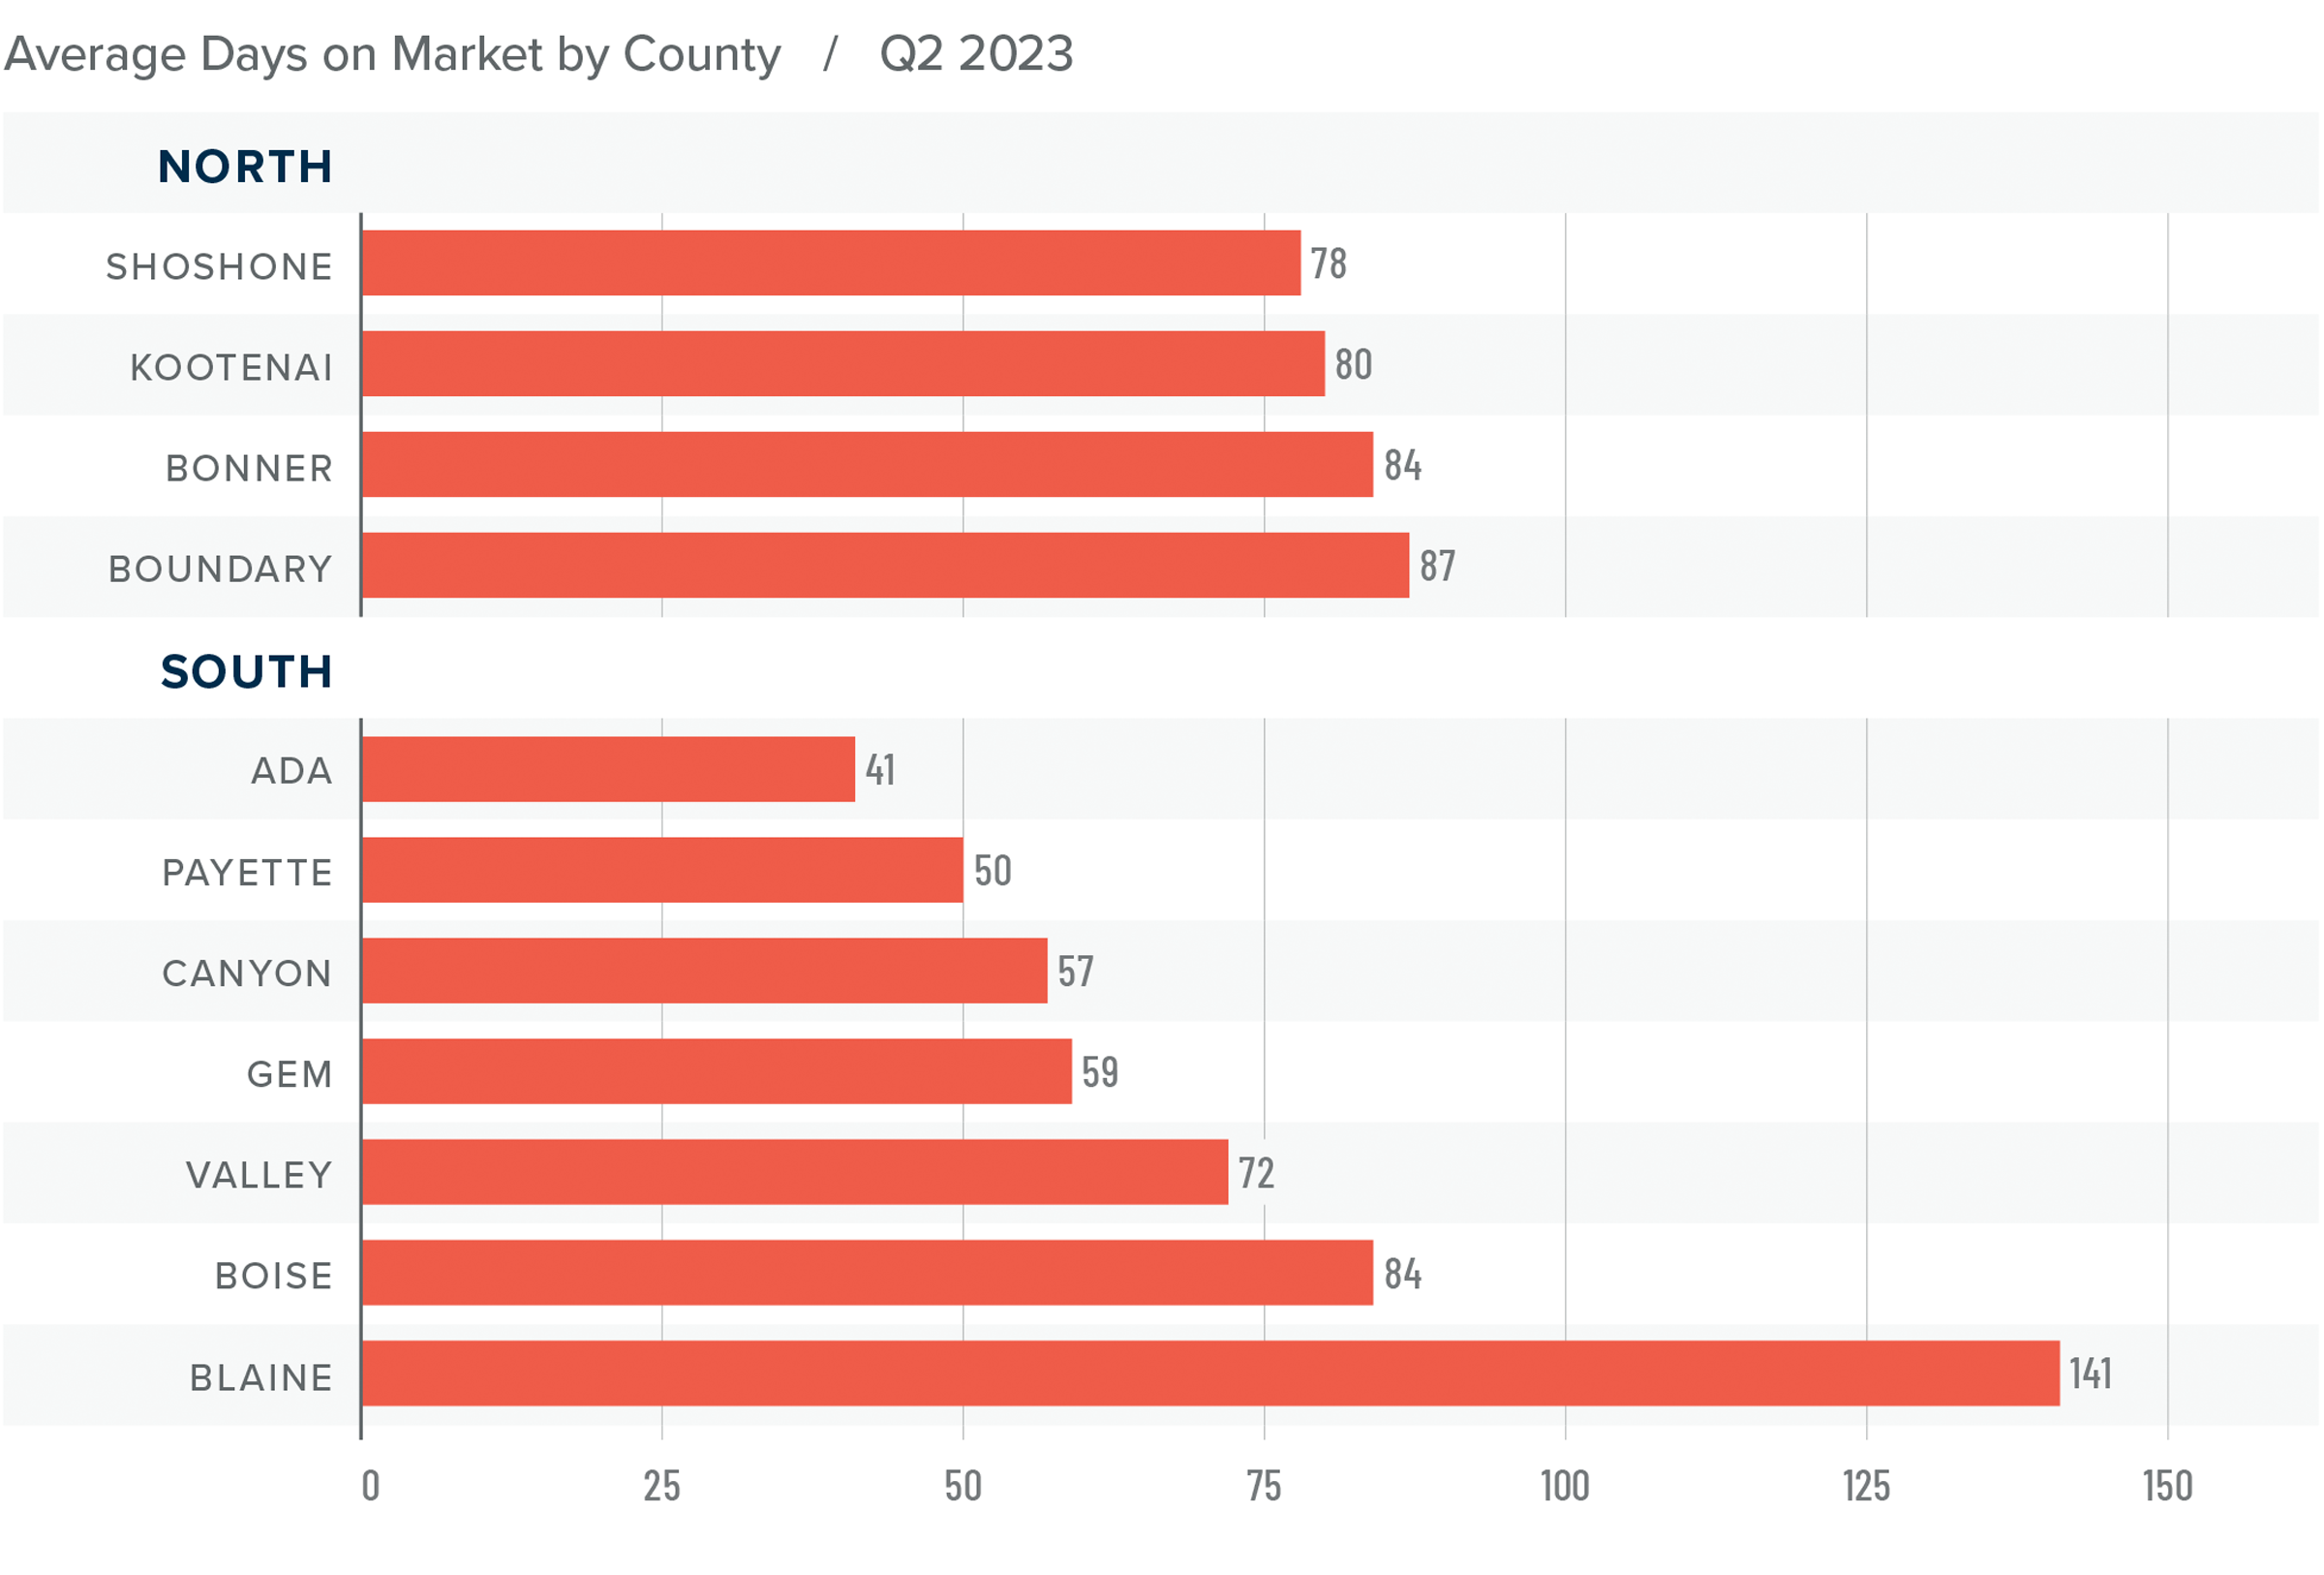
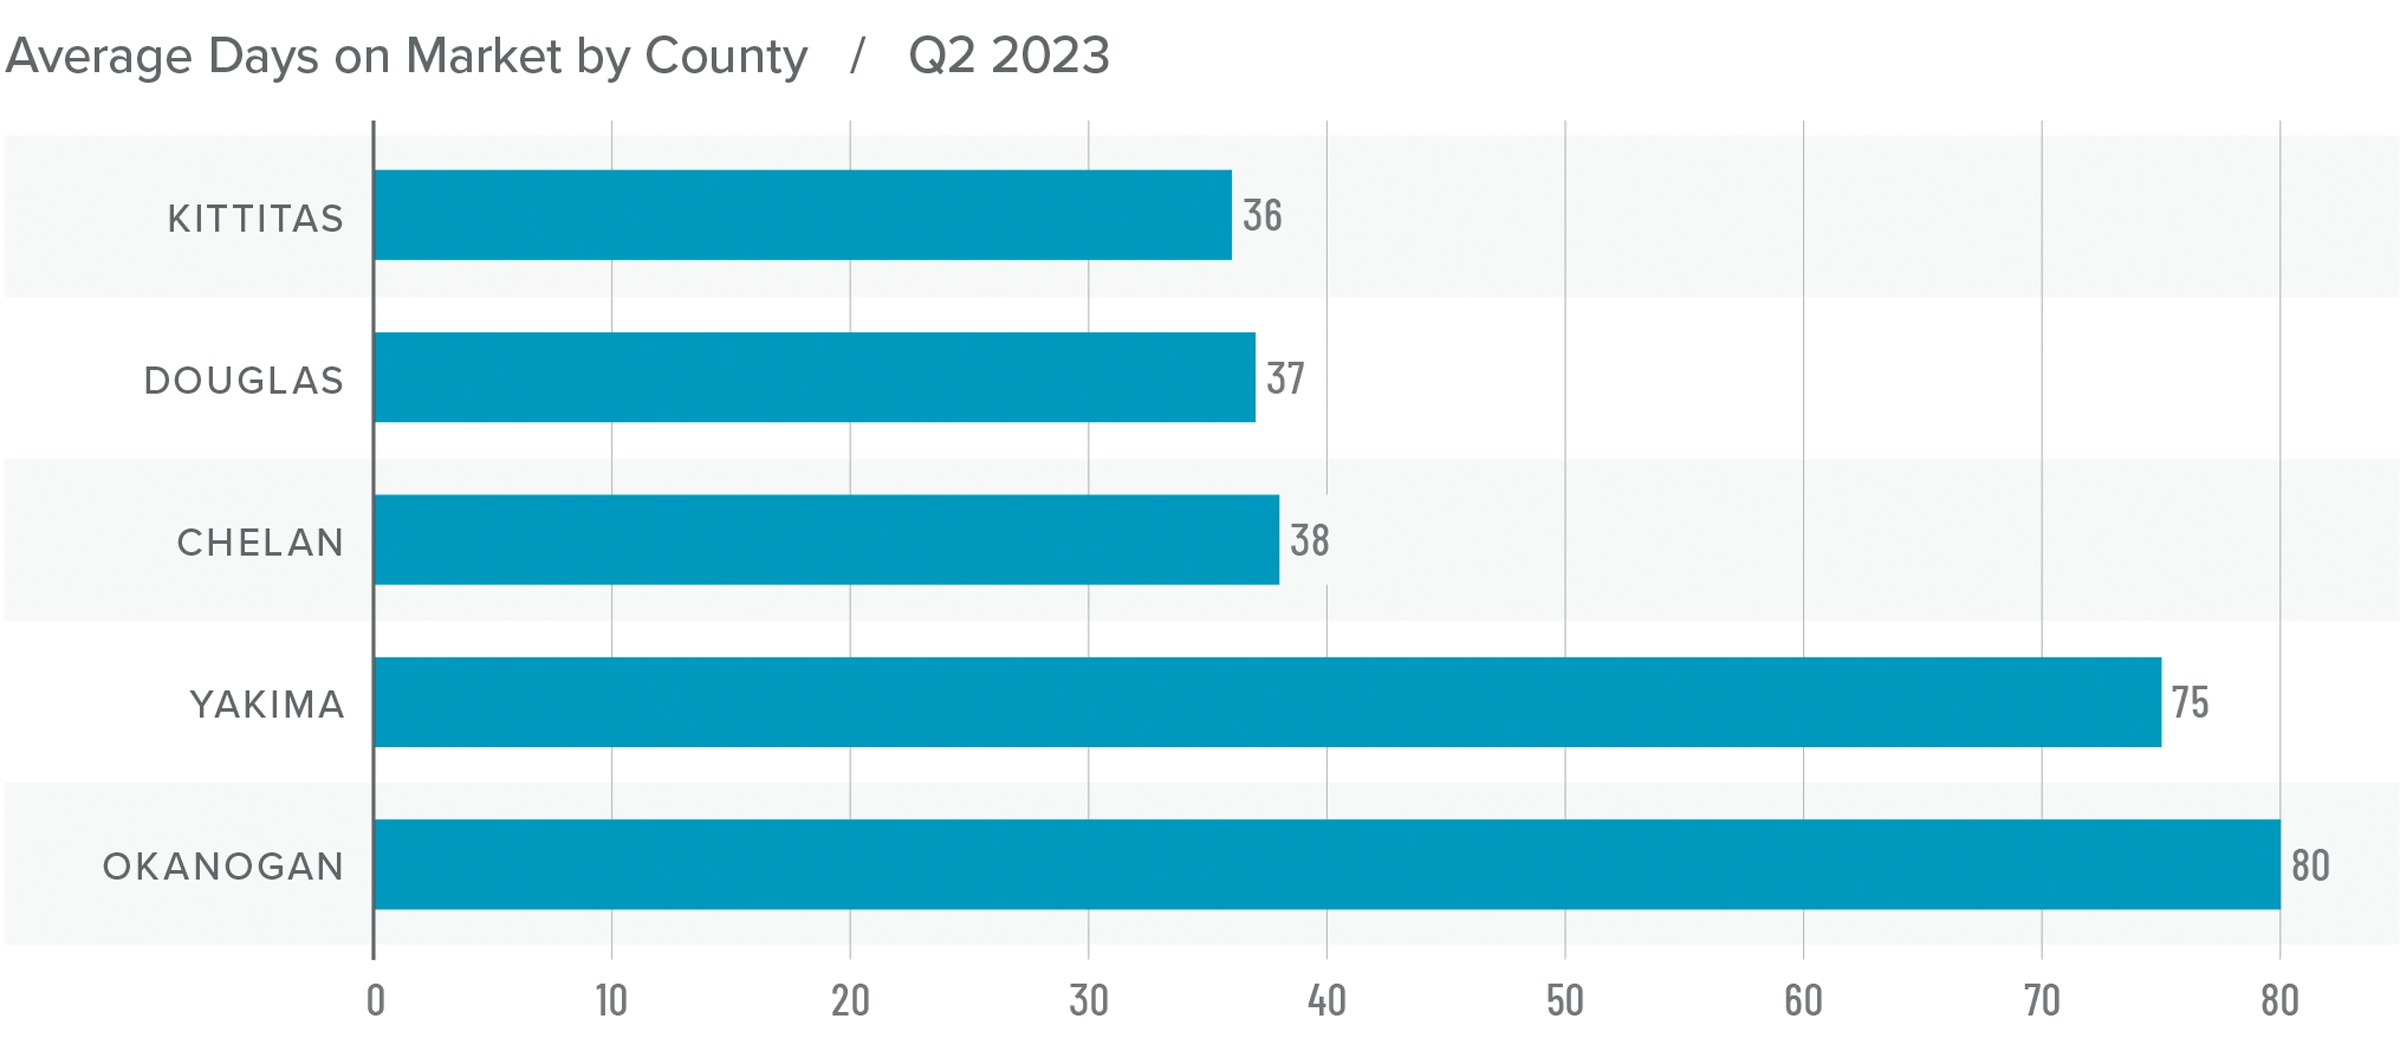
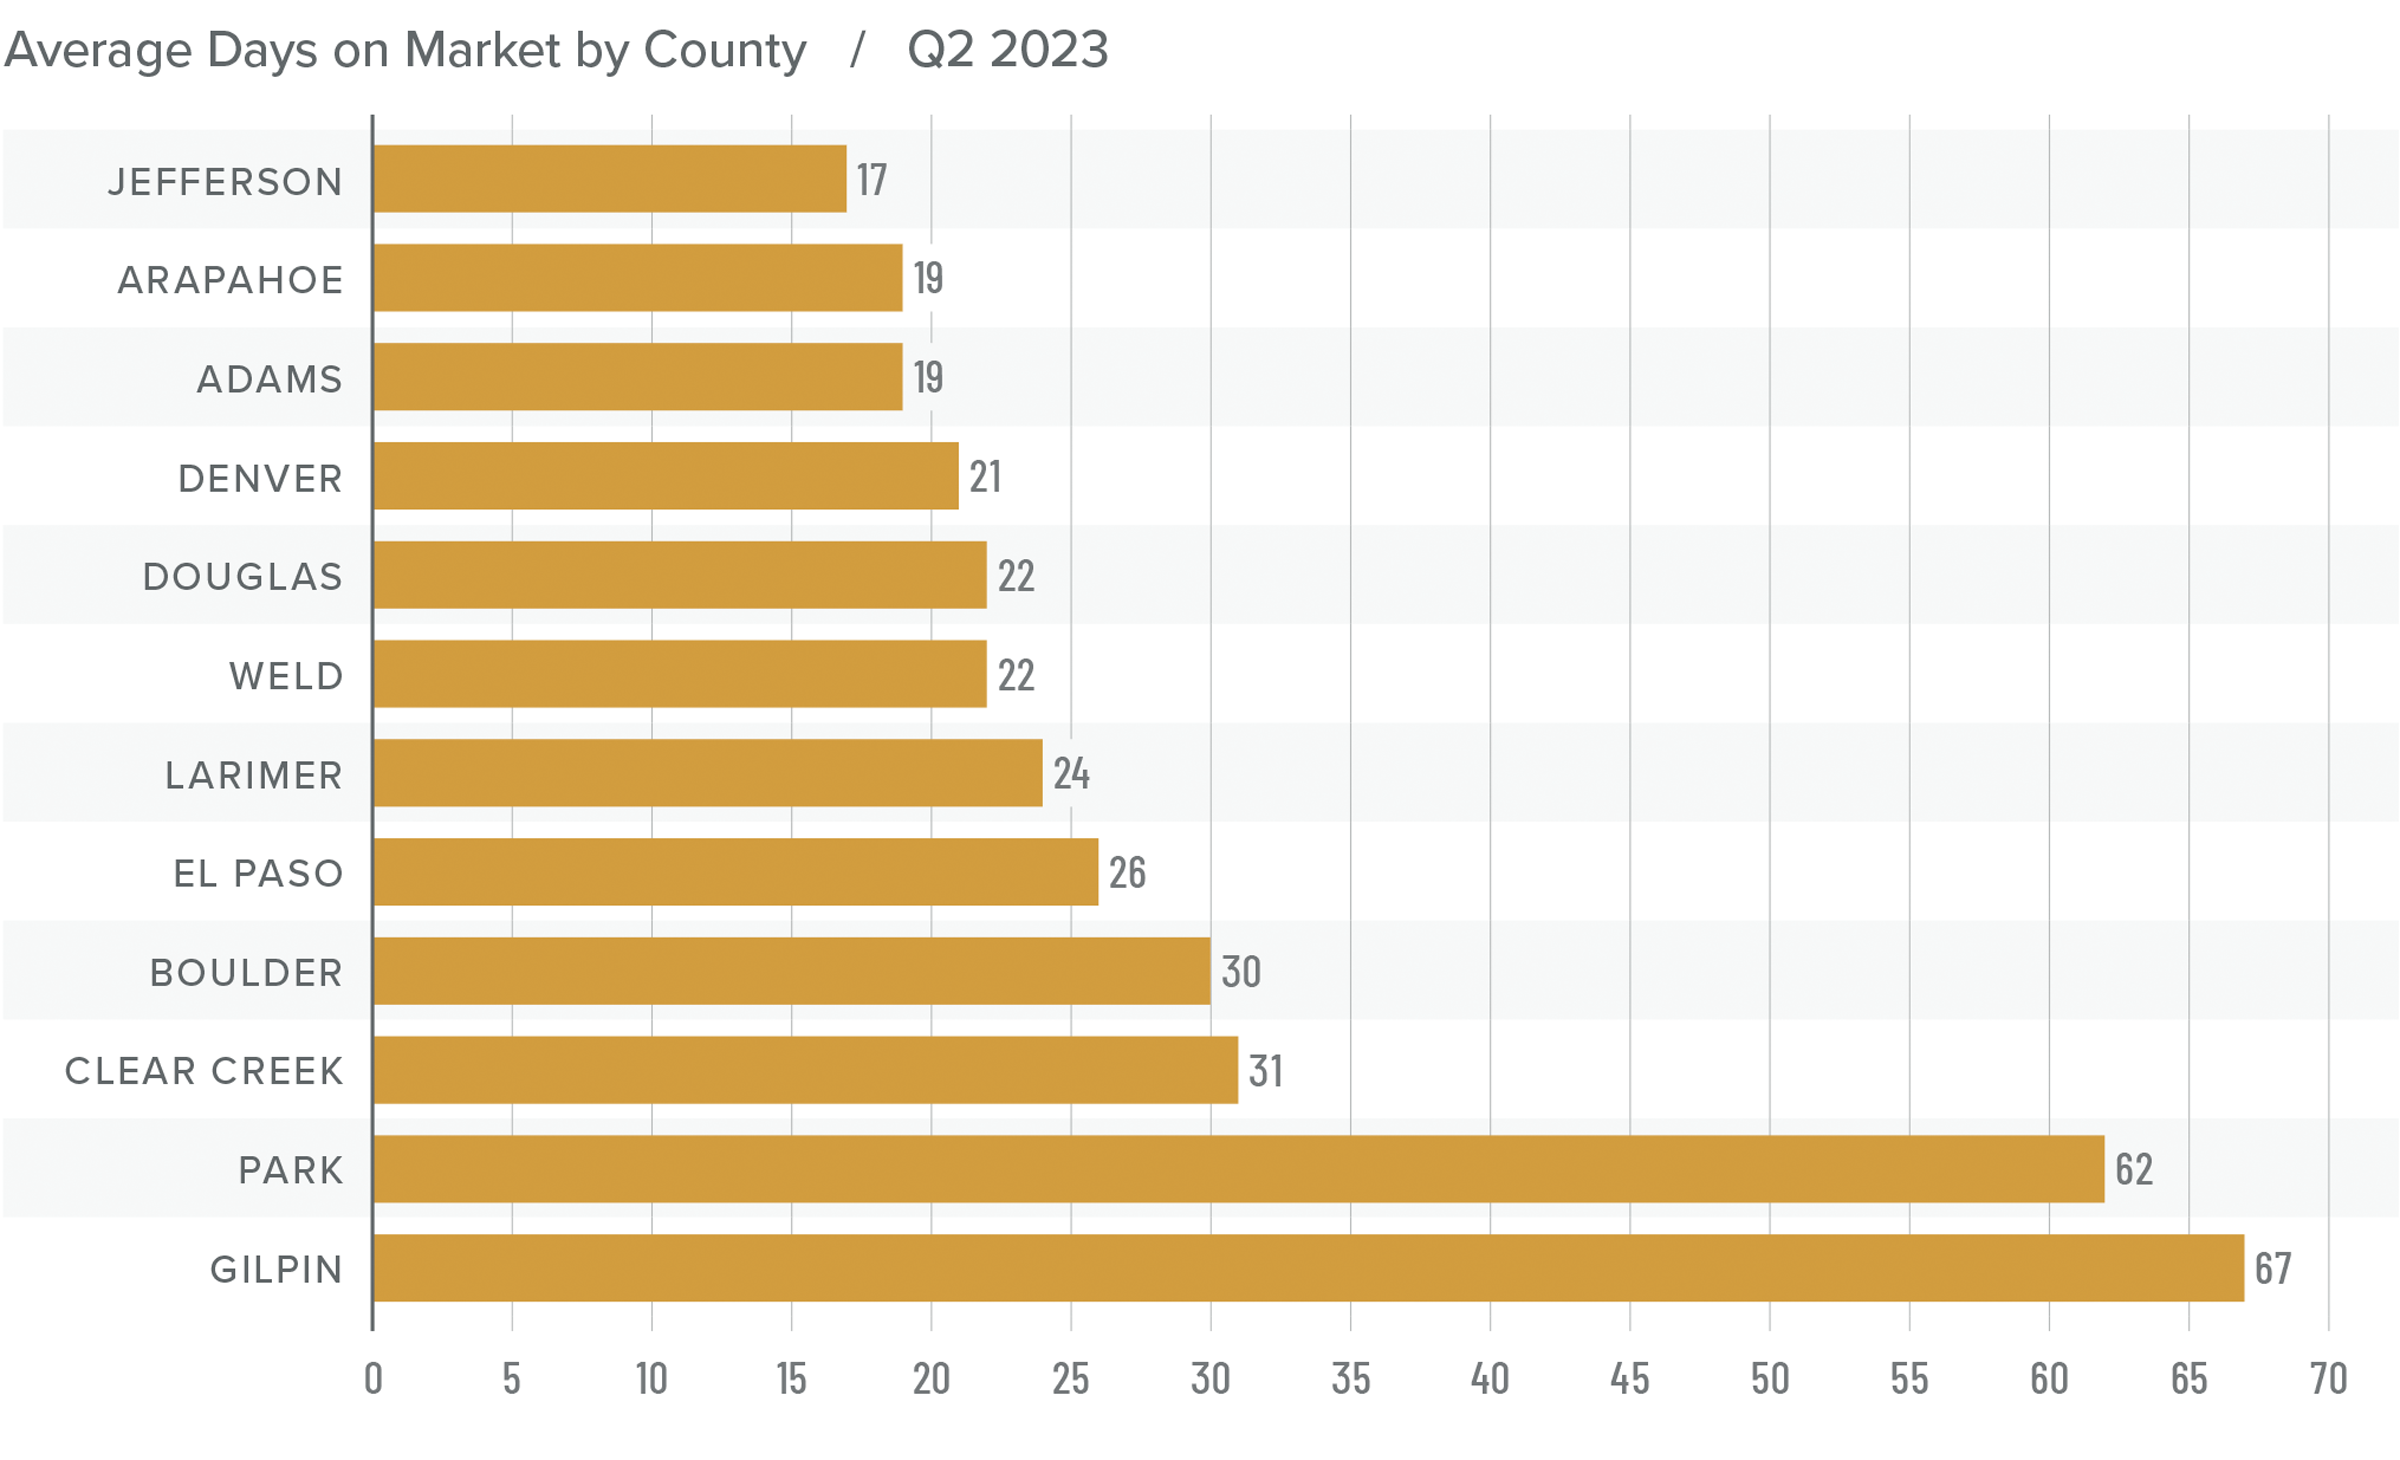
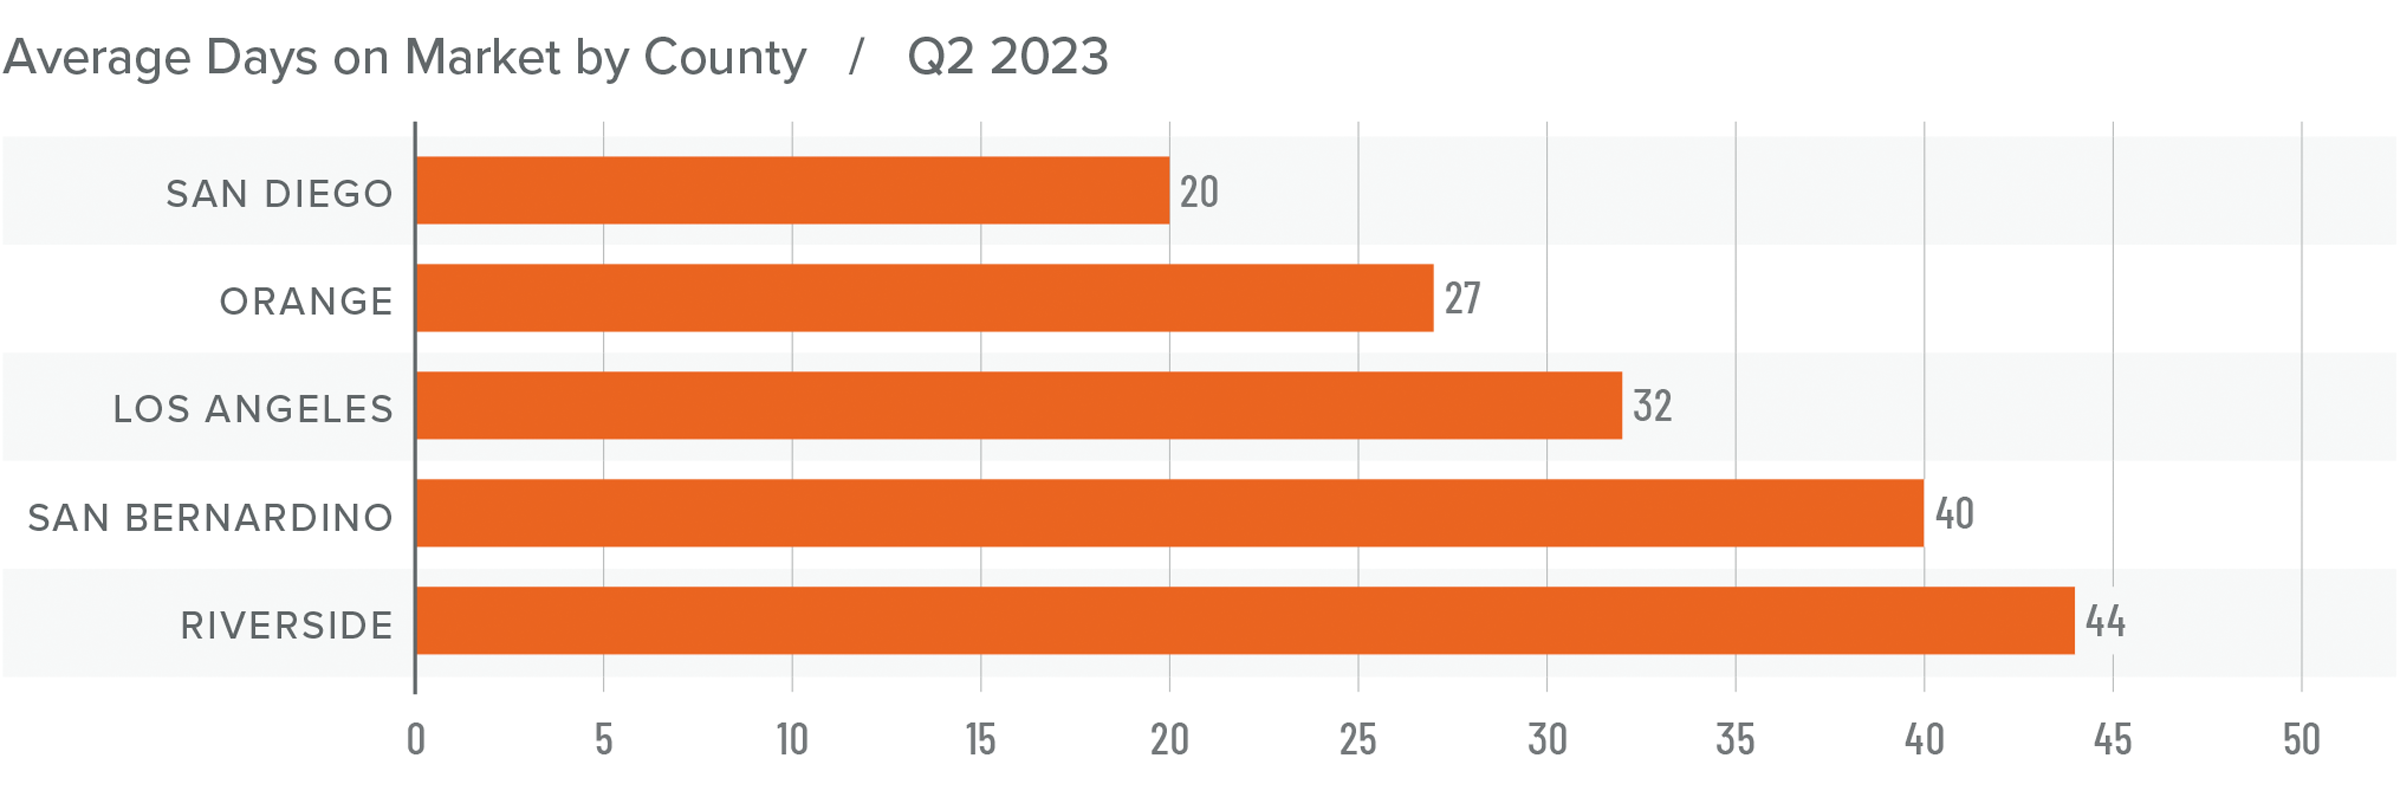
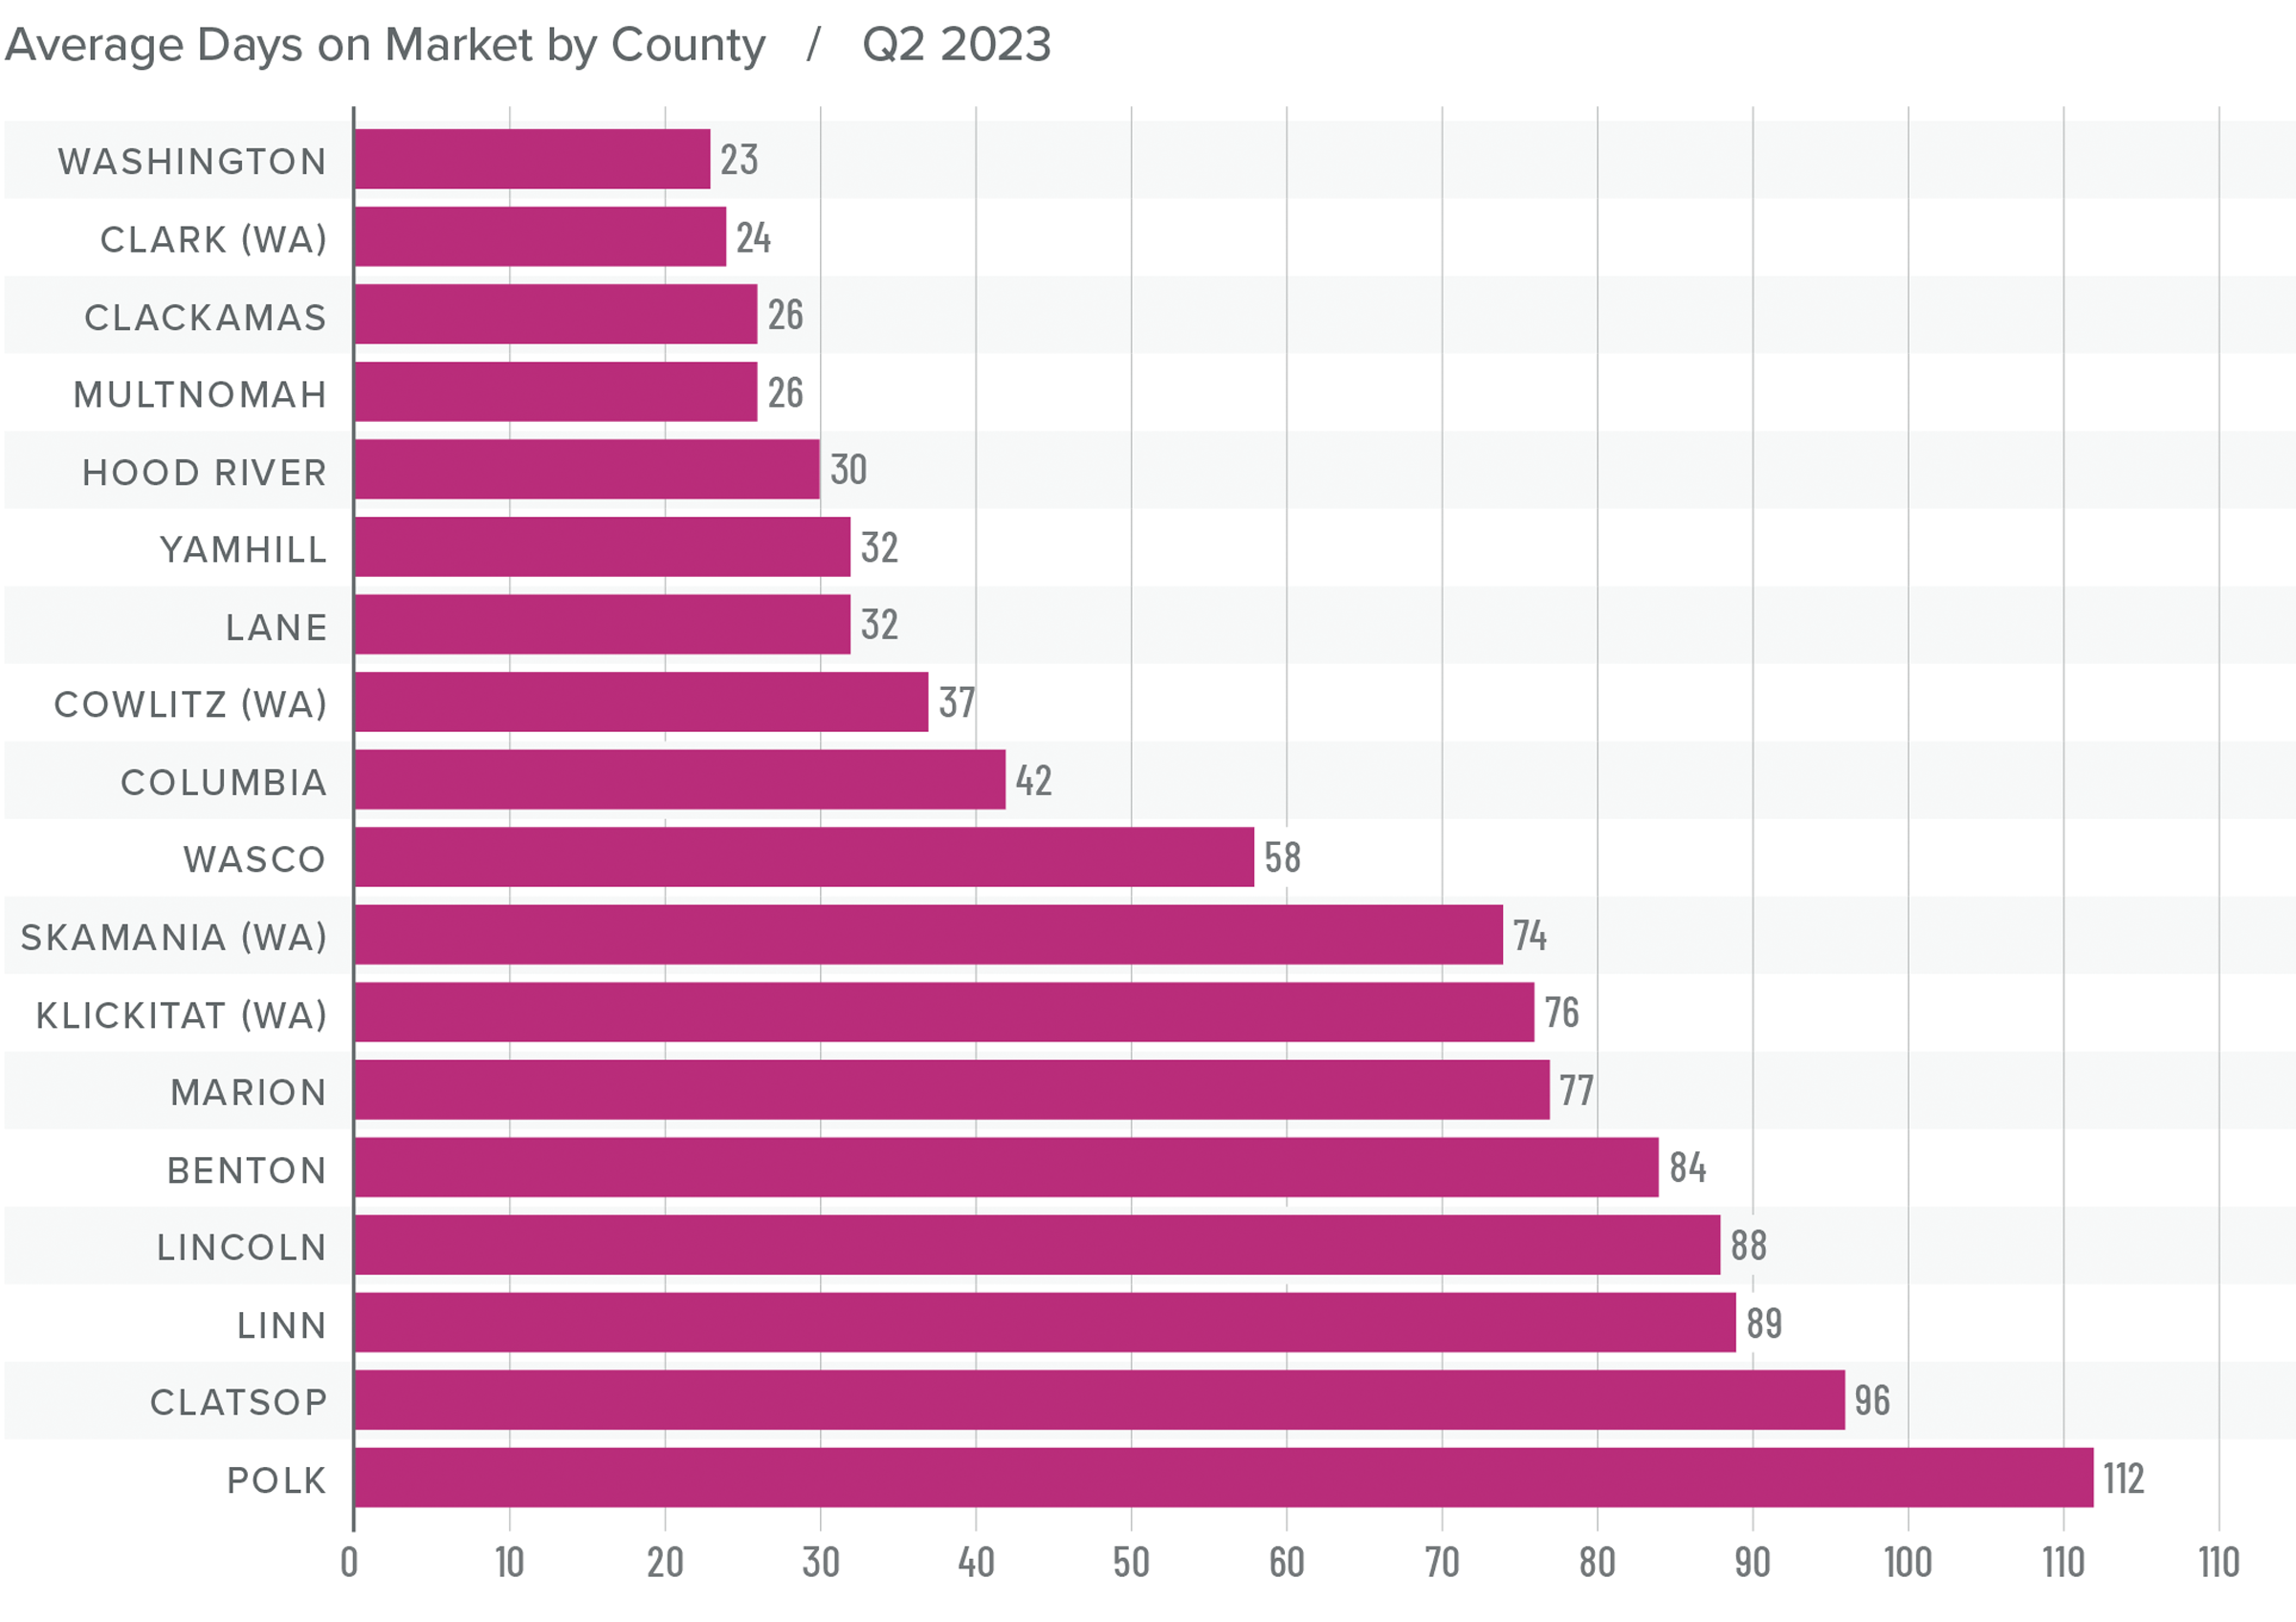
Montana Days on Market
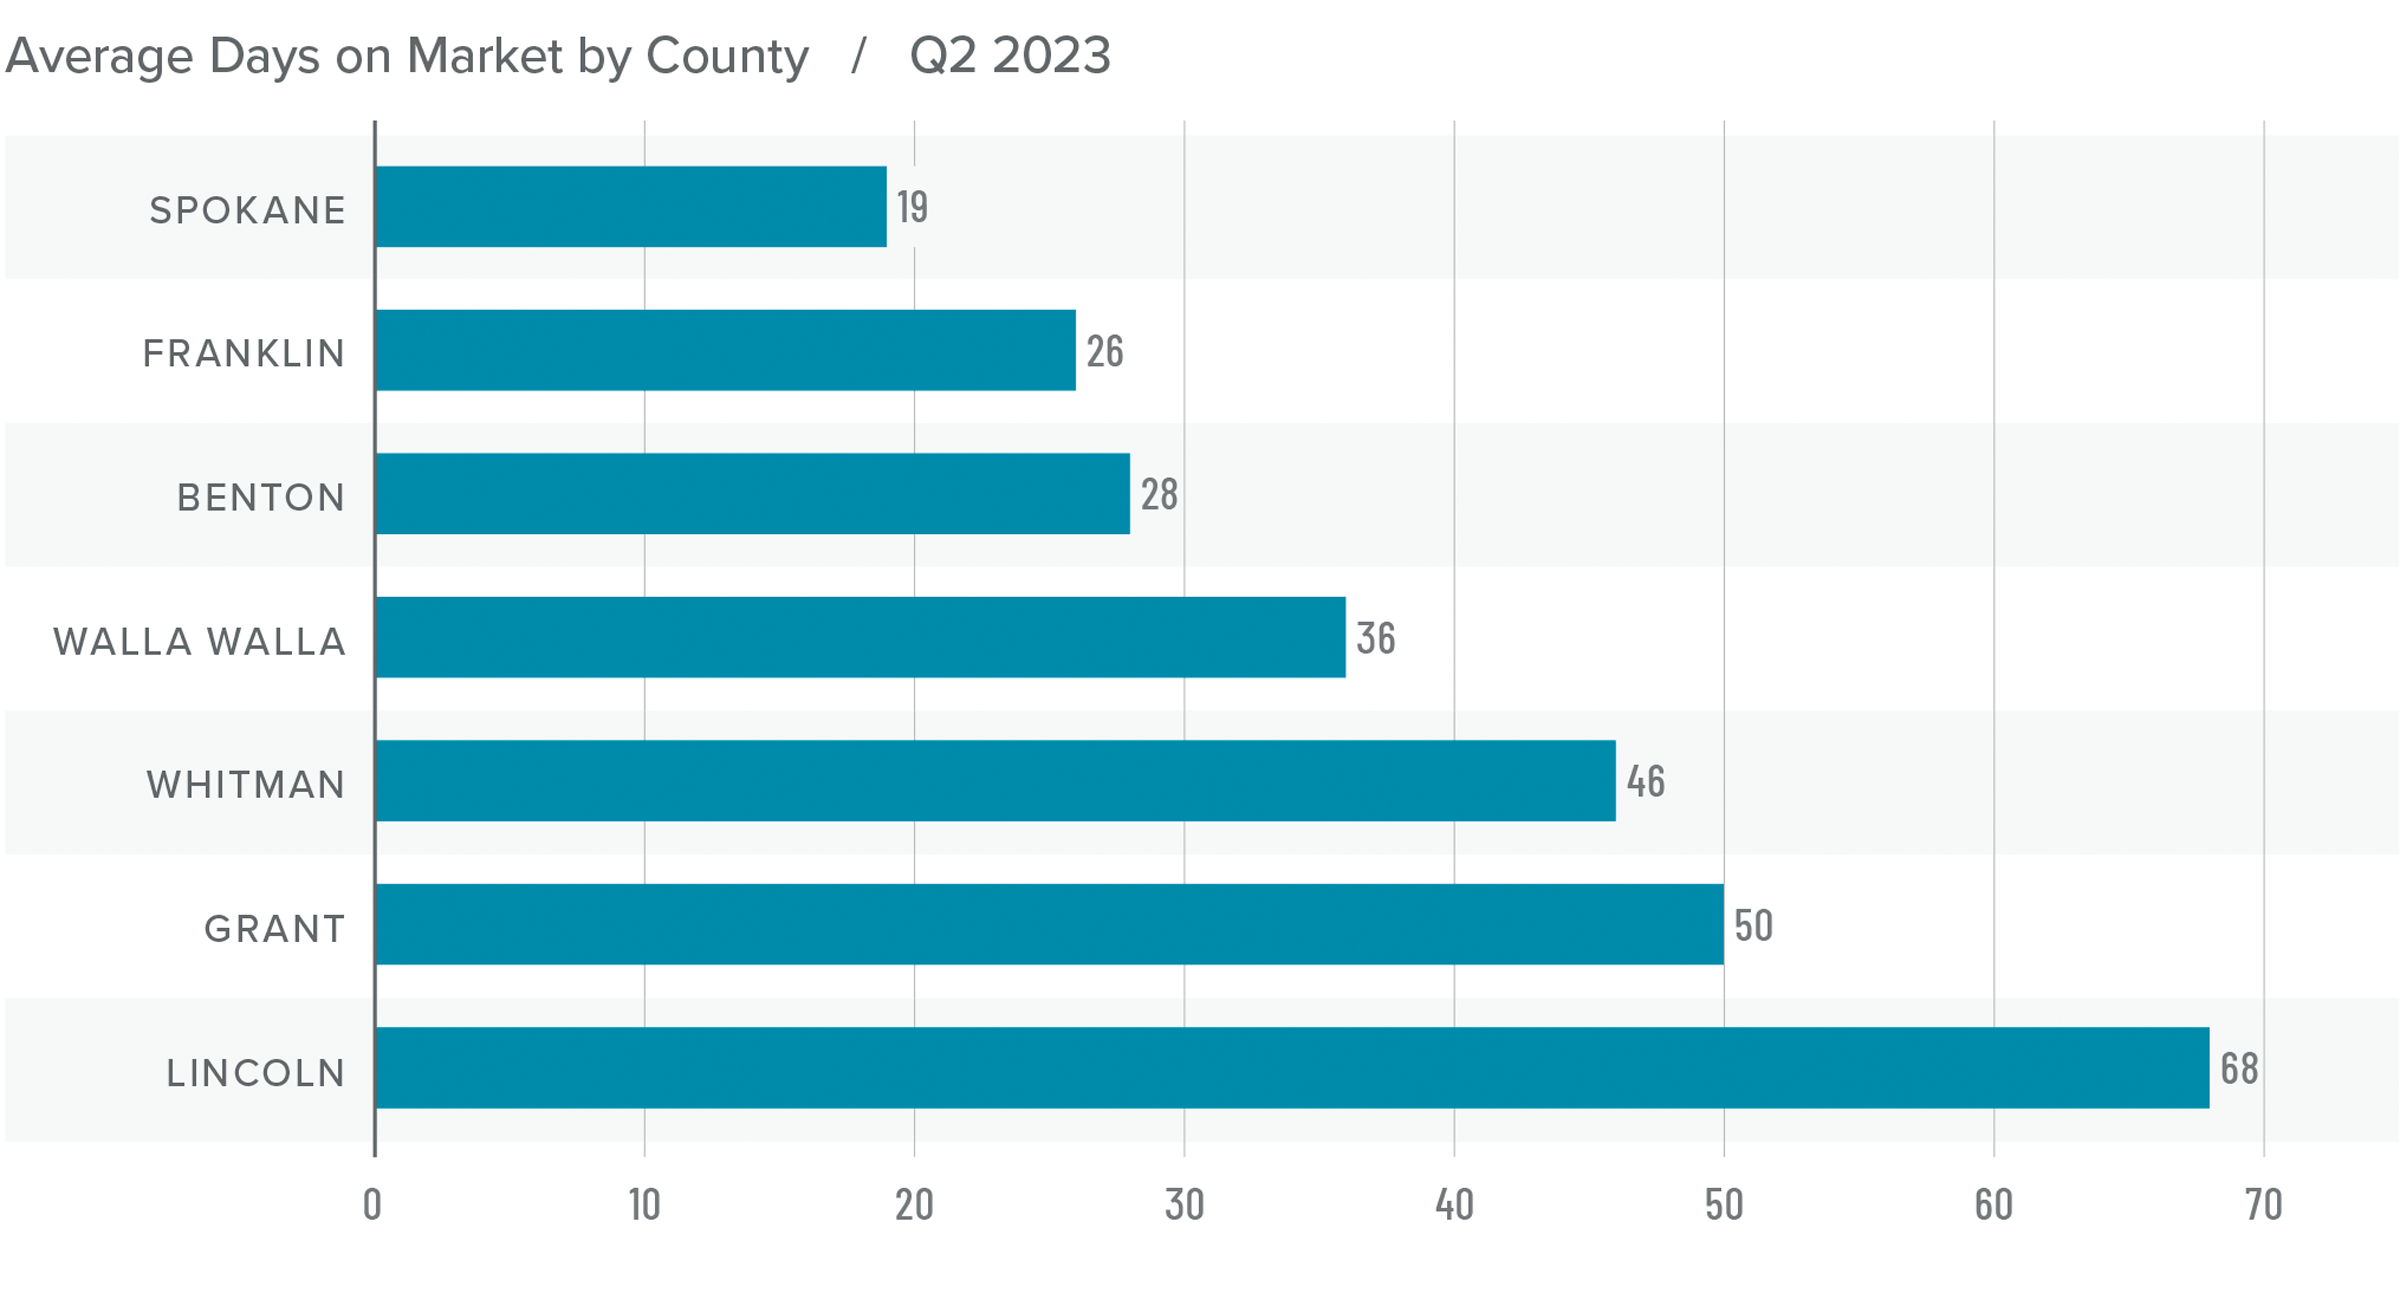
❱ The average time it took to sell a home rose 26 days compared to the same period in 2022.
❱ Homes sold fastest in Gallatin County while homes in Flathead County took the longest time to sell. Only Lewis & Clark County saw market time fall compared to the second quarter of 2022. Average market time rose in the rest of the region.
❱ During the second quarter, it took an average of 77 days to sell a home in the markets covered by this report.
❱ Compared to the first quarter of 2023, days on market fell in all counties other than Jefferson, where it took 20 more days for homes to sell.
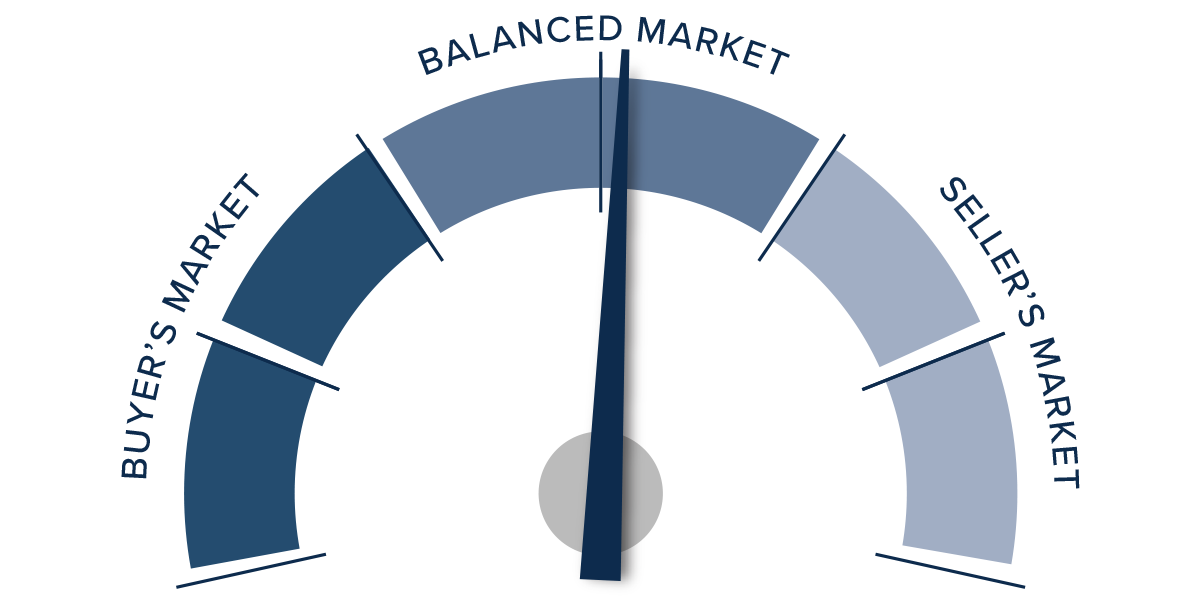
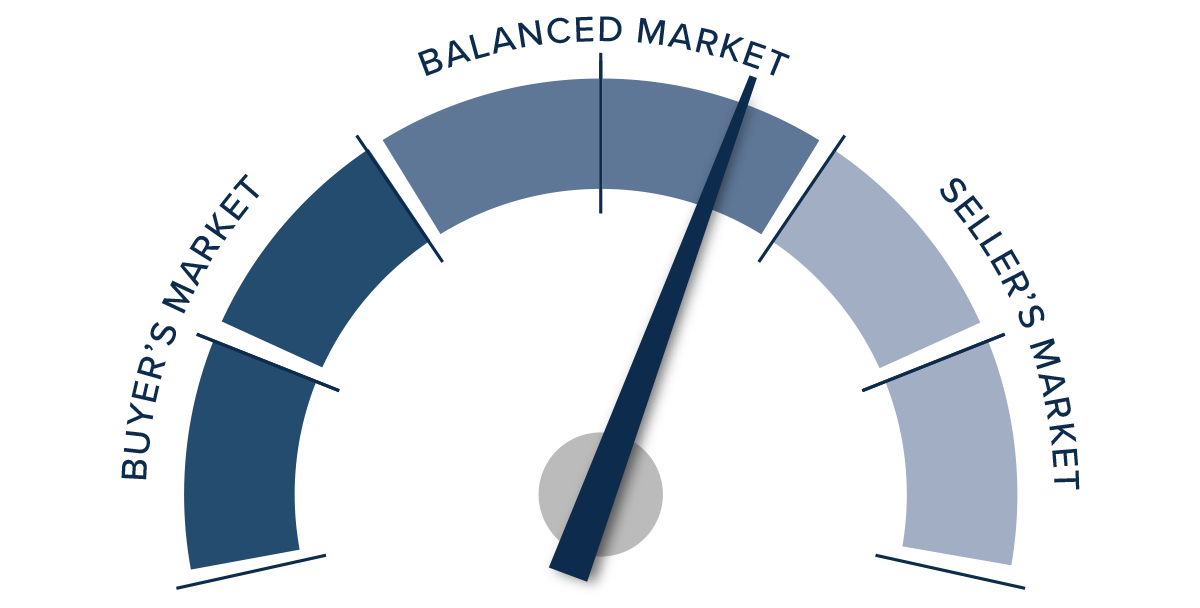
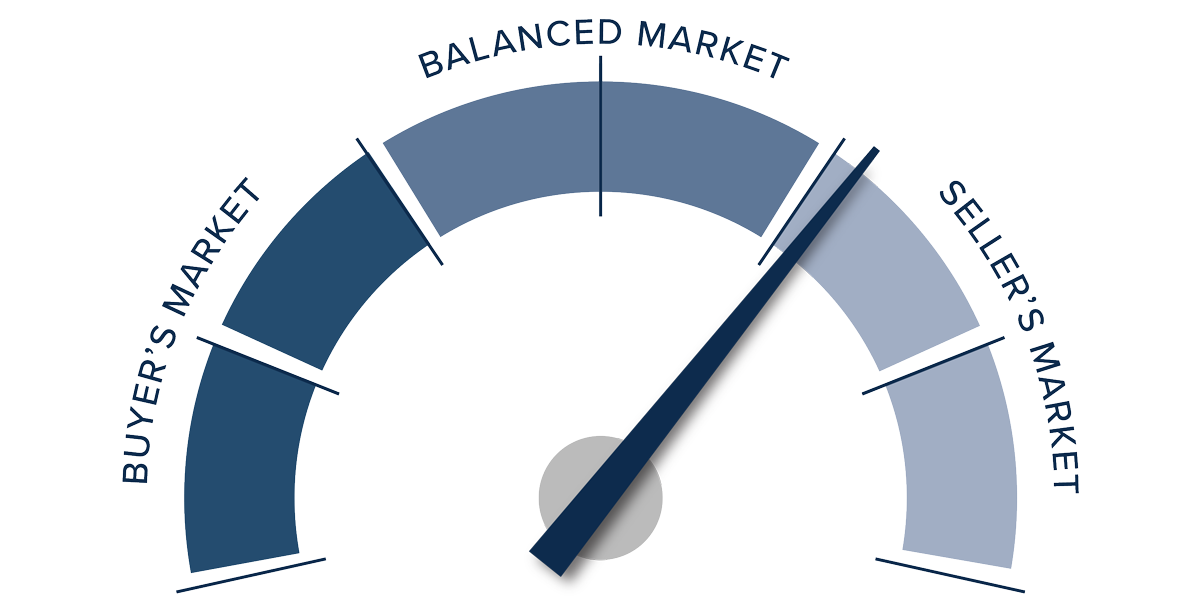
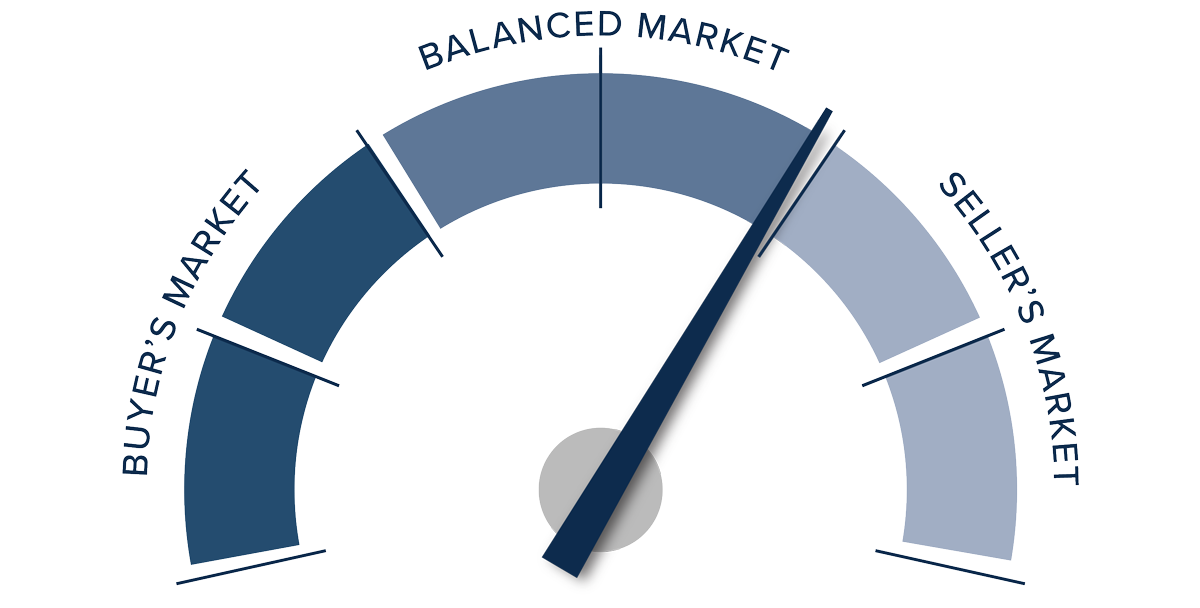
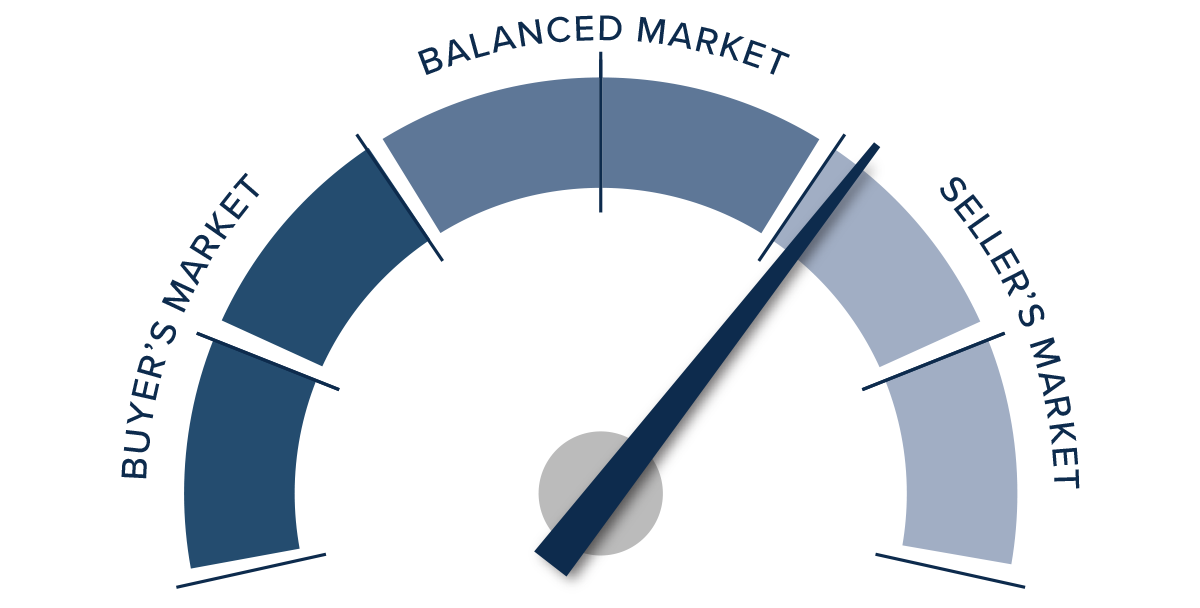
Conclusions
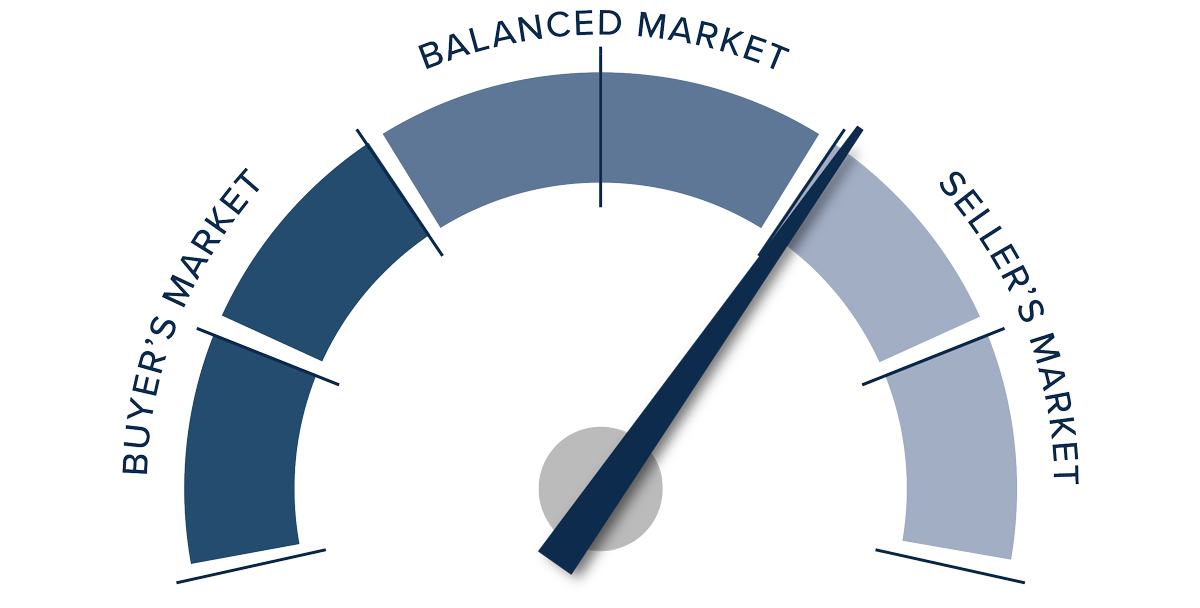
This speedometer reflects the state of the region’s real estate market using housing inventory, price gains, home sales, interest rates, and larger economic factors.
Market indicators are mixed right now. Sales activity increased and the length of time it took for homes to sell fell, which certainly should favor sellers. However, sales price growth was anemic, list prices are generally lower, and there is more inventory to choose from, which favors home buyers.
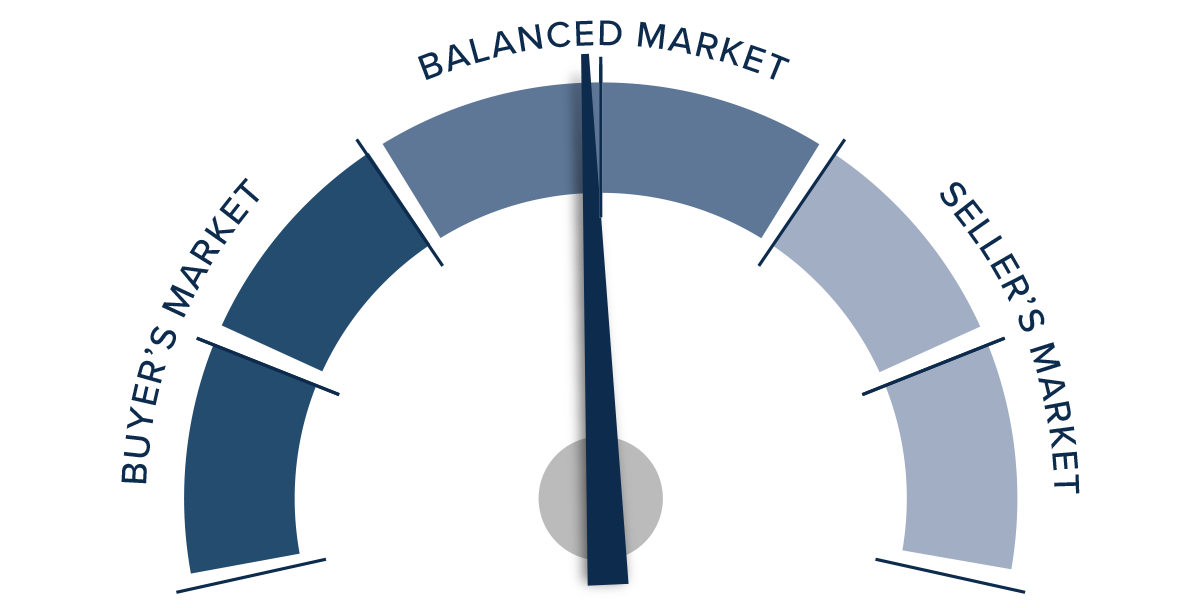
Having taken all these factors into consideration, I am leaving the needle inside the balanced quadrant. I am giving a bit of bias in favor of buyers, but the degree to which they have an advantage is minimal.
About Matthew Gardner

As Chief Economist for Windermere Real Estate, Matthew Gardner is responsible for analyzing and interpreting economic data and its impact on the real estate market on both a local and national level. Matthew has over 30 years of professional experience both in the U.S. and U.K.
In addition to his day-to-day responsibilities, Matthew sits on the Washington State Governors Council of Economic Advisors; chairs the Board of Trustees at the Washington Center for Real Estate Research at the University of Washington; and is an Advisory Board Member at the Runstad Center for Real Estate Studies at the University of Washington where he also lectures in real estate economics.


")


