
 Facebook
 X
X
 Pinterest
 Copy Link
Where are the next housing hot spots? According to Windermere’s Chief Economist, Matthew Gardner, they are the communities that exist between urban neighborhoods and the suburbs.

Where are the next housing hot spots? According to Windermere’s Chief Economist, Matthew Gardner, they are the communities that exist between urban neighborhoods and the suburbs.
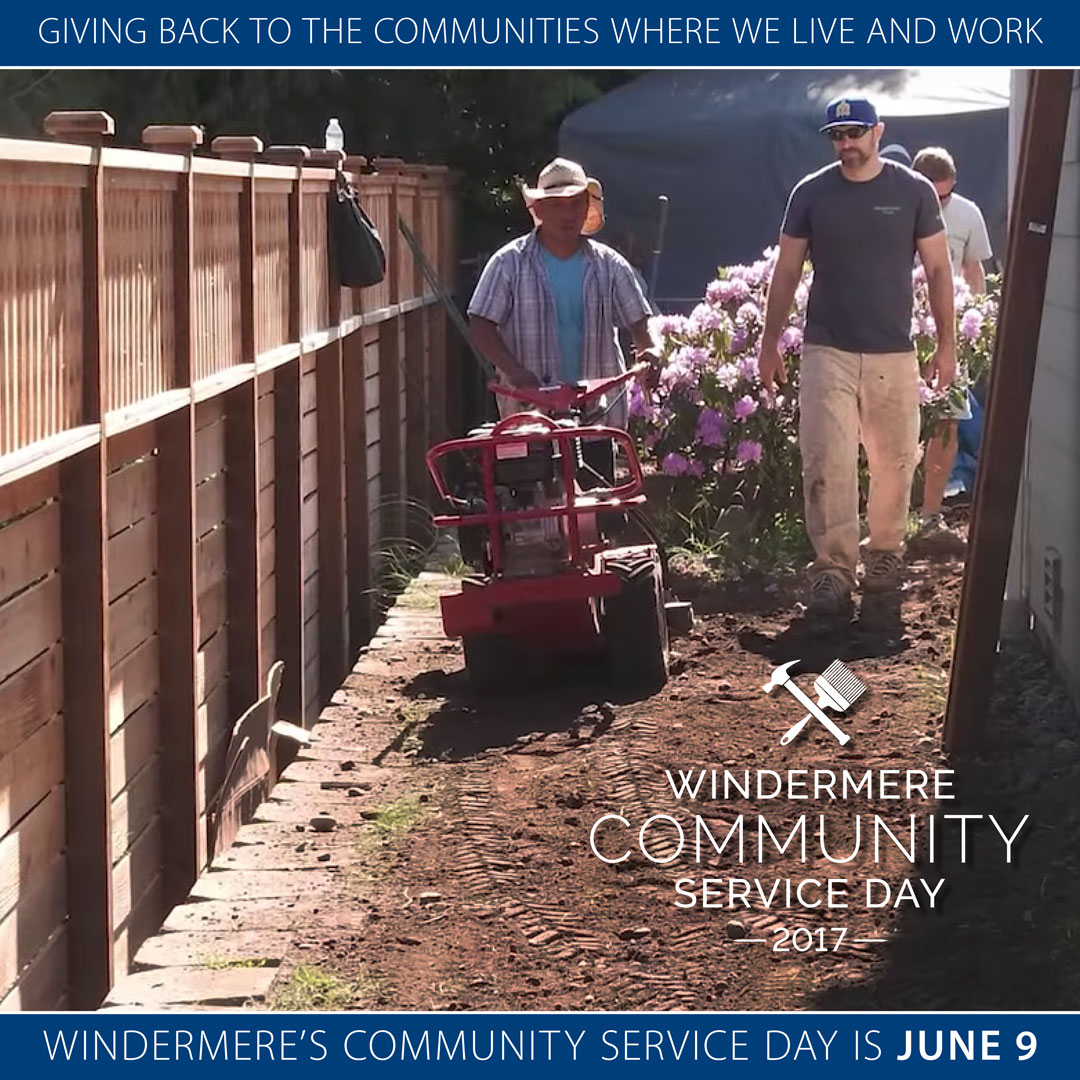
Today you may notice your local Windermere office is closed, or it may take a little bit longer for your Windermere agent to get back to you. But we promise it’s for a very good reason: today is Windermere Community Service Day. Since 1984, our agents have taken one day a year off to dig into hands-on community service projects throughout the Western U.S. On this day, you’ll find our teams doing a variety of projects, such as cleaning, landscaping, and painting at local senior citizens centers, facilities for homeless children and adults, public parks and schools, low-income housing, and emergency shelters, among others.
Follow what our offices are doing on Community Service Day on Facebook! You can also vote for your favorite Community Service Day photos in our #CommunityServiceDay2017 photo contest. The photo with the most votes will receive a $1,000 donation for the Windermere Foundation charity of their choice. We encourage you to “like” our Facebook page, follow the Community Service Day projects, and vote for your favorite Community Service Day photos!
A big thank you to all of our Windermere Real Estate offices for the amazing work they do. Community Service Day is an important part of what makes Windermere the place it is, and we appreciate everything they do to make our communities a little better.
Community Service Day Projects:
| State | City | Organization | Project |
|
California |
|||
| Brentwood | B Walker Ranch | Fence building and additional maintenance | |
| Clayton | Contra Costa Animal Shelter | ||
| Cloverdale | Cloverdale Senior Center | Working on yard cleanup, and other projects at Cloverdale Senior Center | |
| Del Mar | Casa de Amparo Children's Home | ||
| El Sobrante | B Walker Ranch | Fence building and additional maintenance | |
| Fallbrook | Casa de Amparo Children's Home | ||
| Morgan Hill | Local Foodbank | Gathering and sorting donations | |
| Palm Desert | SafeHouse of the Desert | ||
| Palm Desert | SafeHouse of the Desert | ||
| Redding | Shasta County Child Abuse Prevention Coordinating Council | ||
| Salinas | Local Foodbank | Gathering and sorting donations | |
| San Diego | Casa de Amparo Children's Home | ||
| Vacaville | B Walker Ranch | Fence building and additional maintenance | |
| Walnut Creek | B Walker Ranch | Fence building and additional maintenance | |
| Colorado | |||
| Centennial | Habitat for Humanity of Metro Denver | ||
| Fort Collins | Partners Mentoring Youth – Fundraiser; Crossroads Safehouse | Clean up grounds/yards | |
| Denver | Action Center of Jefferson County | ||
| Hawaii | |||
| Kailua-Kona | Salvation Army | Refurbishing teen housing | |
| Kamuela | Salvation Army | Refurbishing teen housing | |
| Idaho | |||
| Caldwell | Boise VA Hospital | Clean up grounds | |
| Coeur d'Alene | The Children's Village | Multiple projects | |
| Hayden | The Children's Village | Multiple projects | |
| Lewiston | Community Action Partnership | Planting flowers, yard work and general cleanup | |
| Moscow | Community Action Partnership | Planting flowers, yard work and general cleanup | |
| Post Falls | The Children's Village | Multiple projects | |
| Montana | |||
| Helena | The Holter Gala | ||
| Oregon | |||
| Albany | Community Outreach | Volunteering at Children's Day | |
| Ashland | ACCESS in Medford | Food drive | |
| Bend | Grandma's House Women's Shelter | Landscaping and tearing down an old shed on the property | |
| Cannon Beach | Cannon Beach/Gearhart | Cleaning up the beaches and coastline | |
| Charbonneau | Community Warehouse in Tualatin | Yard cleanup and indoor organization | |
| Clatskanie | Local Foodbank & Fairview Cemetary | Collecting donations and money for local food bank, and cleaning up the grounds at Fairview Cemetery in Scappoose | |
| Commercial- Lane County | Food for Lane County, Grassroots Garden | Weeding, moving material, planting and tending garden | |
| Commercial- Redmond | REACH (formerly OR Boys and Girls Club) | Minor repair, painting, weeding, cleaning, etc. | |
| Corvallis | Community Outreach | Volunteering at Children's Day | |
| Eagle Point | ACCESS in Medford | Food drive | |
| Eugene | Food for Lane County, Grassroots Garden | Weeding, moving material, planting and tending garden | |
| Eugene North | Food for Lane County, Grassroots Garden | Weeding, moving material, planting and tending garden | |
| Florence | Food for Lane County, Grassroots Garden | Weeding, moving material, planting and tending garden | |
| Gearhart | Food for Lane County, Grassroots Garden | Weeding, moving material, planting and tending garden | |
| Happy Valley | Oregon Food Bank | Collecting and sorting donations | |
| Hillsboro | HomePlate Youth Services | Working at charity kickball tournament fundraiser | |
| Hood River | Multiple projects | Senior Services and school districts in the gorge/charity golf tournament in July | |
| Hood River- Oak Street | Gorge/charity golf tournament in July | Multiple projects to benefit Senior Services and school districts | |
| Jacksonville | ACCESS in Medford | Food drive | |
| Lake Oswego | Tualatin Community Food Pantry | Organizing and restocking | |
| Lake Oswego – West | Northwest Children's Outreach | Collecting and sorting donations | |
| McMinnville | Helping out a local family with yard and house needs | ||
| Medford | ACCESS in Medford | Food drive | |
| Community Realty- Oregon City | OR Humane Society | Collecting donations | |
| Portland Heights | Community Warehouse | Sorting, cleaning, and helping | |
| Portland- HOLLYWOOD | OR Humane Society | Collecting donations | |
| Portland- Lloyd Tower NE | Head Start program | Cleaning and prepping used books for gifts to children | |
| Portland- Moreland | SnowCap Community Charities | Shredding, cleaning and variety of other projects | |
| Portland- North | Astor Elementary School | Yard cleanup | |
| Portland- NW Johnson | Rigler Elementary | Purchase, bag and deliver school supplies | |
| Portland- Raleigh Hills | Hopewell House Hospice | Clean out flowerbeds, plant flowers and plants, and trim bushes | |
| Pearl District | Rigler Elementary | Purchase, bag and deliver school supplies | |
| Property Management- Corvallis | Community Outreach | Volunteering at Children's Day | |
| Property Management- Gorge | Gorge/charity golf tournament in July | Multiple projects to benefit Senior Services and school districts | |
| Property Management- Portland | Astor Elementary School | Yard cleanup | |
| Property Management- PDX Metro | Astor Elementary School | Yard cleanup | |
| Redmond | REACH (formerly OR Boys and Girls Club) | Minor repair, painting, weeding, cleaning, etc. | |
| Salem | Marion Polk Food Share | Sorting food and working in the community garden | |
| Sandy | Highway 26 | Cleanup | |
| Scappoose | Local Foodbank & Fairview Cemetary | Collecting donations and money for local food bank, and cleaning up the grounds at Fairview Cemetery in Scappoose | |
| Seal Rock | Seashore Family Literacy Center | Working on community garden | |
| Shady Cove | Upper Rogue Community Center | Collecting food donations | |
| Branch Support- Stellar | Rigler Elementary | Purchase, bag and deliver school supplies | |
| St. Helens | Local Foodbank & Fairview Cemetary | Collecting donations and money for local food bank, and cleaning up the grounds at Fairview Cemetery in Scappoose | |
| Sunriver | Local Foodbank & Fairview Cemetary | Collecting donations and money for local food bank, and cleaning up the grounds at Fairview Cemetery in Scappoose | |
| The Dalles | Gorge/charity golf tournament in July | Multiple projects to benefit Senior Services and school districts | |
| Vida | Food for Lane County, Grassroots Garden | Weeding, moving material, planting and tending garden | |
| Washington | |||
| Aberdeen-Grays Harbor | Coastal Harvest Distribution Center (division of NW Harvest) | Bagging bulk food for distribution | |
| Allyn/Hood Canal South | Foodbank of North Mason County | Working on elementary school garden that provides food to food bank | |
| Anacortes | Local Women's Shelter | Helping clean and set up a new addition | |
| Arlington | Centennial Park | Planting trees and shrubs, landscaping and cleaning up | |
| Auburn- Lakeland Hills | Auburn Foodbank | Multiple projects | |
| Belfair | Foodbank of North Mason County | Working on elementary school garden that provides food to food bank | |
| Bellevue | Kelsey Creek Farm | Painting, gardening and cleaning | |
| Bellevue Commons | Little Bit Therapeutic Riding Center | Painting, cleaning, planting flowers and working on fences | |
| Property Management- Bellevue | Cougar Mountain Zoo in Issaquah | Multiple projects | |
| Bellevue South | Mamma's Hands–house for women and children in crisis | Painting, building a deck and yard work | |
| Bellevue West | Acres of Diamonds home | Painting apartments and the main house, cleaning, repairing and landscaping | |
| Bingen | Gorge/charity golf tournament in July | Multiple projects to benefit Senior Services and school districts | |
| Bonney Lake- Lake Tapps | Bonney Lake Senior Center | Yard work | |
| Burien | Jacob Ambaum Park and Lake Burien Park | Spreading wood chips and doing cleanup at the playgrounds | |
| Camano Country Club | Windermere Soap Box Derby | ||
| Camano Island Terry's Corner | Windermere Soap Box Derby | ||
| Cathlamet | Lower Columbia School Gardens | Weeding, pruning, planting, etc. | |
| Commercial- Everett | Volunteers of America Everett Food Bank | Sorting through donated food, stacking, organizing, etc. | |
| Commercial- Lake Stevens | Multiple projects | Beautifying Lundeen Park on Lake Stevens, and doing a fundraiser for a local food bank | |
| Edmonds | Hickman Park | Landscaping and maintenance | |
| Property Management- Edmonds | Cougar Mountain Zoo in Issaquah | Multiple projects | |
| Entiat | Teams Learning Center | Landscaping and working on the playground | |
| Federal Way | Federal Way Food Bank and Senior Center | Multiple projects | |
| Gig Harbor | Fish Food Bank | New signage, landscaping, cleanup, etc | |
| Gig Harbor- Downtown | Fish Food Bank | New signage, landscaping, cleanup, etc | |
| Gig Harbor- Professional Partners | Fish Food Bank at Gig Harbor Peninsula | Sorting donations and restocking shelves | |
| Issaquah | Mountains to Sound Greenway Trust | Creek restoration, planting, removing invasive species at Issaquah Creek | |
| Kelso/Longview | Lower Columbia School Gardens | Weeding, pruning, planting, etc. | |
| Kettle Falls | Fun Run event | Cleaning up area before, during and after and assisting | |
| Kirkland | Houghton Beach Park | Landscaping and repairs | |
| Property Management- Kirkland | Compass Housing Alliance in Bothel | Landscaping and other housing maintenance | |
| Lake Chelan | Habitat for Humanity project | Multiple projects | |
| Lake Stevens | Multiple projects | Beautifying Lundeen Park on Lake Stevens, and doing a fundraiser for a local food bank | |
| Leavenworth | Teams Learning Center | Landscaping and working on the playground | |
| Lynnwood | Martha Perry Garden | Making garden beds, weeding, planting, for food bank garden | |
| Maple Valley | Local project | Yard work and cleanup for local family that's holding a big graduation party | |
| Marysville | City of Marysville | Painting a fence at a park/trail | |
| Mercer Island | East Side Baby Corner in Issaquah | Organizing, cleaning and prepping items | |
| Mill Creek | Habitat for Humanity store in Lynnwood | Cleanup, painting, etc. | |
| Mill Creek Town Center | Habitat for Humanity store in Lynnwood | Cleanup, painting, etc. | |
| Monroe | Senior Center in Monroe | Multiple projects | |
| Moses Lake | Local event | Free community shredding event for the public and food drive | |
| Mount Vernon | Habitat for Humanity's "Habitat Helpers" | Working on repairs and cleaning at a local man's home | |
| MoxiWorks | Ryther House | Repairing buildings, landscaping, cleaning, etc. | |
| Port Orchard | Helpline Food Bank | Yard clean up and landscaping for an elderly resident in town and working on the community garden | |
| Port Townsend | Chimacum Senior Home | Washing windows and gardening at a home for seniors and disabled people in Chimacum | |
| Professional Development | Solid Ground | Clean up grounds | |
| Pullman | Community Action Partnership | Planting flowers, yard work and general cleanup | |
| Property Management- Pullman | Community Action Partnership | Planting flowers, yard work and general cleanup | |
| Puyallup | Tacoma Rescue Mission | General repairs, also money and donations for the playground and other kids' needs | |
| Redmond | Friends of Youth | Landscaping, weeding, planting and sorting donations | |
| Windermere Referrals | Solid Ground | Clean up grounds | |
| Renton | Way Back Inn | Painting, installing cabinets, and other minor repairs for displaced families organization | |
| Renton- PSR | Way Back Inn | Painting, installing cabinets, and other minor repairs for displaced families organization | |
| Seattle-Ballard | St. Luke's Episcopal Church in Ballard | Serving and packing food | |
| Seattle-Capitol Hill | Capitol Hill neighborhood | Litter and garbage pick up | |
| Seattle-Green Lake | Neighborhood clean up | Seattle Parks & Rec at Meridian Park and Adopt-a-Street on Ravenna Blvd NE | |
| Seattle-Greenwood | Multiple projects | Split between Greenwood Senior Citizens Center and Greenwood Boys & Girls Club–tech support and yard work for seniors, and painting the gym and cleaning playground at B&GC | |
| Seattle-Lakeview | Neighborhood clean up | Seattle Parks & Rec at Meridian Park and Adopt-a-Street on Ravenna Blvd NE | |
| Seattle-Madison Park | Multiple projects | Neighborhood cleanup and traffic roundabout weeding in several neighborhoods | |
| Seattle-Magnolia | Community Event | Shredding, recycling and collecting donations for Goodwill | |
| Seattle-Mount Baker | Wellspring | Gathering donations for the Baby Boutique | |
| Seattle-Northgate | YWCA: Angeline's Day Center | Setting up and serving two rounds of lunch to guests | |
| Seattle-Northlake | Grace Cole Nature Park | Cleaning and weeding | |
| Seattle-Northwest | Bitter Lake Food Pantry | Accepting and organizing donations | |
| Seattle-Queen Anne | Queen Anne Food Bank | Organizing and collecting food | |
| Seattle-Sand Point | BLOCK Project on Beacon Hill | Working on a sustainable home | |
| Property Management- Seattle North | Cougar Mountain Zoo in Issaquah | Multiple projects | |
| Property Management- Seattle | Compass Housing Alliance in Bothell | Landscaping and other housing maintenance | |
| Seattle-Wall Street | Mary's Place | Counting, sorting and allocating donations | |
| Seattle-Wedgwood | Neighborhood clean up | Cleaning up the local sidewalks and streets | |
| Seattle-West Seattle | Helpline | Helping to set up Helpline's new neighborhood location–sorting clothing, installing carpeting, and refreshing parking area | |
| Sedro-Woolley | Habitat for Humanity's "Habitat Helpers" | Working on repairs and cleaning at a local man's home | |
| Sequim- East | Sunbelt Apartments | Removing and replacing old raised garden beds at a housing facility for homeless and disabled adults | |
| Sequim- Sunland | Sunbelt Apartments | Removing and replacing old raised garden beds at a housing facility for homeless and disabled adults | |
| Shelton | Local project | Home repair, carport repair project for office neighbor | |
| Shoreline | North Helpline Emergency Services and Food Bank | Preparing emergency kits and sorting food donations | |
| Silverdale | Illahee State Park and Kitsap Lake | Installing life jacket loaner boards | |
| Snohomish | Snohomish Food Bank | Stocking shelves | |
| Property Management- South | Northwest Harvest in Kent | Accepting and sorting donations | |
| Spokane-City Group | Family Promise of Spokane homeless shelter | Working on deck, parking lot area, shelter, etc. | |
| Spokane-Cornerstone | Family Promise of Spokane homeless shelter | Working on deck, parking lot area, shelter, etc. at Family Promise of Spokane homeless shelter | |
| Spokane-Liberty Lake | Family Promise of Spokane homeless shelter | Working on deck, parking lot area, shelter, etc. at Family Promise of Spokane homeless shelter | |
| Spokane-Manito | Family Promise of Spokane homeless shelter | Working on deck, parking lot area, shelter, etc. at Family Promise of Spokane homeless shelter | |
| Spokane-North | Family Promise of Spokane homeless shelter | Working on deck, parking lot area, shelter, etc. at Family Promise of Spokane homeless shelter | |
| Property Management- Spokane | Family Promise of Spokane homeless shelter | Working on deck, parking lot area, shelter, etc. at Family Promise of Spokane homeless shelter | |
| Spokane-Valley | Family Promise of Spokane homeless shelter | Working on deck, parking lot area, shelter, etc. at Family Promise of Spokane homeless shelter | |
| Stanwood | Community event | Windermere Soap Box Derby | |
| Stevenson | Gorge/charity golf tournament in July | Multiple projects to benefit Senior Services and school districts | |
| Tacoma-North | Northwest Furniture Bank and Multicultural Child & Family Hope Center | Various cleaning, gardening and organizing duties | |
| Tacoma-Professional Partners | Northwest Furniture Bank and Multicultural Child & Family Hope Center | Various cleaning, gardening and organizing duties | |
| Tacoma-University Place | Northwest Furniture Bank and Multicultural Child & Family Hope Center | Various cleaning, gardening and organizing duties | |
| Tri-Cities Richland | Summer Safety Day | Free event for kids about bike safety, water safety, stranger danger, free helmets and life jackets | |
| Tri-Cities Southridge | Summer Safety Day | Free event for kids about bike safety, water safety, stranger danger, free helmets and life jackets | |
| Vancouver- Community Realty | OR Humane Society | Volunteering and collecting donations | |
| Vancouver Metro | Multiple projects | Collecting donations for Fruit Valley Food Bank, and also doing a week long shred and recycle event at the office | |
| Vancouver- Mill Plain | Fruit Valley Elementary | Food drive and shredding and recycling event | |
| Vashon Island | Sheepdog Classic in Vashon | Working the ticket booth, beverage tent, and souvenir area at the Sheepdog Classic in Vashon–proceeds to Vashon Youth & Family Services and Partners in Education | |
| Walla Walla | Christian Aid Center and YWCA | Restaining downtown benches, weeding and cleaning tree wells, and cleaning up a play area | |
| Property Management- Walla Walla | Christian Aid Center and YWCA | Restaining downtown benches, weeding and cleaning tree wells, and cleaning up a play area | |
| Wenatchee | Teams Learning Center | Improving the grounds and installing playground equipment | |
| Westport | Westport Community Garden | Clean up, weed, plant, and beautify grounds | |
| Whidbey Island- Coupeville | Coupeville Elementary | Working on wooded trail and grounds | |
| Whidbey Island- Freeland | Good Cheer Food Bank & Thrift | Sorting donations, stocking shelves, and working on the garden | |
| Whidbey Island- Langley | Good Cheer Food Bank & Thrift | Sorting donations, stocking shelves, and working on the garden | |
| Whidbey Island- Oak Harbor | Habitat for Humanity and the Toddler Learning Center | Cleaning, organizing, etc. | |
| Woodinville | Wilmot Park | Planting, cleanup, sod replacement, etc. | |
| Yakima | Yakima | Food drive and shredding event at Veteran's coalition | |
| Yarrow Bay | Attain Housing | Washing driveways, sidewalks, decks, and weeding, planting flowers and trimming trees | |
There’s nothing like a fresh paint job to punch up a house’s curb appeal. And hiring a professional to do it is the best way to get a superior result — and save you the headache of ladders, repairs and other hassles.
Exterior Paint 1: Fluidesign Studio, original photo on Houzz
Project: Working with a professional on painting your house’s exterior.
Why: Whether your house is wood-frame or shingle, stucco or brick, you’ll get knowledge, accuracy and efficiency by hiring a professional.

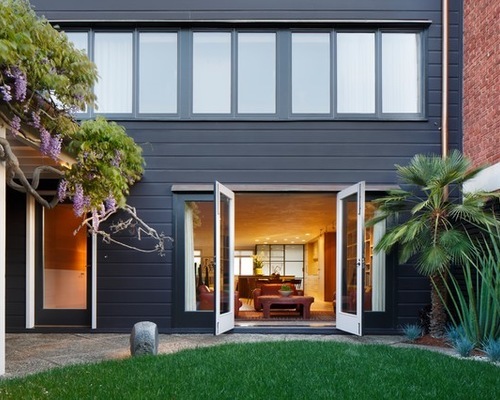
Exterior Paint 2: Butler Armsden Architects, original photo on Houzz
Whom to hire: Many painters do both interior and exterior projects. A painting contractor should be licensed and insured. You should obtain a written contract with details about the work to be done. Review the contract to make sure it’s clear which parts of your house’s exterior are to be painted, how long the project will take and how the contractor will be paid.
Cost: A cost estimate should include all labor and materials. Additional detail work, such as painting intricate trim or repairing surface imperfections as part of the preparation work, will usually increase the cost due to the extra time required.
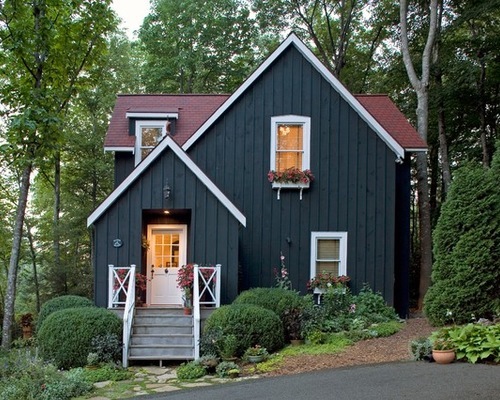
Exterior Paint 3: Meyer Greeson Paullin Benson (MGPB), original photo on Houzz
Costs vary by region, size of the project and amount of detail work. Jeff Dupont, of Sound Painting Solutions in Seattle, says a typical range for his medium- to large-size exterior projects (a 1,200- to 1,700- square-foot house is his medium size) is $9,000 to $12,000. Dupont says his contracts have a warranty that includes any touchups needed due to their workmanship or material defects.
How long the project will take: Prepping and painting a house’s exterior usually takes several days, depending on the size of the house. Dupont says if only minimal prep work is needed, a single-story home will take two to three days, and a two-story house two to four days.
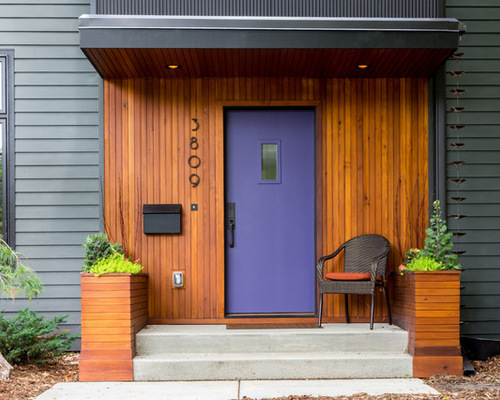
Exterior Paint 4: PK Atkins Photography, original photo on Houzz
First steps: Many painters visit the site for a free initial consultation to talk about the scope of the project, including giving an estimate of how much it will cost and how long it will take to complete. Benjamin Moore recommends walking each potential contractor around the house, outlining which areas will be painted (siding, trim, window frames, porches, doors).
During the project: After repairing holes and cracks in stucco surfaces and using wood filler to fix frame siding, the contractor will apply a primer. Two coats of latex paint are almost always used, but in some areas, such as the Northwest, an oil-based paint might be applied to tannin-rich cedar or redwood exteriors, to better seal the wood and prevent the tannin from bleeding through the primer, Dupont says. In areas where stucco, masonry and brick homes are prevalent, a durable latex acrylic elastomeric paint might be used — it stretches if cracks form underneath.

Exterior Paint 5: Everything Home, original photo on Houzz
Before painting begins, homeowners should remove patio furniture, potted plants and other outdoor accessories in the work area. In general, painters usually remove items like hose holders and mailboxes and replace them when done. Mari Hensley, of Kennedy Painting in St. Louis, says her company asks homeowners to take any fabric cushions on patio furniture inside during the project to prevent damage.
Color considerations: Some painters provide color swatches and consultation, while others expect homeowners to research color combinations on their own. Hensley says samples can be applied to surfaces upon a homeowner’s request. Most large paint companies have online exterior color guides.

Exterior Paint 6: Polhemus Savery DaSilva, original photo on Houzz
Sherwin-Williams has color suggestions based on region and style — from traditional or contemporary suburban to desert Southwest. Behr’s Colors Gallery lets users choose from cool, neutral and warm tones.
Things to consider: A reputable professional should have all the necessary supplies, so a homeowner is not expected to provide anything. If your house was built before 1978 and lead paint is suspected, be sure your painter is certified by the Environmental Protection Agency to handle lead. Even exteriors require certain procedures if lead is detected.
Best time to do this project: Summer is the most popular time of year for painting exteriors in regions with cold, wet winters. Even in mild-weather regions, spring and summer are best for tackling exterior paint jobs. Dupont says April to October is prime time for painting exteriors in the Northwest.
By Julie Sheer, Houzz

If you are looking around your home and thinking to yourself that it’s time to de-clutter, the summer months provide an ideal time to hold a garage sale. But if that sounds like too big of an undertaking, there are other options available to you thanks to popular resale sites like eBay and Craigslist. And if even that sounds like too much effort, you might also consider donating lightly used items to charity or sending them off to the dump. Here are some questions to help you decide which method is best for you.
How much stuff do you have? Are you liquidating your space of large furniture items, a large quantity or quality items, or do you have a small pile of electronics?
If you have yards worth of stuff to get rid of, you definitely want to consider a garage sale. Getting rid of multiple items on Craig’s list can be time consuming, and shipping items sold on eBay can be expensive and eat into your profits. On the other hand, if your items are easily shippable or you have a small enough quantity to take quality photos and post online, then you can save time by using eBay or Craig’s list – and potentially make more money too.
What type of stuff am I getting rid of? Is it worth anything?
If you have large furniture or unique/valuable pieces it may be worth the time to take some quality photos and try to sell these items on Craigslist first. Generally Craigslist works as “first come, first serve” so be prepared to respond to inquiries quickly. If you have small items that have some value, you may want to consider eBay. You reach a much larger audience through eBay which can result in a greater financial return.
How much time do I have?
Garage/yard sales are by far the most time intensive of your options. If you choose to hold a garage sale, you will likely need to dedicate at least three days for prep, clean-up, and the sale itself. All items should be cleaned up, priced, and neatly displayed for sale. Signage should be prominently placed around your neighborhood. You can also place an ad in your local classifieds or on Craigslist to attract a larger crowd.
Will your home/community accommodate a Garage Sale?
Garage and yard sales are generally held at a single-family residence. If you live in an apartment or condo, you may want to consider alternatives due to limited public space. You may also want to consider your community traffic. If you live on a quiet street, you may not get enough customers to generate sales.
Can you enhance a sale by joining with neighbors, friends and family?
Some communities hold an annual neighborhood garage sale, encouraging all neighbors to participate on the same day. This increases your ability to market the event and attract a larger audience.
Want more information on hosting a garage sale? Go here.

May 14th would have been Ralph Jenkins’ 98th birthday.
He passed away about a week ago. He’d had good health most of his life and, even as his health was declining in the last few months, he had all of his usual wit and charm about him.
In the first week of January 1973, I walked into the Windermere office I’d just purchased from Nyle Headly. Working at Windermere then were Connie Farr, Jay Scott, Joe Taylor, Jane Langlie, Bobette Cosby, Vince Haugerud (later to be Manager of Windermere Real Estate offices) and Ralph Jenkins. Vince and Ralph invited me to go to lunch that day, and thus began a tradition of Monday lunches with Vince and Ralph until 2007 when Vince passed, and then continuing with Ralph until just a few weeks ago! Wow! They say that Monday is the lousiest day of the week and I would, from experience, say that it sure as heck is—as the phones would start ringing with buyer/seller/agent issues first thing in the morning. About 12:30 or 1:00 I would go to lunch with Ralph and Vince and explain my tales of woe.
Talk about taking lemons and making lemonade. With a twinkle in his eyes Ralph would give me advice on how to remedy the various situations with humor and grace. I would go back to work re-energized and ready to face the demons for the rest of the week. For those of you who were lucky enough to have known Ralph, he seemed to find humor in just about everything. I don’t know how he did it, but I think many of us wished we had that great attribute.
Also over our Monday lunches, prior to a Husky football game, Ralph and I would bet on the outcome. We’d negotiate all week as to who was favored and who got the points. Somehow he’d usually bamboozle me, and over the course of some 45 years Ralph won 65% of those bets. A damn monkey could have done better than I.
 A little bit of history here: Ralph grew up in the Bryant area, attended Roosevelt High School and was the oldest living Alum of Roosevelt’s Golden Grads. He graduated from the University of Washington in Forestry. He entered WWII in 1943 and was stationed in England as a fighter pilot. He quickly became Squadron Commander of over 450 men, flying 129 missions. He won many honors during the war years, including The Silver Star Legion of Merit (three times), Distinguished Flying Cross (twice), Air Medal (24 times), Soldier’s Medal, and the French Croix de Guerre, and was recently recognized (with one other airman) as being the last surviving members of their squadron— thus they were awarded a bottle of brandy which had been set aside for such an occasion at the end of the war. In 1968 Ralph retired from the Air Force after 32 years of service and returned to Seattle with his wife, Wisteria (Tiero), and their five children, and joined Windermere Real Estate.
He retired from Windermere a dozen or so years ago, but was seen in the office from time to time conferring with the “Coeds” as he referred to them. He attended almost all Windermere functions, dressed to the nines, spreading good cheer. He was a friend to literally hundreds of agents and staff. He was father confessor, real estate expert, mentor, teacher and most importantly a very, very good friend. He helped to foster the culture of relationships so meaningful to our business.
There was a sweetness and courtliness to Ralph that all of us, And I Mean All, loved! He wasn’t perfect—in fact he had a side to him that, to say the least, was unusual for a man who’d been successful in his military and business careers and had attained financial stability. The quirk was this: he was penurious. Having grown up in the Depression he could squeeze a dollar out of a nickel, as he was fond of saying. For example, from time to time he would purchase not second but third-hand cars from various government agencies. He would drive them ‘til they dropped and then move on to the next. He once had an old beater with a muffler that was shot— you could hear the car coming from a mile away. But rather than go to Schuck’s for a new one that in those days would cost about 15 bucks, he soaked two cedar planks in water overnight and wired them on the muffler. It still sounded like a bleating goat coming but to Ralph the problem was solved.
In the very early years of Windermere, Ralph decided we should have a “readjustment” hour starting around 5 o’clock every day, sometimes earlier. Several of us, depending on who were around, would gather and discuss everything from business issues to world problems. The venue shifted from time to time, but it was always called “Café Ralph” and he served as the Steward. God it was fun, and I believe we even had some good ideas coming out of those sessions.
In Ralph’s later years he became quite the local WWII celebrity, regaling reporters about his flying days in his plane, The Tallahassee Lassie. Ralph was very active in Paul Allen’s Flying Heritage Collection Museum in Everett, where his plane is housed—on display and sometimes to this day still flown.
A little over a year ago the UW Foster School of Business asked me to speak at their annual event for local business people, students and faculty. I asked Ralph to attend in that my topic was the value of relationships in business. I think Ralph is one of those folks who are referred to in Tom Brokaw’s book The Greatest Generation. He was my mentor, teaching me the value of relationships and helping me to establish the culture of Windermere with his wit, charm and intelligence.
There are some thoughts I’ve written down that, I believe, are apropos to Ralph. One being from Oliver Wendell Holmes: “Each of us must be involved in the affairs of our times otherwise facing the peril of not to have lived”. Boy, Ralph was certainly involved throughout his life in the affairs of the times! Another sentiment that could be expressed regarding Ralph: “The tragedy in inherently good, brave, true friends is that they have to leave us one day. I think they are probably okay while we are not.” I think of myself and probably some of you as not okay just yet.
Roz and I visited the American Cemetery on a bluff in Normandy overlooking Omaha Beach some years ago. There is an inscription on the wall of a chapel there—“Think not only upon the sorrow of their passing. Remember the glory of their spirit.” Ralph also visited that cemetery several years ago and recalled his memories of the invasion with me. For both of us, it was an extremely moving place and a very emotional experience.
When I last visited Ralph, I not only told him that I loved him, but that he was my Hero. He winked at me, gave me the “thumbs up” sign and I think said “Yeah!”
John W. Jacobi
Founder of Windermere Real Estate

Like many of you, our family has a high school student graduating soon who is both eager and excited to embark upon life’s next phase. It wasn’t all that long ago that for graduates, like ours, community service was something they did to pad their college applications, but now this important exercise is a requirement at most high schools. That’s because a common belief is that community service links together the academic, social, and emotional elements of learning while giving kids the chance for personal growth through helping others. And hopefully those same kids will grow into adults who will continue to be engaged, positive citizens in their community.
This is a philosophy that we believe in wholeheartedly at Windermere. That’s why every year our offices close their doors for one day to help make a positive difference in their communities. It all started in 1984 with a handful of agents who came together to help out a local elementary school that needed some TLC. Thirty-three years and more than one million hours of community service later, we’ve continued this tradition through neighborhood-enhancing projects in the areas where our Windermere teams live, work, and play.
We agree that community service shouldn’t end with a cap and gown. Over the years, our team has proven this time and time again by embodying the notion that service to others is not something you do, it is who you are.
On Friday June 9, Windermere offices throughout the Western U.S. will close their doors for our company-wide Community Service Day. You can follow their projects on our Facebook page: www.Facebook.com/WindermereRealEstate.

You’ve approved your landscape architect’s final site plan for your landscape design, and now it’s time to get the project built. You can pay the landscape architect to select a contractor for you, or you can hire one on your own. Like other building professionals, landscape contractors have different skillsets and levels of experience. A landscape contractor does not need an award-winning portfolio of work in order to do a great job. The work of the contractor comes down to getting the job done on budget and on time while providing good, reliable service and quality installation work.
There are different ways to hire a landscape contractor to build your project. If you have worked with a landscape architect on a design plan, you can further engage him or her to steward the hiring of a contractor for building the project. Or, you can do the work of finding, screening and hiring a landscape contractor on your own. Whatever your path is for hiring landscape contractors, there are things you should know about their qualifications and how they work with designers. Use this article as a guide to hiring a landscape contractor so that you find the best one for your project.
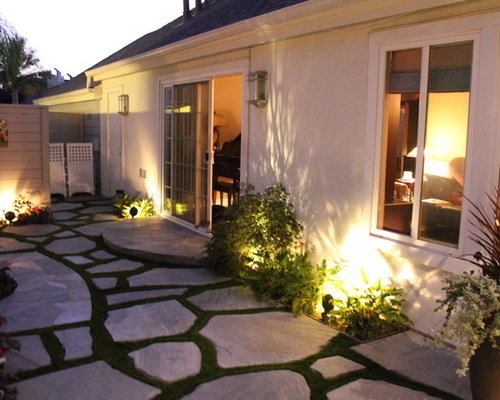
Landscape Contractor 1: Falon Land Studio LLC, original photo on Houzz
How to Find a Landscape Contractor for Your Project
As mentioned, there are two main ways to find a contractor: work with the landscape architect to select one or research and hire one on your own.
You have the option to pay the landscape architect who designed your property to do construction administration. That’s a technical term in the landscape industry for managing the administrative tasks of getting the installation under way. The landscape architect is then responsible for getting estimates or bids for the work and recommending the best company to you. The architect does not have to send the project out for pricing to several companies. Instead, the landscape architect will probably have a working relationship with a local contractor and will recommend that company to you.
Once you sign an agreement with the contractor, the landscape architect and builder will work together to ensure that the work will be built according to how it was designed.
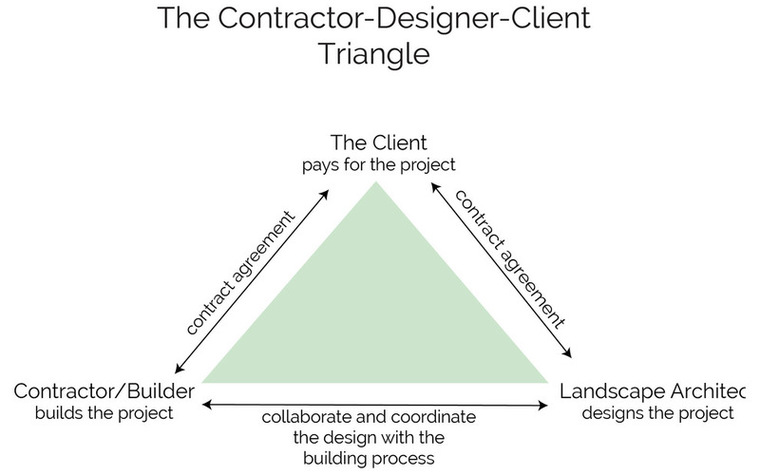
This method sets up a relationship like a triangle, in which you, as the client, have a contract agreement with the landscape architect for design and construction administration and a separate agreement with the contractor for installation. The tricky part is that there is no contract directly between the architect and the contractor, and the architect does not act as the contractor’s supervisor or boss. However, it is in the best interest of the contractor to build the project according to how it was designed, because the design has already been approved by the client. Ideally, the contractor’s agreement with the client will state that the project is to be built according to the landscape drawings and specifications, as prepared by the landscape architect.
The second option is to hire a contractor on your own. This eliminates the triangle relationship and will work well if you are savvy with building processes or if your project is very straightforward. If you are looking to have simple work completed, by all means hire the contractor on your own without involving an architect. If you do have detailed design drawings from the landscape architect, you can use them to get estimates, because you paid for the design services and you are free to use the plans to get the project built. This use of plans is often stated in the design services contract. The disadvantage of hiring the contractor on your own is that you won’t have the design help of a landscape architect when issues arise. For example, the contractor may not be able to find a particular type of stone and will have to substitute a different type. Without the landscape architect to provide design feedback, you’d have to make the decision alone. This might be fine for people who are knowledgeable about materials and construction lingo, but overwhelming for someone without much experience in design and construction.
A related option is to work with a landscape design-build firm that combines the design services with the installation. I will be covering this topic in a future ideabook.
Regardless of which route you choose, it’s good to know what to expect from the contractor so that you feel confident signing a contract agreement.
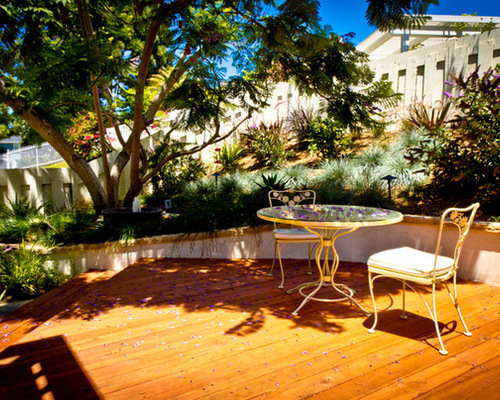
Landscape Contractor 2: Creative Atmospheres Inc, original photo on Houzz
How to Hire a Contractor on Your Own
If you are hiring the contractor on your own, you need to know where to look and how to review the company’s credentials.
Where to look. There are several ways to find your contractor. Doing a broad Internet search might not yield the best results, so it’s better to focus your search and find a local company. Here are a few good resources:
○ Search Houzz for landscape contractors in your area.
○ Ask your friends and neighbors for referrals.
○ Check with your local chamber of commerce.
○ Ask your local nursery or garden store for a referral.

Landscape Contractor 3: Benjamin Vogt / Monarch Gardens, original photo on Houzz
Review credentials. You want to hire a contractor who is knowledgeable, easy to work with and reliable. At the end of the day, your primary concern is hiring someone who will build the project on time and on schedule using quality materials and best practices. Here is a checklist of items to request that will inform you of the contractor’s credentials:
○ Licenses. Landscape contractors have licenses regulated by the state. Furthermore, your town may have additional requirements for a contractor performing work. Contractors will list their license number on Houzz and on their website. You can search on your state’s regulated professions website using this number to check that a license is in good standing.
○ Insurance. A landscape contractor should have general liability insurance and worker’s compensation insurance. Ask to see the certificate of insurance.
○ Client references. Call a few former clients and see if they were pleased with the services. It may be a red flag if a contractor has a hard time providing references. Some specific questions to ask of references include: Was the contractor reliable? Was the project completed on schedule? Are you pleased with the quality of the work?
○ Photos showing quality of work. Landscape contractors install plantings, paving, grading systems, decks, site walls, sod, seed, fences and water features. They have to be generalists, because they work with a variety of materials. They hire subcontractors to do specialty work around pools and other water features, irrigation, metalwork and any other work that’s outside their area of expertise. Ask for some detailed photos of projects they have built to demonstrate quality building techniques.
○ Experience with similarly sized work. Contractors work on a large array of project types, but most focus their work in terms of scale. This is important because their crew will bring a level of expertise that’s appropriate for the workflow and staging of your project.

Landscape Contractor 4: SavATree, original photo on Houzz
Ask about sustainable practices. The contractor will be disrupting the site and installing new materials, which will impact the environment. Make that impact less damaging by using the most sustainable materials and methods possible. Some contractors have been using sustainable practices for a long time, while others are just catching on to the concept. Let the landscape contractor know if sustainability is important to you by discussing it early.
You can gauge how well versed a contractor is in sustainable practices by asking some questions:
○ What organic and sustainable practices do you use? If the contractor hesitates to answer, try asking more specific questions, like the ones below.
○ Where will the materials be sourced from? It is best to use local stone and wood for your project to decrease the carbon footprint. Sourcing local materials can also save you money, because you won’t have to pay for materials to be shipped long distances.
○ Do you recycle plant containers or return them to the nursery? Most wholesale nurseries take back plastic plant containers and clean them for reuse. This might seem like a small thing, but those little containers can add up to a lot of plastic in projects with large planted areas. The contractor is responsible for hauling away materials once the job is done, so make sure they will be recycled or brought back to a nursery for reuse.
○ Do you use a mulch that’s free of chemicals and additives? Chemicals and dyes are used to make mulch in different colors, and they’re unnecessary additives. Go chemical free. The chemical-free mulches are usually less expensive anyway if they are from a local source.
○ Do you use power tools or hand tools? A lot can be accomplished with hand tools, and some compact sites will even require the use of hand tools over power tools and motorized utility vehicles. Most contractors use a combination of both types. If your project is small, there won’t be a big need for big power machinery.
Landscape Contractor 5: Eco Minded Solutions, original photo on Houzz
Know who will supervise your project. It’s helpful to know who the key players are in building your project, so that you’ll know who you will be speaking with as the work progresses. Larger companies, with several crews and supervisors, often have multiple project managers, and your project will be assigned to one supervisor and crew team. Small companies (with one or two supervisors) often have one main company manager, who is also an owner-founder of the company. You should know who the point people will be for your project, so you’ll know who to talk to as issues arise.
The site supervisor is the person responsible for leading the work crews each day. The supervisor is the person in charge, whom you will be communicating with onsite during the building process. If you have hired a landscape architect for construction administration, the landscape architect will check in with the site supervisor to keep track of progress and let you know if any issues arise.
Landscape Contractor 6: Gardens by Gabriel Inc, original photo on Houzz
Review the subcontractors. As a generalist, the landscape contractor relies on specialty artisans and workers to do custom work or build components with special materials and techniques. Along with knowing who will supervise the work, you will want to know who is responsible for specialty and artisan work, so that you can make sure those people are qualified. Ask for detailed information about the subcontractor’s qualifications, using similar questions to those you asked the landscape contractor.
The contractor hires subcontractors directly and typically has a roster of skilled people for special work. Common subcontracted work includes irrigation (some states require a specific irrigation license), pool installation, pond installation, specialty work (with materials like stone, wood, metal and concrete) and artisan work with sculpture, mosaics or ornate custom fabrications.
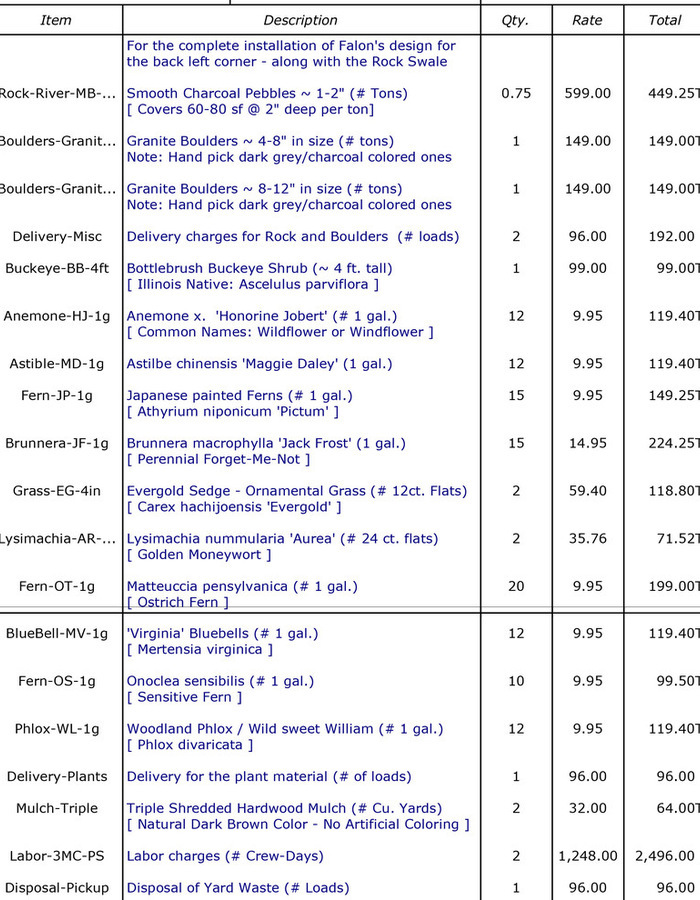
Landscape Contractor 7: Falon Land Studio LLC, original photo on Houzz
How much it will cost. There are two ways to get a cost from a contractor: an estimate or a bid. The differences between the two are explained in detail here.
When hiring a landscape contractor, you may want to use the bid, or fixed-price, method if you have a specific price that you do not want to exceed. However, the estimate is easier to compare among companies, because you’ll get detailed line item costs for the project. The landscape architect’s site plan for the project helps the contractor provide a more precise estimate.
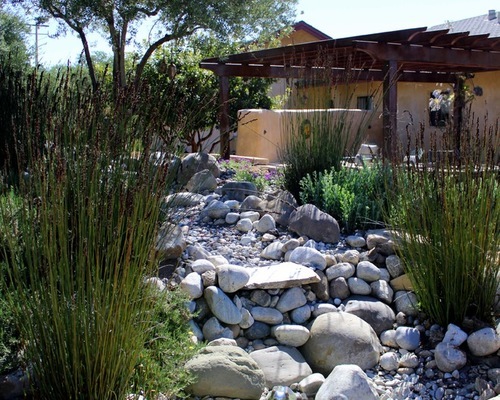
Pictured here is a section of an estimate for a small swale garden installation from a landscape contractor. Landscape construction estimates include the materials, labor, delivery fees, waste disposal fees, project management fees (typically included in the labor cost) and anything else required to build the project. The cost of plants and materials is lower than what you would pay for plants at a retail store, because contractors purchase from wholesale distributors. A contractor will provide a detailed estimate with line items, like the one here. Compare estimates from several companies to make your selection.
Landscape Contractor 8: Madrone Landscapes, original photo on Houzz
Making a Decision
It’s ultimately your choice as the client to pick the company you prefer. This means that you can override the landscape architect’s suggestion if there is another company you want to hire. The implication of suggesting someone else is that the architect and contractor will need to meet early in the project to build trust and a working relationship prior to the start of construction.
Base your decision on the best combination of qualifications, experience and cost to do the work. The cheapest estimate might not be the best choice, nor might the company with the most experience. It’s also helpful to meet potential contractors in person. The contractor will want to walk your property — or at least drive by — before providing an estimate anyhow, so use the opportunity to meet and get a feel for how professional and reliable he or she is. If you are vetting contractors on your own, request that they visit the site and have a short meeting with you so that you can talk in person. The background check can be done online and by speaking with the company over the phone.
Once you’ve made your selection, you will need to sign a contract that outlines the scope of work, warranty on plants and schedule for project completion.
By Falon Mihalic, Houzz

The shortage of homes for sale has been a major concern for buyers and real estate agents over the last few years. Windermere Chief Economist, Matthew Gardner, explains the impact these shortages are having on the housing market.

More than 80 percent of Americans say they want an outdoor living space where they can relax and entertain. And it’s no wonder why. Outdoor spaces extend your livable space, add visual interest, and increase not only your quality of life, but also the overall value of your home. (In some cases, the increase in your home's value can cover most or all of the cost to create the new space.) Here are some options to consider:
DECK
Decks are still the most popular outdoor living spaces, not only because they work so well for entertaining and relaxing, but also because they have the highest return on investment (see the Tips column for data).
Surprisingly, wood decks (made of cedar or pine) are actually the better financial investment, because building with Trex or other popular composite products costs considerably more, yet doesn’t increase the home’s value by as much.
Expanding and reconfiguring your current deck is another option that’s popular today. The contractor will typically remove the old face boards, extend the underlying structure, and then put down the new decking. This is also an opportunity to add built-in furniture, privacy screens, even plumbing and electricity.
PATIO
Running a close second to decks – in both popularity and investment return – are patios. With a patio, you can relax and entertain at ground level, which can afford more privacy in urban areas, and allows you to be more engaged with the surrounding plants and landscaping.
Typically made of brick, concrete, or stone, a patio also comes with far fewer maintenance and repair issues than a deck. Plus, patios are generally easier and less disruptive to construct – which is why they’re often about 30 percent less expensive to have professionally built.
GAZEBO
For those who want even more privacy, as well as shelter from the sun and protection from mosquitoes and other pests, there’s the gazebo. Available with walls or as an open-air design, with screening or not, these modestly sized, affordable backyard structures can be built from scratch or purchased as a kit (for assembly by a do-it-yourselfer or a professional).
Popular in the Midwest for decades, gazebos have made their way west as homeowners here have discovered how nice and easy they are for creating a shaded spot for reading, relaxing, and backyard gatherings.
OUTDOOR KITCHEN
People tend to gather naturally in the kitchen. And when the kitchen is outdoors, it creates an ideal opportunity to mix, mingle and interact in the open air. Other reasons why cooking outdoors makes so much sense: less kitchen cleanup, the house stays cooler during the summer, and grilled food just tastes better.
Some may think an outdoor kitchen is only for cooks who host large parties, but homeowners who go this route say they’re more of an extension of the home, and great for daily use.
Designs for outdoor kitchens range from the simple (a grill, limited counter and cabinet space, and maybe a prep sink) to truly independent entities with a refrigerator, an elaborate grill, warming oven, freestanding island with storage space, rolling cart stations, and even a dishwasher. Depending on how elaborate your design, you may be able to list it as a second kitchen when selling your house.
SIX PLANNING SUGGESTIONS
If you’re eager to live a healthier lifestyle and reconnect with family and friends, as most people are today, it’s time to consider an outdoor living space.


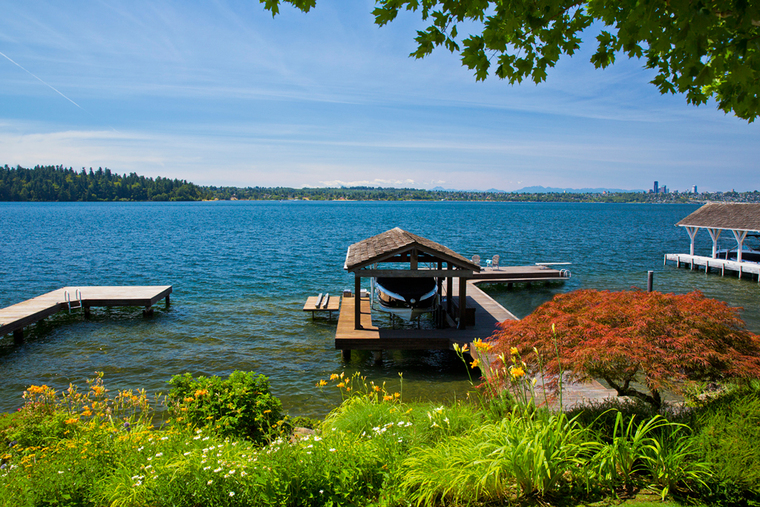
 Waterfront properties are subject to additional regulations and codes from various local, state and federal agencies. There are very strict regulations on shoreline development. If the property requires a new dock or bulkhead, it’s important to know that this can be a very challenging process given the multiple government agencies involved. These limitations are likely to get even more restrictive in the near future as the shoreline regulations are being updated. Sooner is better than later in applying for any permits related to docks, bulkheads and changes to the shoreline.
 Living on the water means that you have an additional set of factors to consider concerning your waterfront experience. For example, what is the boating traffic like in front of your home? Is it a busy channel or near a favorite fishing spot where boaters tend to congregate? Look closely at the properties of your waterfront neighbors: is there a tear-down next door so there will likely be a construction barge in front of you for the next few years? Does your neighbor have a huge yacht moored all summer that blocks your view? Is there a public beach nearby or community club that will cause noise late into the evenings?
")
