
 Facebook
 X
X
 Pinterest
 Copy Link

ECONOMIC OVERVIEW
Employment in the Las Vegas area continues to improve, reporting a 3.2% increase compared to first quarter of last year, while the unemployment rate remained essentially the same. As of February, 966,300 people were employed in the Las Vegas market, up by 29,900 from February 2016. Another good sign is that the labor force continues to expand, suggesting that there is more confidence in the area’s economy. I believe we will continue to see the job market improve as we move through the year
HOME SALES
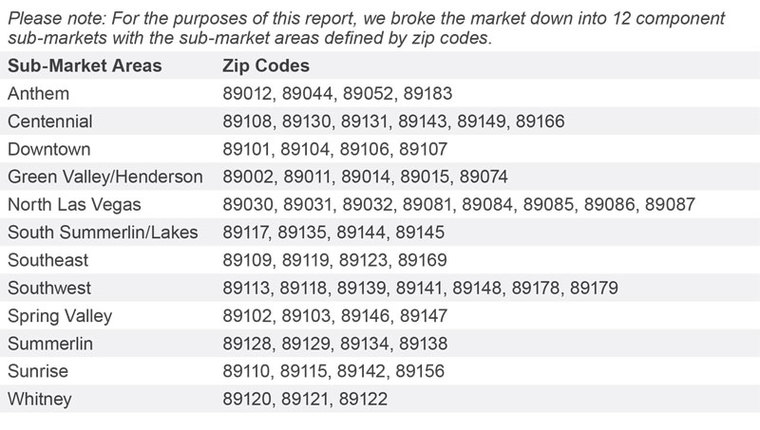
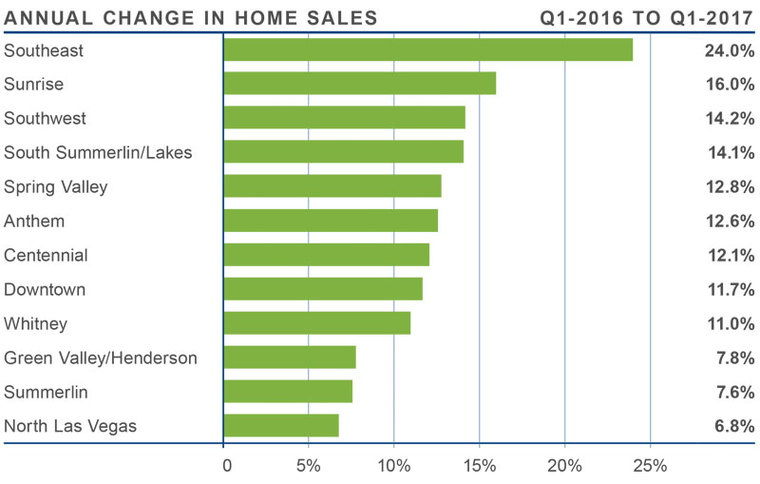
- A total of 8,623 homes sold in the first quarter, which was an increase of 11.9% over the same period a year ago. Sales were 14.2% lower than last quarter, but I believe that’s due to seasonality.
- Home sales were somewhat less robust in the North Las Vegas, Summerlin, and Green Valley/Henderson sub-markets, but this is likely due to low inventory and is not a cause for concern.
- There were sizable increases in home sales in a majority of the sub-markets reviewed within this report, but sales grew the fastest in the Southeast Las Vegas sub-market, which saw a 24% increase when compared to a year ago.
- Inventory levels remain very low, with 28% fewer homes for sale than the same period in 2016. We may see a spring “bump” in listings; however, the market is going to remain very tight for the foreseeable future.
HOME PRICES
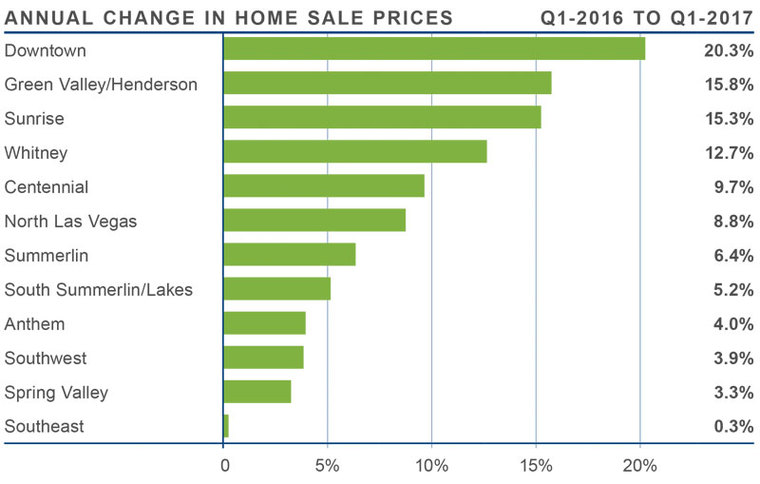
- Over the past year, home prices in the region rose by 7.8% to $245,121. When compared to the fourth quarter of 2016, prices are up by 2.3%.
- The relatively affordable downtown sub-market saw the strongest annual growth, with home prices rising by 20.3% to $158,300. Double-digit gains were also seen in the Green Valley/Henderson, Sunrise, and Whitney neighborhoods.
- Prices rose in all sub-markets when compared to the first quarter of 2016, with several continuing to rise at rates that are well above their long-term averages.
- The only market that did not see prices rise significantly over the past year was in the Southeast Las Vegas market.
DAYS ON MARKET
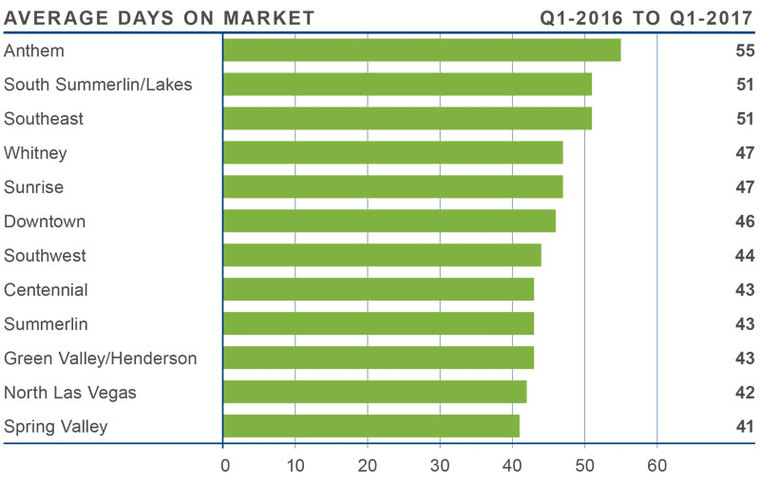
- The average time it took to sell a home in the region dropped by 16 days when compared to the first quarter of 2016.
- It took an average of 47 days to sell a home in the first quarter of this year, which is two days higher than seen last quarter.
- The length of time it takes to sell a home dropped in all the Las Vegas sub-markets compared to a year ago.
- The greatest drop in days-on-market was in the Green Valley/Henderson and Southwest sub-markets, which both dropped by 22 days when compared to the same quarter in 2016.
CONCLUSIONS
 The speedometer reflects the state of the region’s housing market using housing inventory, price gains, home sales, interest rates, and larger economic factors. Employment growth in Clark County has picked up again, and this bodes well for the housing market in this region. Due to the low number of homes for sale, home prices continue to increase despite rising mortgage rates. Given these factors, I have moved the speedometer more towards the seller’s side. Inventory levels are still very low and competition for well-located—and well-priced—homes remains high.
 Matthew Gardner is the Chief Economist for Windermere Real Estate, specializing in residential market analysis, commercial/industrial market analysis, financial analysis, and land use and regional economics. He is the former Principal of Gardner Economics, and has over 25 years of professional experience both in the U.S. and U.K.
")


