Thanks to the generosity of Windermere agents and the community, the Windermere Foundation collected over $903,500 in donations through the second quarter of 2017. This is an increase of 10 percent compared to this time last year! Individual contributions and fundraisers accounted for 62 percent of the donations, while 38 percent came from donations through Windermere agent commissions. So far, we have raised a total of $34,009,527 in donations since 1989.
Each Windermere office has its own Windermere Foundation fund account that they use to make donations to organizations in their communities. Year to date, a total of $979,486 has been disbursed to non-profit organizations dedicated to providing services to low-income and homeless families throughout the Western U.S.
One organization that has been the recipient of Windermere Foundation funds is the League of United Latin American Citizens (LULAC) National Scholarship Fund. LULAC has considered education its number one priority since it was established in 1929. The scholarship fund was established in 1975 to provide scholarships to help Hispanic youth in underserved communities make the dream of college enrollment a reality. Former recipients of LNSF scholarships are now leaders in fields of business, science, government, and education. A rigorous selection process assures the expectation that future recipients will demonstrate the same level of excellence.
Last year, the Windermere office in Salinas, CA supported LULAC’s scholarship fund with a $1,000 donation, and will be making this donation annually. Christopher Barrera, Realtor and President of LULAC Salinas Council #2055, says “I am proud to be associated with such a great organization like Windermere Valley Properties in Salinas, and it’ll be an honor to present a check to LULAC on behalf of Windermere and the Windermere Foundation.” Each year, the LULAC Salinas Council holds a Black & White Ball to raise money for the scholarship fund. Monies raised are matched by LULAC national. There were 14 scholarships awarded in 2016. Thanks to the $15,000 raised through their event, matching funds from LULAC national, and a donation from the Windermere Foundation, they will be awarding 39 scholarships at a presentation ceremony on July 29 in Old Town Salinas.
Generous donations to the Windermere Foundation over the years have enabled Windermere offices to continue to support local non-profits like LULAC. If you’d like to help support programs for low-income and homeless families in your community, please click on the Donate button.
Studies continue to show that real estate buyers are willing to pay a substantial premium for homes that feature highly efficient, environmentally friendly “green energy” technology.
While the added value depends on the location of the home, its age, and whether it’s certified or not, three separate studies all found that newly constructed, Energy Star- or LEED-certified homes typically sell for about nine percent more than comparable, non-certified new homes. Plus, one of those studies discovered that existing homes retrofitted with green technologies, and certified as such, can command a whopping 30-percent sales-price boost.
Options include technologies that you may already be very familiar with, as well as some new breakthroughs that may surprise you:
Fuel cells
Fuel cells may soon offer an all-new source of electricity that would allow you to completely disconnect your home from all other sources of electricity. About the size of a dishwasher, a fuel cell connects to your home’s natural gas line and electrochemically converts methane to electricity. One unit would pack more than enough energy to power your whole home.
Past fuel cells have been far too expensive and unreliable. But Redbox Power Systems, a company that’s planning to launch its first fuel cell later this year, is using new materials, claims they’ll be able to cut the purchase price by 90 percent, and predicts the associated electricity-bill savings will allow homeowners to pay off that purchase price in just two years’ time.
Wind turbine
A wind turbine (essentially a propeller spinning atop an 80- to 100-foot pole) collects kinetic energy from the wind and converts it to electricity for your home. And according to the Department of Energy, a small version can slash your electrical bill by 50 to 90 percent.
But before you get too excited, you need to know that the zoning laws in most urban areas don’t allow wind turbines. They’re too tall. The best prospects for this technology are homes located on at least an acre of land, well outside the city limits.
Cool roof
Cool roofs keep the houses they’re covering as much as 50 to 60 degrees cooler by reflecting the heat of the sun away from the interior, allowing the occupants to stay cooler and save on air-conditioning costs. The most common form is metal roofing. Other options include roof membranes and reflective asphalt shingles.
Green roof
Another way to keep the interior of your house cooler—and save on air-conditioning costs—is to replace your traditional roof with a layer of vegetation (typically hardy groundcovers). This is more expensive than a cool roof and requires regular maintenance, but young, environmentally conscious home owners are very attracted to the concept.
Hybrid heating
Combining a heat pump with a standard furnace to create what’s known as a “hybrid heating system” can save you somewhere between 15 and 35 percent on your heating and cooling bills.
Unlike a gas or oil furnace, a heat pump doesn’t use any fuel. Instead, the coils inside the unit absorb whatever heat exists naturally in the outside air, and distributes it via the same ductwork used by your furnace. When the outside air temperature gets too cold for the heat pump to work, the system switches over to your traditional furnace.
Geothermal heating
Geothermal heating units are like heat pumps, except instead of absorbing heat from the outside air, they absorb the heat in the soil next to your house via coils buried in the ground. The coils can be buried horizontally or, if you don’t have a wide enough yard, they can be buried vertically. While the installation price of a geothermal system can be several times that of a hybrid, air-sourced system, the cost savings on your energy bills can cover the installation costs in five to 10 years.
Solar power
Solar panels capture light energy from the sun and convert it directly into electricity. For decades, you may have seen these panels sitting on sunny rooftops all across America. But it’s only recently that this energy-saving option has become truly affordable.
In 2010, installing a solar system on a typical mid-sized house would have set the homeowner back $30,000. But today, that price has been slashed to an average of just $19,000. Plus, some companies are now offering to rent solar panels to homeowners (the company retains ownership of the panels and sells the homeowner access to the power at roughly 10 to 15 percent less than they would pay their local utility).
Solar water heaters
Rooftop solar panels can also be used to heat your home’s water. The Environmental Protection Agency estimates that the average homeowner who makes this switch should see their water bills shrink by 50 to 80 percent.
Tax credits/rebates
Many of the innovative solutions summarized above come with big price tags attached. However, federal, state and local rebates/tax credits can often slash those expenses by as much as 50 percent. So before ruling any of these ideas out, take some time to see which incentives you may qualify for at dsireusa.org and the “tax incentives” pages at Energy.gov.
Regardless of which option you choose, these technologies will not only help to conserve valuable resources and reduce your monthly utility expenses, but also add resale value that you can leverage whenever you decide it’s time to sell and move on to a new home.
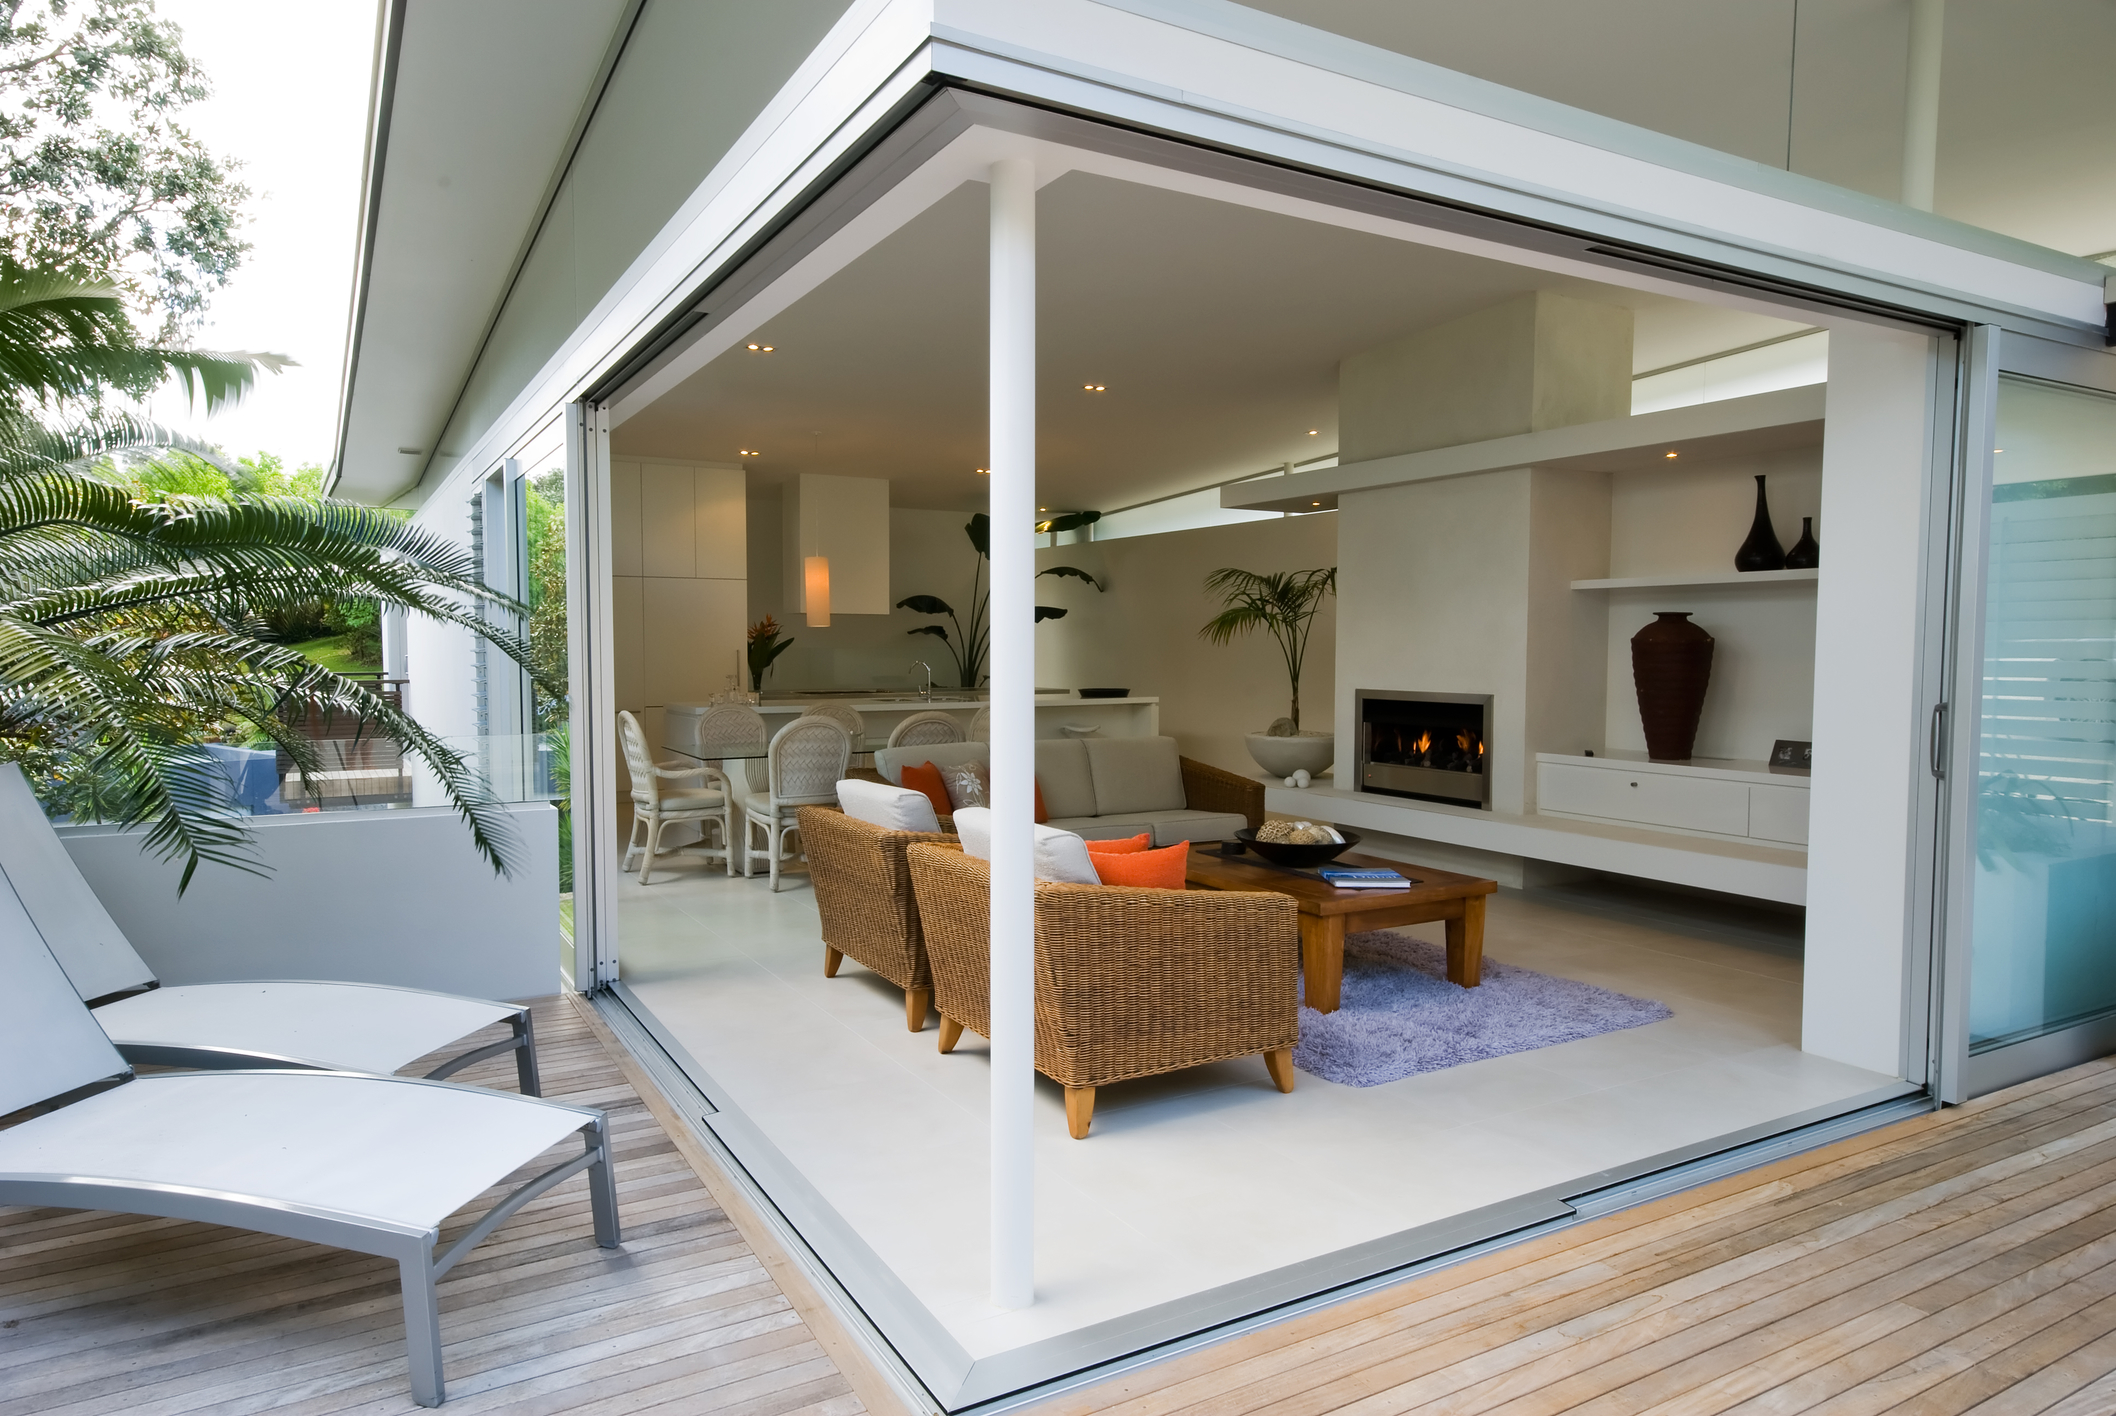
How can you make your home more attractive to potential buyers? The answer is with some “home staging”. According to the Wall Street Journal, implementing some basic interior design techniques can not only speed up the sale of your home but also increase your final selling price.
It all comes down to highlighting your home's strengths, downplaying its weaknesses, and making it more appealing to the largest pool of prospective buyers. Staging an empty house is also important to help buyers visualize how the spaces would be used, and to give the home warmth and character.
Cohesiveness Is Key
Make the inside match the outside. For example, if the exterior architectural style of your house is Victorian or Craftsman Bungalow, the interior should be primarily outfitted with furniture styles from essentially the same era. Prospective buyers who like the exterior style of your home are going to expect something similar when they step inside. If the two styles don’t agree or at least complement each other, there is likely going to be an immediate disconnect for the buyer. Contact your agent to help determine the architectural style of your home and what makes it unique.
There is always room for flexibility. Not all your furnishings need to match, and even the primary furnishings do not need to be an exact match to the architectural style of your home. To create cohesion, you simply need to reflect the overall look-and-feel of the exterior.
The Role of Personal Expression
Every home is a personal expression of its owner. But when you become a seller, you’ll want to deemphasize much of the décor that makes a place uniquely yours and instead look for ways to make it appeal to your target market. Keep in mind, your target market is made up of the group of people most likely to be interested in a home like yours—which is something your agent can help you determine.
Your Goal: Neutralize and Brighten
Since personal style differs from person to person, a good strategy to sell your home is to “neutralize” the design of your interior. A truly neutral interior design allows people touring the house to easily imagine their own belongings in the space—and to envision how some simple changes would make it uniquely their own.
In short, you want to downplay your own personal expression, while making it easy for others to mentally project their own sense of style on the space. Ideas include:
Paint over any bold wall colors with something more neutral, like a light beige, a warm gray, or a soft brown. The old advice used to be, “paint everything white,” but often that creates too sterile of an environment, while dark colors can make a room look small, even a bit dirty. Muted tones and soft colors work best.
Consider removing wallpaper if it’s a bold or busy design.
Replace heavy, dark curtains with neutral-colored shear versions; this will soften the hard edges around windows while letting in lots of natural light.
Turn on lamps, and if necessary, install lighting fixtures to brighten any dark spaces—especially the entry area.
Make sure everything is extremely clean. You may even want to hire professionals to give your home a thorough deep clean. Remember, the kitchen and bathrooms are by far the two most important rooms in a house when selling, so ongoing maintenance is important.
The Importance of De-Cluttering
Above all, make sure every room—including closets and the garage—is clutter-free. Family photos, personal memorabilia, and collectibles should be boxed up. Closets, shelves, and other storage areas should be mostly empty. Work benches should be free of tools and projects. Clear the kitchen counters, store non-necessary cookware, and remove all those magnets from the refrigerator door.
The same goes for furniture. If removing a chair, a lamp, a table, or other furnishings will make a particular space look larger or more inviting, then by all means do it.
You don’t want your home to appear cold, un-loved, or unlived-in, but you do want to remove distractions and provide prospective buyers with a blank canvas of sorts. Plus, de-cluttering your home now will make it that much easier to pack when it comes time to move.
Where to Start
Contact your agent for advice on how to most effectively stage your home or for a recommendation on a professional stager. While the simple interior design techniques outlined above may seem more like common sense than marketing magic, you’d be surprised at how many homeowners routinely overlook them. And the results are clear: staging your house to make it more appealing to your target buyer is often all it takes to speed the sale and boost the price.
On Friday, June 9, Windermere offices across the states of Washington, Oregon, Idaho, Montana, Hawaii, Alaska, Utah, California, Colorado, Nevada, and Arizona, all took a day off from selling homes to help make a difference in their local communities.
We challenged our offices to share their community service day photos on Windermere’s Facebook page, in order to participate in our fifth-annual voter-driven photo contest. Many of our offices shared photos, and in turn, they each received a $100 donation to the Windermere Foundation charity of their choice.
To add some competition to this challenge, we offered an additional $1,000 charitable contribution to the office with the most votes on their photo. So, who won?
With a total of 259 votes, the winner of the CSD photo contest is Windermere Utah!
Thank you to all of our Windermere offices and agents who spent the day giving back to local organizations, community centers, and public spaces throughout the Western U.S.
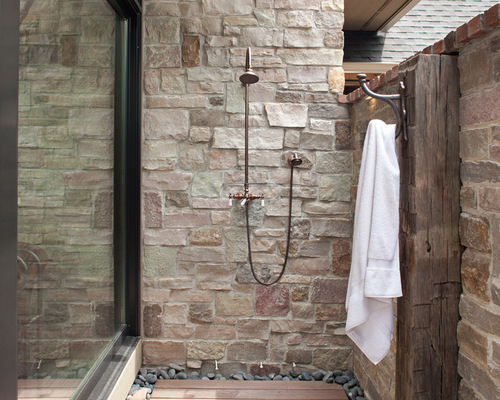
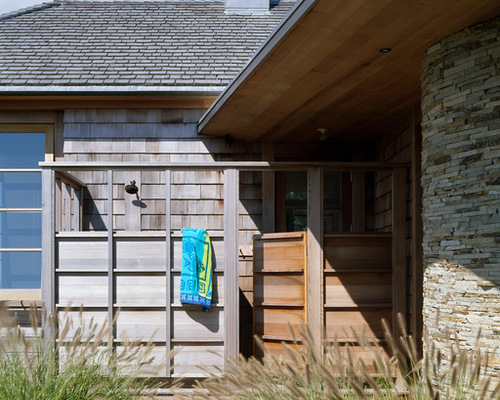
Showering often feels like more of an obligation than a pleasure — especially if you exercise and have to take more than one a day. Which might explain the burgeoning popularity of outdoor showers. “You’re showering outside in the elements, and there’s something about that that intrigues people,” says Phil Regan, principal designer at Hutker Architects.
Outdoor showers have become so popular, Regan can’t remember a time he did a house without one. (Of course, that might have something to do with the fact that his office is in Martha’s Vineyard, an upscale resort island off the coast of Massachusetts.) But even if you’re not a block from the beach (or the nearest neighbor), outdoor showers can shake up your routine and make you feel closer to nature.
Why: An outdoor shower makes a mundane ritual much more appealing, allowing you to savor fresh air, sky, birdsong and possibly even a view while you bathe. It’s especially handy for rinsing off before or after a dip in the pool, a trip to the beach or a grubby day of gardening. Many homeowners use them for bathing their dogs.
“It’s a pretty sybaritic experience, but not everyone is going to be comfortable with that,” acknowledges architect Julie Campbell of CTA Design Builders in Seattle.
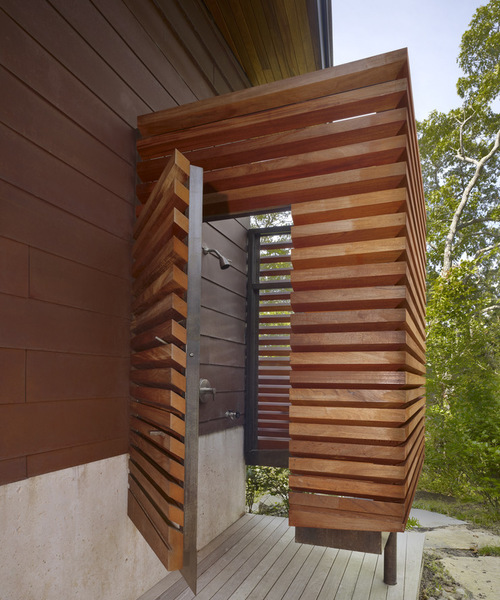
Who to hire: Outdoor showers require excavation, slab work, plumbing and alterations to the existing walls of the home, so don’t just hire a plumber — go with a general contractor who has experience building outdoor showers. Without that, “you’re probably going to make a bunch of simple mistakes,” says Regan, whose firm designed the shower tower shown here.
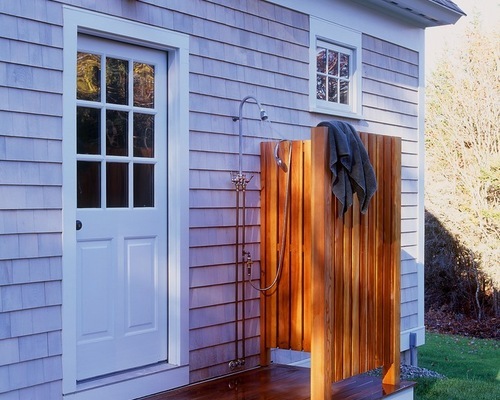
Cost range: A simple shower with hot and cold running water, like this one, can cost less than $1,000 to install. A moderate setup with a fancier enclosure can run anywhere from $1,000 to $4,000. And a more elaborate shower can cost $4,000 to $8,000 or more.
Permit: You’ll probably need a plumbing permit. Whether you’ll need a building permit depends on the design, cost and complexity of the project and the rules in your municipality. Many jurisdictions don’t even allow outdoor showers, so do your homework first.
Best time to do this project: Anytime the ground is not frozen.
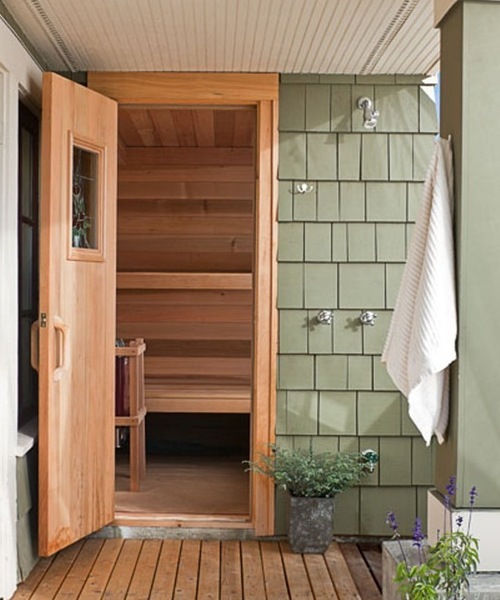
First step: The most important thing to consider when planning an outdoor shower is the location. You want it to be somewhere that gets direct sun, not only because it makes the act of showering more pleasant, but because it’ll keep the shower walls and floor drier — and that’s critical to preventing rot and scum. For that same reason, don’t place the shower under a roof overhang or tree (which could also cause debris to accumulate on the shower floor).
The other big consideration is privacy. Locate the shower away from probing eyes or add an enclosure that assures privacy (but maintains air circulation). If your house is two stories or is flanked by windows that could look down onto the shower, consider a louvered roof that prevents views in but still allows views out.
“If you want to experience the outdoors, you want to find a way to create privacy that doesn’t take away from that experience you’re looking for,” says Campbell.
Considerations: If the shower abuts your exterior, that siding will get pelted with more water than it was designed to withstand, so go with a material like cedar, mahogany or teak and add a waterproof membrane underneath to guard against water infiltration. To avoid siding problems, locate the shower away from the house.
If you live in a climate that gets cold, be sure to locate the water shutoff valve inside the house, and have the pipes blown out at the end of the season to avoid any water freezing in the pipes.
The shower needs to drain into either the home’s graywater system or a French drain, consisting of a large pit filled with several feet of gravel that filters the water as it returns to the soil. (Expect to replace the gravel every five or six years.) Needless to say, you want to direct the drainage away from the foundation and basement, and if you plan to use soap in the shower, away from plants as well.
If possible, situate the shower to take advantage of the site’s attributes, such as views or rock outcrops. “If there are natural amenities as part of the site, that’s all the more fun you can have with it,” says Regan.
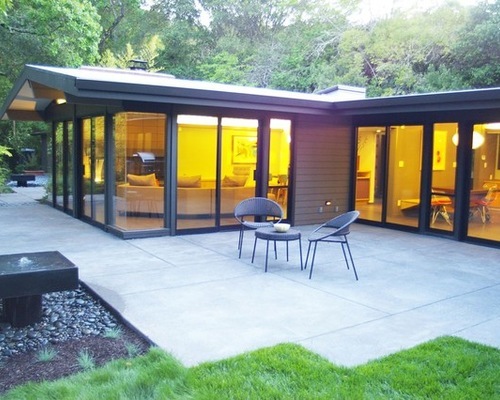
Concrete patios are often found in older homes, especially those built in the ’70s. But by now they’ve cracked and crumbled, leaving many homeowners wondering how to replace them, or even hoping to reclaim some of the green space lost by a particularly large patio.
If you count yourself in this group, here you’ll learn how to improve your outdoor space by removing or shrinking your concrete patio, or replacing an old cracked patio with a fresh new one that better suits your style today.
Getting rid of a concrete patio enables you to replace it with a more attractive option — like pavers, stone or a modern combination, as with this patio by Falling Waters Landscape, featuring a grid of concrete rectangles divided by permeable plantings. It can also allow you to create more lawn or garden space.
Best time to do it: When the weather is dry and temperate enough to permit heavy-duty work outdoors.
Why: “Concrete cracks, it’s not a very pretty product, and there are a lot of better solutions on the market,” says Micah Dennis of Paradise Restored Landscaping & Exterior Design.
Who to hire: This project requires heavy machinery and can have hidden pitfalls (like rebar lurking in your concrete), so it’s only a DIY if you earn your bread and butter in home improvement. If that doesn’t sound like you, it’s best to hire a licensed contractor.
Tip: Dennis warns that many contractors won’t take the project if they aren’t installing a replacement patio or garden, so have a plan in place when you start interviewing professionals.
Cost range: Between $800 and $1,000 for demolition alone. The total cost of your project will depend on what you decide to put in the patio’s place.
Typical project length: One day.
Permit required: None for the project, although some municipalities require a permit for dumping concrete, so call ahead.
Project considerations: While your contractor will check with utility companies to make sure there aren’t any gas lines lurking beneath your patio’s surface, that doesn’t mean there’s nothing under there. If the crew discovers rebar or an unexpected gas line, the project may be slightly delayed or cost more.
Your contractor will also likely use a jackhammer to remove the concrete, so it might be a good idea to plan to be gone for the day so you aren’t disturbed by the noise. Give your neighbors due consideration as well.
First steps: Your contractor will protect your windows with plywood, as concrete chunks can spray up and crack or break the glass or cause pits.
Your contractor may also take some “before” photos to record the way the elevations worked for when it’s time to install the new materials.
Then it’s time to remove your concrete. If you’re simply reducing the size of your patio, the contractor will start by using a concrete cutting saw to cut the concrete joints out. “If you don’t cut it, then you’re going to start jackhammering, and the rest of the patio is just going to crack,” Dennis explains.
If you’re removing the entire patio, the contractor will use both the saw and jackhammer to break the patio into chunks that crews can then comfortably remove.
After that the only thing left to do is haul out the concrete chunks — or recycle them as pavers or a stacked garden wall — and start work on whatever you have planned to replace it.
Grab the sparklers, clean up the grill, and don your red, white and blue! A fourth of July theme barbecue is the perfect way to ring in summer and celebrate. Here are some fun tips for a fun and safe holiday shindig:
Get the décor right: We love a good theme party, and nothing screams Independence Day more than red, white and blue; you can find decorative plates just about anywhere these days. Make your ownfancy decorations. Go above and beyond with holiday lights and a decorative place setting. Just make sure your flag flies right.
Make the menu: Keep the theme with your food with a festive fruit salad and decorated cupcakes. While everything cannot fit within the color theme, mixing traditional BBQ goodies with some fancy appetizers will add interest. And don’t forget the libations; whip up some fun red and blue adult beverages. *
Fire up the grill: Get your grill ready with a good scrub down and set up a grill station with all your tools; grill brush, utensils, seasonings, and plates so you don’t have to run to and from the kitchen and risk charring the burgers. Make sure to keep the grill safe with this easy guide.
Plan for the pets: Pet’s don’t typically enjoy Fourth of July as much as their humans with the loud noises and intense heat. Keep your furry friends safe by creating a comfortable and cool place for them to lounge indoors, that way they can retreat from the heat and the crowds. Make sure they get plenty of water in the intense summer heat.
We hope you have a fun and safe holiday weekend. You can find more fun Fourth of July tips on our Pinterest board.
75 million Baby Boomers control nearly 80% of all U.S. wealth, and as this generation ages, retires, and inevitably downsizes, they will have a significant impact on the housing market. Windermere’s Chief Economist, Matthew Gardner, explains when we can expect to see Boomers start to sell, opening much-needed inventory and making home ownership available to younger generations.
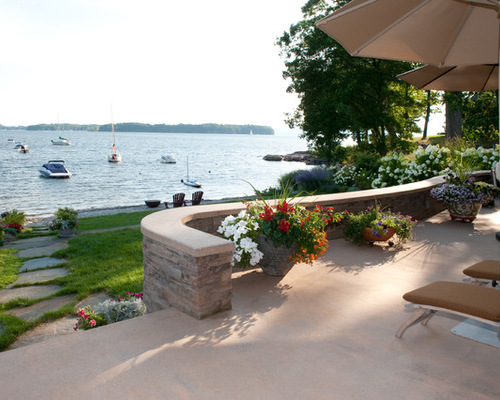
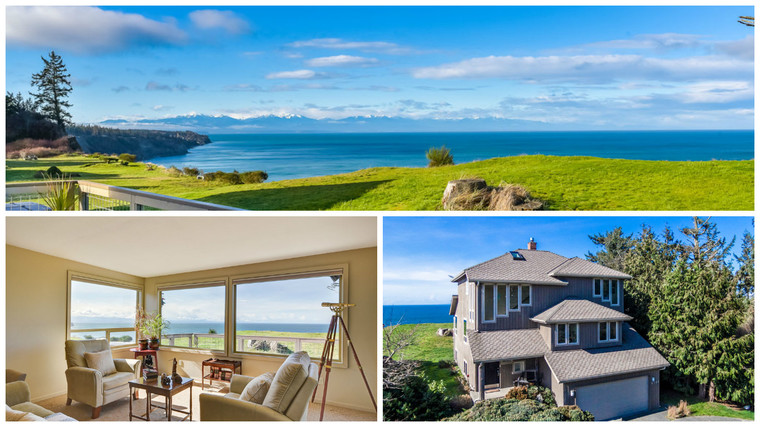
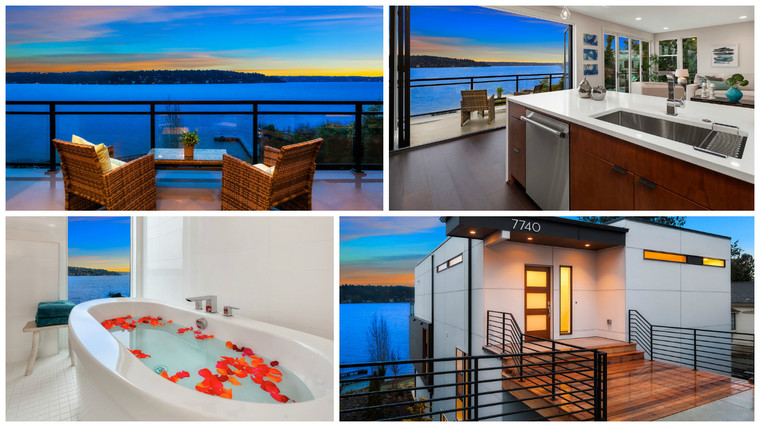
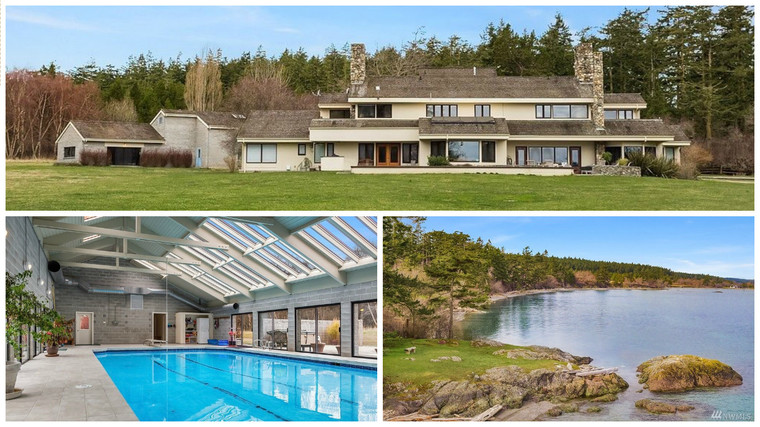
When you picture your best life, does it include entertaining shore-side? Launching a boat from your back steps? Or fishing in your pajamas? If you dream of a waterfront life then you’re in luck! That’s because on June 24-25 we are hosting the third-annual Washington Waterfront Home Tour. More than 80 homes from the San Juan Islands to Lake Sammamish are available to tour by boat, bike, or car. Properties are priced from $595,000 to $20 million. While you might think a waterfront home is out of your budget, there are actually properties that fit a wide variety of needs, styles, and budgets.
Here are a few examples of what you can expect to see this weekend on the tour:
A map of the homes and their open house hours can be found on the Washington Waterfront Home Tour website. Most will be held open from 1 p.m.-4 p.m. on June 24 and 25. The listing details will note the availability; for those listed as “by appointment only”, you can contact the agent for a private tour.
Where are the next housing hot spots? According to Windermere’s Chief Economist, Matthew Gardner, they are the communities that exist between urban neighborhoods and the suburbs.

 Facebook
 X
X
 Pinterest
 Copy Link

 Generous donations to the Windermere Foundation over the years have enabled Windermere offices to continue to support local non-profits like LULAC. If you’d like to help support programs for low-income and homeless families in your community, please click on the Donate button.


")


