

The following analysis of select counties of the Nevada real estate market is provided by Windermere Real Estate. We hope that this information may assist you with making better-informed real estate decisions. For further information about the housing market in your area, please don’t hesitate to contact your Windermere Real Estate agent.
Regional Economic Overview
Though the pace of job growth in Clark County continues to cool, the market added 44,000 new jobs over the past 12 months, which represents a respectable growth rate of 4%.
The non-seasonally adjusted and seasonally adjusted unemployment rate in August was 6.1%. This was down .1% from August of 2022. Although the rate may be disconcerting given the national rate of 3.8%, it should be noted that the jobless rate rose more as a function of a growing labor force. The local labor force rose 2.7% while the national labor force only increased 1.9%.
My updated employment forecast for the Las Vegas metro area shows employment growth continuing to taper. Growth in 2023 will be up 3.4%, and my preliminary 2024 forecast suggests that job growth will slow to around 1.8%.
Nevada Home Sales
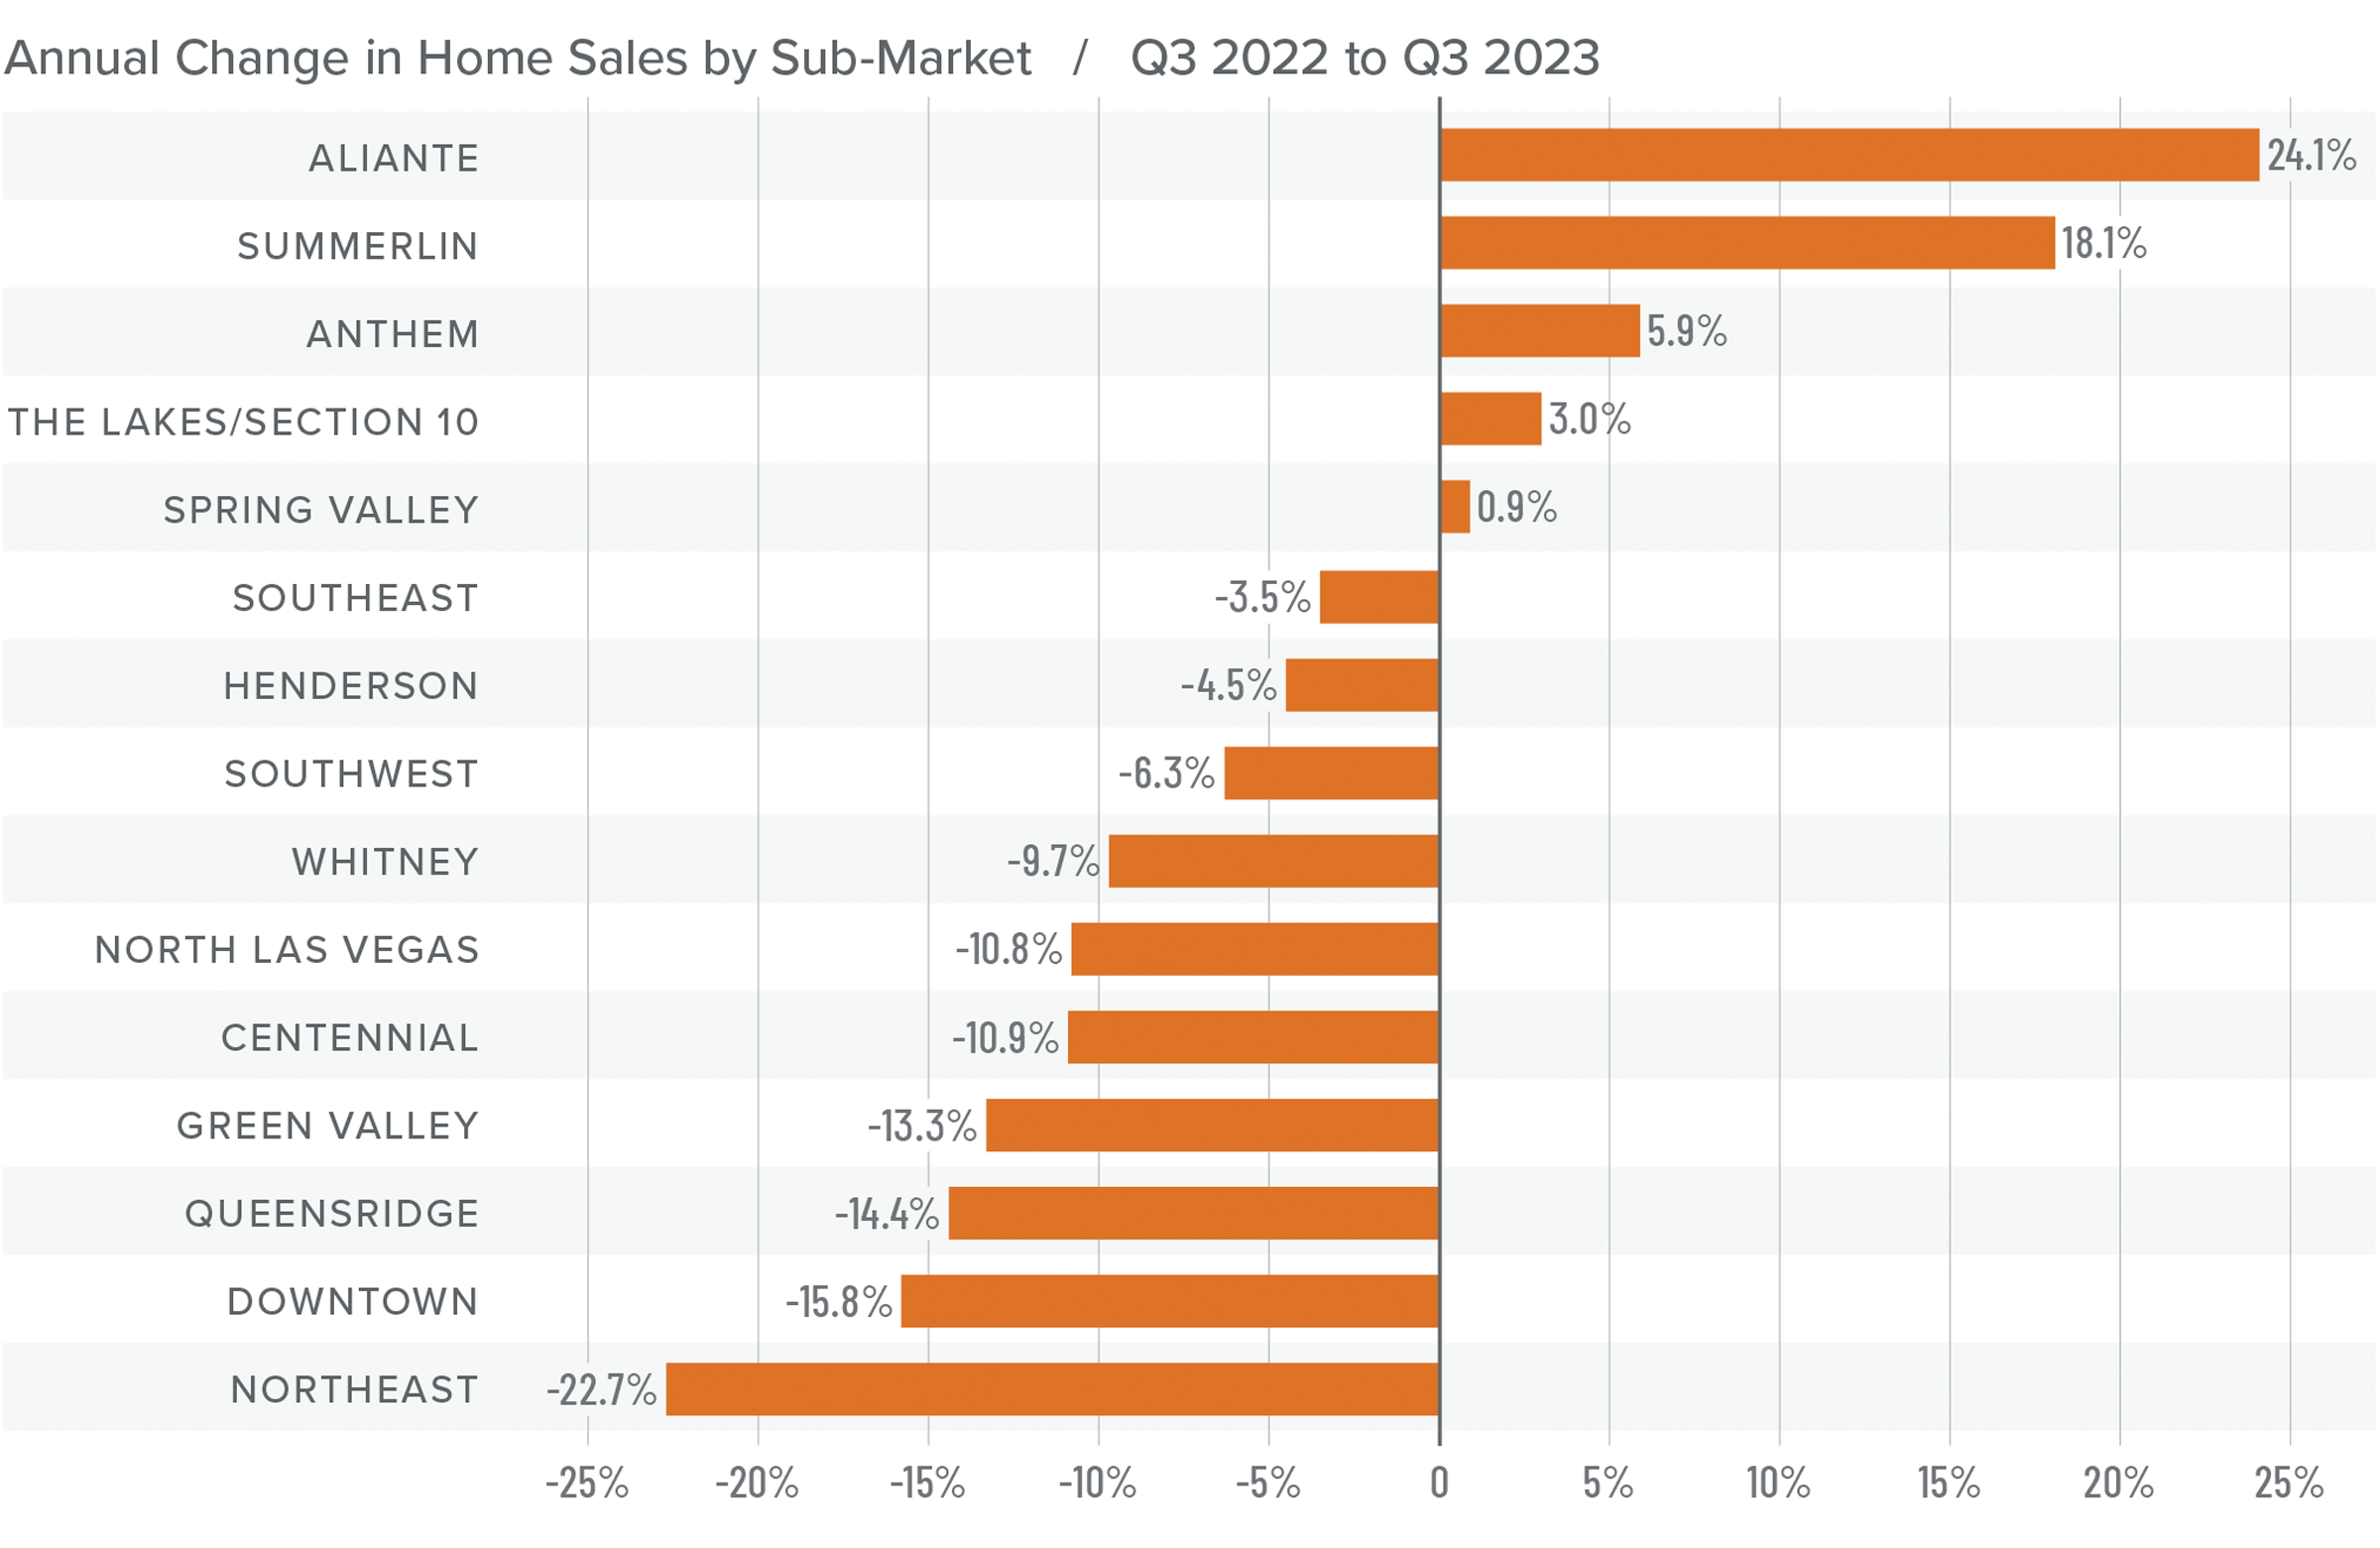
❱ A total of 6,011 homes sold in the third quarter, which was a drop of 6% compared to the same period in 2022. Sales were down 10.8% from the second quarter of 2023.
❱ Compared to the third quarter of 2022, sales fell in a majority of the markets covered by this report. Compared to the second quarter of this year, sales fell in all markets other than the Spring Valley and Aliante neighborhoods, where sales rose 3.6% and 20%, respectively.
❱ Listing activity was flat versus the second quarter of the year, but the number of homes for sale was down more than 54% year over year.
❱ Pending sales, which are an indicator of future closings, fell 13.1% compared to the second quarter, suggesting that sales activity may not grow in the upcoming quarter.
Nevada Home Prices
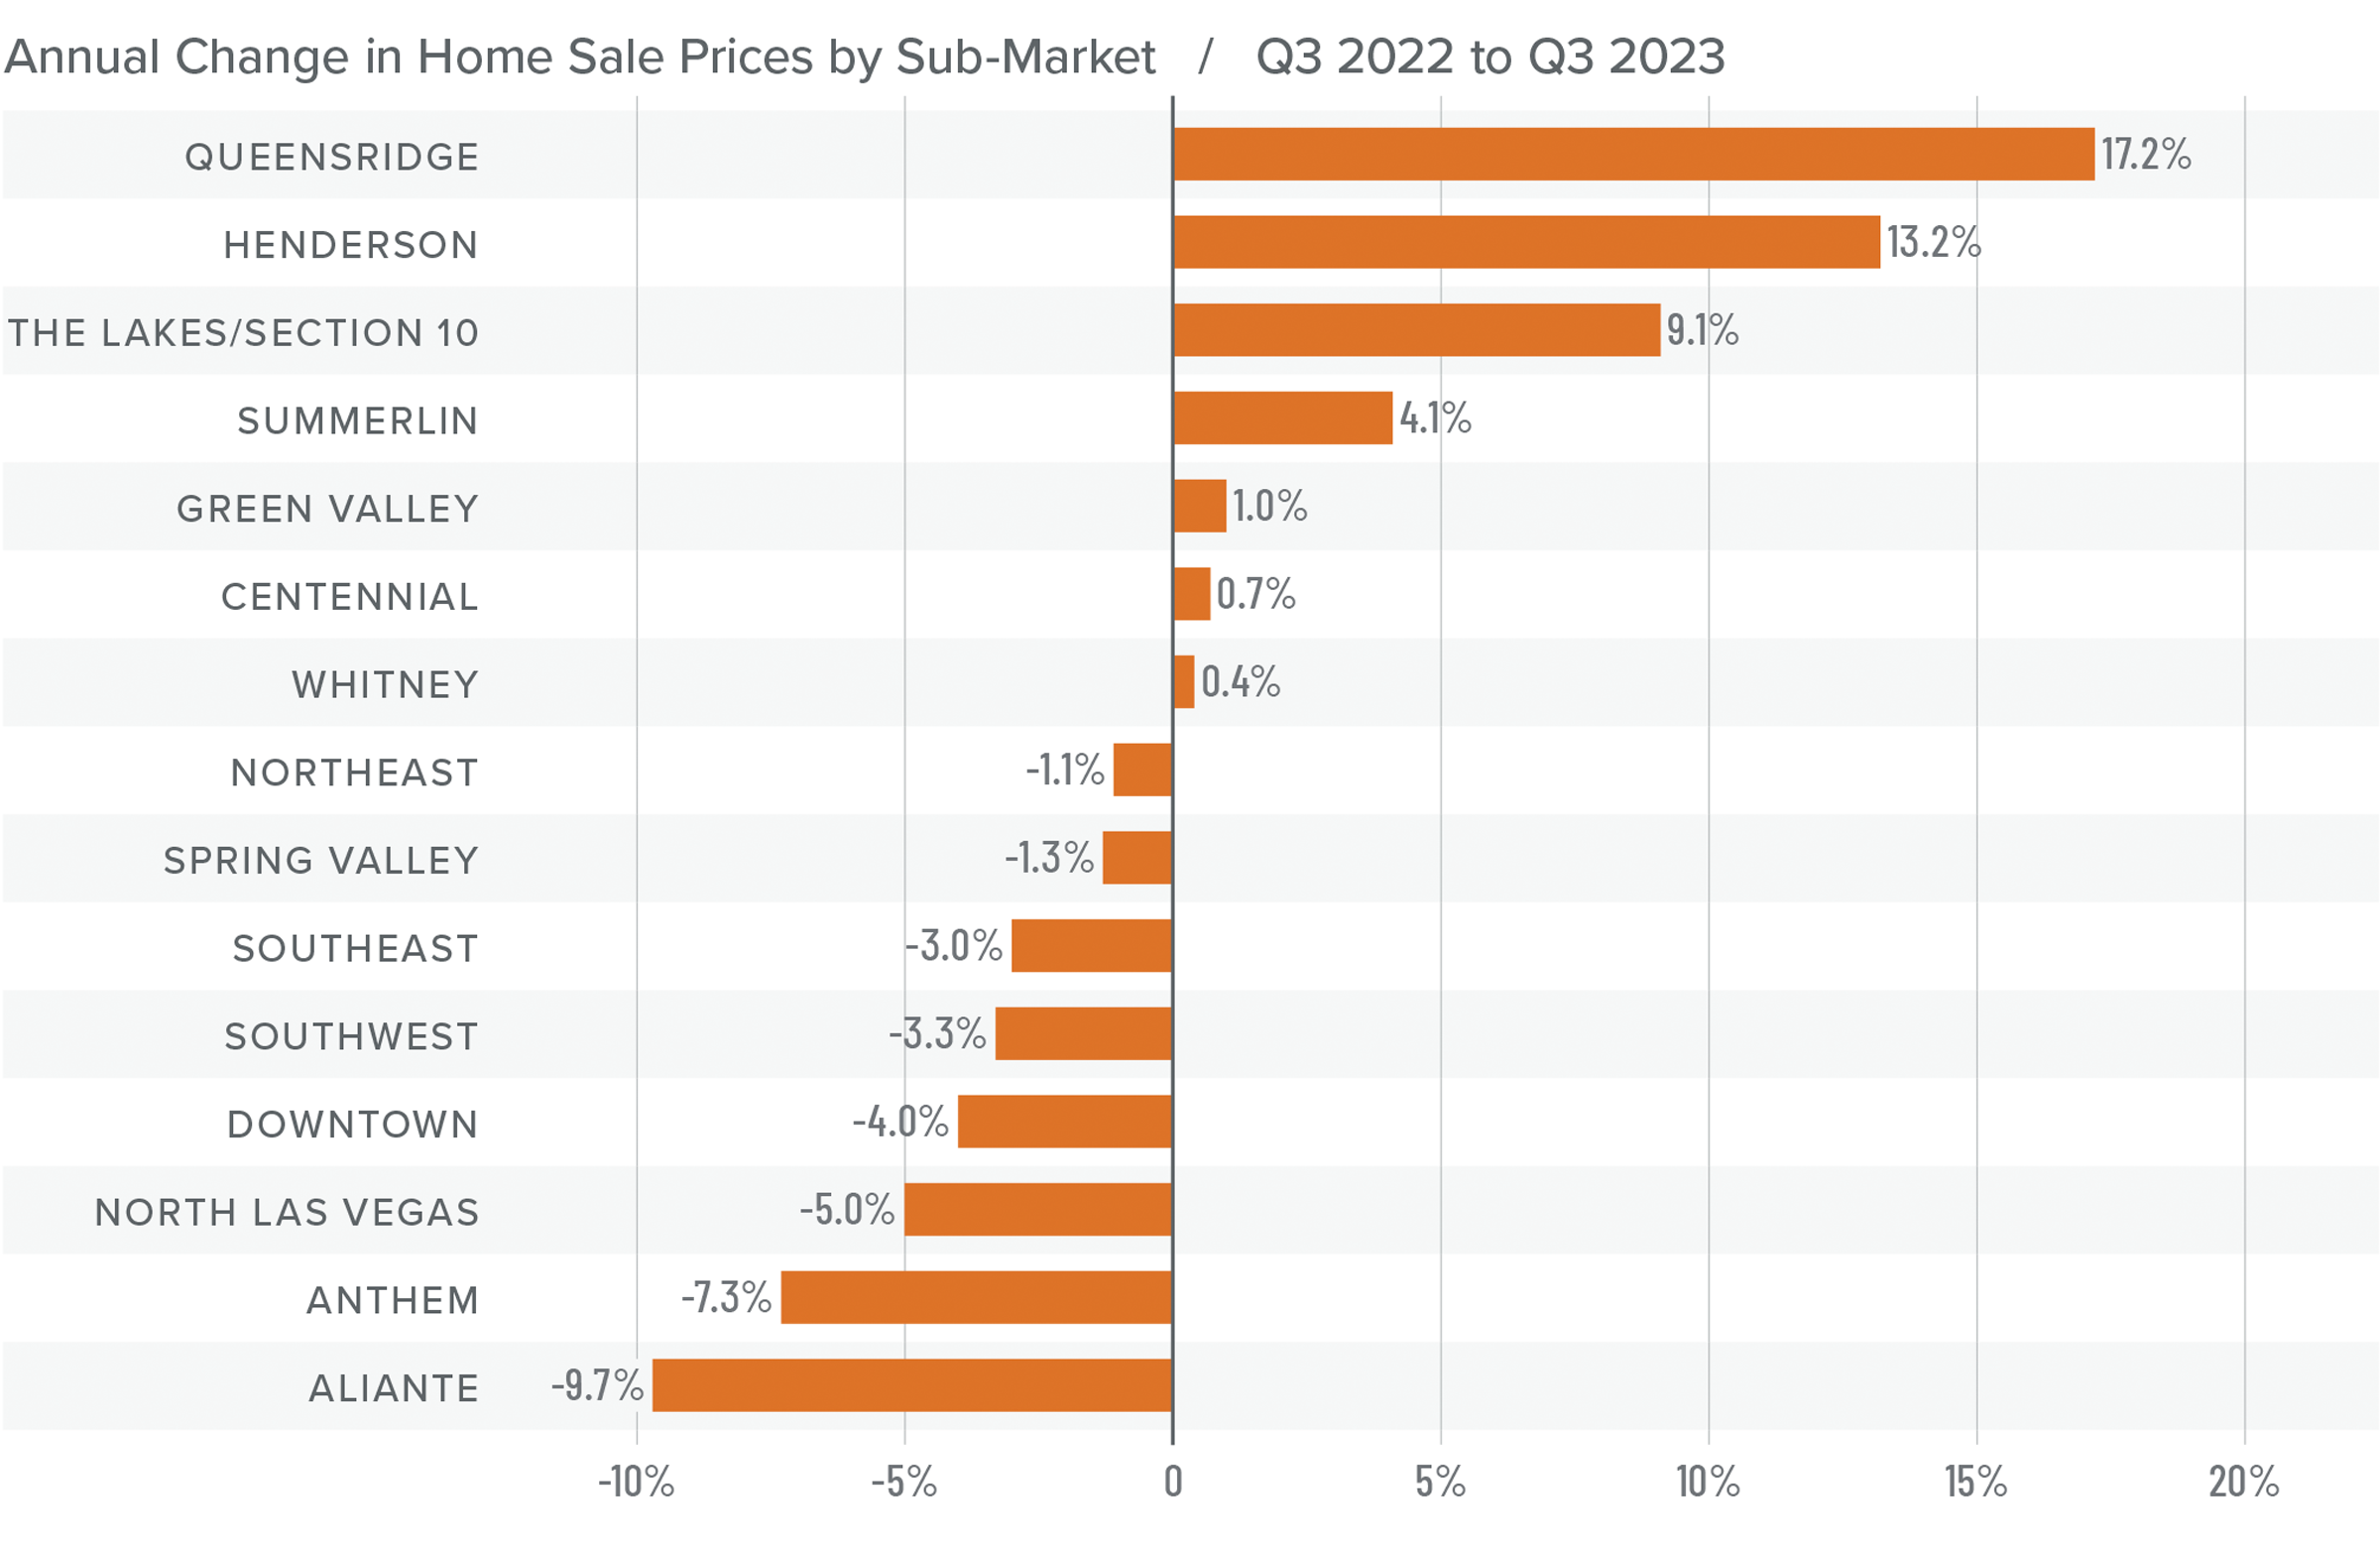
❱ Home prices fell .3% year over year but were .6% higher than in the second quarter of 2023. The average home sale price in the area was $478,355.
❱ Compared to the second quarter, more than half of the neighborhoods saw a drop in median list prices, which are a leading indicator of the housing market. However, increases in the remaining neighborhoods made aggregate list prices essentially flat.
❱ Year over year, prices fell in eight areas but rose in seven, with significant increases in the Queensridge and Henderson neighborhoods. Compared to the second quarter of this year, prices were up in every market other than Downtown, Aliante, Southeast Las Vegas, and Spring Valley.
❱ Lower list prices and flat price growth may suggest that the market is starting to react to higher mortgage rates. I don’t expect sale prices to move much for the balance of this year, but limited inventory should continue to support current values.
Mortgage Rates
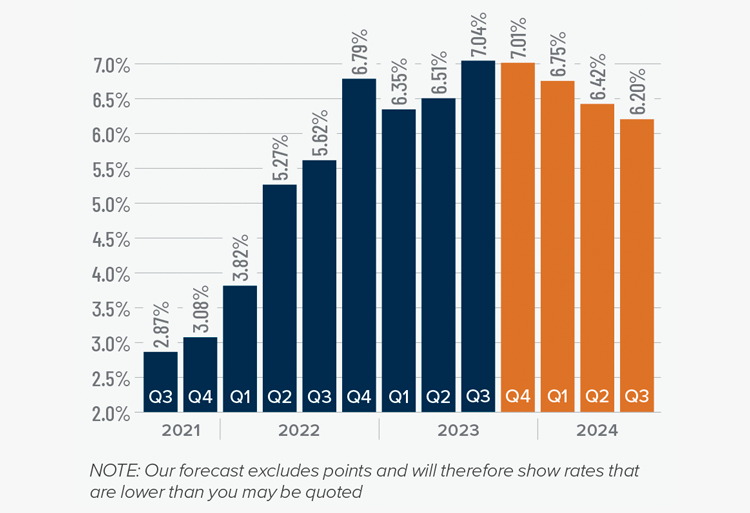
Mortgage rates continued trending higher in the third quarter of 2023 and are now at levels we have not seen since the fall of 2000. Mortgage rates are tied to the interest rate (yield) on 10-year treasuries, and they move in the opposite direction of the economy. Unfortunately for mortgage rates, the economy remains relatively buoyant, and though inflation is down significantly from its high, it is still elevated. These major factors and many minor ones are pushing Treasury yields higher, which is pushing mortgage rates up. Given the current position of the Federal Reserve, which intends to keep rates “higher for longer,” it is unlikely that home buyers will get much reprieve when it comes to borrowing costs any time soon.
With such a persistently positive economy, I have had to revise my forecast yet again. I now believe rates will hold at current levels before starting to trend down in the spring of next year.
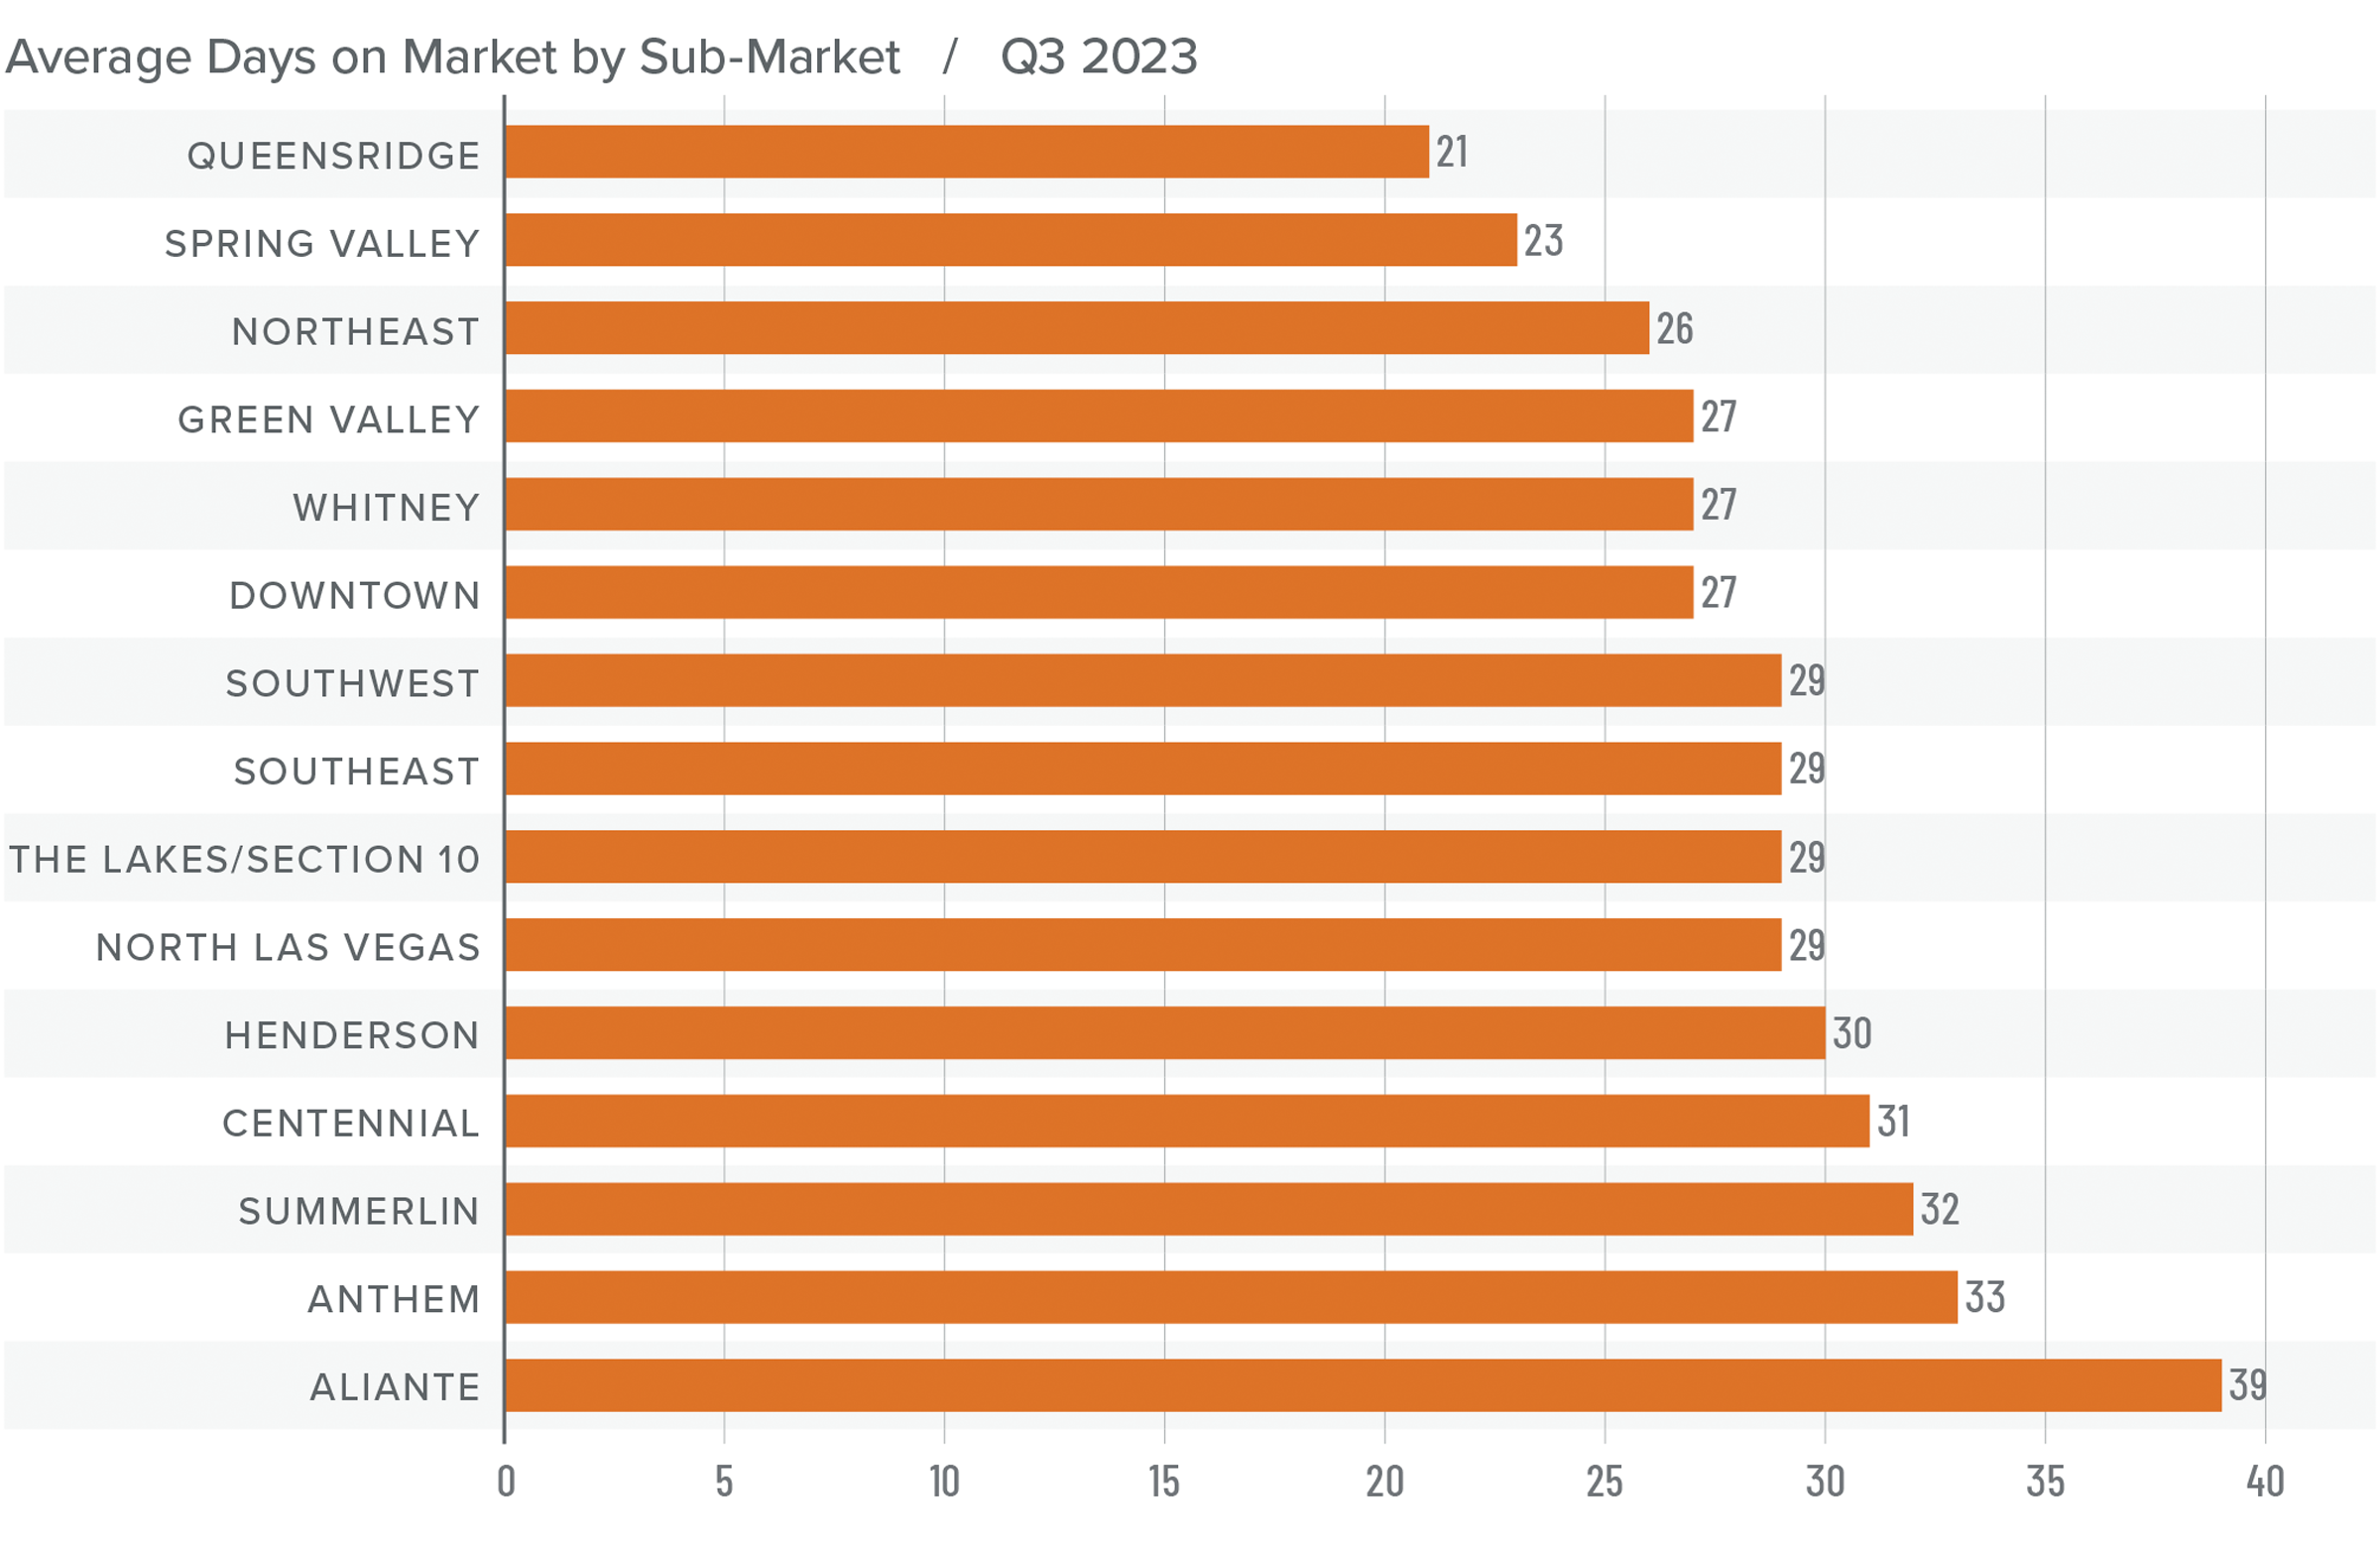
Nevada Days on Market
❱ The average time it took to sell a home in the region rose four days from the third quarter of 2022.
❱ It took an average of 29 days to sell a home in the third quarter, which was 13 fewer days than it took in the second quarter of 2023.
❱ Days on market rose in all neighborhoods except Queensridge and Spring Valley compared to the same period in 2022. However, average market time fell in every neighborhood compared to the second quarter of this year.
❱ Low inventory levels combined with buyers who were likely rushing to lock in mortgage rates that were still in the 6% range at the start of the quarter clearly created competitive market conditions.
Conclusions
This speedometer reflects the state of the region’s real estate market using housing inventory, price gains, home sales, interest rates, and larger economic factors.
With pending and closed sales lower than earlier in the year and list prices not rising, one might infer that the market is starting to shift in favor of home buyers, but it's uncertain this is the case.
In the second quarter market update it was suggested that the market was essentially in balance, albeit very slightly tilted toward sellers. Today, there is still a balance between buyers and sellers: limited inventory favors sellers, but lack of price growth favors home buyers (even if they are faced with significantly higher mortgage rates).
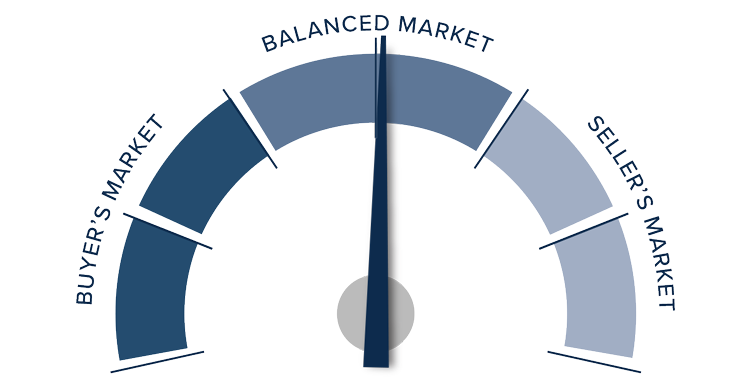
As such, the needle stays in the balanced quadrant, but it's moved from very modestly favoring sellers to a more neutral position.


")


