
 Facebook
 X
X
 Pinterest
 Copy Link
The following analysis of select counties of the greater Las Vegas real estate market is provided by Windermere Real Estate Chief Economist Matthew Gardner. We hope that this information may assist you with making better-informed real estate decisions. For further information about the housing market in your area, please don’t hesitate to contact your Windermere Real Estate agent.
Regional Economic Overview
Jobs continue to return to the Las Vegas market and the area has now recovered all but 13,100 of the 287,000 jobs that were lost during the pandemic. With almost 10,000 jobs added per month over the past year, I am hopeful that the area will return to preCOVID employment levels by spring. With rising employment, the jobless rate continues to drop. The latest data shows an unemployment rate of 5.3%, which is well below the pandemic-induced rate of 31.1%. If there is cause for concern, it is that the labor force remains at pre-pandemic levels. If employers are unable to find qualified workers, the pace of the job recovery may start to slow. As the country moves toward “post-COVID” life, I expect that leisure travel will continue to increase, which would be very good for a hospitality-driven market such as Las Vegas. This will certainly aid in the overall economic recovery in the region.
Nevada Home Sales
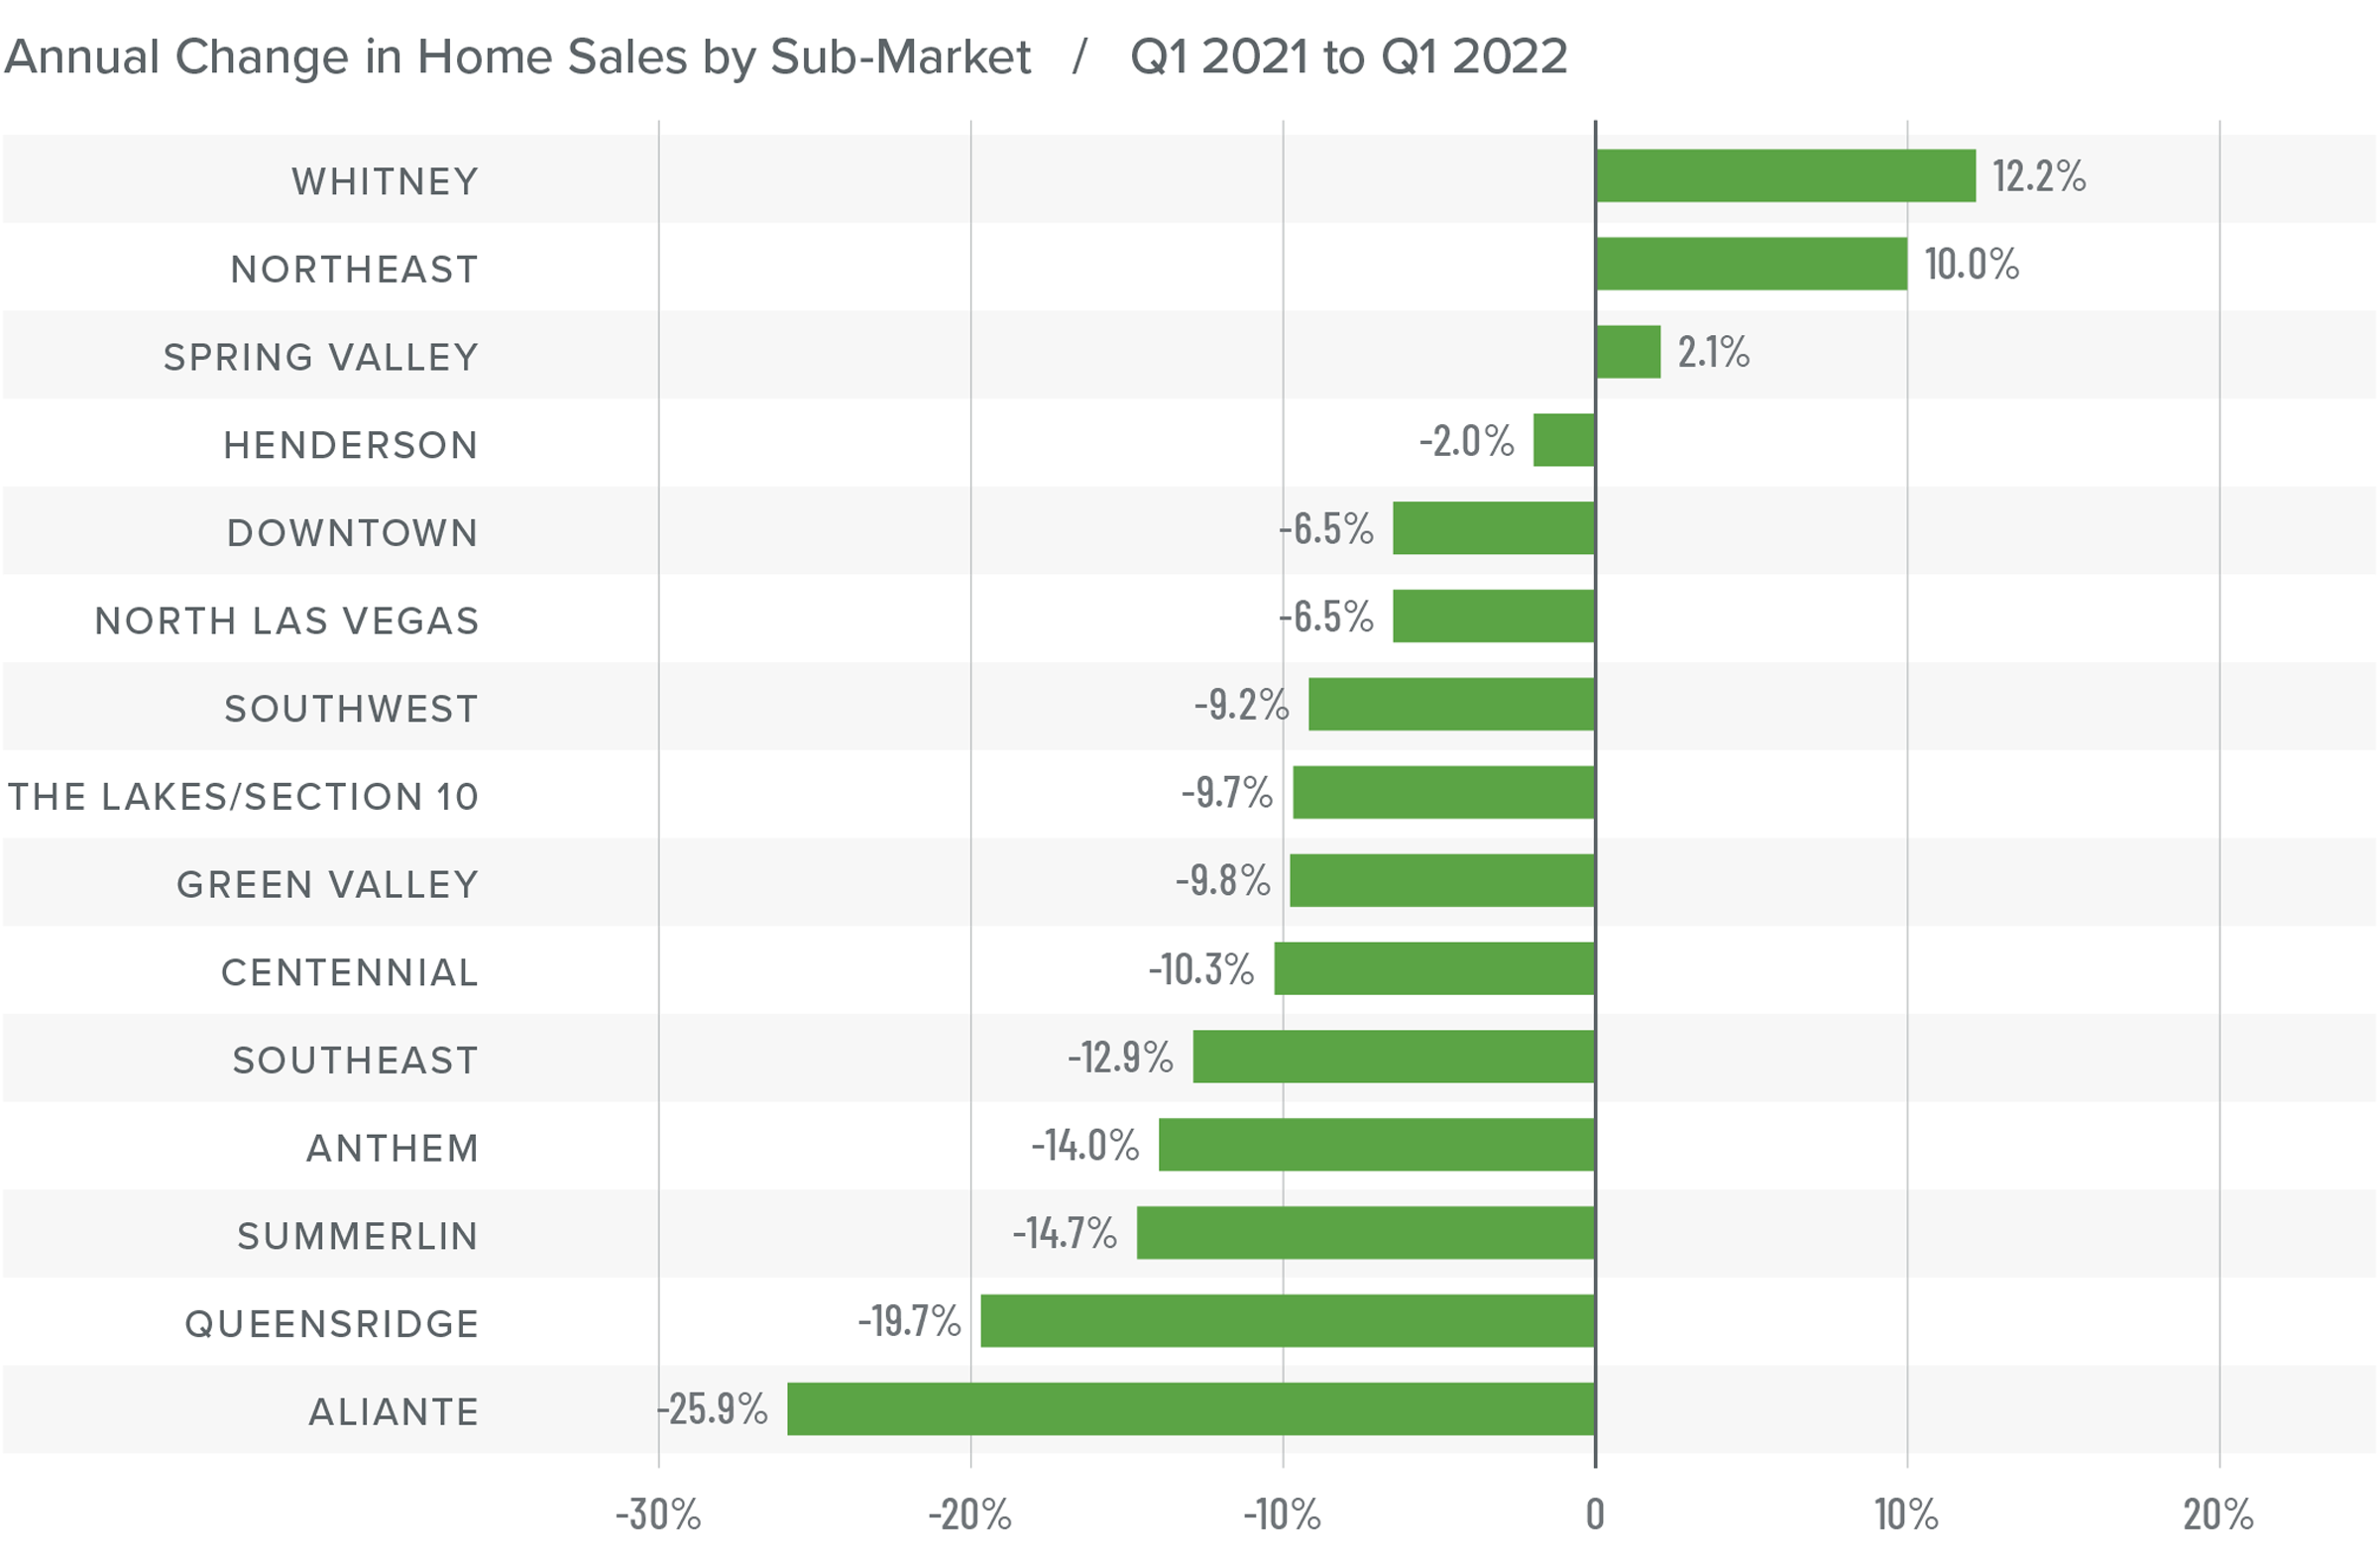
❱ A total of 9,122 homes sold in the first quarter of the year—a drop of 7.3% compared to the same period a year ago. Sales were 10.8% lower than in the fourth quarter of 2021.
❱ Sales rose in three of the neighborhoods contained in this report but dropped in all other areas compared to the first quarter of 2021. Compared to the previous quarter, all neighborhoods saw fewer sales.
❱ Supply constraints persist, which is limiting sales. The average number of homes for sale was down 20% year over year and down an even more substantial 31% compared to the final quarter of 2021.
❱ Pending sales, which are an indicator of future closings, increased 1.6% compared to the prior quarter, suggesting that closings in the second quarter of 2022 may show very slight improvement from the current numbers.
Nevada Home Prices
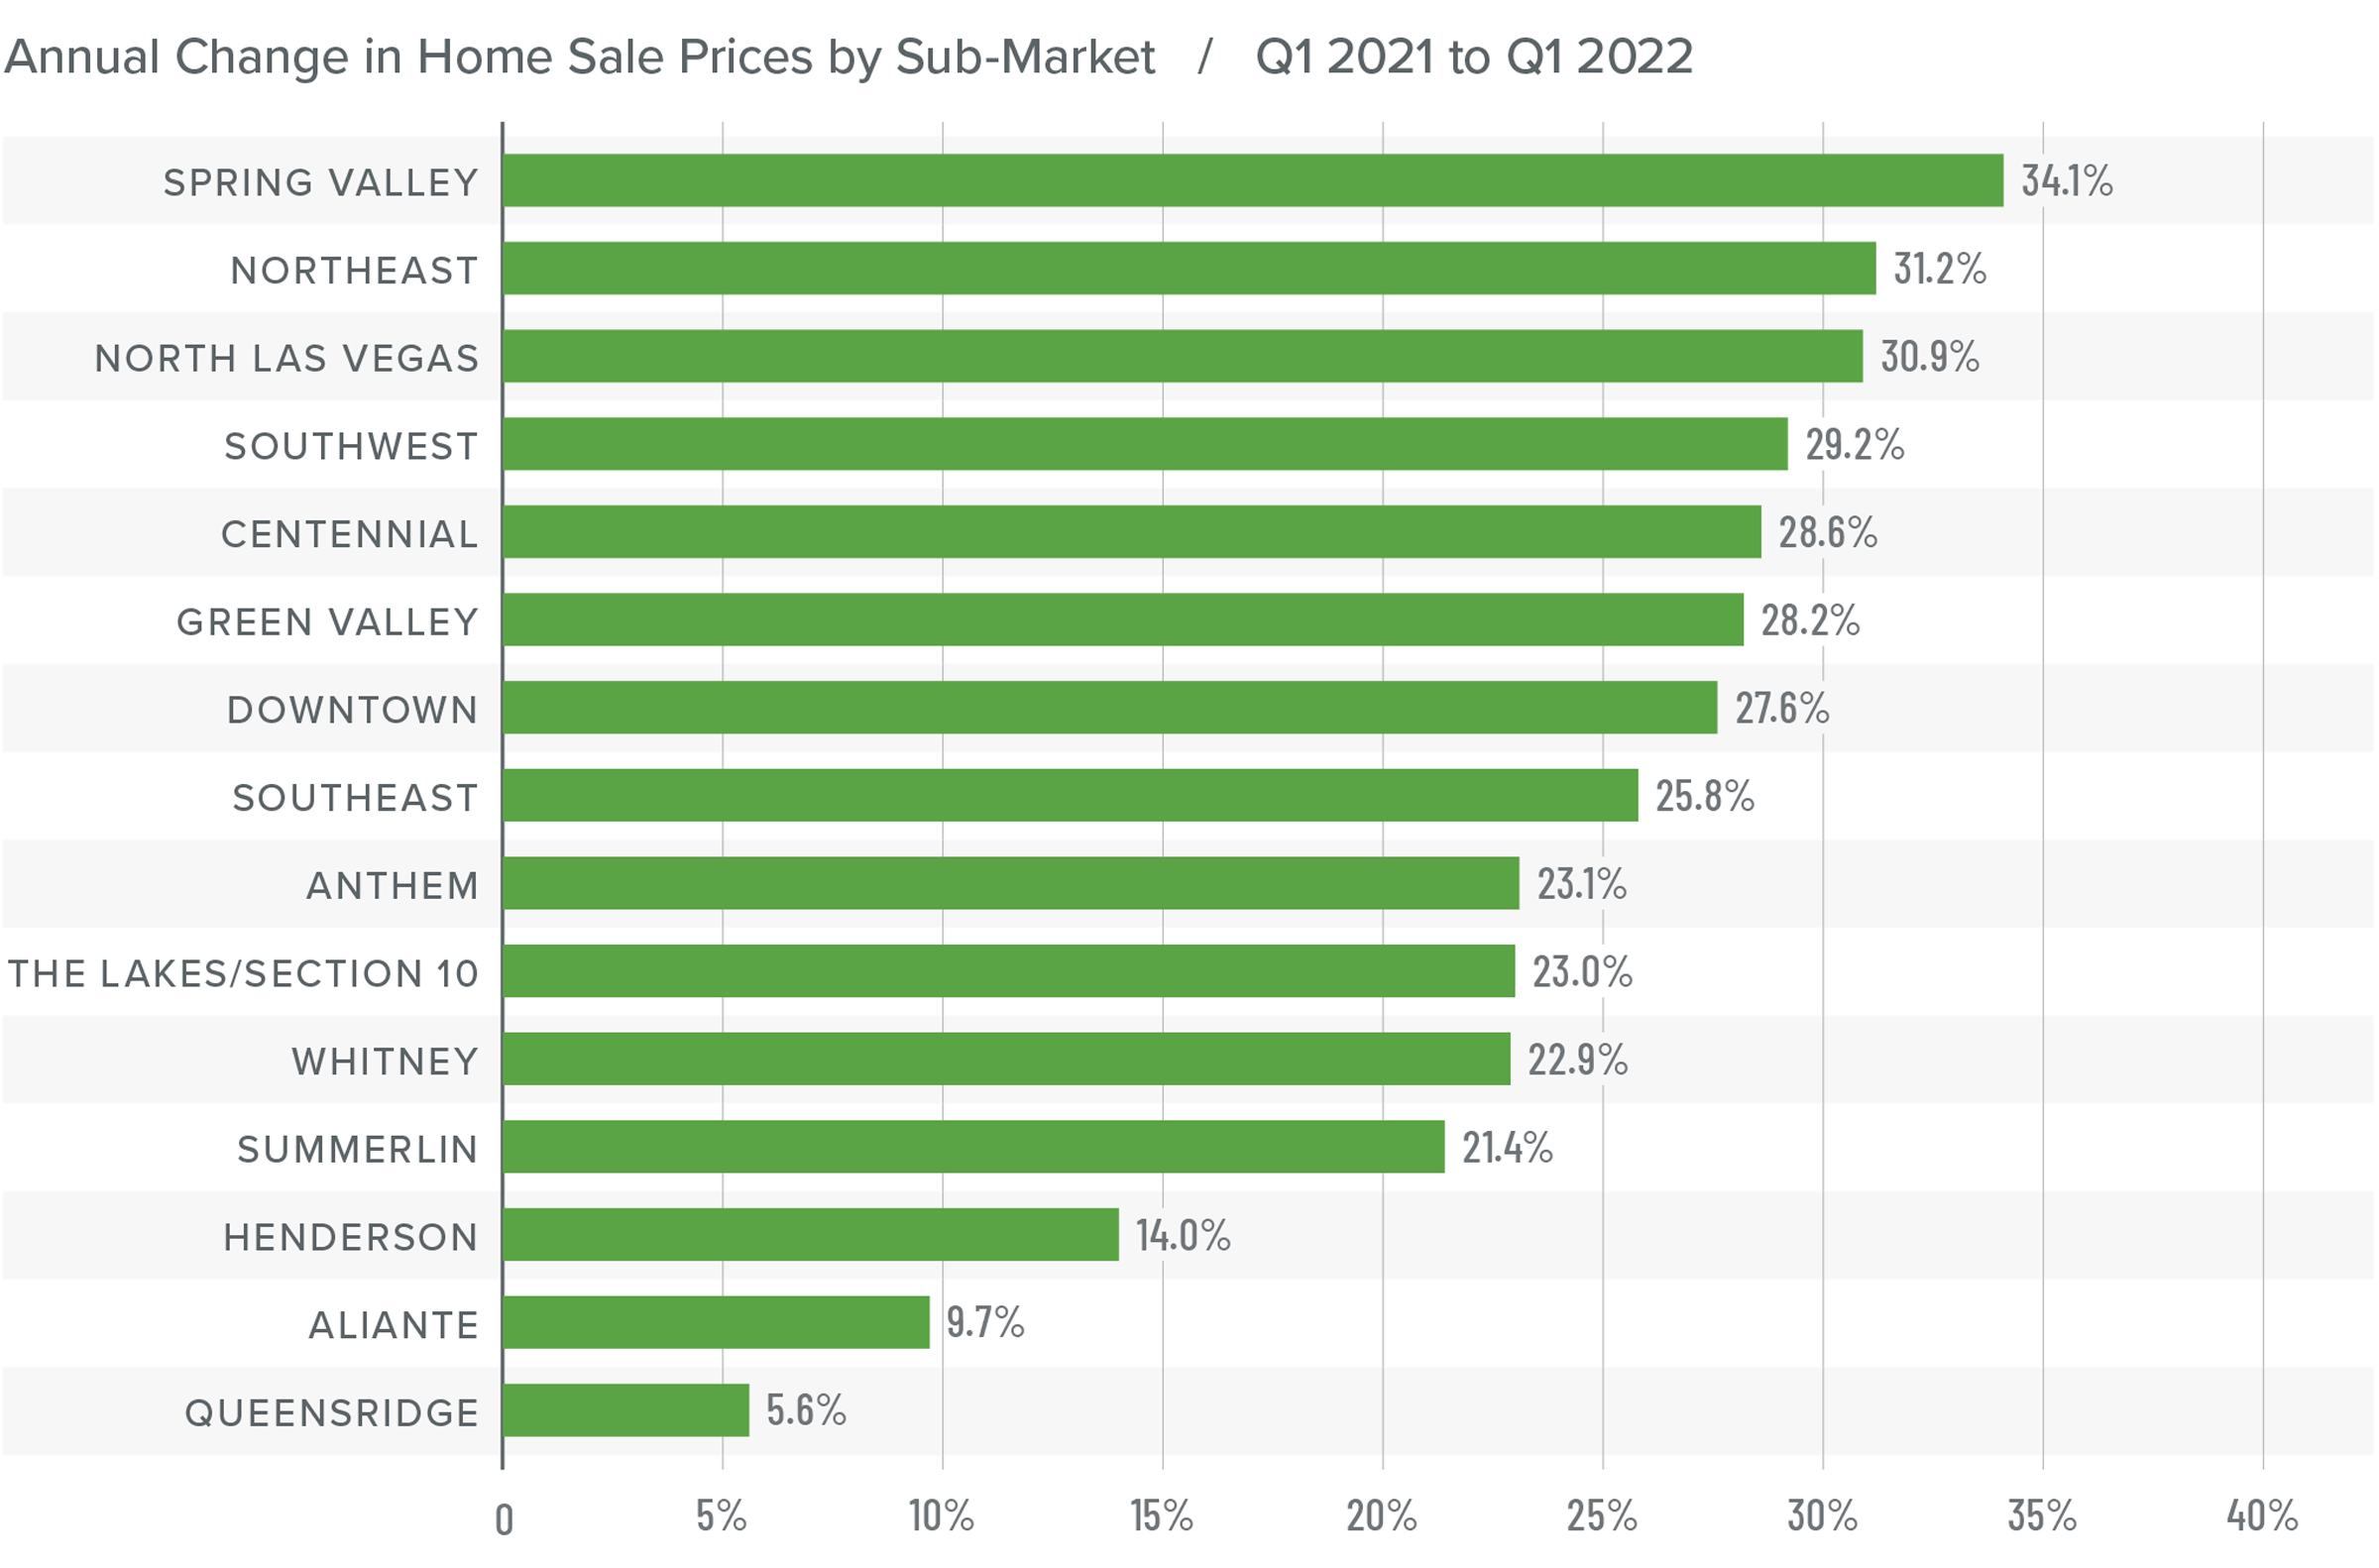
❱ Home prices rose 23% from a year ago to an average of $485,820 and were 5.8% higher than in the fourth quarter of 2021.
❱ I consider listing prices to be a leading indicator for shifts in the market. That they continue to trend higher suggests that sellers remain very confident that the market will be able to accommodate the higher financing costs buyers are facing.
❱ Prices rose by double digits in all but two neighborhoods compared to the same quarter last year and rose in all markets other than Aliante compared to the fourth quarter of 2021.
❱ The data suggests that rising mortgage rates have not impacted the market yet, but there is normally a lag between rising rates and any effect on prices or demand. The market clearly has more buyers than sellers, but it will be interesting to see if prices continue to rise at their current pace in the face of higher financing costs.
Mortgage Rates
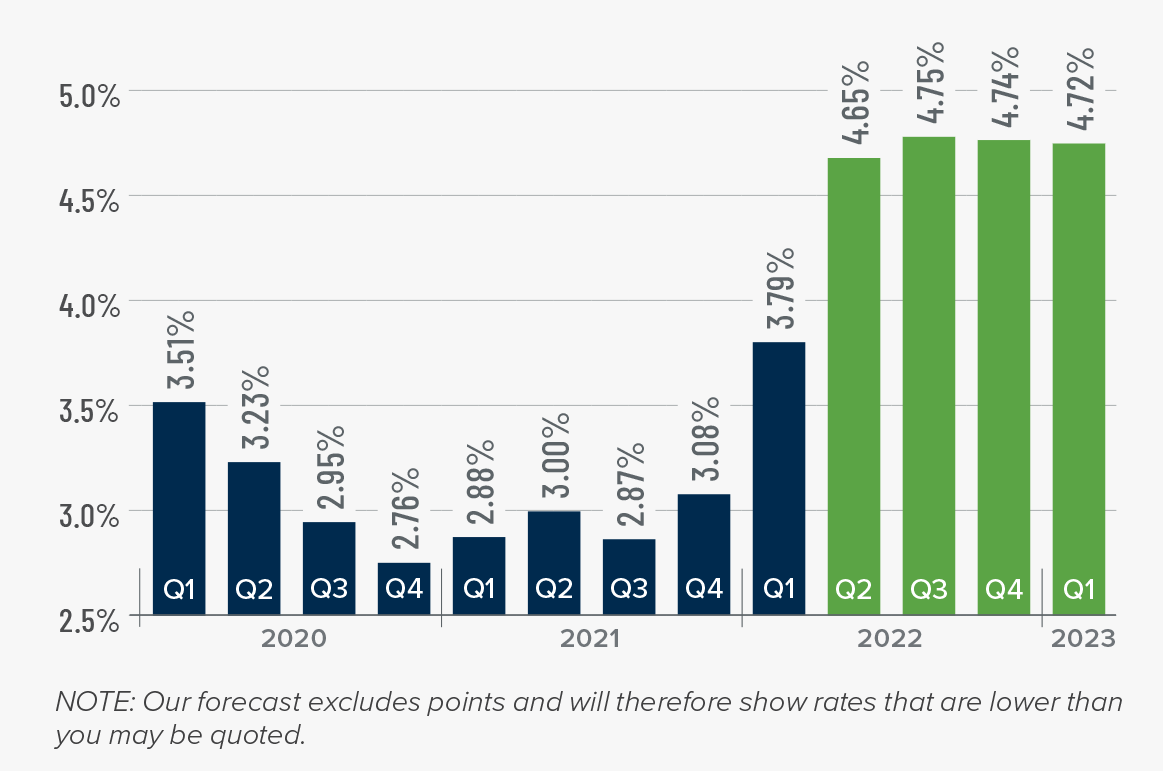
Average rates for a 30-year conforming mortgage were 3.11% at the end of 2021, but since then have jumped over 1.5%—the largest increase since 1987. The speed of the surge in rates is due to the market having quickly priced in the seven-to-eight rate increase that the Fed is expected to implement this year.
Because the mortgage market has priced this into the rates they are offering today, my forecast suggests that we are getting close to a ceiling in rates, and it is my belief that they will rise modestly in the second quarter before stabilizing for the balance of the year.
Nevada Days on Market
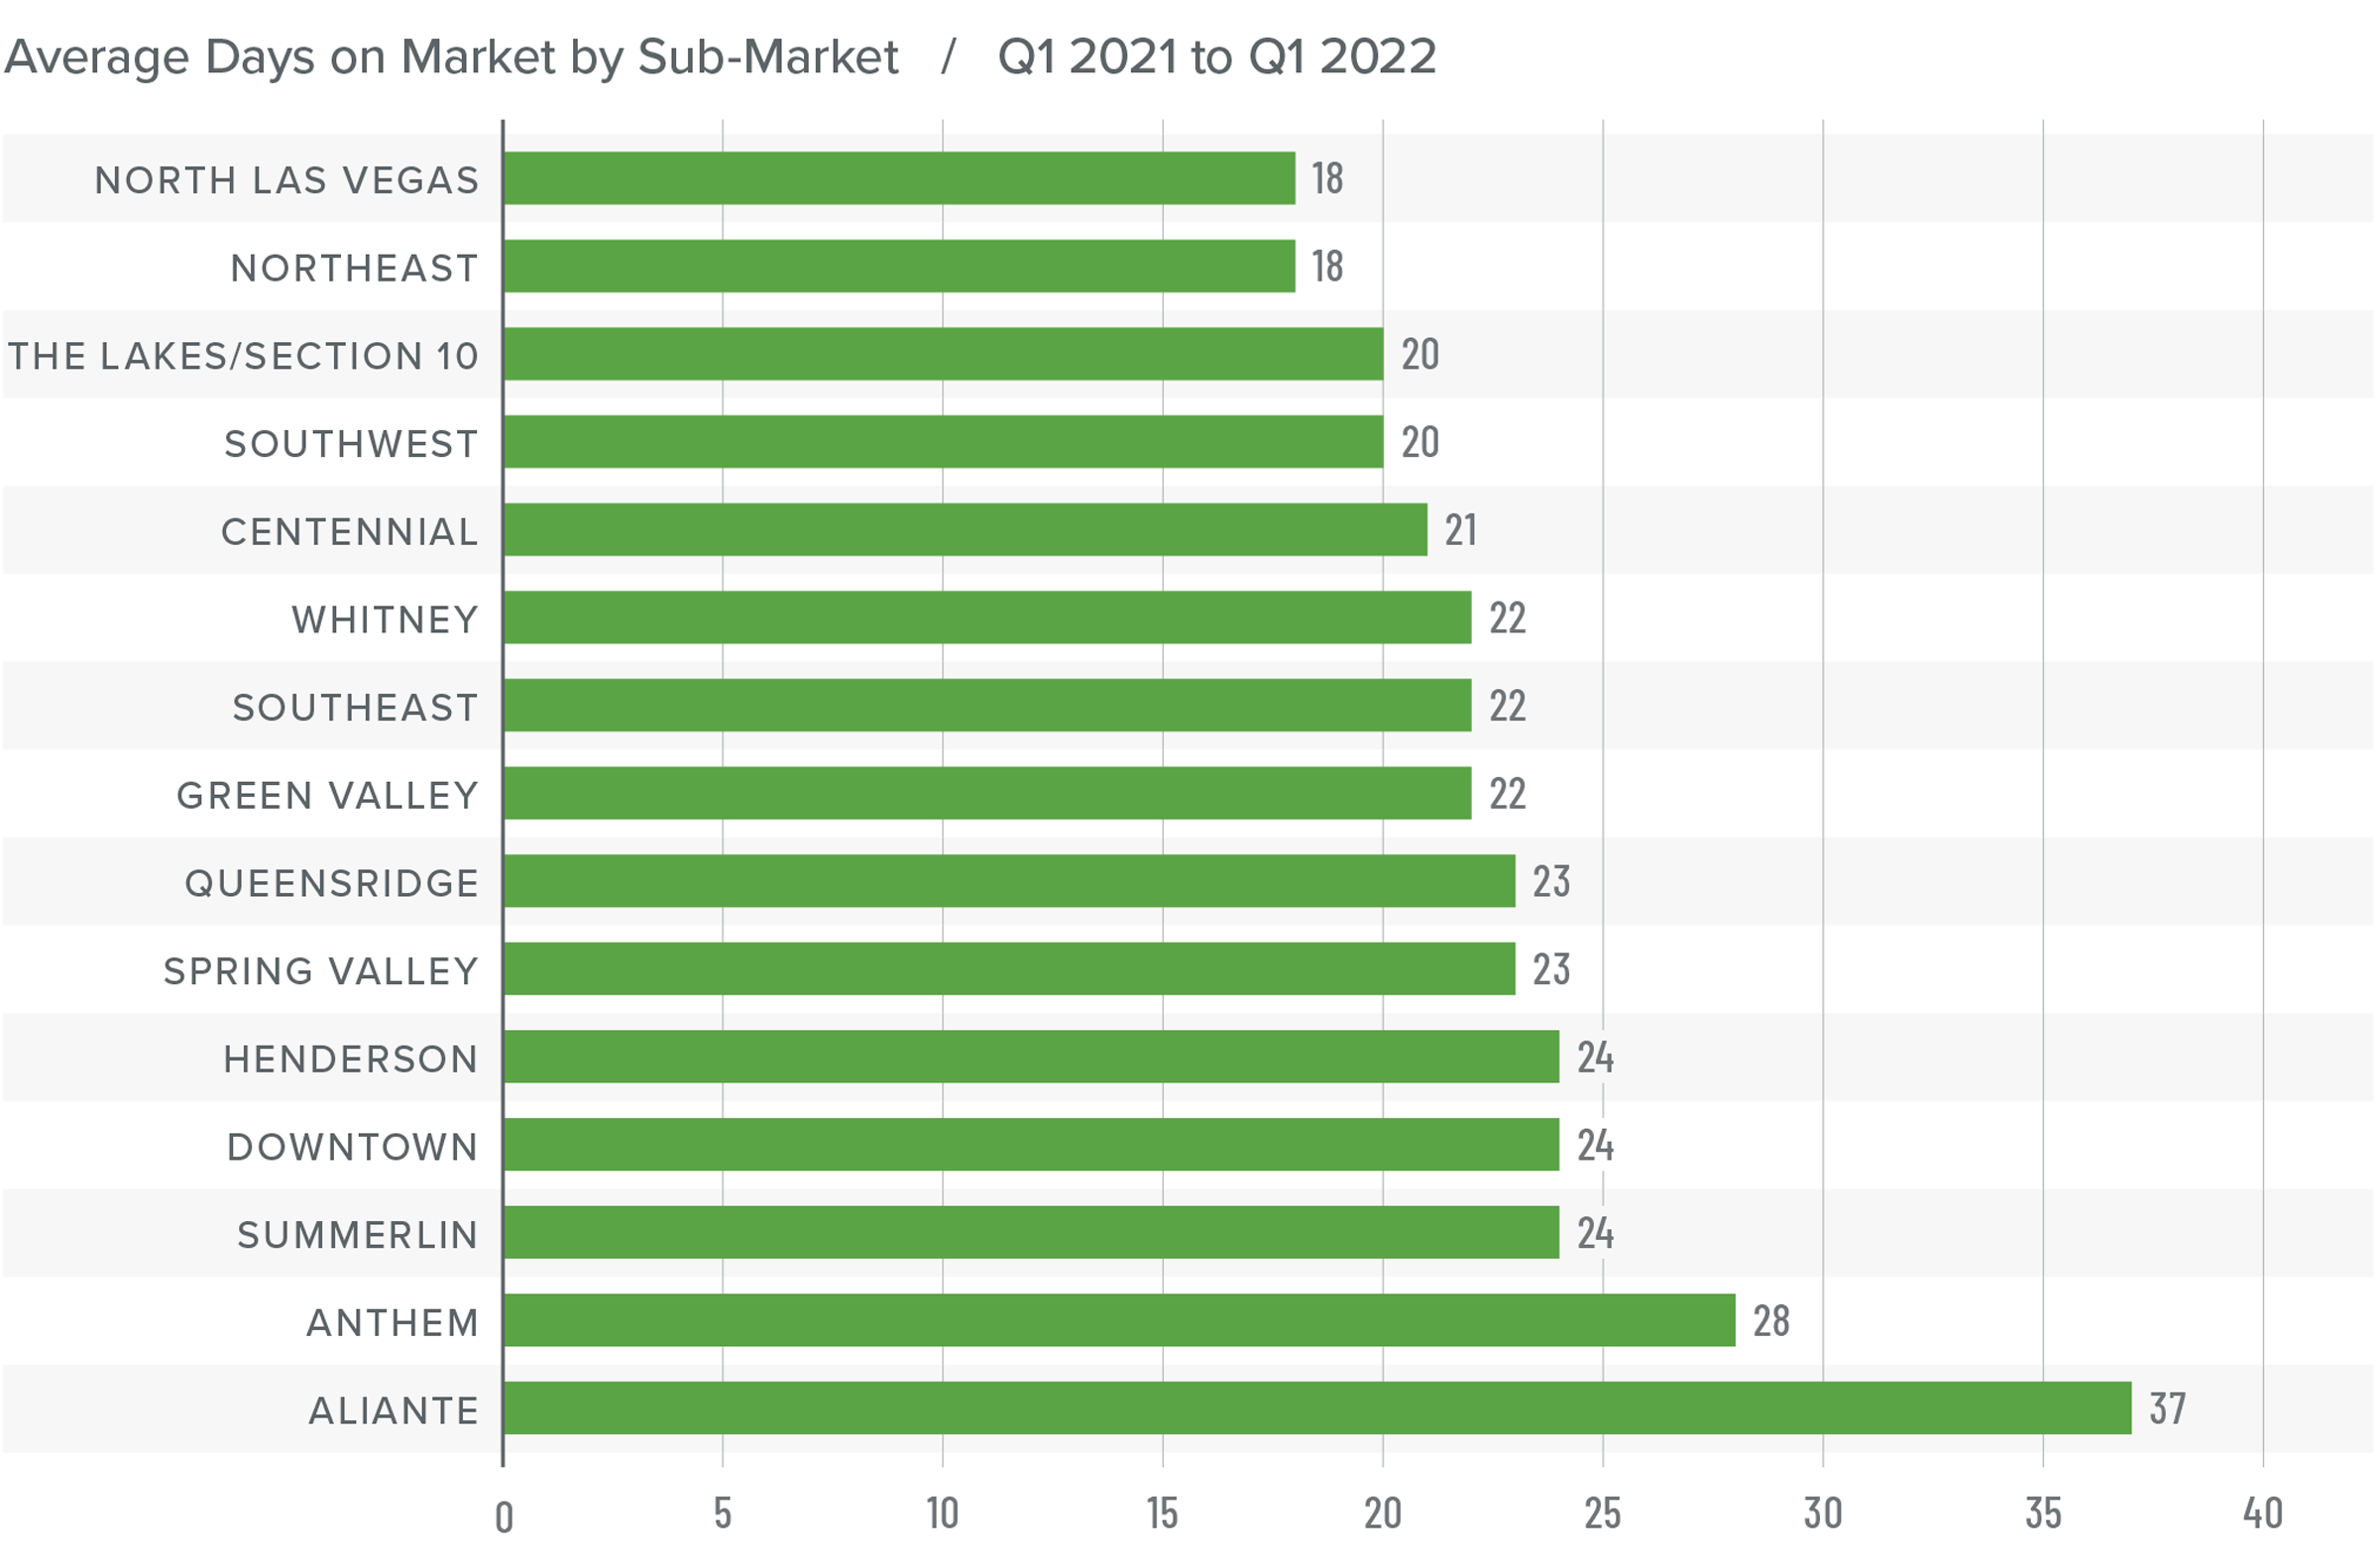
❱ The average time it took to sell a home in the region dropped 16 days compared to the first quarter of 2021.
❱ It took an average of 23 days to sell a home in the quarter, which matched the average market time in the fourth quarter of 2021.
❱ Days-on-market dropped across the board compared to a year ago, but rose in Aliante, The Lakes/Section 10, Southeast and Southwest Las Vegas, Spring Valley, and Northeast Las Vegas compared to the prior quarter.
❱ The greatest drop in market time was in The Lakes/ Section 10 neighborhood, where the length of time it took to sell a home fell 33 days compared to a year ago.
Conclusions
This speedometer reflects the state of the region’s real estate market using housing inventory, price gains, home sales, interest rates, and larger economic factors.
The local economy appears to be picking up momentum, which typically translates into demand for housing. As mentioned earlier, if there are impacts to sales or prices from rising mortgage rates, we will likely see signs of this in the next two quarters. With supply levels as low as they are, rising financing costs may not slow the market significantly. Housing affordability continues to fall as price growth rises. This, combined with higher mortgage rates, should temper the market, though it hasn’t yet. It might seem intuitive to move the needle a little toward home buyers, but the numbers don’t justify it.

All things considered, I have left the needle in the same position as the last quarter. There are too many uncertainties that preclude me from moving it one way or another. Hopefully the spring will provide more clarity.
About Matthew Gardner

As Chief Economist for Windermere Real Estate, Matthew Gardner is responsible for analyzing and interpreting economic data and its impact on the real estate market on both a local and national level. Matthew has over 30 years of professional experience both in the U.S. and U.K.
In addition to his day-to-day responsibilities, Matthew sits on the Washington State Governors Council of Economic Advisors; chairs the Board of Trustees at the Washington Center for Real Estate Research at the University of Washington; and is an Advisory Board Member at the Runstad Center for Real Estate Studies at the University of Washington where he also lectures in real estate economics.
")


