

The following analysis of select counties of the Utah real estate market is provided by Windermere Real Estate. We hope that this information may assist you with making better-informed real estate decisions. For further information about the housing market in your area, please don’t hesitate to contact your Windermere Real Estate agent.
Regional Economic Overview
After picking up in the second quarter of this year, year-over-year employment growth has pulled back again. Utah added 39,000 jobs over the past 12 months, which represents an annual growth rate of 2.3%. This is the lowest pace of job gains since the pandemic started. Job growth was led by the Salt Lake City metro area, where employment rose 2.7%. This was followed by the Ogden and Provo metro areas, where employment rose 2.4% and 1.7%, respectively.
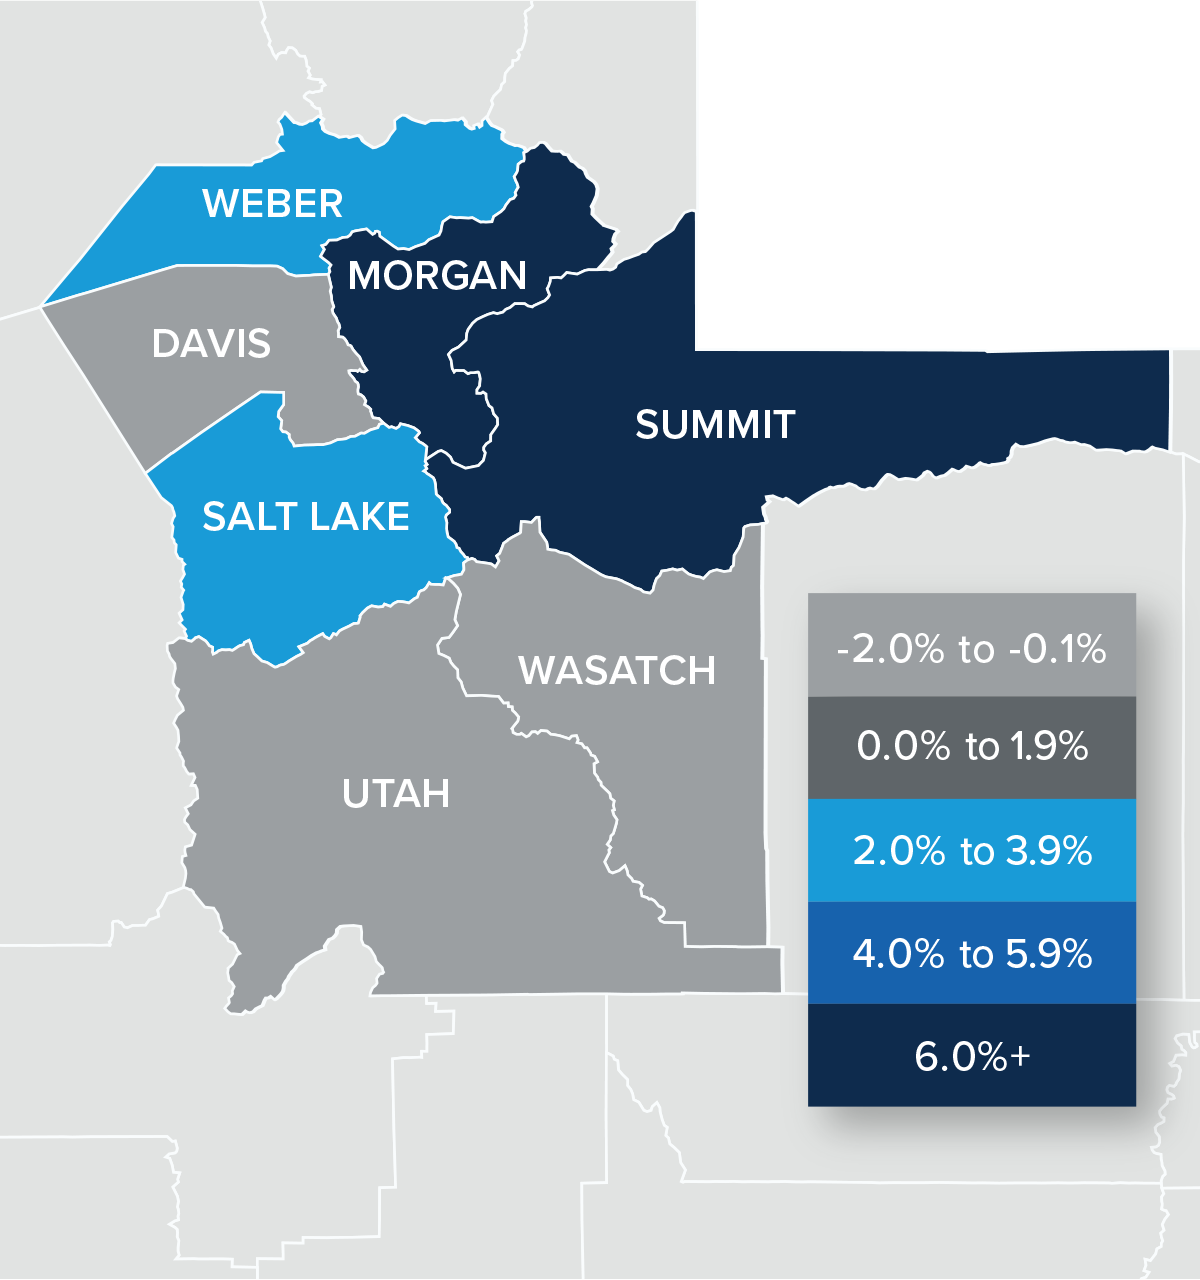
Utah’s unemployment rate in August was 2.5%, which is up .1% year over year. At the county level, the lowest jobless rate was in Morgan County (2.5%) and the highest was in Weber County, where 3.1% of the workforce were without jobs. In aggregate, the unemployment rate within the counties contained in this report was 3%.
Utah Home Sales
❱ In the third quarter of 2023, 6,675 homes sold in the areas covered by this report. This was down 9.5% compared to the third quarter of 2022 and was 5.7% lower than in the second quarter of this year.
❱ Although total sales volumes have fallen, they rose in Wasatch, Summit, and Morgan counties compared the third quarter of 2022. These same three counties also saw sales grow between the second and third quarters of this year.
❱ As sales volumes fell, listing activity rose 28.7% compared to the second quarter of 2023. Clearly, more choice in the market was not enough to tempt buyers who were also faced with significantly higher financing costs.
❱ Pending sales fell 8.9% from the second quarter, suggesting that closings in the fourth quarter may also be lackluster.

Utah Home Prices
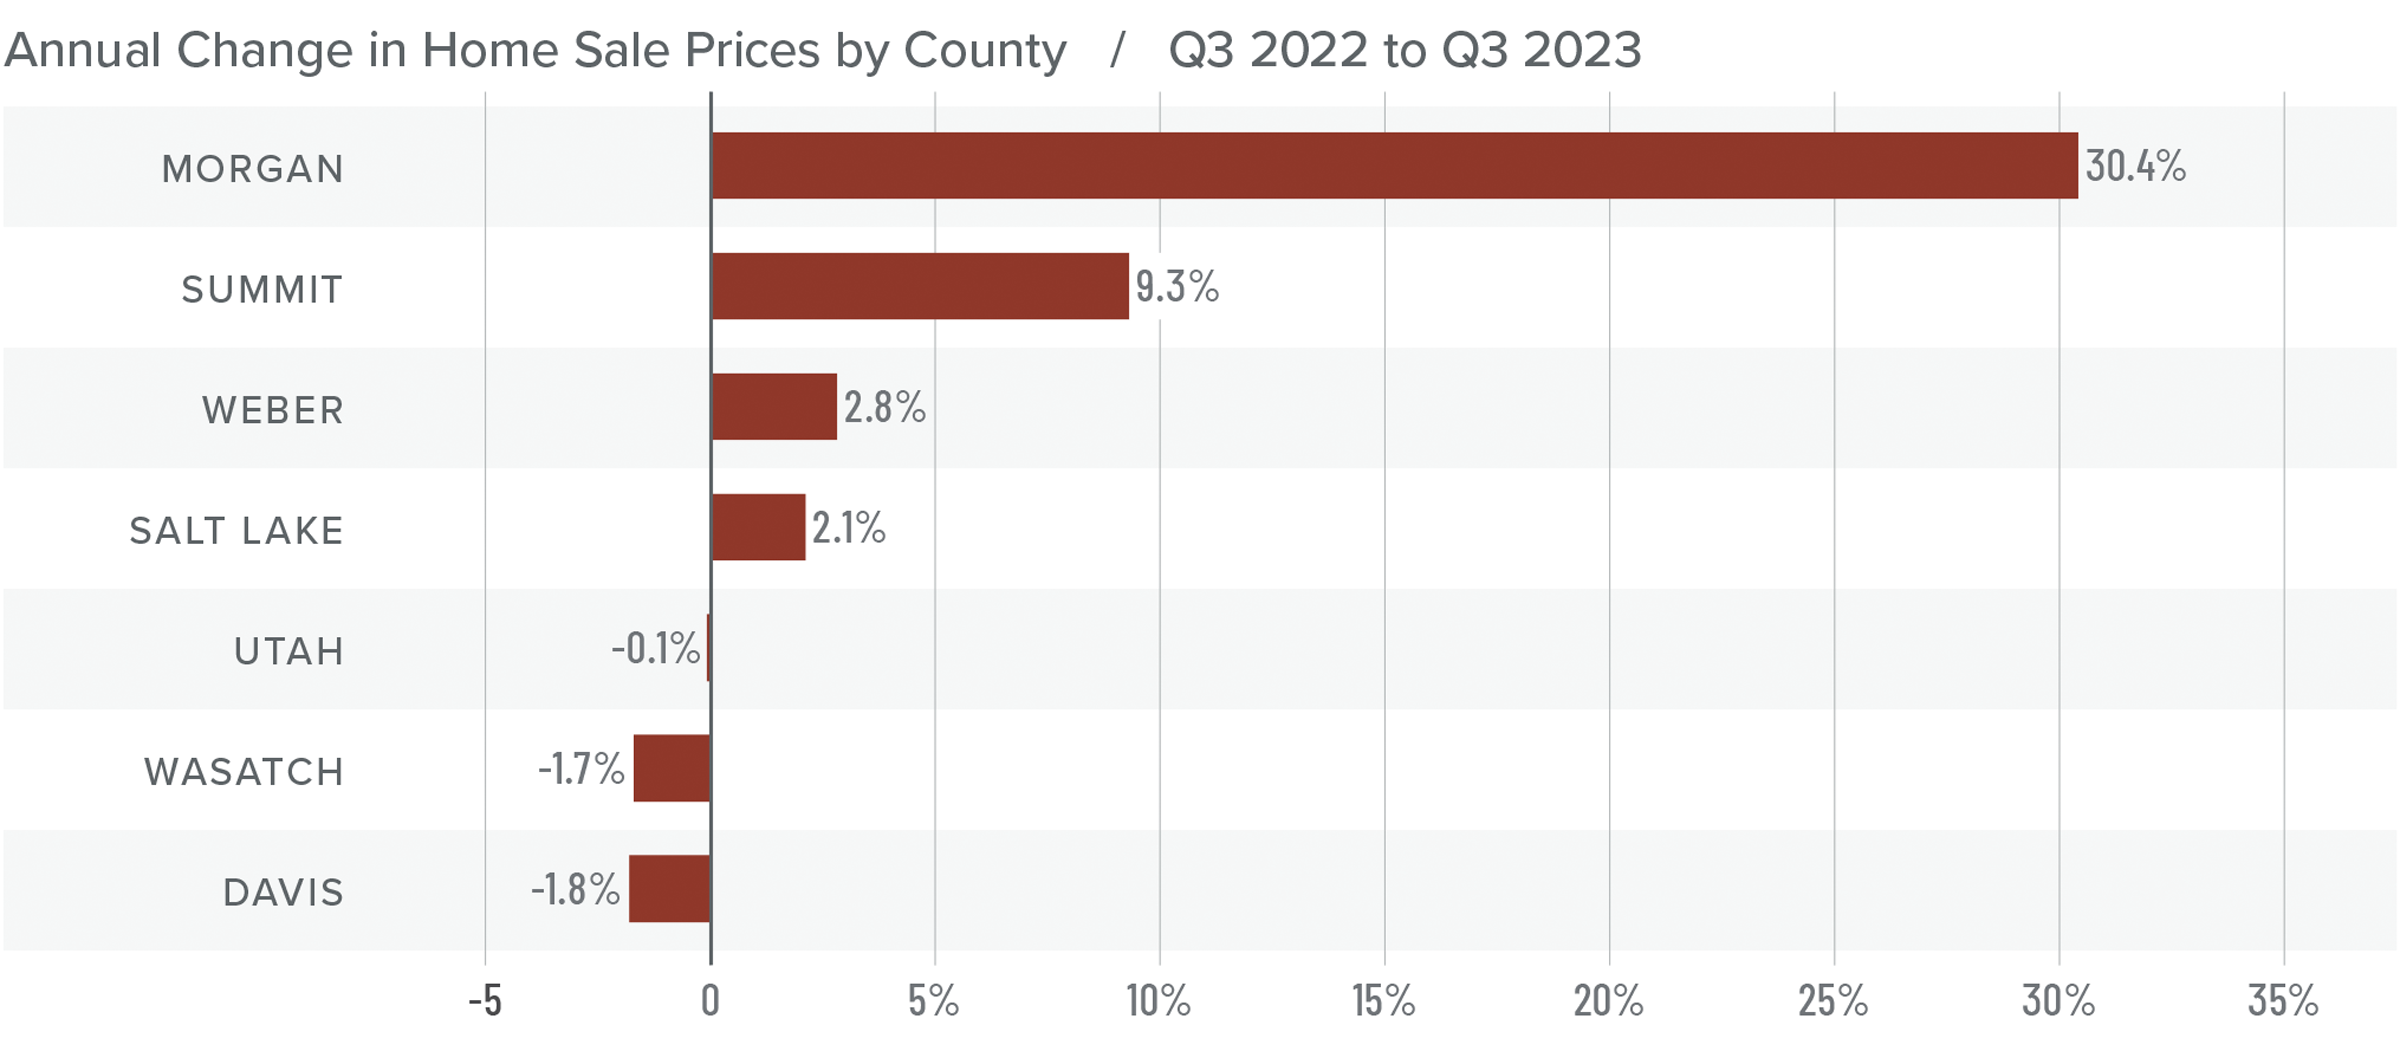
❱ The average sale price grew 4% from the same time in 2022 to $651,913. Prices were also 3.8% higher than in the second quarter of 2023.
❱ Regionally, median list prices in the third quarter were flat compared to the second quarter of the year. However, asking prices were higher in Wasatch, Summit, and Morgan counties.
❱ Year over year, prices rose in four counties but fell in three. With just 28 sales in the quarter, Morgan County had a significant price increase, but it’s such a small market that sizeable price swings are not unusual. Compared to the second quarter of 2023, prices rose in all counties except Davis and Summit, where prices fell 1.7% and 13.8%, respectively.
❱ Price growth has been slowing, which is to be expected given the significant rise in mortgage rates. I don’t expect to see much in the way of price growth for the balance of the year due to both higher financing costs and more choice in the market.
Mortgage Rates
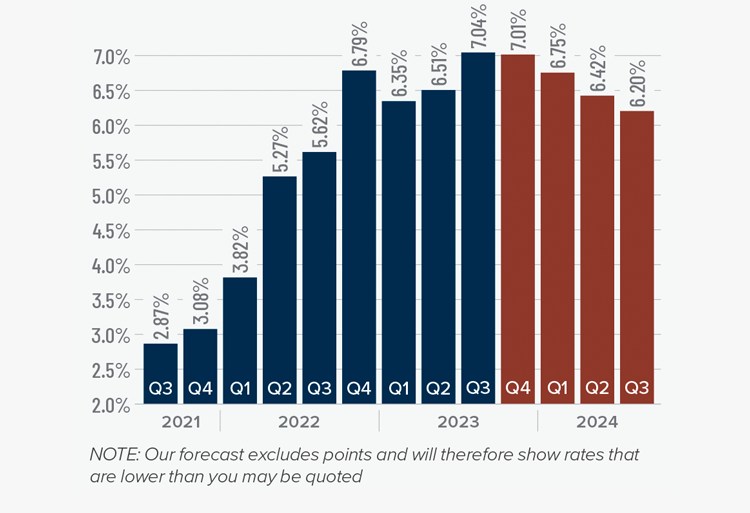
Mortgage rates continued trending higher in the third quarter of 2023 and are now at levels we have not seen since the fall of 2000. Mortgage rates are tied to the interest rate (yield) on 10-year treasuries, and they move in the opposite direction of the economy. Unfortunately for mortgage rates, the economy remains relatively buoyant, and though inflation is down significantly from its high, it is still elevated. These major factors and many minor ones are pushing Treasury yields higher, which is pushing mortgage rates up. Given the current position of the Federal Reserve, which intends to keep rates “higher for longer,” it is unlikely that home buyers will get much reprieve when it comes to borrowing costs any time soon.
With such a persistently positive economy, I have had to revise my forecast yet again. I now believe rates will hold at current levels before starting to trend down in the spring of next year.
Utah Days on Market
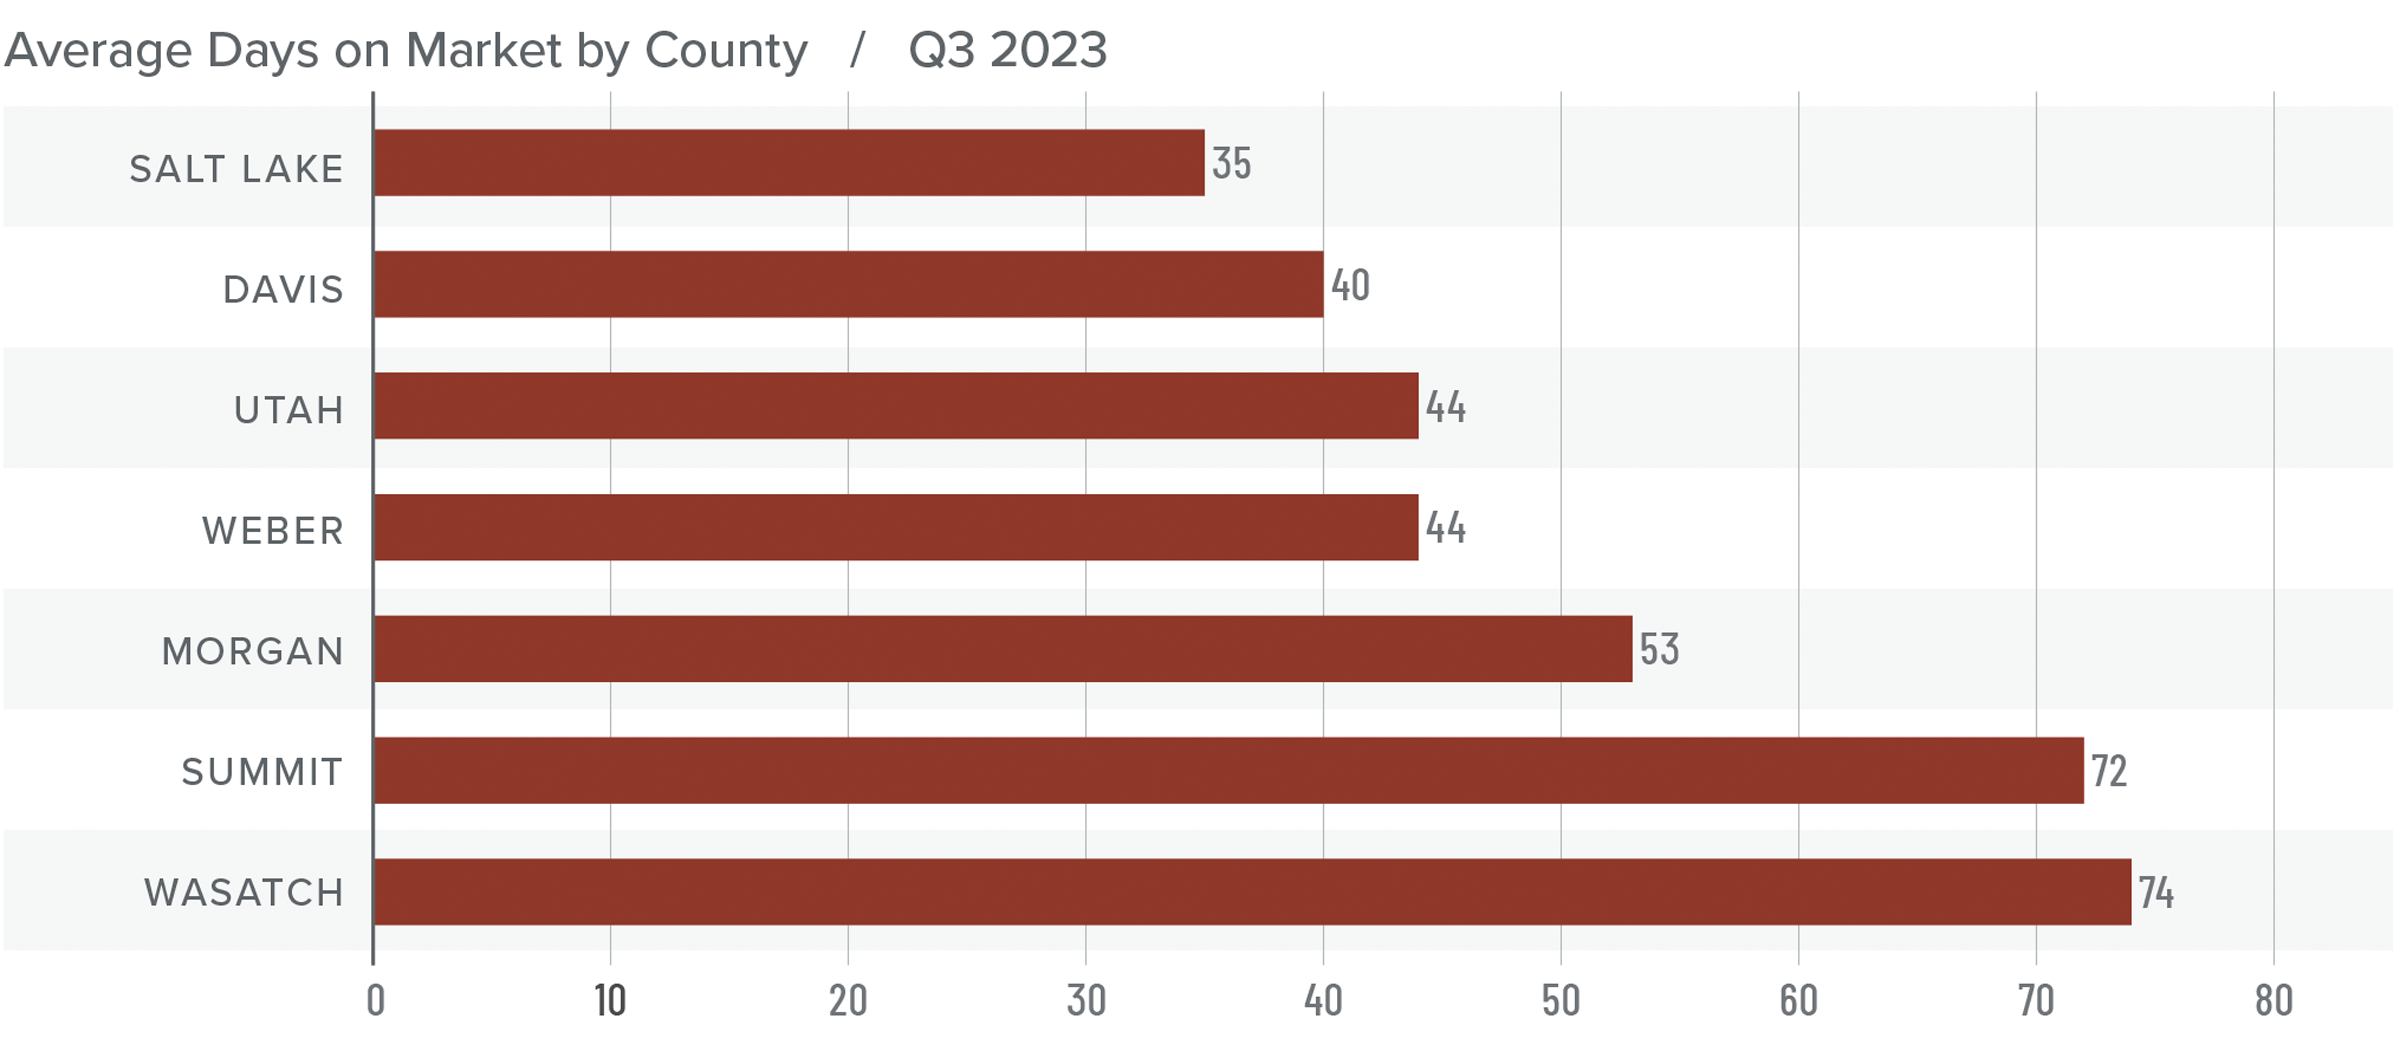
❱ The average time it took to sell a home in the counties covered by this report rose 17 days compared to the same period in 2022.
❱ Homes sold fastest in Salt Lake County; Wasatch County was the slowest. All areas saw market time rise compared to the third quarter of 2022, but all counties except Wasatch saw market time fall compared to the second quarter of this year.
❱ During the third quarter, it took an average of 52 days to sell a home. Market time fell three days compared to the second quarter of 2023.
❱ Even when faced with more inventory and higher financing costs, it was impressive to see the length of time it took to sell a home in the region fall, albeit modestly, from the second quarter.
Conclusions
This speedometer reflects the state of the region’s real estate market using housing inventory, price gains, home sales, interest rates, and larger economic factors.
The region saw average market time fall even though the number of available homes rose, which should favor home sellers. That said, closed and pending sales fell, and list price growth was flat.
This suggests that the market is lacking direction, which is to be expected given that mortgage rates are at their highest level in over 20 years. Current buyers are likely weighing whether interest rates will come down and, if they do, how long they’ll have to wait to refinance out of a loan with a rate well above seven percent.
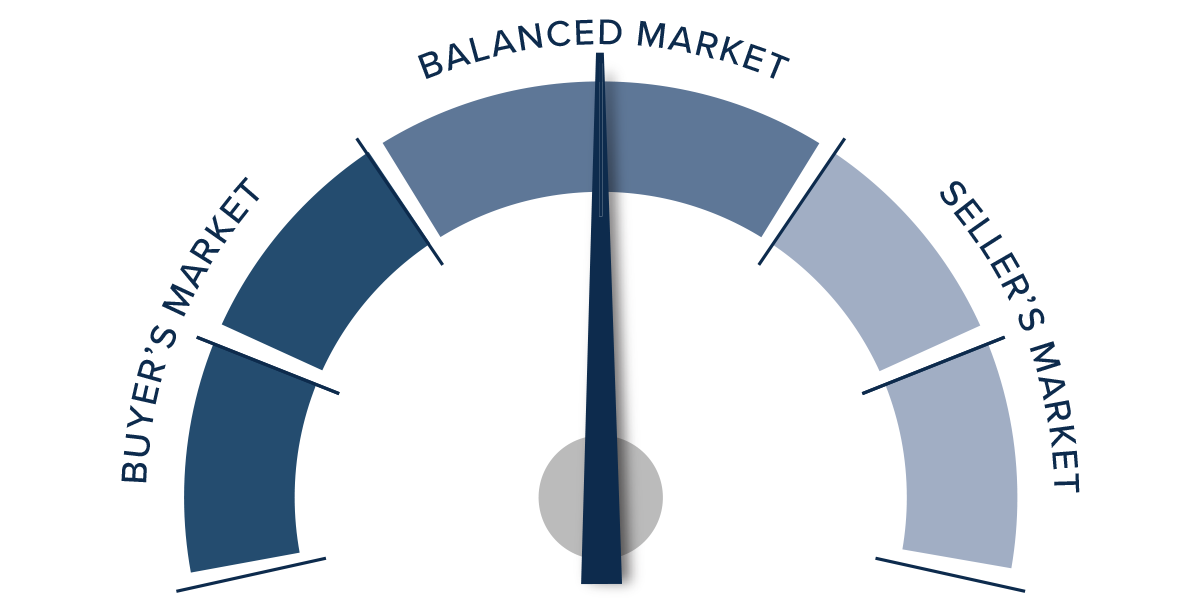
Inventory growth and mortgage rates aside, the market has seen a very significant runup in prices since the start of the pandemic, so it wouldn’t surprise me if both prices and sales remain fairly static for the balance of the year.
As such, the needle moves more toward the middle, with neither buyers nor sellers really having the upper hand.


")


