

The following analysis of select counties of the Southern California real estate market is provided by Windermere Real Estate. We hope that this information may assist you with making better-informed real estate decisions. For further information about the housing market in your area, please don’t hesitate to contact your Windermere Real Estate agent.
Regional Economic Overview
The Southern California market areas contained in this report have been experiencing a fairly significant slowdown in job growth. That said, the region has added 164,700 jobs since the third quarter of 2022, representing a growth rate of 1.7%. The end of the writers’ strike will add a little boost to the Los Angeles area, which has still added over 89,000 jobs over the past 12 months. Orange County employment has grown by 34,100 jobs; San Diego County is higher by 31,400; and employment was up 9,700 jobs in Riverside.
The region’s unemployment rate in August was 5.2%, which was up from 4.2% in the third quarter of 2022. The lowest jobless rate was in San Diego County, where it was 4.3%. The highest rate was in Los Angeles County, where 5.8% of the workforce was without a job.
Southern California Home Sales
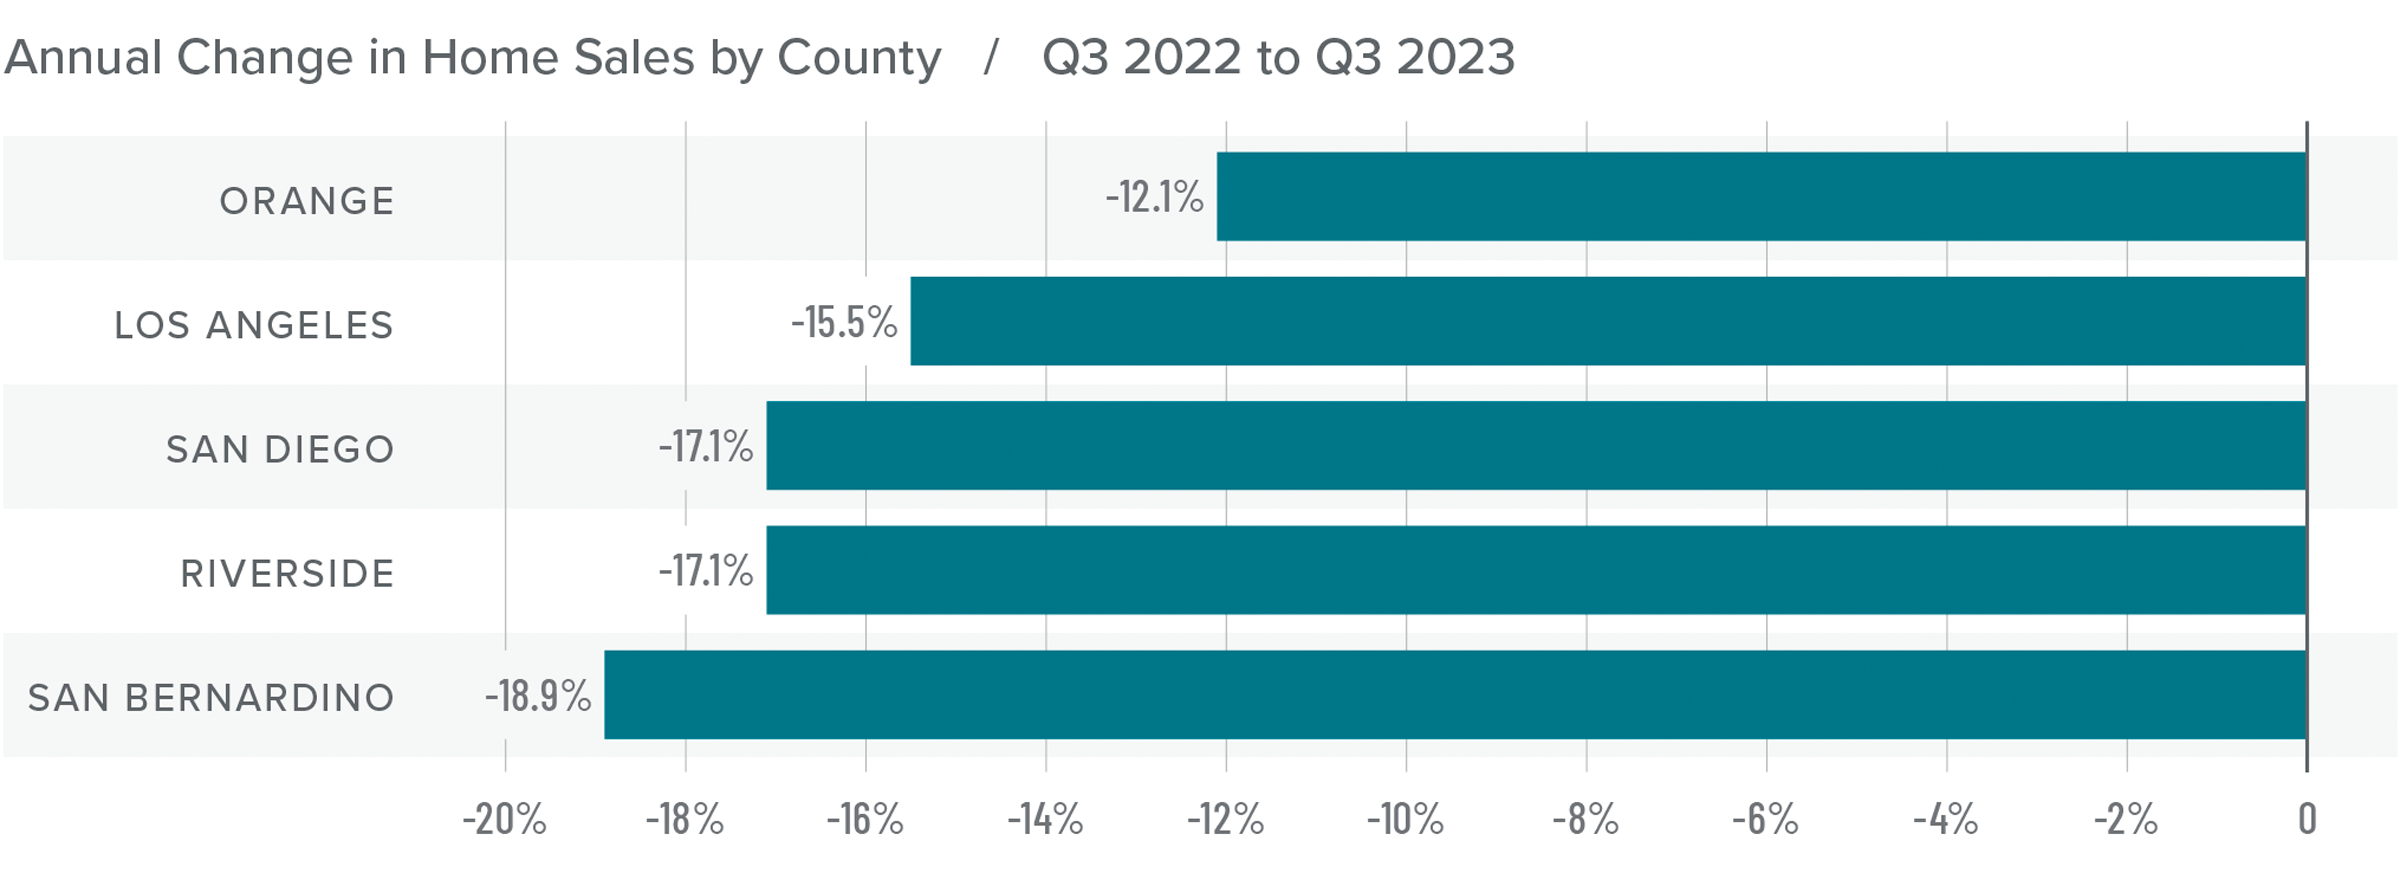
❱ In the third quarter of 2023, 32,398 homes sold, which was 16% lower than in the third quarter of 2022 and down 8.6% compared to the second quarter of this year.
❱ Pending home sales, which are an indicator of future closings, were 8.2% lower than in the second quarter, suggesting that closing numbers may be down in the final quarter of 2023.
❱ Compared to the third quarter of 2022, sales fell the most in San Bernardino County, though there was a significant decline in all markets. The quarter-over-quarter decline was disconcerting given that the number of homes for sale rose more than 14%. Rising mortgage rates are clearly taking their toll on the market.
❱ It’s discouraging that there were fewer sales despite rising inventory levels. Mortgage rates are definitely hobbling the market and until they start to drop, I think things will continue to be lackluster. List prices have started to pull back in response, as sellers realize that the market is not what it once was.
Southern California Home Prices
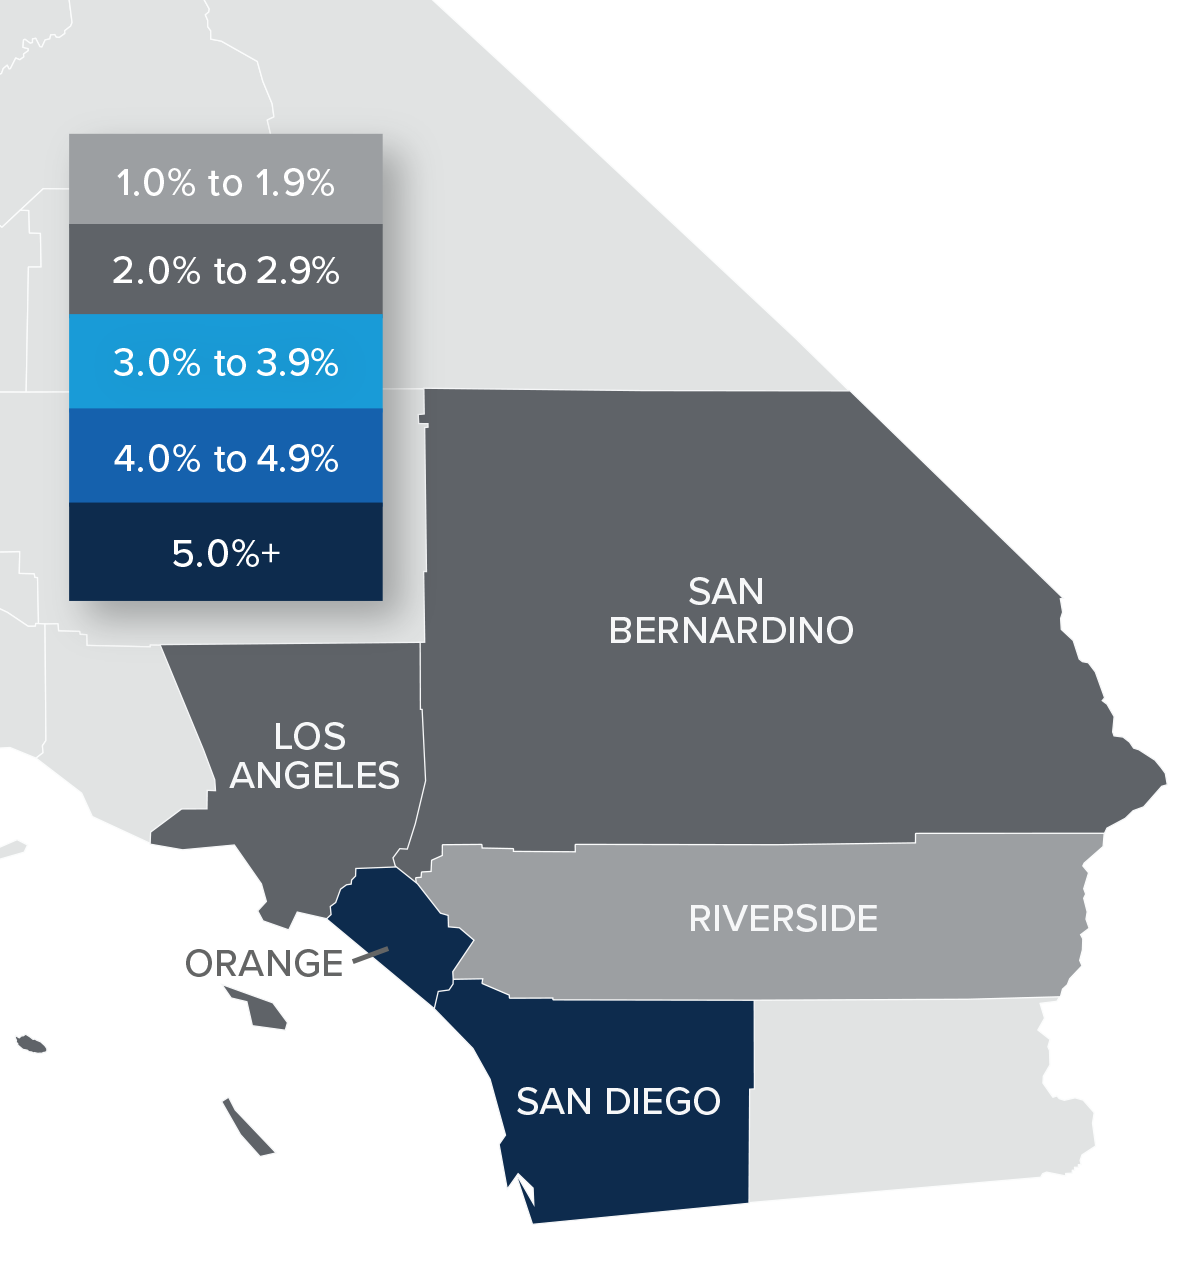
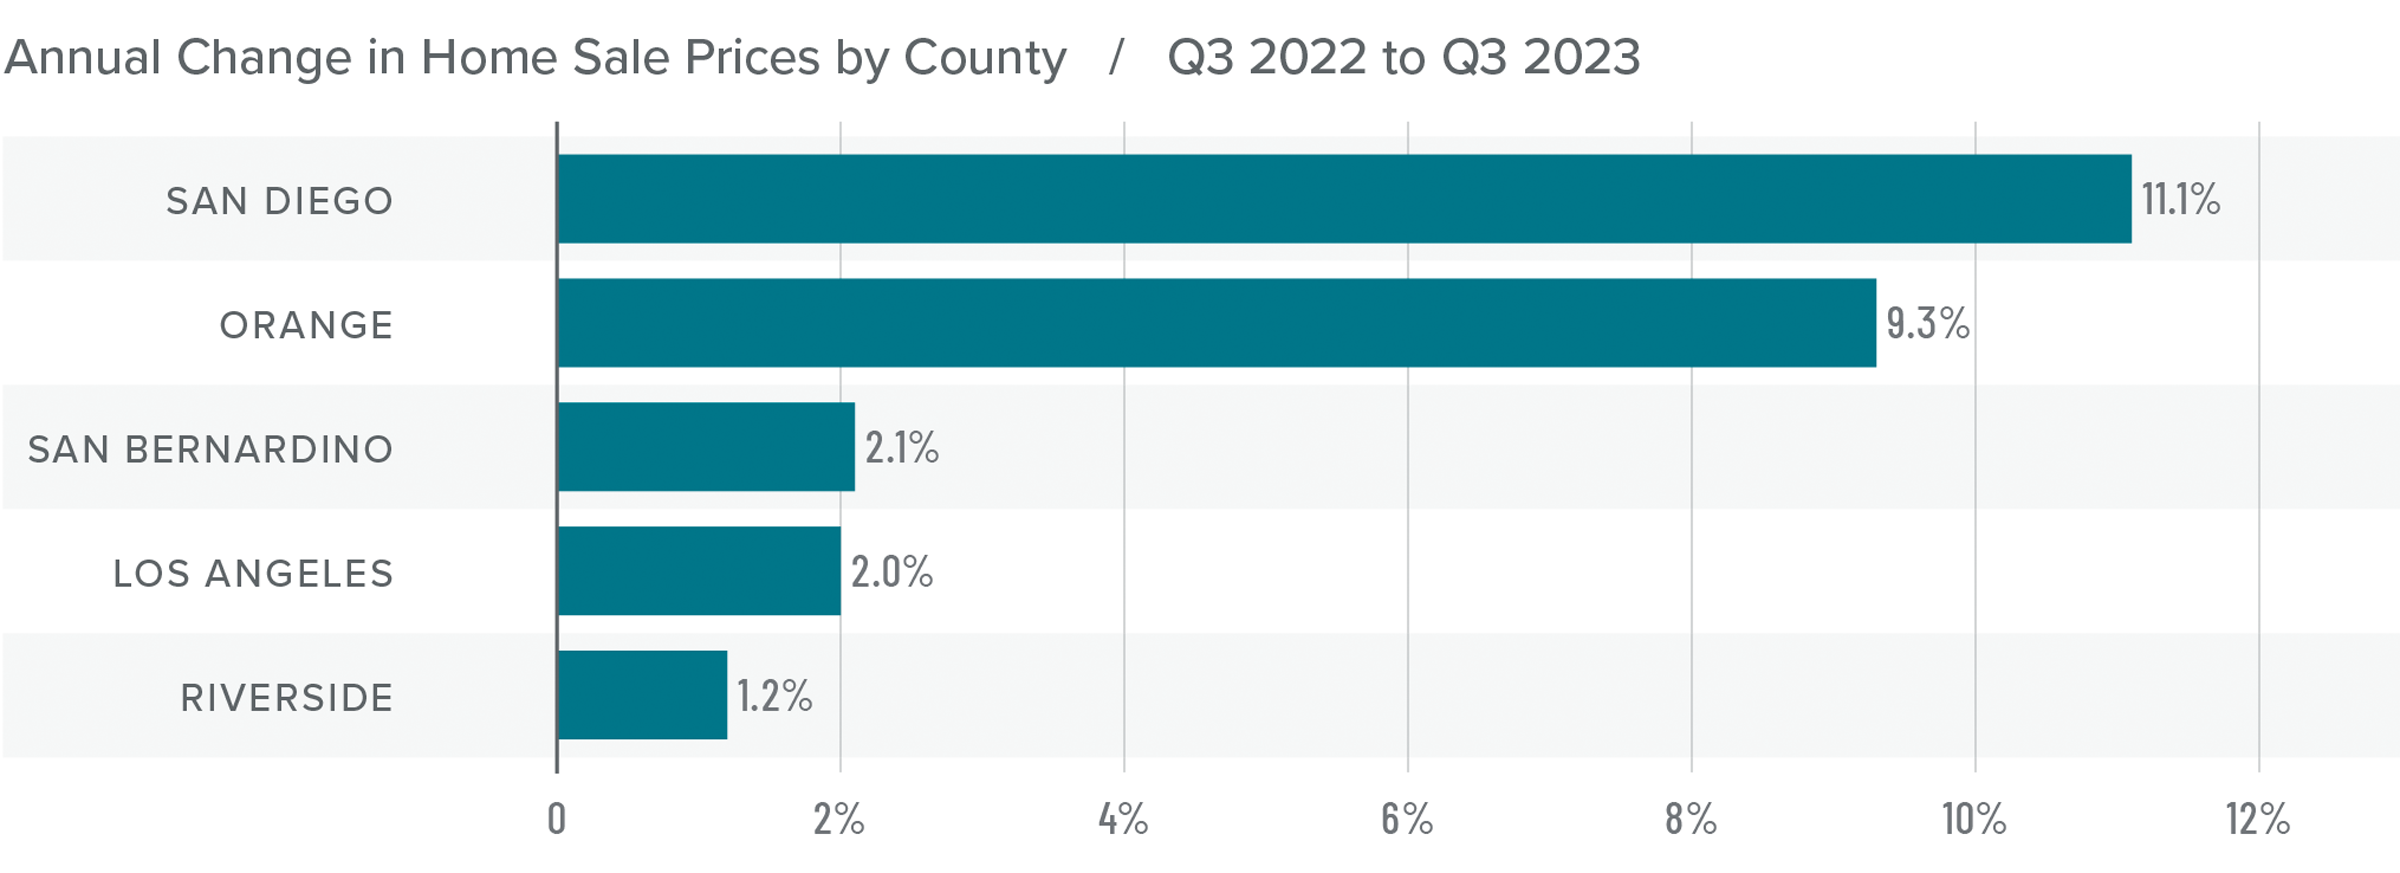
❱ Home sale prices were up 5.7% from the third quarter of 2022 and were 3.8% higher than in the second quarter of 2023.
❱ Affordability continues to be a major constraint in the region, which is being magnified by persistently high mortgage rates. Prices are holding, but growth has slowed significantly.
❱ Year over year, prices rose in all the markets contained in this report, with significant increases in San Diego and Orange counties. Compared to the second quarter of 2023, Riverside County saw prices fall by 5.8%, but they rose in the balance of the market areas.
❱ I expect price growth in Southern California to hold at or near the current pace. However, it’s very possible that home sale prices could drop a little if list prices fall further.
Mortgage Rates
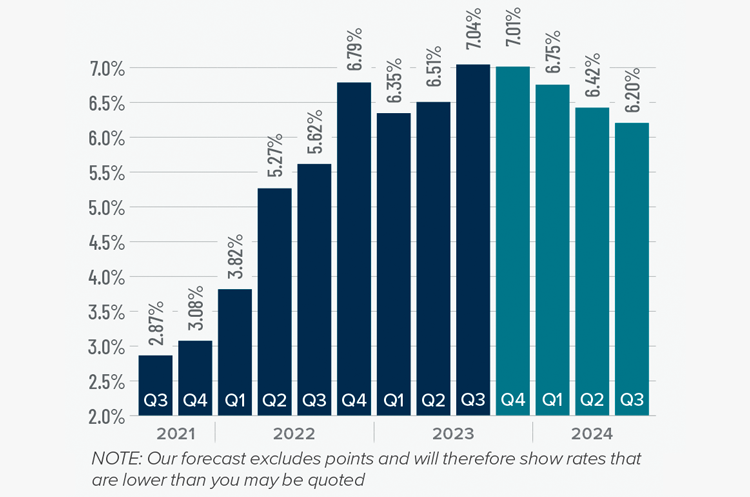
Mortgage rates continued trending higher in the third quarter of 2023 and are now at levels we have not seen since the fall of 2000. Mortgage rates are tied to the interest rate (yield) on 10-year treasuries, and they move in the opposite direction of the economy. Unfortunately for mortgage rates, the economy remains relatively buoyant, and though inflation is down significantly from its high, it is still elevated. These major factors and many minor ones are pushing Treasury yields higher, which is pushing mortgage rates up. Given the current position of the Federal Reserve, which intends to keep rates “higher for longer,” it is unlikely that home buyers will get much reprieve when it comes to borrowing costs any time soon.
With such a persistently positive economy, I have had to revise my forecast yet again. I now believe rates will hold at current levels before starting to trend down in the spring of next year.
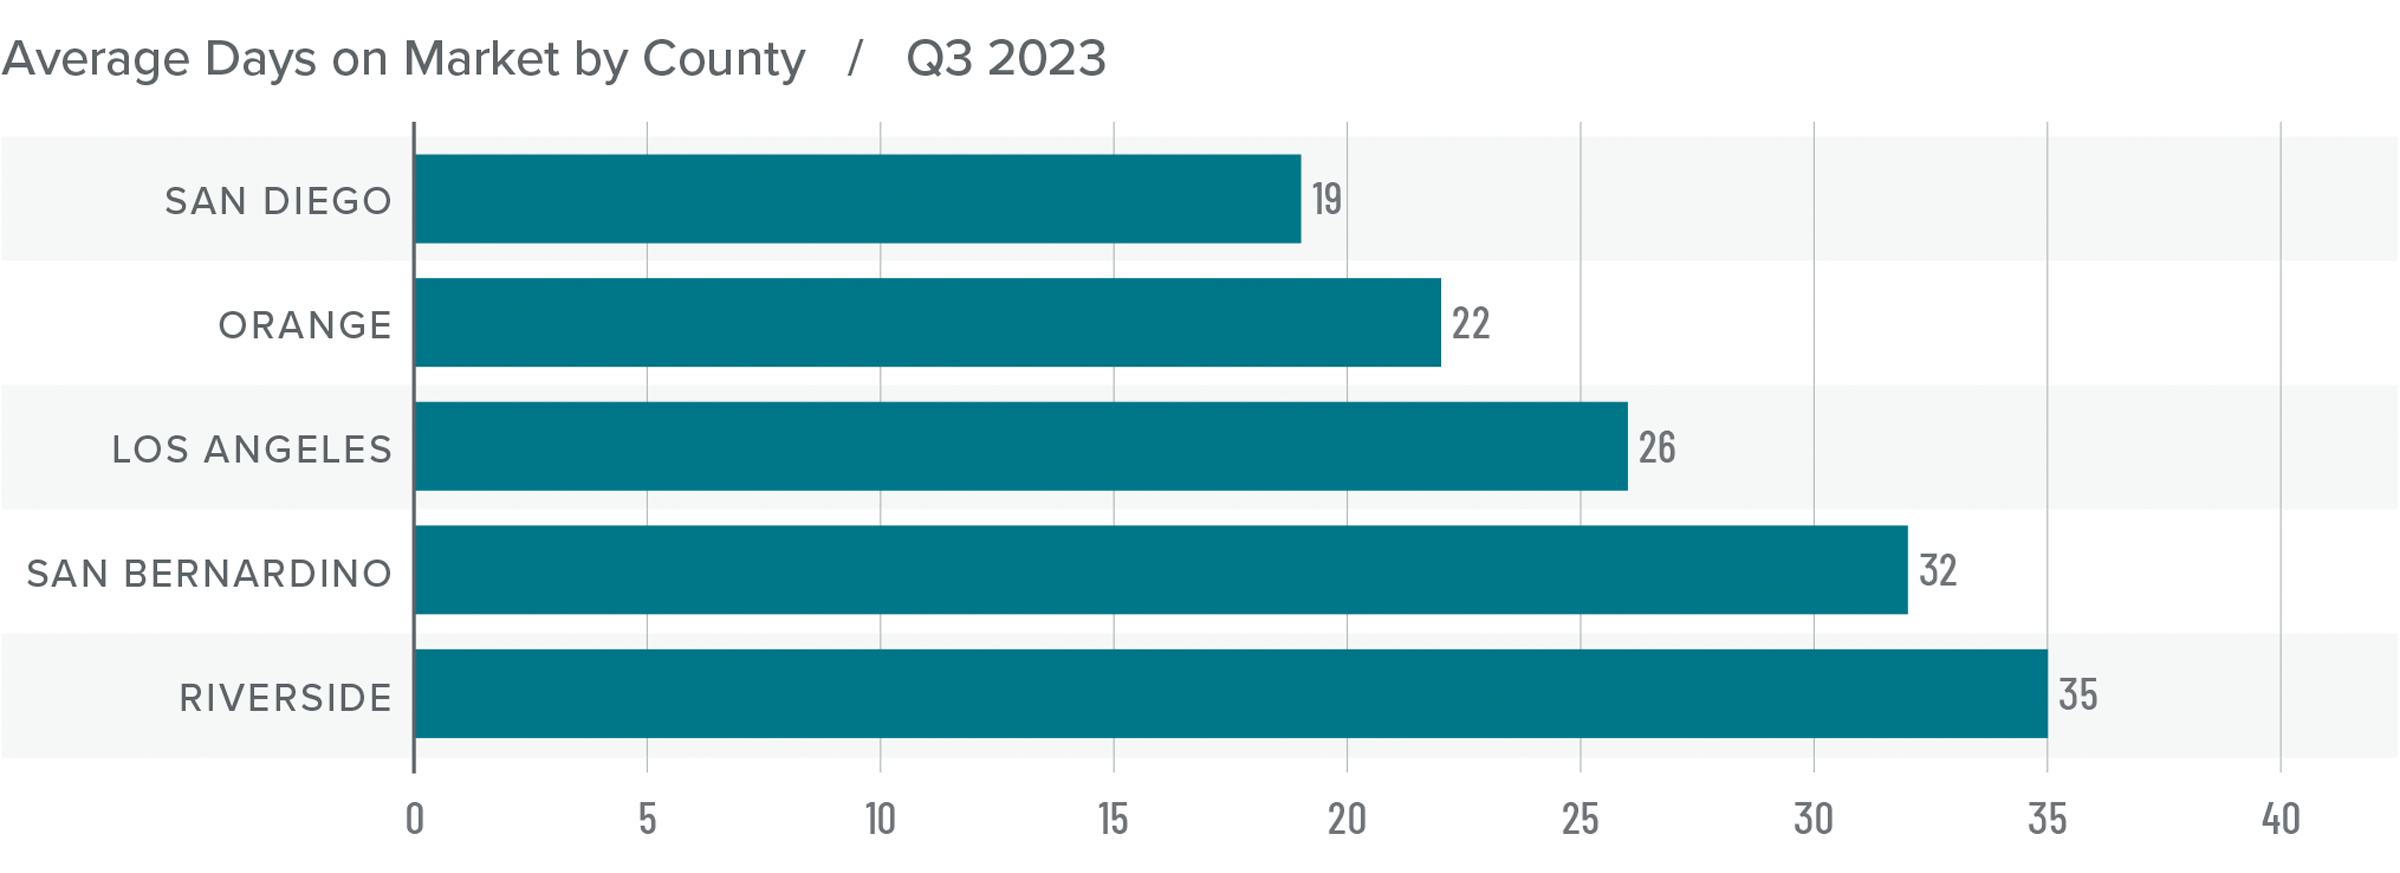
Southern California Days on Market
❱ In the third quarter of 2023, the average time it took to sell a home in the region was 27 days. This was up two days compared to the same period of 2022.
❱ Compared to the second quarter of 2023, market time fell six days and was lower across all counties covered by this report.
❱ Homes in San Diego County continue to sell at a faster rate than other markets in the region, but it took two fewer days to sell a home than it did in the third quarter of 2022. Orange County saw days on market fall by one day compared to the third quarter of 2022, but market time rose everywhere else.
❱ Homebuyers saw rising inventories, and those who chose to make offers did so relatively quickly, even though the total number of sales fell. If the number of homes for sale continues to rise, it may also cause market time to rise as buyers become more selective.
Conclusions
This speedometer reflects the state of the region’s real estate market using housing inventory, price gains, home sales, interest rates, and larger economic factors.
With inventory levels rising, and sales and asking prices falling, it would be easy to suggest that home buyers have the upper hand. However, home prices are still rising, albeit slowly, which tends to favor sellers.
The quandary really comes down to the fact that while inventory levels have risen, they remain remarkably low compared to historic averages. It’s also likely that the buyers who are still in the market are looking to move more from necessity than desire, which makes sense given today’s high mortgage rates.
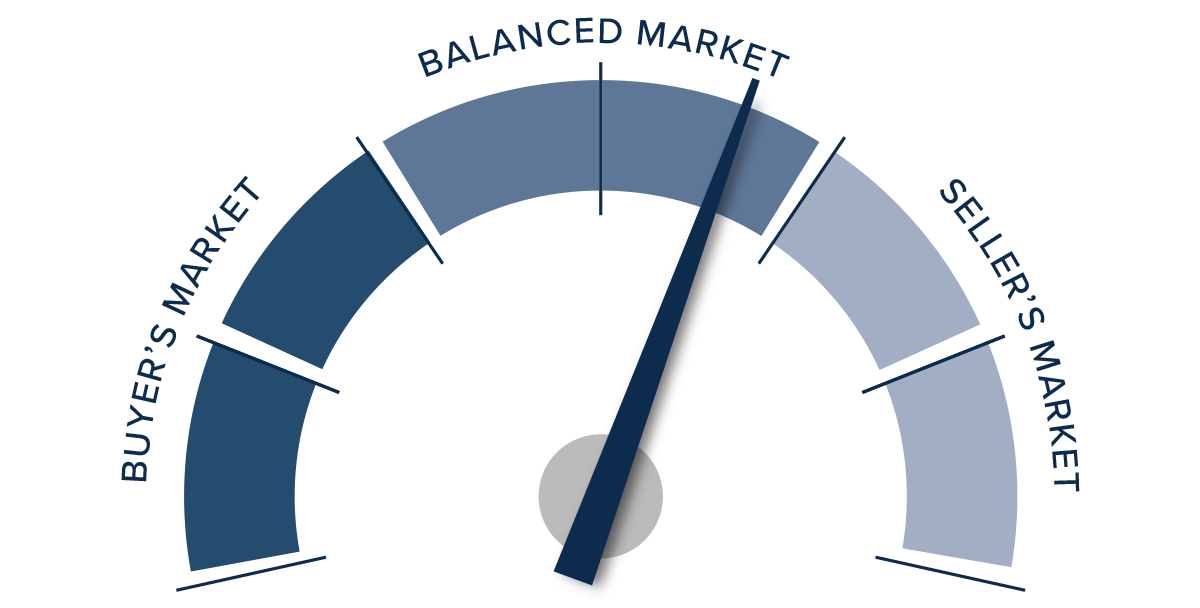
That has put us in a very unusual situation. Although sellers are being a little more competitive, as evidenced by the drop in list prices, they have not totally capitulated. Taking all these factors into consideration, the needle moves back to the middle of the speedometer. We simply don’t see either side as having the upper hand at the present time.


")


