
 Facebook
 X
X
 Pinterest
 Copy Link

Recent research from the U.S. Department of Agriculture (USDA) found that more than 13 million children in the U.S. experience food insecurity. That’s one in six children who live in households where they do not have enough food to eat on a regular basis. And over 20 million children rely on free or reduced-price school lunches for their meals during the school year.
For those families relying on the free and reduced meals during the school year, summer can be especially stressful. Many families do not have access to food assistance programs during the summer. And the national summer meal programs reach only a small percentage of children who need help when school is not in session–around 16 percent. That is why many of our Windermere offices choose to support local non-profits that provide weekend and summer meals to children and families in need.
One of those non-profits that Windermere offices support is the Hunger Intervention Program (HIP) in Seattle, Washington, whose mission is to increase food security for underserved populations in North King County through nutritious meals, educational programs, and advocacy. According to HIP, one in four children in Washington State live in households where families experience hunger. Their Healthy HIP Packs Program is a weekend food backpack program that provides nutritious and kid-friendly foods, enough for six meals and two snacks per child, when school meals are not available during the school year. And HIP’s Summer Eats for Kids program provides freshly made, nutritious lunches at kid-friendly locations around the north Seattle community during the summer.
The Windermere Northgate, Sand Point, and Wedgwood offices have supported Hunger Intervention Program since 2013 with donations via the Windermere Foundation. A total of $14,700 has been donated to HIP over the years, to help fund meal programs so that children do not have to go hungry on the weekends or over summer break.
 Thanks to donations from our Windermere owners, offices, and agents, and donations from the public, the Windermere Foundation is able to provide support to local nonprofits that provide nutritious meals for children in need. If you’d like to help support food programs for children experiencing hunger in your community, please consider making a donation to the Windermere Foundation through a Windermere office near you. Just click on the Donate button.
To learn more about the Windermere Foundation, visit https://www.windermere.com/foundation.


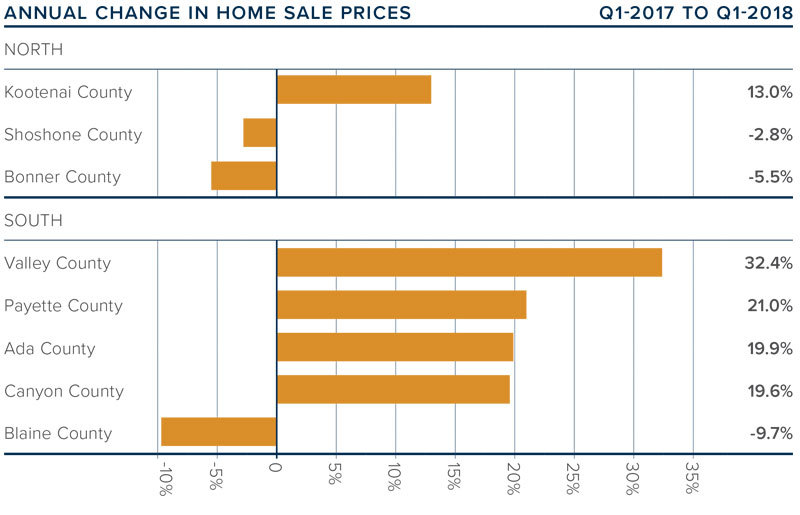


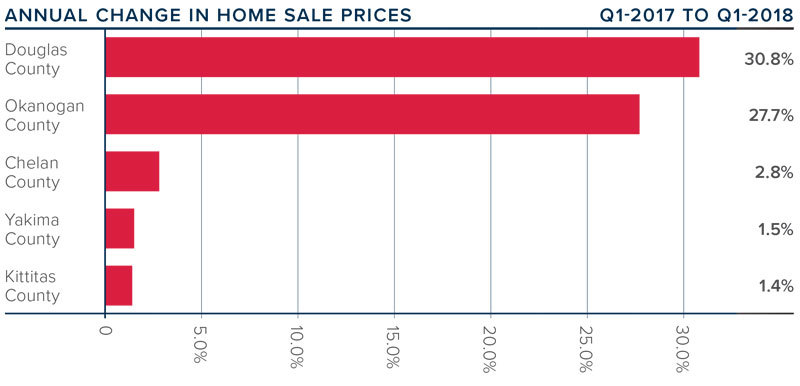


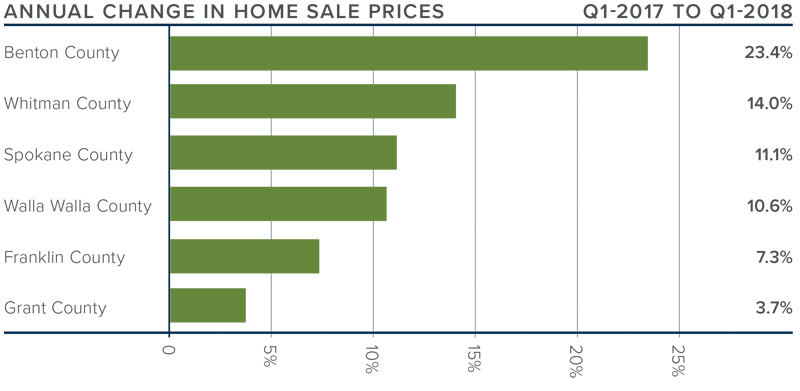


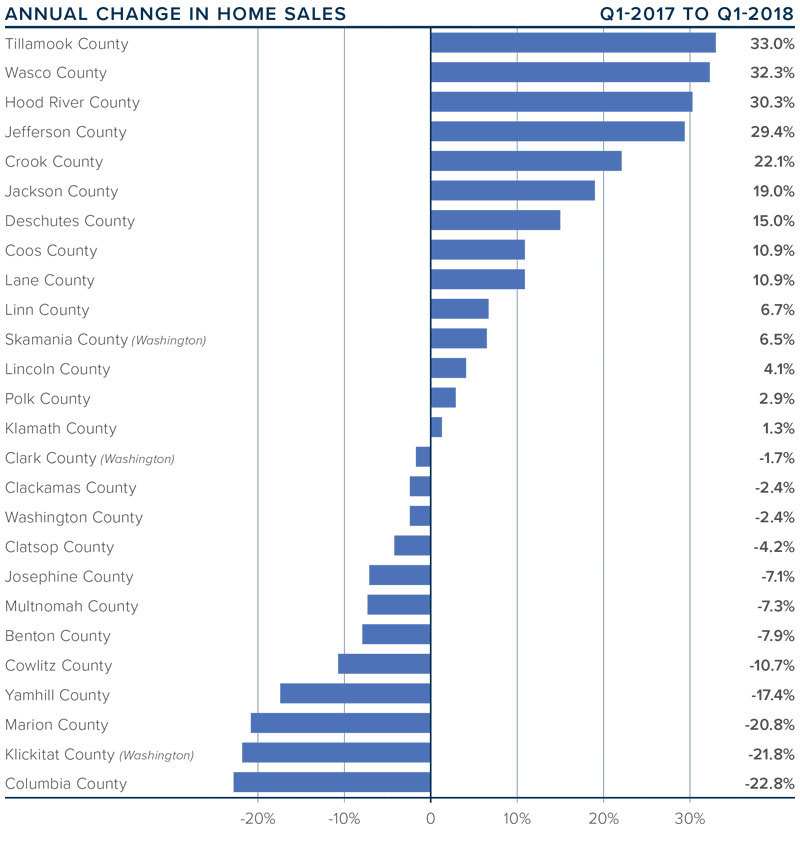
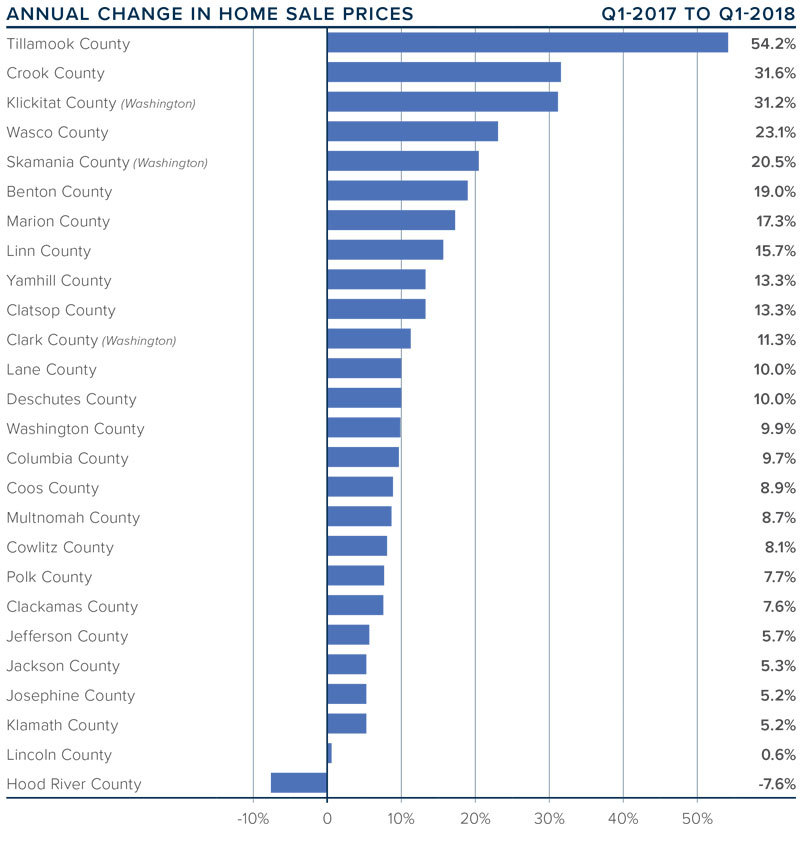


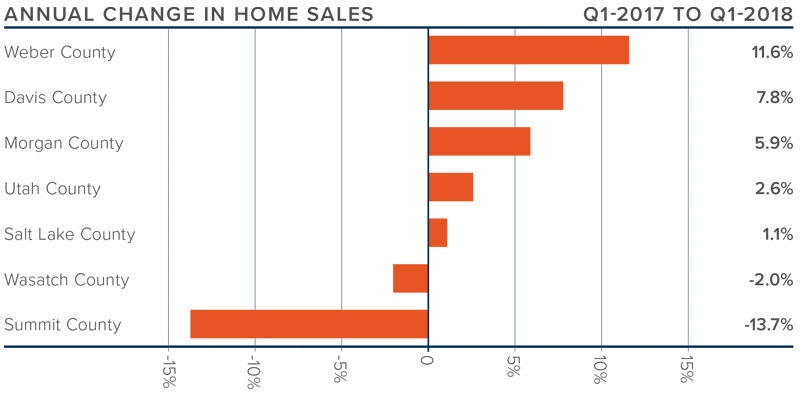
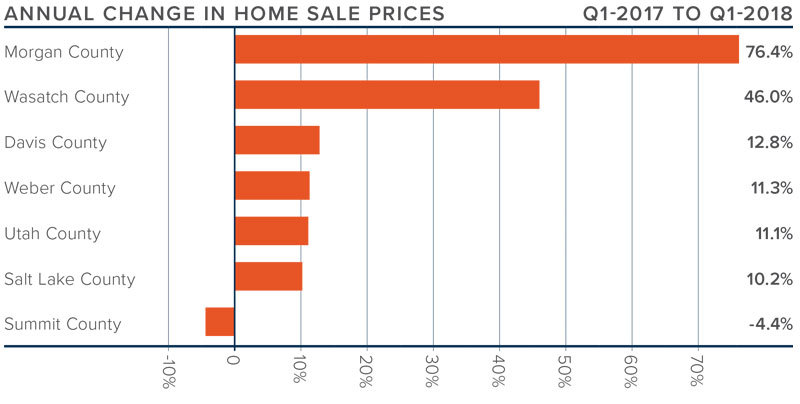


 Strong economic growth, combined with limited inventory, continued to push prices higher. The average home price in the markets covered by this report was up by 11.7% year-over-year to $448,687.
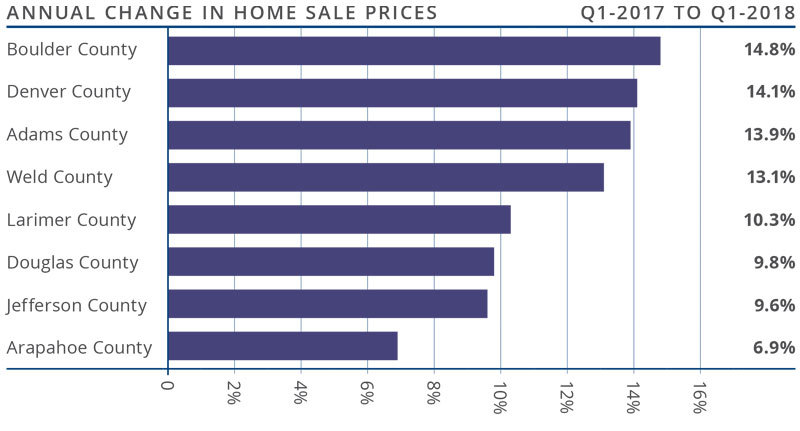
 This speedometer reflects the state of the region’s housing market using housing inventory, price gains, home sales, interest rates, and larger economic factors. In the first quarter of 2018, I have left the needle where it was in the fourth quarter of last year. Even as interest rates trend higher, it appears as if demand will continue to outweigh supply. As we head into the spring months, I had hoped to see an increase in the number of homes for sale, but so far that has not happened. As a result, the housing market continues to heavily favor sellers.
")


