
 Facebook
 X
X
 Pinterest
 Copy Link
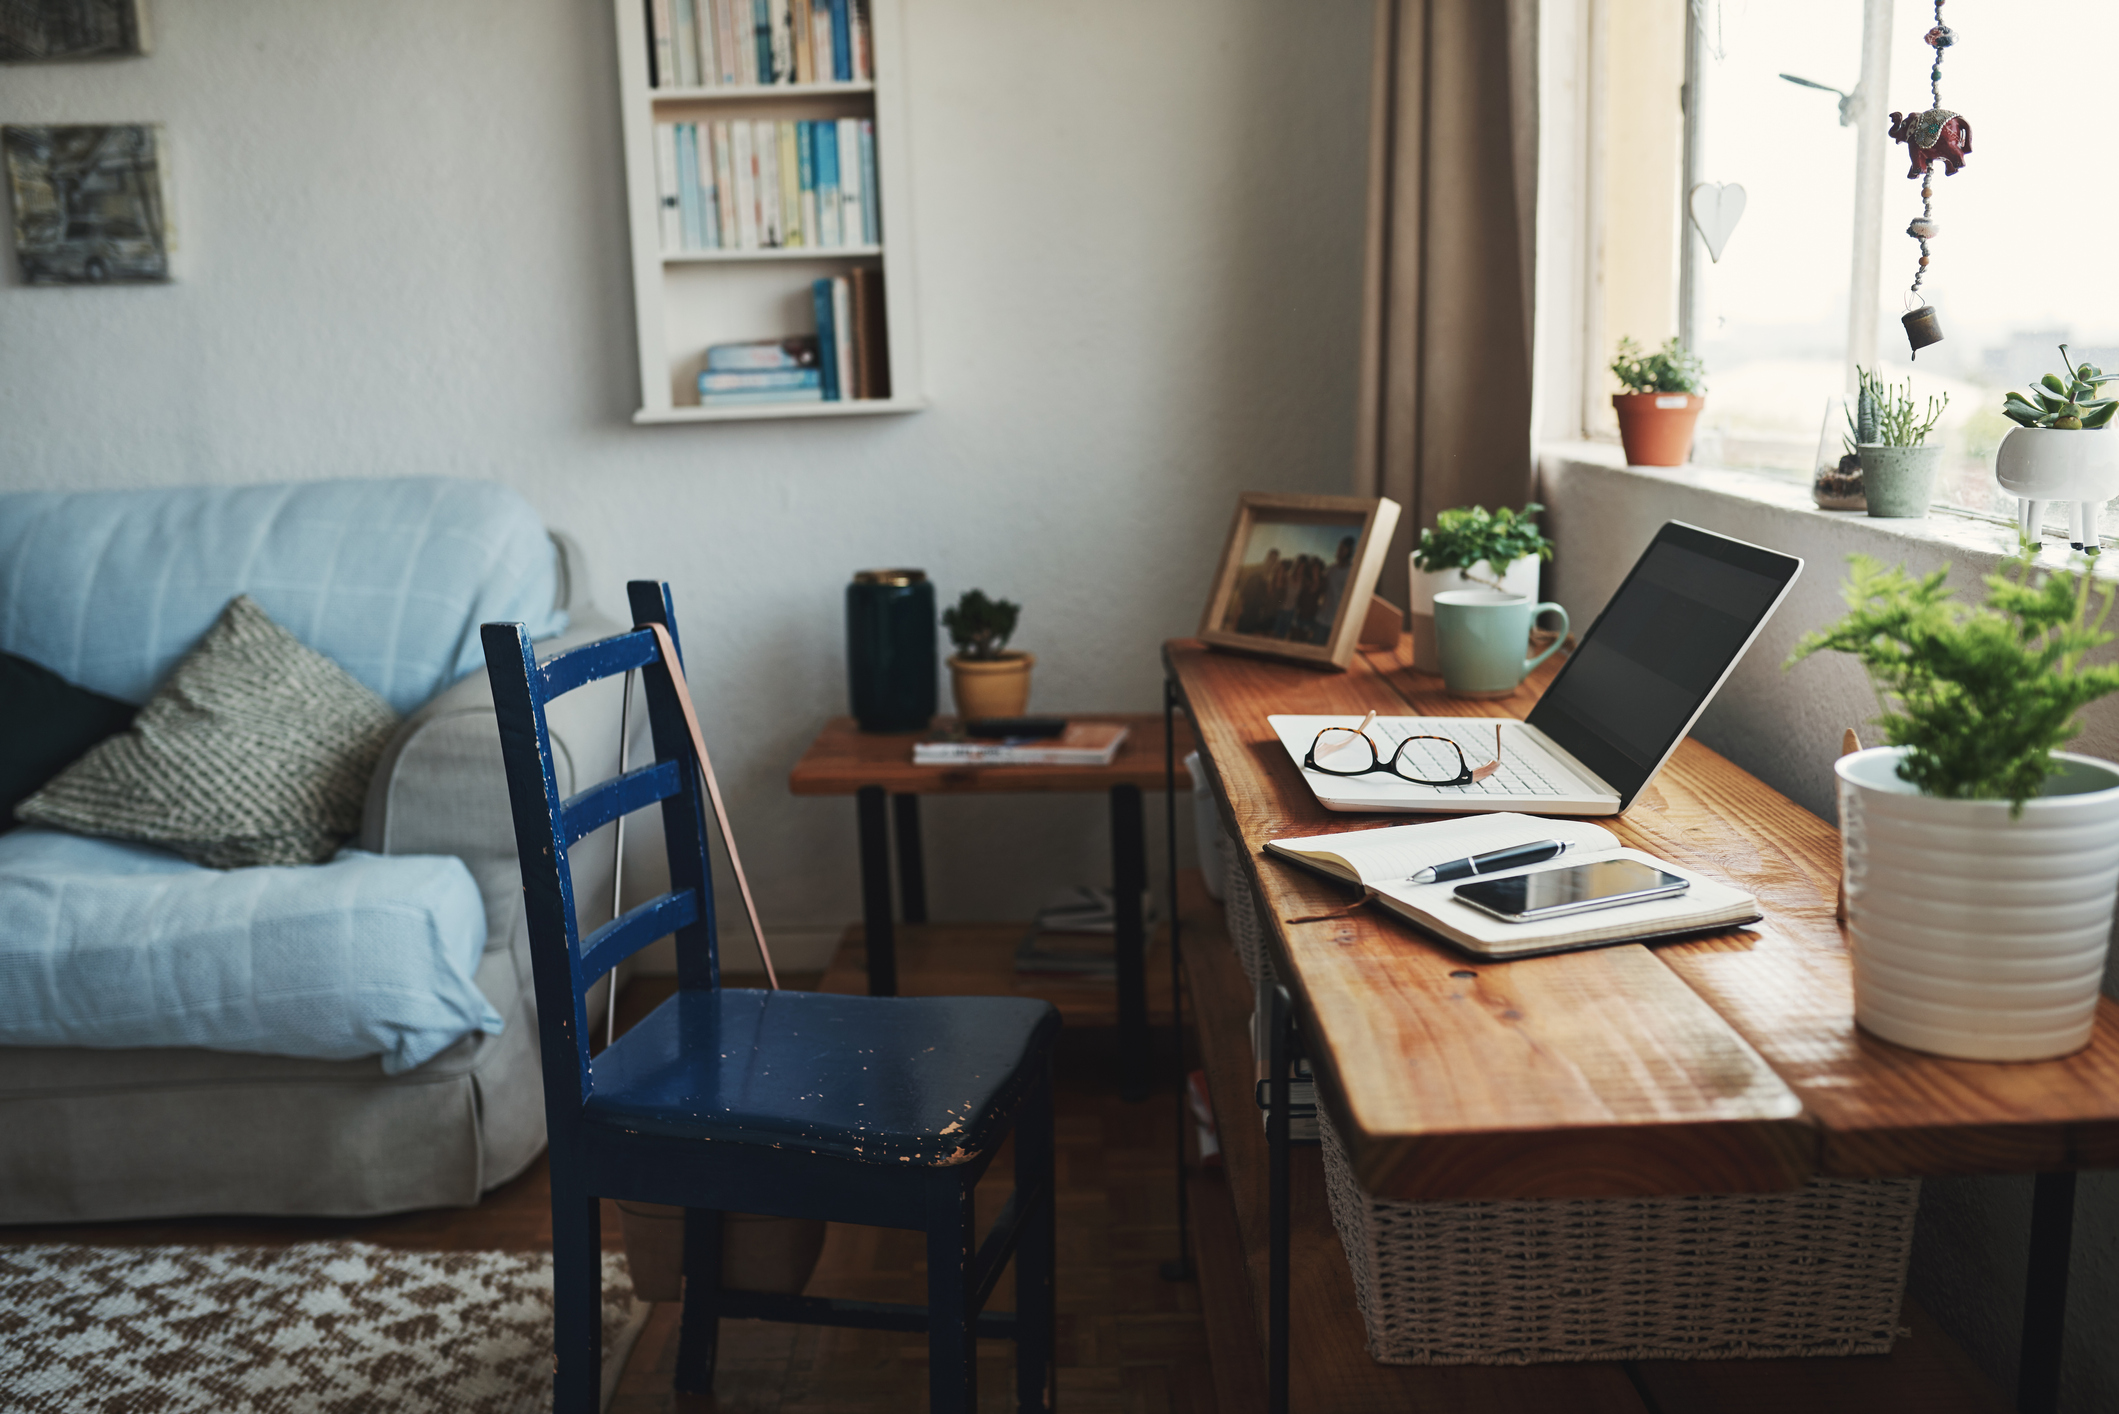
Image Source: Getty Images
The pandemic’s influences on home life are far-ranging, prompting buyers to look at home ownership through a new lens. Remote work has created a paradigm shift in the wants and needs of homebuyers. Here’s what the remote worker should keep in mind when looking to buy.
Location
The location, location, location cliché has taken on new meaning for homebuyers who work from home. Because remote work gives us the opportunity to work from anywhere, home searches are expanding. Work commute times typically play a significant role in the home buying process; however, many buyers now have the option to view homes further away from their places of work.
Those who previously dreamed of the quiet life, but didn’t want the commute that came with it, are now able to make a move toward a more suburban environment. If you prefer to be away from the hustle and bustle of a downtown area but don’t want to feel isolated, search for properties in the suburbs with active town centers.
The proper space
When COVID-19 began sending workers home in the early months of 2020, homeowners worldwide discovered their varied level of preparedness for remote work. Some had spacious home offices and were able to make the transition easily. Others had to create makeshift workspaces out of living rooms or bedrooms. What we have learned is that a dedicated workspace is paramount to productive remote work, its importance emphasized by the unknown timeline of a return to working in-person in many parts of the country.
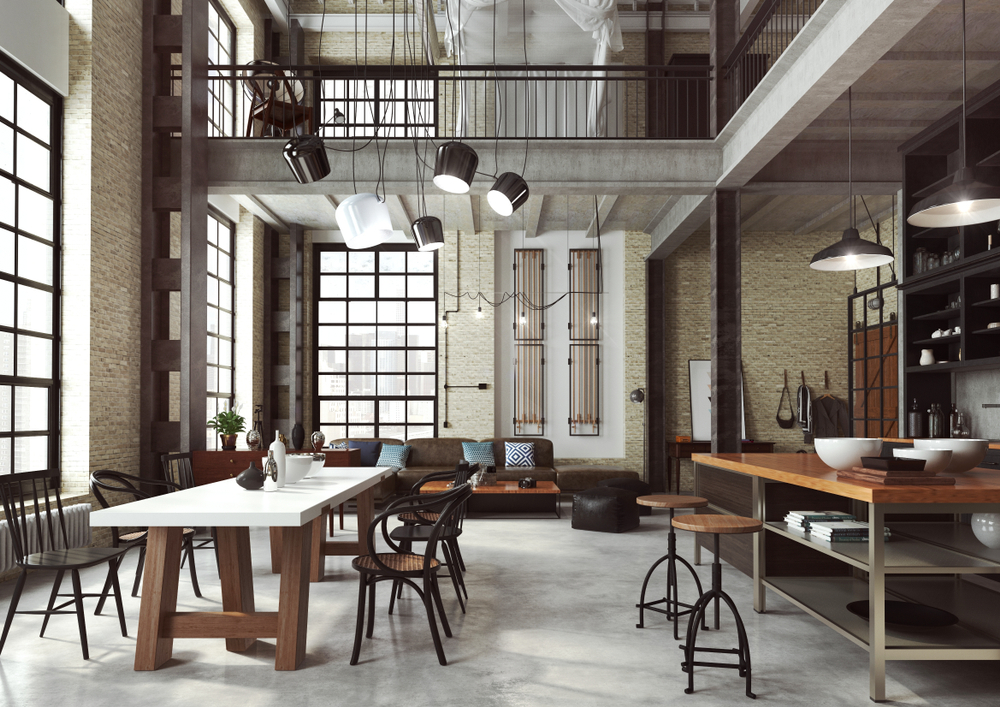
- When searching for homes, understand that a home office situated in an open floor plan is more prone to distraction.
- Look for features such as an additional bedroom, finished basement, or bonus room that offer ample space to create your remote work environment.
- Having a designated space you can associate solely with work will not only drive your focus but helps to balance your home and work life. It allows you to wrap up the workday, leave your home office, and easily transition back into the goings on of your household.
- Light it up: You’ll want plenty of light in your home office to stay fresh throughout the work week. If you are next to a window, let in as much natural light as possible. Add in desk and floor lamps to brighten your space.
- Work comfortably: While working at home, it’s easy to sit in one place for hours on end. Shop for comfortable desk chairs that provide proper lumbar support. Explore alternatives to desk chairs like yoga balls and standing desks.
- Personalize: Adding personal touches will help to make your home office feel comfortable. Inspirational quotes, your favorite artwork, and pictures of loved ones are all types of décor that will keep you inspired in your remote work.
For all these considerations and more, talk with your Windermere agent about how your remote work is shifting where you’re looking for a home and what you’re looking for when it’s time to move there.


")


