Contrary to popular belief, going green does not have to be hard or cost money, in fact it can even save you money. There are many small things that you and your family can do within your home to save money while reducing landfill waste and the use of natural resources. Discover a few ways to go green and save some money by choosing a green home.
Compost Bin
Composting is free and can provide you with rich soil to garden with. You will never have to buy soil and can easily grow plants and vegetables. To create your own bin, get a large trashcan with a locking lid, then drill about 25 holes all around the bin and attach the bin to small platform (allows it to drain). Once you start putting approved items in the bin go outside and roll it around in the grass every few days.
Energy Efficient Light Bulbs
You can save approximately $75 dollars a year by replacing your traditional incandescent with energy efficient light bulbs. On average energy efficient light bulbs typically use way less energy and can last much longer, not needing to be replaced as much.
Laundry
There are quite a few options to save money and energy when it comes to laundry. Here are a few: wait till you have a full load of laundry to wash, line dry your clothes, wash your clothes in cold water and when it comes time to get a new washer and dryer, buy an energy efficient one.
Weather-Strip & Caulk
One of the main ways we use a lot of energy, especially in hot and cold climates, is through air-conditioning and heating. One way to reduce the use of heating and air-conditioning is to properly weather strip and caulk all windows and doors keeping your home cool and warm when needed.
Reuse and Reduce
Use items more than once when you can to avoid throwing them out; this might mean buying quantity over quality. Another way is to join The Freecycle Network or Buy Nothing group on Facebook. In these groups, you can swap used goods with neighbors for free while keeping more waste out of landfills.
DIY Cleaning
Start making your own cleaning products. Not only can you customize, make them eco-friendlier but you will also save money buying products. On average, most DIY cleaners cost less than a $1 to make per bottle compared to $5-$15 per store bought bottle.
Unplug & Turn Off
Put all your major electronics on a power strip and shut off when they are not in use. Even if your electronics are shut off, they still will continue to draw electricity thought out the day. Another tip is to make sure you unplug your cellphone when completely charged and always power everything down while not in use to save on battery life.
Toilet
There is an extremely easy way to make your toilet a low flow toilet. Simply add a brick, wrapped in a waterproof bag or take a plastic water bottle and fill it with sand putting it into your tank. This will reduce the amount of water with every flush. Once you are ready for a new toilet purchase a low-flush toilet.
Shower
Change up your shower head with an energy-efficient shower head that will use half the amount of water. These shower heads are low flow but will significantly cut your water bill down. Another option is to install a tap aerator which will also cut down water usage without changing the water pressure.
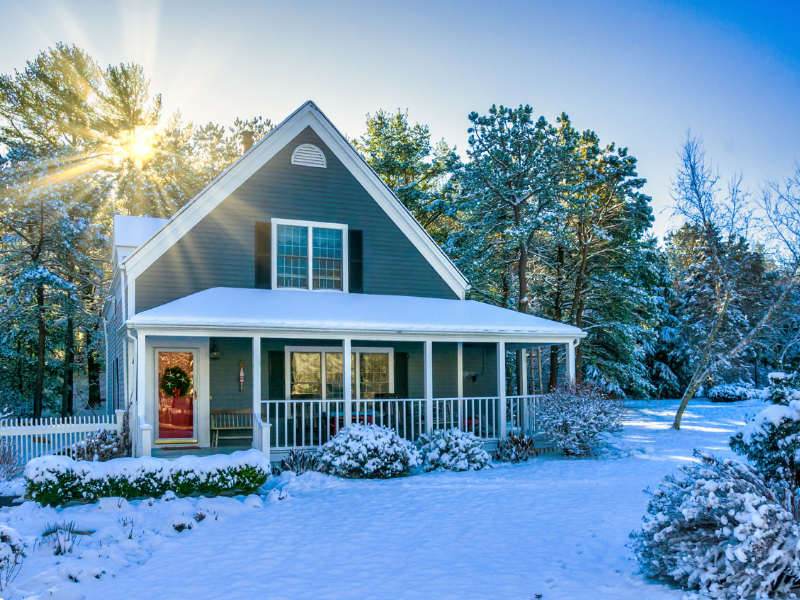
Winter is a magical season to spend at home. We all want to be able to enjoy the shorter days and longer nights from the comfort of our homes while we watch the season change.
To truly enjoy this winter at home with peace of mind, you’ll want to complete a home maintenance checklist to prevent unexpected costs, ensure your family’s safety and warmth, and keep your home in the best shape for the winter season ahead.
1. Weatherproof Windows & Doors
One of the best preparatory measures you can take to keep the cold from infiltrating your home is to weatherproof your windows and doors. Any leaks or cracks could lead to a chilly household and increased heating costs. Either weatherstripping or caulking will do the trick for minor leakage issues, but for any severe problems you may want to consider a replacement.
2. Protect Your Pipes from Freezing
Burst pipes can be disastrous regardless of the season, but winter temperatures pose a greater risk than any other time of the year. Be sure to wrap interior pipes to provide them some insulation against the change in temperature. You’ll want to bring all hoses inside but remember to turn off your exterior water source before you do.
3. Prepare for a Winter Storm
Being fully prepared for the winter ahead includes completing both preventative home maintenance and disaster preparedness tasks. Keep a supply of flashlights and batteries handy in case a power outage should occur. If you have a fireplace, stock up on firewood so you’ll have plenty of fuel for your heat source. It’s best for your family to put together an emergency kit and evacuation plan so you’re prepared for any local weather emergencies.
4. Chimney Sweep and Fireplace Maintenance
We become more reliant on fireplaces, wood burning stoves, and chimneys to heat our homes during the winter. Accordingly, it’s crucial to prepare for the uptick in their usage. Clear out your air vents before your daily fires begin. When your fireplace is not in use, be sure to close the damper to save energy. Clogged chimneys can lead to house fires and carbon monoxide poisoning. Investing in a chimney sweep can save you money in the long run, while avoiding health scares.
5. Clean Out Your Gutters
After all the leaves, pinecones, pine needles, and other autumnal debris have fallen, it’s best to clean out your gutters in preparation for winter. By keeping your gutters clean you’ll avoid gutter damage from melted snow draining improperly. Make sure your downspouts are pointing away from your home’s foundation to prevent basement leaks and flooding.
6. Heating System Maintenance
Keeping up on your heating system’s efficiency is an integral part of winter home maintenance. If you use a furnace, be sure to clean out your air filters and ducts, making replacements as needed. Covering your HVAC system can help to prevent damage from any debris or moisture getting in. To protect against heat loss, seal your ducts with mastic tape or foil tape.
7. Reverse Your Ceiling Fans
If you have ceilings fans in your home, there is a handy trick you can use to improve your home’s heating efficiency. By reversing the direction of your ceiling fan—running the blades in a clockwise direction—you’ll create a slight updraft, forcing warm air near the ceiling downward.
8. Bring Your Plants Inside
The winter season usually spells trouble for your potted plants. However, there are methods to keep them alive indoors through the winter months. You’ll want to provide continual air circulation, so keep a fan blowing in the direction of the plants. It’s best to mirror the conditions the plants will face outdoors, so you can afford to keep watering to a minimum. Since it is a harsher season, keep a close eye on your plants as the winter progresses.
After your checklist is completely crossed off, you’ll be able to kick back, relax, and enjoy your winter at home in comfort knowing your home is primed and ready for the winter season ahead.
On our “#AskAnAgent” Instagram Live series, radio personality and Windermere client Carla Marie goes live with our agents, answering viewer questions about how to buy and sell a home.
The second half of our #AskAnAgent series began with an informative conversation between Carla Marie and Jen Bowman, a Windermere agent based in Lynnwood, Washington. Drawing on her experience working with mostly sellers in recent years, Bowman discussed what it’s like to work with sellers while inventory is low. On the topic of bidding wars, Jen stressed the importance of timing for sellers when they hit the market, so they know they have exposed their home to the greatest number of interested buyers. Wrapping up, Jen touched on the recent trend of buyers moving to rural areas from her perspective in Snohomish County.
New Jersey natives Carla Marie and Windermere agent Genevieve Stoll continued the #AskAnAgent conversations with an instructive discussion, examining the real estate process from multiple angles. For Stoll, one of the first thing she tells her buyers looking to strengthen their offers is to speak with a reputable lender right away to get the pre-approval process started. The conversation shifted to how buyers’ needs are shifting during the pandemic and the resurgence of vacation home purchases.
For the final #AskAnAgent episode of 2020, Carla Marie chatted with Derrik Shockman, a former business owner and agent with Windermere Abode in Tacoma, Washington. For Shockman, being an entrepreneur and real estate agent are similar in that both require staying calm through the ups and downs of the market. Derrik also shared his expert knowledge on the similarities and differences between single-family houses, townhouses, and condos, and the different needs they satisfy for buyers.
Follow our Instagram page (@windermere) for updates on future episodes and follow Carla Marie (@thecarlamarie) to watch all the #AskAnAgent episodes from this year.
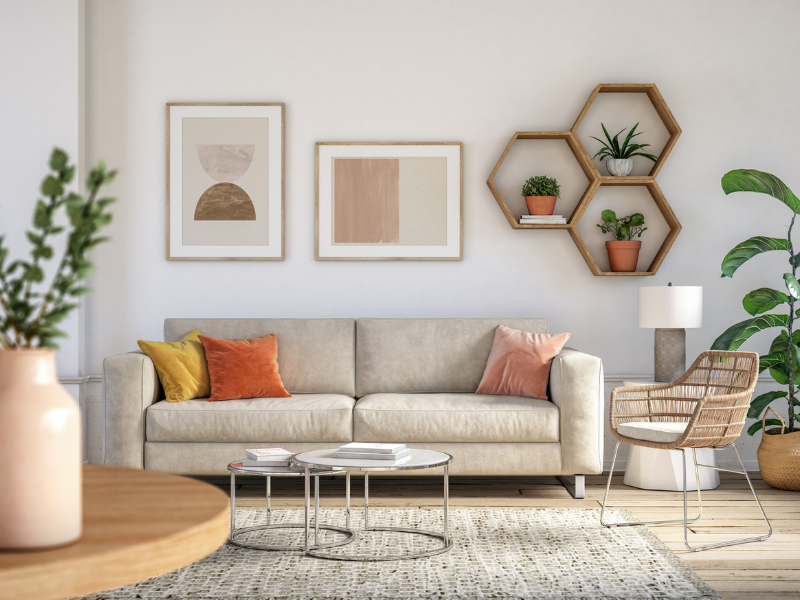
Each new year brings a fresh perspective on the latest design trends, home décor, and popular colors for homeowners to incorporate in their homes. This year has greatly impacted the way we depend on the places we live.
This shift in responsibilities has changed homeowners’ needs, which are reflected in the upcoming year’s most sought-after paint colors. Here are some of the color trends you can expect to see in 2021 and how you can incorporate them into your home.
2021 Paint Color Trends
Embrace Neutral Colors
After a weary 2020, expect to see a return to prominence for nostalgic, neutral colors. The resurgence of neutrals signals a focus on simple comfort, healing, a return towards wellness, and is representative of a lifestyle with a slower pace. Colors to look for include oatmeal hues, cerulean and Aegean blues, and earthy tones.
Comforting Colors
More than ever we are looking to our homes to provide us the chance to relax and recharge. Accordingly, serene, warm colors and soft pastels are making a strong comeback. They set the mood by providing a calm foundation, leaving room to add colorful decorations. Keep your eye out for rejuvenating colors including soft reds and creamy off-whites.
Add Vibrance
To build upon your neutral palette, add touches of vibrant colors for an exciting contrast. This coming spring, you can expect to see nature-based hues on the rise. In 2021, these nature colors will reflect a return to vibrance after homeowners have spent most of 2020—and, in some places, remain—cooped up due to the COVID-19 pandemic. Colors to look for include rust tones and hues in the gold-to-orange range.
Color Trends in Your Home
The calm, soothing presence of neutrals is best delivered when given ample space, so look to use the neutral palette on large surface areas. Good use cases in your home include painting whole walls, as well as furniture and carpeting choices. For vibrant colors, sprinkle them throughout the home in your décor and through smaller accents.
60-30-10 Rule
After you’ve chosen your colors, follow the 60-30-10 color design rule. It states that 60% of a room’s color should be the dominant color, 30% should be the secondary color, and 10% should be the accent color.
2021 Paint Colors
Here are three 2021 paint colors that will deliver the serene home environment you’re looking for while providing a solid foundation to add decorations.
Aegean Teal
Benjamin Moore’s 2021 color of the year is Aegean Teal. It combines a calming blue, a natural green, and a soothing grey. Its qualities make it a sound choice for bedroom or living room walls, as well as cabinets and other large surface areas. Aegean Teal is the perfect choice for homeowners looking to incorporate a bluish hue into their home without the melancholy undertones that come with blue.
Urbane Bronze
Say hello to Urbane Bronze—Sherwin Williams’ 2021 color of the year. Their selection is founded in the desire to create a sense of calm at home. Urbane Bronze helps to deliver the sense of a sanctuary at home, given its organic appeal. Use this color to give your home a relaxed feel by painting your trim or accent walls. Urbane Bronze pairs nicely with greys and modern greens.
Big Cypress
PPG has selected Big Cypress as part of their “Be Well” 2021 Palette of the Year. This ginger orange pairs well with cherry and mahogany woods, as well as touches of gold. Homeowners looking to create a soothing feeling without missing a sense of warmth can depend on Big Cypress to do the job. Another earthy tone, this color is the perfect choice to create what PPG calls a “huggable” room.
2020 has been a unique year, changing how we perceive and live in our homes. The new year presents an opportunity for a fresh start, so consider exploring these colors and trends to find the right combination for your home in 2021.
Hello and welcome to this rather special episode of Mondays with Matthew. I’m Windermere Real Estate’s Chief Economist, Matthew Gardner.
Now, if you wonder what’s special about this particular episode, well the answer is twofold.
Firstly, I started these videos at the onset of the COVID-19 epidemic back in March and this is the 35th episode of Mondays with Matthew – where has the time gone? Anyway, it will be the last one for this year and I wanted to take just a moment to thank all of you for taking time out of your busy schedules to watch my videos. It makes this economist very happy to think that you are still getting value out of my musings.
But there’s another reason that I am excited and it’s because, after many, many late nights poring over spreadsheets, I am now ready to share my 2021 US housing forecast with you so, without further ado, let’s get to it!
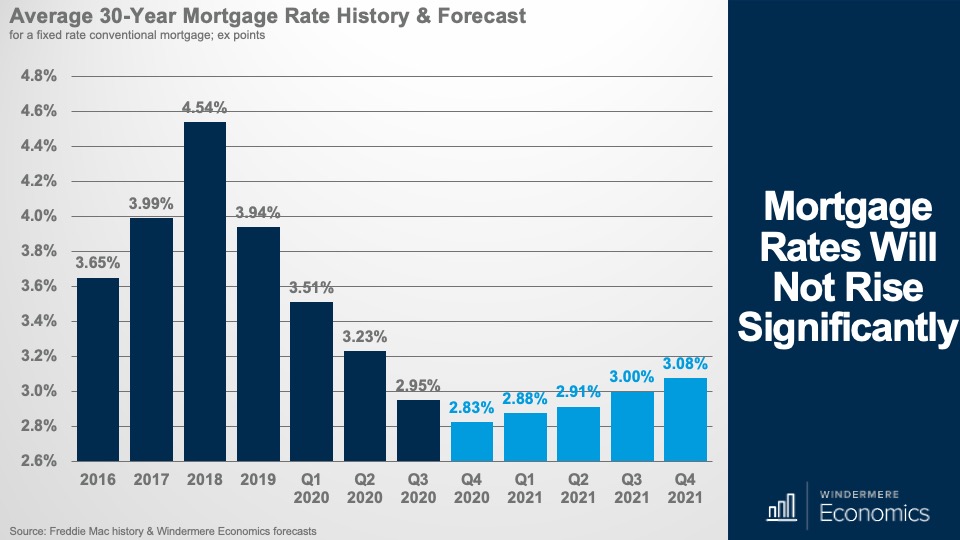
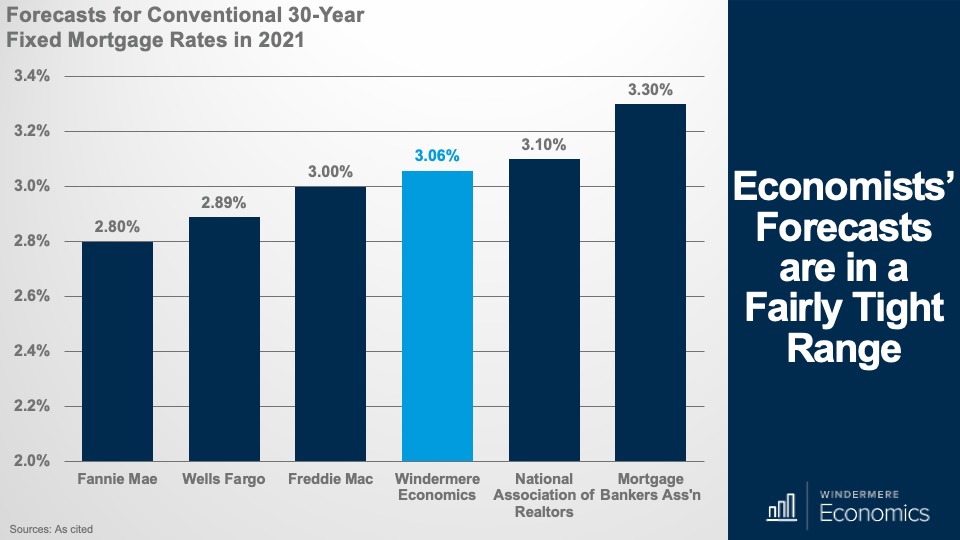
I’m starting off with my mortgage rate forecast.
As you will all be very aware, we have spent the entire year watching mortgage rates break record lows almost every week which, along with other factors, has helped drive housing demand significantly higher, but how low can rates go?
Well, my forecast suggests that rates will likely bottom out in the current quarter but that said, I do not anticipate them rising much as we move through 2021.
Now, I always like to see how my forecasts compare to others, so I spoke with a few housing economists across the country to see where they were regarding rates, and – as you can see – we are all in a pretty tight range for next year. I will tell you that my friends over at Fannie Mae were pretty defensive about their very optimistic forecast – I guess that we will see.
And looking further out – where my crystal ball fogs over just a little – the brave souls who are putting out forecasts for 2022 are showing rates not moving much higher even then, with Fannie Mae at an average of 2.9%, Wells Fargo at 3.1% and the Mortgage Bankers Association a little higher at 3.6%.
The bottom line here is that we are all pretty confident that although rates will start to rise, the increase will be modest, and I personally don’t see it impacting housing demand at all.
And to explain why we will see rates rise, 30-year fixed-rate mortgages are pretty directly correlated with the yield on 10-year treasuries, and you can see here that my forecast shows these rising – albeit modestly – next year and, naturally if this occurs, rates will follow.
But there are 2 reasons that might stop rates rising – at least by too much, even if Treasury yields do head higher. First is the COVID-19 vaccine. You see, if it takes longer to distribute, or if we chose not to take it, then the economy could take another dip and, if that happens, treasury yields will likely pull back, and rates could drop again. But I remain hopeful that this will not be the case.
And second is the Fed. As long as they continue to buy mortgage-backed securities, rates are actually insulated from rising treasury yields.
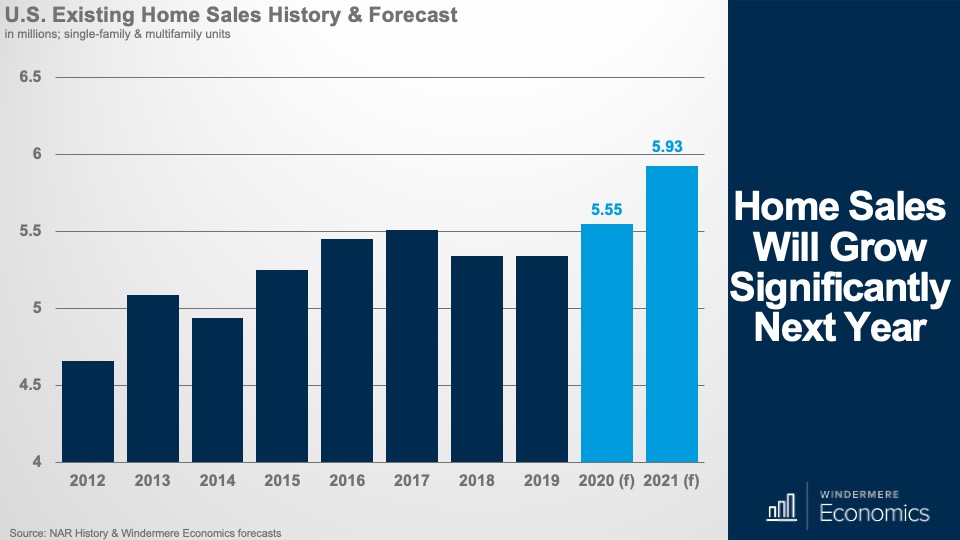
OK – on to sales, and here I am specifically looking at existing homes – I will address new homes shortly.
My forecast is for sales this year to have risen by 3.9%, but sales in 2021 should be up by 6.9%, and that’s a level we haven’t seen since 2006.
But in order for sales to rise to this extent, we need more inventory, and I do expect to see more listings next year and it will likely be, at least partially, due to COVID-19 with some household’s new ability to work from home removing the need to live close to their offices. But there will be others who will move simply because their current homes just aren’t set up for remote working.
Although I see a lot of homeowners moving due to work-from-home I believe that a lot of them will not move that far away. You see, the theory that we will all be working from home full-time is – in my opinion – likely overblown – and I would contend that a lot of them will end up blending their workweek with some days at home and some days at their offices and, if I am correct, I see many households still staying within reasonable proximity of their workplaces.
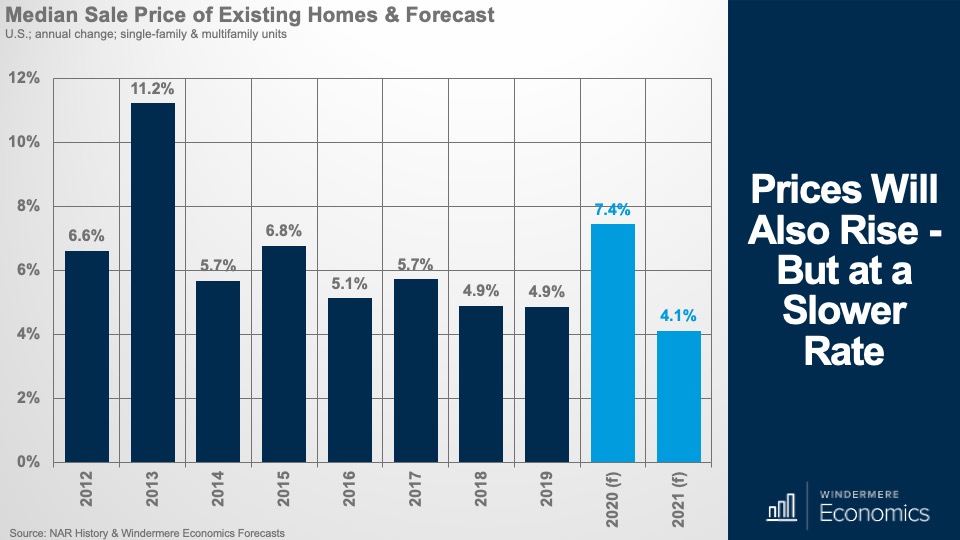
Turning our attention now to sale prices, well this year has been very impressive so far and we should see sale prices in 2020 ending up 7.4% higher than we saw in 2019. Now, this is quite remarkable, and I say this because I took a look at the 2020 forecast, I put out last year and I was forecasting price growth closer to 4% than 7%.
But COVID-19 changed all that. Mortgage rates dropped, households decided for several reasons to move and, in concert with a historically low level of homes available to buy, prices have risen significantly.
Now – and as I have said for years – there must always be a relationship between incomes and home prices, and mortgage rates dropping can only allow prices to rise by so much.
And, along with other factors, it’s partly due to affordability issues that I see prices rising by a more modest 4.1% in 2021.
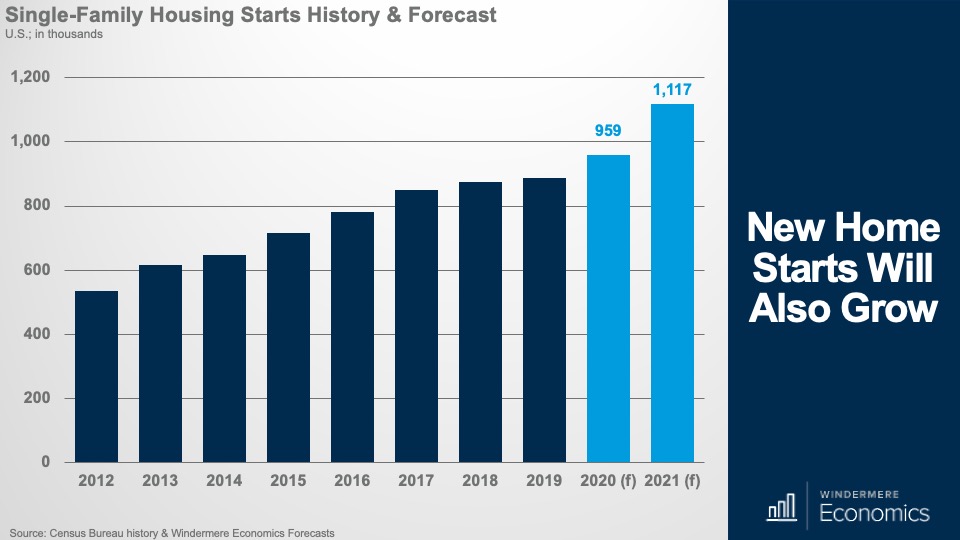
OK – looking now at the new home market – and for the purposes of this discussion I am just looking at the single-family market – so far this year we have seen a significant jump in new home sales and this very robust demand has encouraged builders to start construction of more homes and my forecast for single-family housing starts shows them rising by 8% this year, but next year I’m seeing starts up by a very significant 16.4%.
This is good news for several reasons, the biggest of which is that more new construction will add to supply and that should take some of the demand and price pressure off the resale market.
And with more starts, I expect to see sales rising with an increase of 21.5% this year and a further 18.7% in 2021. Notably, this will put new home sales at a level again that we haven’t seen since 2006.
But I do have one concern regarding the new home market, and my worry is all about cost.
Builders want to do what they do best, and that’s build homes, but they have to reconcile the costs to build a home, which are extremely high today, with the prices that would-be buyers can afford.
Now I see them managing this issue by looking to areas where land is cheaper and where there is still demand from buyers who, as we just talked about, are now looking at markets further away from major job centers.
The bottom line is that the new construction market will see very solid gains next year.
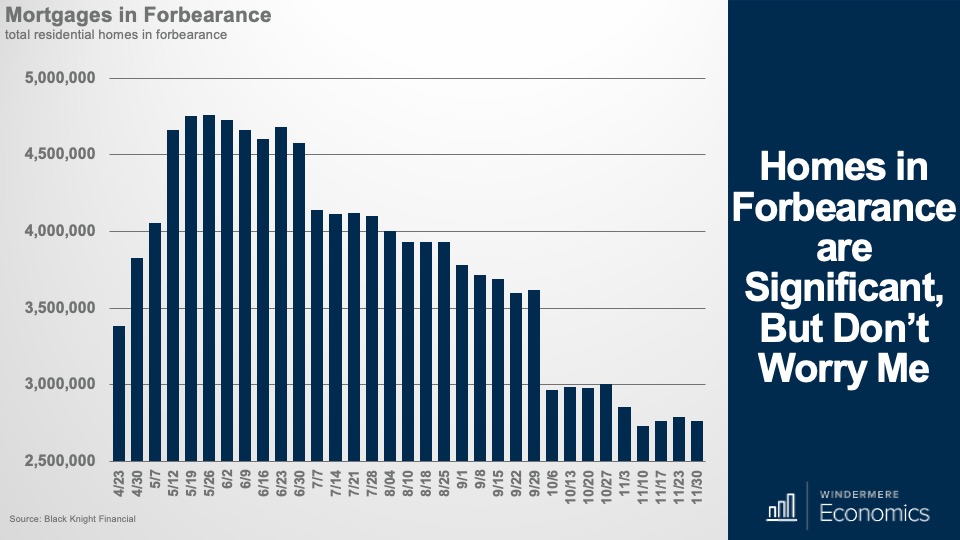
And finally, it would be remiss of me if I weren’t to address the one thing that is troubling a lot of brokers – and their clients –and that’s forbearance.
Although we saw a modest uptick in active forbearance plans earlier last month, I think it’s important to put things in perspective.
Despite small increases in the number of homes we saw entering the program, the number of active forbearances is still down by 8% (or 246,000 homes) from the end of October.
In total, as of November 30, there are 2.76 million homeowners in active forbearance plans and that represents approximately 5.2% of all mortgages but again, for perspective, the number of owners in forbearance is down by almost 2 million from the peak back in May – that’s a drop of 42%.
So, let’s talk about this for a bit.
As is human nature, there are some out there predicting that the housing market is going to crash again purely because of the number of owners in forbearance – all 2.76 million of them –will be foreclosed on when forbearance ends next spring, and this flood of foreclosed homes will lead to a spike in supply and this will lead prices to drop in a manner similar to 2008.
I get the theory, and I guess that at face value you might say that it seems plausible, but is it?
Although there’s no getting around the fact that foreclosures will rise next year as forbearance terms end, will it really be that dramatic?I think not.
There are several reasons why I’m not overly pessimistic about this. Although I see foreclosures rising next year, I actually expect the numbers to be very mild when compared to the carnage we saw between 2008 and 2010.
Why do I think this? Well, the housing bubble burst for very different reasons than we are currently experiencing. Back then there was a frenzy of reckless lending, irresponsible borrowing, and the unbridled speculation that did nothing more than set the housing market up for a crash. And crash it did. Home prices collapsed, and millions lost their homes.
But, back in March of this year – when COVID-19 really kicked in – homeowners were actually in a very good place. Credit standards were still very tight, down payments were significant, and the housing market, along with the economy as a whole, was extremely healthy and that’s the difference.
The COVID-19 pandemic has primarily hit renters, but it has impacted a lot of homeowners too and, as much as I am very sorry to say that we will see a rise in mortgage defaults and foreclosures but as the housing market muscles its way through the current economic downturn, I see foreclosures forming more of a trickle rather than a flood.
And, to support this, my colleagues over at ATTOM Data Solutions are currently forecasting more than 200,000 homeowners are likely to default next year but, if there is a longer-term Coronavirus related slowdown in the economy, the foreclosure count could get as high as 500,000 homes.
But as dramatic as their projections may seem, it’s worth noting a few things.
One. During the Great Recession, foreclosure filings spiked with 1.65 million American homes going into foreclosure in the first half of 2010, but this is well above the most pessimistic forecasts for foreclosures next year and even if defaults rise dramatically, they’ll still come in well below the levels we saw following the bursting of the housing bubble.
Two. As I talked about earlier, home prices have risen steadily since 2012 and homeowners have built up large reserves of equity. This is the total opposite of the situation we saw in 2008.
And it’s because home values have been rising, a lot of borrowers in forbearance will be able to escape foreclosure by simply selling – we know that there is more than enough demand and they will sell to make sure that they get the equity out of their homes rather than to potentially lose it because of foreclosure.
Third. Lenders really have no stomach for a repeat of the foreclosure crisis we saw back in 2008.
Today, I am seeing lenders positioning themselves to use a more-cooperative, less-punitive approach to delinquent borrowers and that they will do a better job of keeping people in homes.
And finally. Many, but not all, of the owners in forbearance, will not enter foreclosure because they will be able to catch up on their past-due amounts by paying more each month and some may be allowed to add the past-due amount to the end of the mortgage by lengthening its term.
The bottom line is that the housing market, and homeowners, are in a much better position today than they were back in the bubble days. Homeowners today have far more options to avoid foreclosure, and equity is surely helping to keep many afloat. Put it this way, even if today’s rate of foreclosures doubles, it will still only hit a mark that’s more in line with a historically normalized range.
Ultimately, I’m not concerned that we will see the housing market collapse because of forbearance.
And finally, a few more nuggets to think about.
Even if we ignore concerns over forbearance, there are still some talking about a housing bubble purely because prices have risen so rapidly over the past several years but I, along with my colleagues, just don’t see it. It is true that prices have been rising at above-average rates, but fundamentals are still in place. As I mentioned earlier, borrowers are well qualified, and they have solid equity in their homes.
But, as I have shown you, price growth is set to slow and I think that, because of this slowdown in price increases, there will surely be some homeowners who will think that the market has collapsed just because real estate agents aren’t telling them what they want to hear as far as the value of their home is concerned. What they need to understand is that the market isn’t collapsing, it’s just normalizing.
Sellers have had the upper hand for a very long time now, and many may have forgotten what a normal housing market looks like.
In the early days of the pandemic, it is true that buyers did gravitate toward the suburbs and I know this because 57% of buyers who bought between April and June of this year chose suburban locations and this compares with 50% before the pandemic. But it’s hardly the exodus from cities that some had speculated, and I would also note that there was even a small uptick in urban home purchases in that 3-month period – 12% before the pandemic, and 14% after. Meanwhile, sales actually fell a little in small towns and rural areas in the same timeframe, so I do not anticipate a massive move to the countryside.
Yes! You’ve heard this from me for a long time now. First-time buyers will be a major force again this year – and for years to come – brokers need to figure out how to work with them. Their numbers are only going to grow.
Condos – Hmmm this is interesting. Although I don’t see the condo market collapsing across the country – although I do see significant issues in markets like Manhattan and San Francisco – I am seeing inventory levels rise fairly significantly as opposed to single-family homes for sale whose numbers continues to drop but, for now, there still appears to be demand as sales are higher too. My concern is really in regard to the urban condominium market. You see, for many, the primary reasons to buy a downtown condo are twofold. Convenient access to work, and lifestyle.
Well, some won’t have to live close to work if they are working a majority – or all – of the time from home and secondly, if we lose some of the lifestyle reasons to live in a city – restaurants, retail, and the like, well that takes away some of the rationale behind buying a downtown condo.
There’s no need to panic yet but I will be watching urban condo markets to see if demand continues to keep up with rising supply. If it doesn’t, then we may well see prices softening.
And finally, well done, you made it through 2020!
So, there you have it. My 2021 US housing forecast.
I really hope that you have found this video – and the ones I have published before – of use to you and your clients.
As always, take care out there, and remember to wear your masks.
In all seriousness though, it really has been an honor to speak with you all this year and, hopefully, we will meet again –in person this time – at some point next year.
So, between now and then, stay safe, have a wonderful holiday, and here’s to a great 2021 for all of us.
We spend roughly a third of our lives asleep, so it’s only right that bedrooms be high on the priority list when it comes to home upgrades. Whether you’re looking for extra comfort or added liveliness from your personal sanctuary, these 10 simple tips will level up your bedroom.
10 Tips to Upgrade Your Bedroom
1. Bed Feng Shui
By incorporating some basic feng shui principles, your bedroom will automatically feel more comfortable. Position the head of your bed against a wall with ample surface area and room on the left, right, and foot of the bed. Avoid a bed position where doors can open directly into the bed. Finally, avoid the “coffin position,” where your feet point out a doorway.
2. Bedroom Textures
Sheepskin rugs, a down comforter, plush pillows, and knit blankets can add a softness to the room that will make you want to sink right in. Lift these textures upward, with a canopy, tufted headboard, billowy curtains and hanging textiles so even the walls and ceiling feel snuggly.
3. Declutter Under Your Bed
There may not be any monsters under your bed, but if it becomes a clutter nest, it can feel just as frightening. If you depend on the space under your bed for storage, organize it with storage bins.
4. Add Mood Lighting
Soften the light to mimic dusk for an intimate mood with dimmer switches, lamps, lanterns, or even string lights. Bedside lamps are a must-have for your nightstand arrangement. Whether you prefer to read books or watch shows and movies before you sleep, you won’t have to get out of bed when it’s time for lights out.
5. Breathe Easy in Bed
Aromatherapy can have a huge impact on your perception of a space, so find some soothing essential oils or a sweet candle to blanket the room with an ambiance you adore. As soon as you open the door, you’ll be eager to plunge into your little oasis.
6. Bedroom Multi-Functionality
These days, your bedroom may very well have taken on an additional role as a home office, or even your home gym. Accordingly, multifunctional items can help organize the chaos. Explore desks that double as nightstands, storage ottomans, lift-top side tables, or even loft beds.
7. Upgrade Your Decor
Choose natural and warm decor options like wood and comfortable fabrics to bring your bedroom together. Your bedroom is your own personal sanctuary. The more natural and comfortable it feels, the better chance you’ll have of getting the consistent sleep you’re dreaming of. Décor like wood blinds, elegant curtains, thick blankets, shiplap, and the like will help deliver that sanctuary feel.
8. Bedroom Colors
Your bedroom’s colors have significant say in the overall feel of the room. For ultimate comfort, natural, earthy color palettes work best to bring an element of rejuvenation and healing to your bedroom. Think of soft reds, soothing blues, earthy browns and off-whites. These warmer, organic color palettes are trendy, as well.
9. All-White Bedroom Color Tips
For those who prefer their bedroom to feel like sleeping on a cloud, choosing an all-white color palette is the way to go. Any splashes of color will go a long way against the white backdrop. Colorful throw pillows, rugs, and decorative items will pop, while maintaining that spa environment you’re after.
10. Upgrade Your Plant Life
For a more natural feel to your bedroom, add some plant life throughout the space. Succulents, hanging baskets, and flower arrangements with fit right at home in your bedroom, improve your air quality, and bring a touch of the outdoors.
There isn’t one solution for the perfect bedroom, but these tips can guide your decision process to determine what upgrades will help you sleep soundly and wake up feeling refreshed. Make a list, get to work, and sweet dreams!
After shopping for everyone on our holiday lists this year, let’s remember those in our communities who need our support. This GivingTuesday, you can help low-income and homeless families in your community by making a donation to the Windermere Foundation via your local Windermere office.
GivingTuesday – December 1, 2020
GivingTuesday is a global generosity movement created in 2012 to unleash the power of people and organizations to transform their communities and the world—a day to encourage people to do good. It inspires generosity of all scales, whether it’s taking a stand for an issue you care about or simply making a neighbor smile. The organization now operates in over 70 countries and has touched hundreds of millions of lives.
The Windermere Foundation
Since 1989, Windermere Real Estate has been dedicated to helping our communities through the Windermere Foundation, whose mission is to provide support to low-income and homeless families. To date we have raised over $42.5 million, with more than $1.6 million coming in 2020 alone. This year for GivingTuesday, you can donate to your neighbors in need through the Windermere Foundation by designating your funds to your local Windermere office.
For more information on GivingTuesday and how you can participate, visit their website here: GivingTuesday FAQ. To find out more about the Windermere Foundation or to make a donation, please visit windermerefoundation.com.
Whether your household includes a newborn, toddler, or young child, your home has the potential to pose a risk to their safety if not properly childproofed.
There’s no stopping a child’s curiosity. Using safety latches on cabinets and blocking your staircase with a gate is a good start, but there are other potential hazards around your home to account for. Let the following steps be a guide to keeping your little ones safe as they take their first steps around your home.
Childproof Against Potential Hazards
Water heater: A major concern for parents is that their child will burn themselves. One of the most common culprits is the water heater. To avoid burning accidents, keep your water heater set to less than 120 degrees.
Crib safety: Cribs are a place of comfort for your child, but they are not free from potential hazards. As soon as they can sit up, you’ll want to lower the crib height. The less objects in the crib, the better. Additional blankets, pillows, and toys pose risks for getting tangled up or choking.
Heavy objects: As your child grows, they will be able to reach higher and tug at furniture. Any heavy objects sitting on tables or shelving within their reach should be moved somewhere safe. Any unstable items on TV stands and bookshelves should be secured or removed as well.
Household chemicals: Household chemicals pose serious risks to the health and safety of your children. Do not keep poisonous materials under the sink or anywhere easily accessed by your little ones.
Exposed wiring: Any exposed wires in the home should be taken care of immediately. Use power strips to consolidate your wiring and hide them behind heavy furniture. If you need to keep your power strips accessible, buy power switch covers.
Shot of a young family spending quality time in the kitchen at home.
Childproof Room-by-Room
Childproof your living room: Keep all photo frames high up and out of your child’s reach. Accidents with glass can cause serious harm. If possible, mount your TV to a wall. This avoids any possibility of your child climbing on a TV stand and hurting themselves. If you have a fireplace, keep it covered when not in use and lock the fireplace doors when having a fire.
Childproof their bedroom: As mentioned above, crib safety cannot be overstated. Windows should be opened no more than a few inches and should have a window guard. To reduce the risk of your child getting tangled up, install cordless window blinds in their room.
Childproof your kitchen: We love our kitchens, but they can be the perfect recipe for disaster with a young child present. Keep your kitchen gated and secure your cabinets and drawers with a lock, using either traditional latches or magnetic locks. Keep your microwave, toaster, knives, blender, and any other countertop items out of reach. Remember to keep your dishwasher locked and consider buying stove guards to cover your stove knobs.
Childproof your bathroom: You’re likely to have cleaning supplies and other harmful chemicals stored in your bathroom. Keep all cleaning supplies, medicine, and toiletries locked up or well out of your child’s reach. Keep in mind that even a little standing water is enough to send your little one crashing to the floor. Be sure to keep the floor dry and clean up quickly after showers and baths. Hair dryers and curlers can cause severe burns, so remember to unplug and stow them away after use.
With a young child in the home, it’s easy for parents to become paranoid thinking of all the potential dangers and how to mitigate their risk. These are just some of the steps you can take to provides a safer home environment for your child. For more, visit the U.S. Consumer Product Safety Commission’s (CPSC) website here: Childproofing Your Home – CPSC
We’re back with another episode of “Mondays with Matthew,” with our chief economist, Matthew Gardner. This week he’s diving deep into the dark corners of the latest US home sales data.
Hello there and welcome to the latest episode of Mondays with Matthew. I’m Windermere Real Estate’s Chief Economist, Matthew Gardner.
Today we are going to focus on last Thursday’s data release for US existing home sales activity in October, so let’s get straight to it.
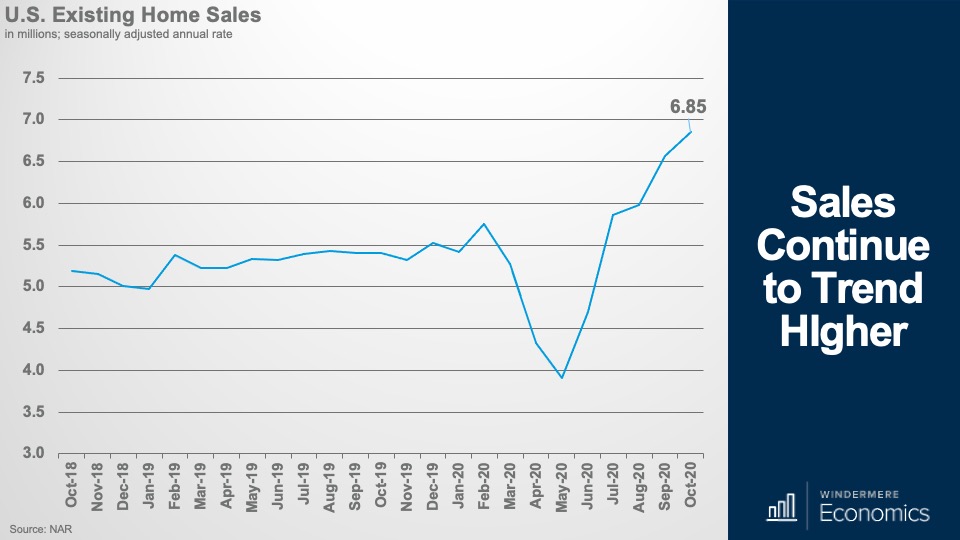
Well, if anyone out there was still thinking that the market was set to slow, they will have to wait a little longer. Existing home sales rose for the 5th consecutive month to an annual rate of 6.85 million units – and that’s up 4.3% from September and sales were 26.6% higher than we saw a year ago.
And it’s not just the annual rate that rose, as monthly sales came in at 573 thousand – and that’s the highest monthly figure since the market “snapped back’ in July following the initial COVID-19 shutdown.
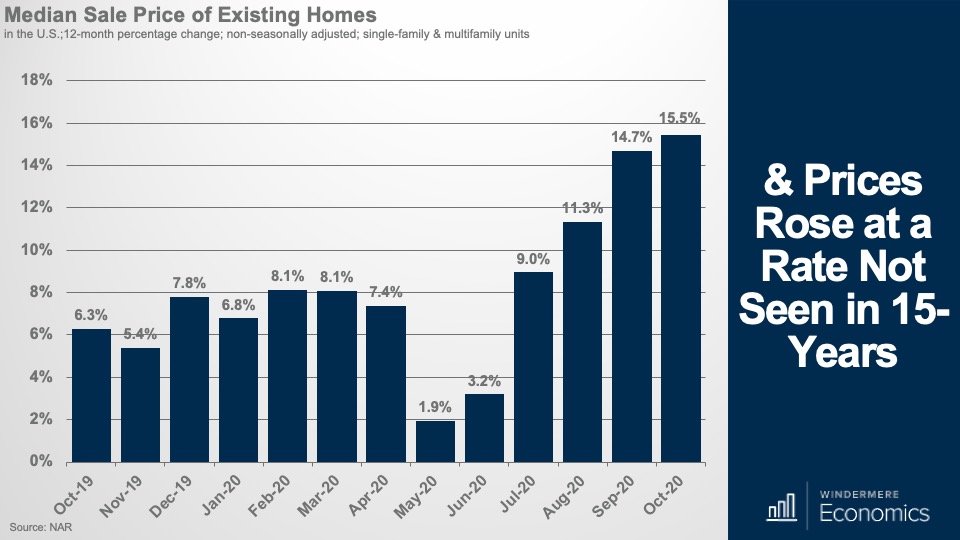
And with sales rising, so did prices, with the median price in October measured at $313,000 and that’s up by a massive 15.5% from a year ago and we haven’t seen that pace of price growth since 2006 and it was also the 104th straight month of year-over-year price gains.
And we are seeing these significant increases in prices not just because mortgage rates are low – although that certainly isn’t hurting – but the bigger reason is that there’s far more demand than there is supply and, if you remember your college economics classes, what happens to prices when you have limited supply but net new demand? That’s right, they rise.
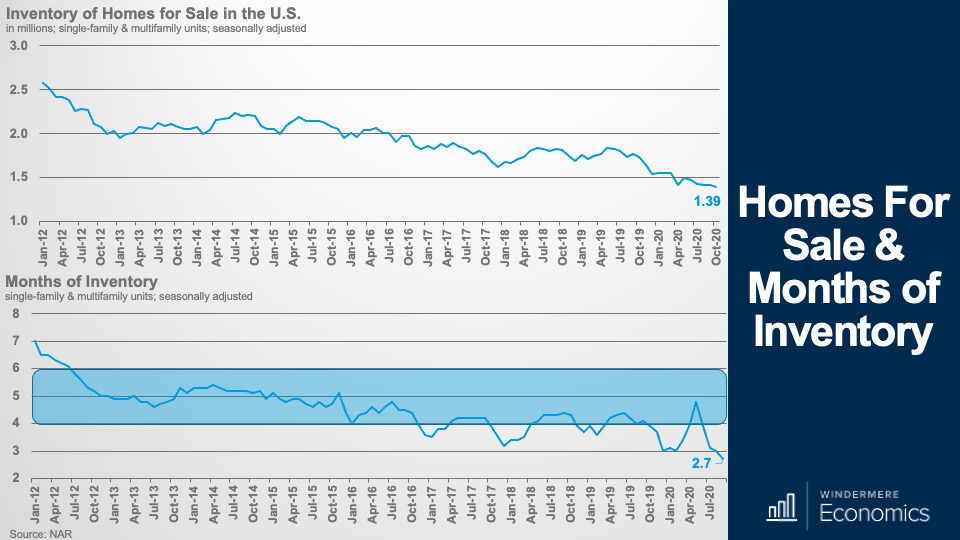
And as you can see here, there were fewer than 1.4 million homes for sale in October – now, I must add that I seasonally adjust my numbers and NAR doesn’t, but even if you use their figures there were just over 1.4 million homes for sale last month so it’s not much better.
And with tight supply and new demand, their is only 2.7 months of inventory at the current sales pace – and that’s an all-time low.
A balanced market – depending on where in the country you are, is between 4 and 6 months so we are a long way from balance.
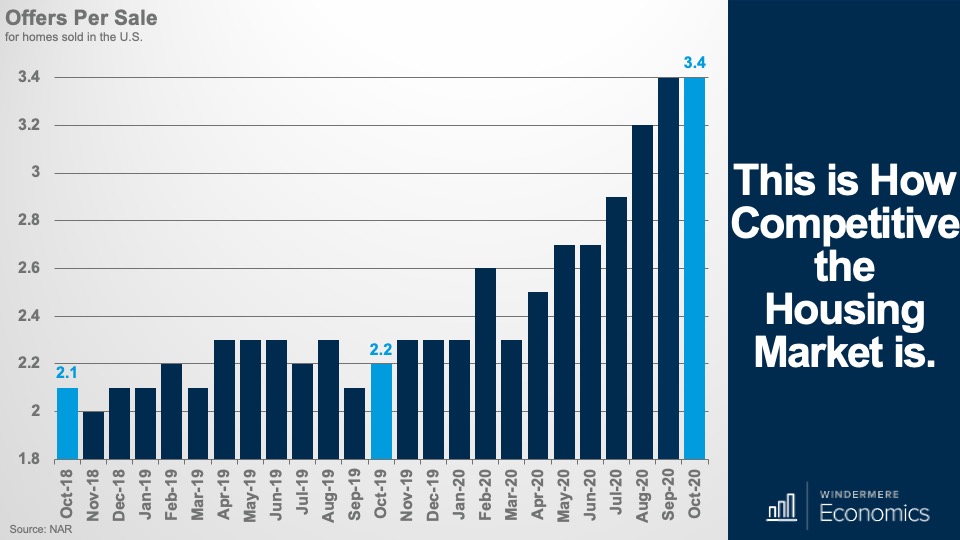
And to give you a different way to see how competitive the market is, there were an average of almost three and a half offers for every deal that was written last month. Additionally, 7 out of 10 homes sold within four weeks and the median market time coming in at just 21 days – it was 36 days a year ago.
Regionally, sales rose the fastest in the small Northeast region, but all areas saw sales up by over 20 percent.
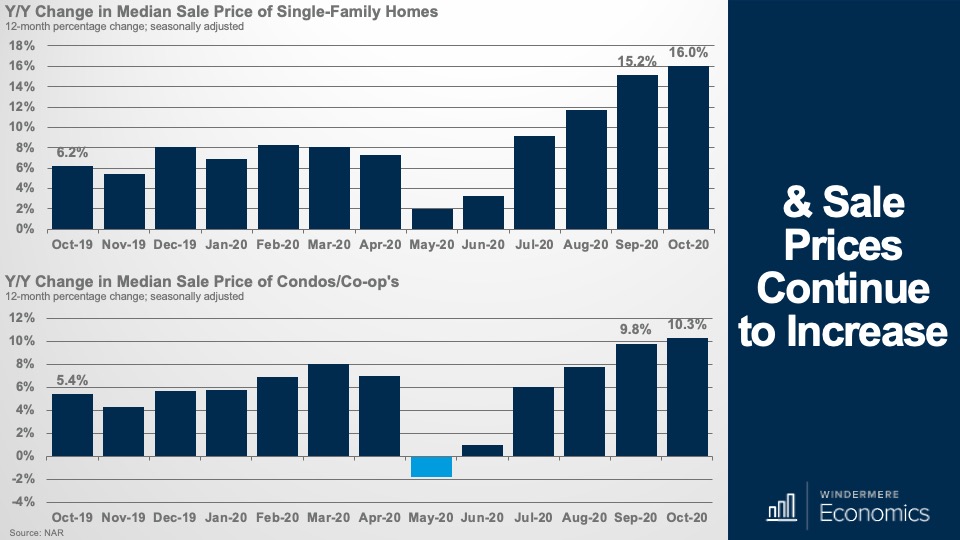
And when we look at sale prices, again, very significant increases across the board. I would note that the Northeast saw the greatest price increases for single-family homes – up 21.7% and condo prices rose the most in the Southern states where prices were up by 13.9% year over year.
Well, that’s the big picture, but you know me, I do love to dig into the dark corners of these data releases and, when I did, I found some pretty interesting nuggets there too.
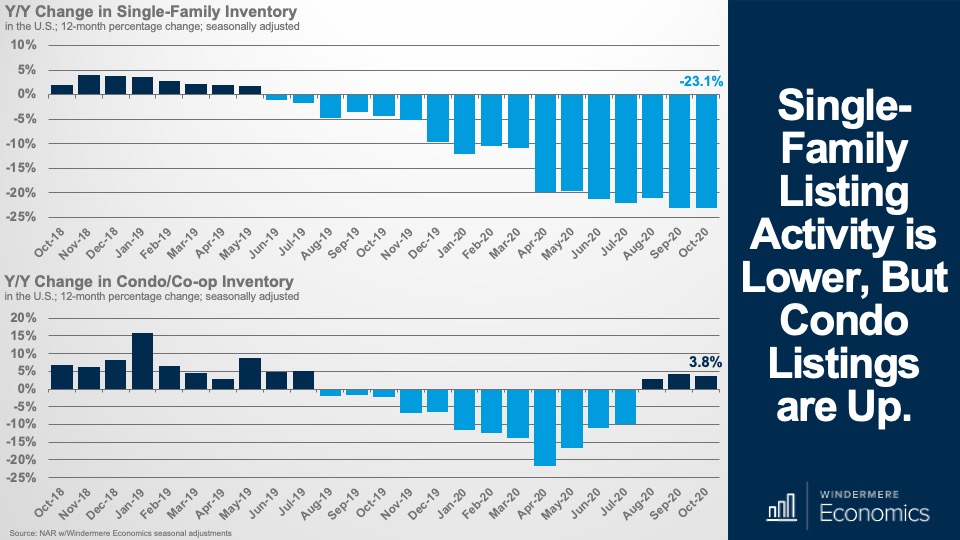
I mentioned single-family and multifamily price growth a moment ago, and when we break out the data, the supply numbers were interesting. Here is the year over year change in available inventory and its not surprising to see the number of single-family homes for sale way down but look at condos. Inventory is higher than it was a year ago.
Now, I think it’s too early to suggest that this is wholly due to COVID-19 and families flocking way from our urban centers, but I will be watching to see if this is an anomaly, or the start of a trend.
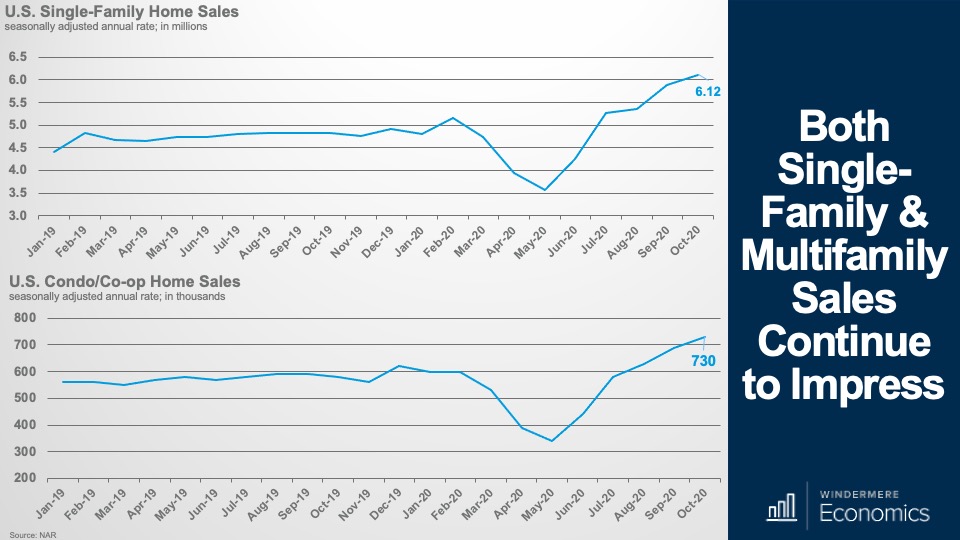
And my first reason for not being overly concerned about the condo market is this. Sales are still rising – up by 5.8% versus September and up by 25.9% year over year – even in the face of increasing inventory.
And single-family sales were up by just a little more – 26.7% year over year, but the month over month pace of single-family sales was actually lower than condos and came in 4.1% higher than in September.
And finally, condo prices are still trending higher after turning negative at the outset of COVID-19 – up 10.3% year over year to $273,600. Not quite the pace of price growth seen in the single-family world where the median sale prices were up by 16% to $317,700, but not bad at all.
So, there you have it and I think you’ll agree, these were pretty impressive numbers across the board. Certainly, no sign of a slowdown but, as I suggested earlier, I will be watching the multifamily market to see if inventory levels continue to rise and, if they do, we may see price growth starting to slow even if the single family market continues its upward trajectory.
But, again, I must reinforce my view that this pace of price growth is absolutely not sustainable. Of course, very favorable mortgage rates are still in place. In fact, the 30-year hit another all-time record low last week at 2.72%, but I still believe that we are close to the lows that will be seen in this cycle –we’re just not there yet.
Housing continues to outperform with first time buyers still out in force (32% of all sales went to them) and demand for second homes appears solid too – they accounted for 14% of all sales – a figure that matches October 2019 so no visible signs of COVID-19 stress there either.
The bottom line is that something has to give. I am not saying that prices will retreat, rather the pace of growth has to slow even with very significant demand, and it will happen because of one of two reasons or maybe a combination of both.
Either we will hit an affordability ceiling, which will slow the price increases that we are experiencing OR we will see additional supply which will temper prices.
You see, although I find it highly unlikely we will see a significant increase in the number of resale homes coming to market, I do see builders stepping up and developing more homes.
You see, builders are getting bullish – and we know this from the National Association of Homebuilders Market Index which hit another all-time high earlier this month and I believe that this optimism will lead single-family starts to stay well above 1 million units next year and rising even more after that, which will be a relief to some buyers who remain very frustrated by the limited inventory available.
But I am getting ahead of myself.
You see, in 2 weeks’ time I will be sharing my 2021 US housing forecast with you all so I really shouldn’t give too much away right now.
The housing market is still performing – COVID or no COVID – and this will continue as we close out the year even if we see some States slowing their economies as new coronavirus rates spike.
As always, if you’ve got any questions about my comments today, I’d love to hear from you but in the meantime, take care out there, and I hope that you will join me again in 2 weeks when I will be revealing my US housing market forecast for 2021.
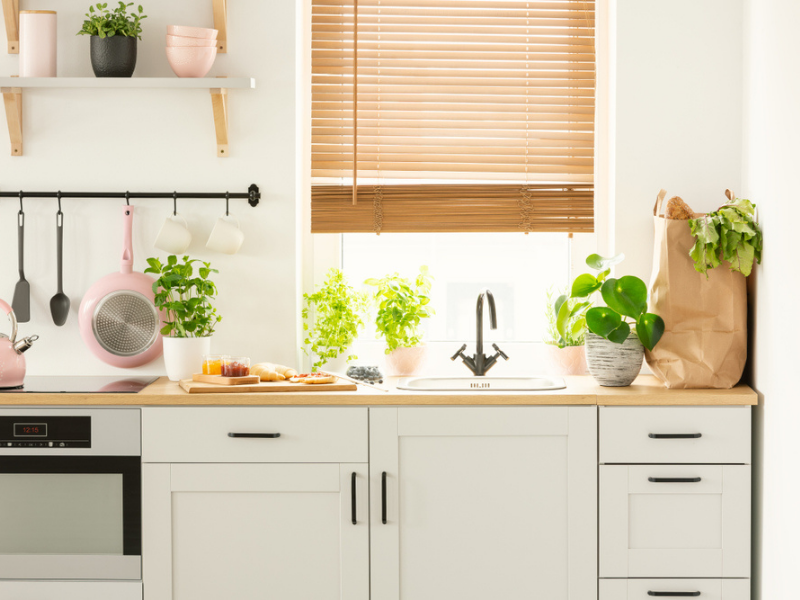
Kitchen makeovers sit atop many homeowners’ wish lists, but they can be stressful and costly. However, there are simple projects you can tackle that will give your kitchen the look and feel of a total overhaul without breaking the bank.
Simple Projects
Backsplash
Giving your backsplash a makeover can do wonders for your kitchen. Get creative with colors or patterns that accentuate your home. Subway tiles are a common choice for a clean look. For homeowners looking to make more of a statement, mirrored and metallic finishes have become more popular in recent years. If your kitchen is in need of color, look to your backsplash project as an opportunity to brighten it up.
Lighting
Lighting is the gateway to changing the mood of your kitchen in an instant. Experiment with new light switch covers that emphasize your kitchen’s color palette. If you’re looking for a new centerpiece, linear pendant lights will deliver that coveted farmhouse feel. For a more regal look, explore chandeliers for a classy feel.
Freshen up your colors
Adding color is an affordable way to liven up your kitchen. Look for vibrant cookware and dinnerware and use open shelving to give some color splashes at eye level. Because of their large surface area, kitchen islands are a great place for color. Try painting around the exterior or the countertop to turn it into an eye-popping feature.
Organization
Drawers and Cabinets
Look for simple solutions that will work in your newly made-over kitchen. Drawer dividers can do wonders for creating space and staying organized. The insides of cabinet doors make a great home for spice racks. Set aside time to dig through your drawers and cabinets. Sort out what you need to get rid of and what will stay as you declutter.
Overhead Storage
A common space-saving tactic in restaurant kitchens is to hang pots and pans. This keeps heavy hardware organized, frees up cabinet space, and brings a touch of décor to your kitchen. Explore the different styles to fit the look of your kitchen including stainless steel, wood, copper, and more.
Things to Keep in Mind
If you’re looking to incorporate some bigger projects into your kitchen makeover, be sure to keep the following tips in mind to stay on budget and on schedule.
Buying cheap can be costly
When it comes to appliances, flooring, cabinets and other fixtures of your kitchen, it may be tempting to say yes to cheaper options. However, cheap materials and appliances can break easily and often require extra maintenance, which can lead to greater costs in the long run. If something is slightly more expensive but still fits in your budget, know that the higher quality will likely pay off.
Choose your appliances early
It’s easy to direct your attention to cabinets and countertops in the beginning stages of your remodel. However, the last thing you want to have happen is to pick those out first, only to discover that they don’t leave enough room for your dishwasher or refrigerator. Be sure to select your major appliances first, then build around them.
Consult professionals when applicable
For homeowners who are passionate about their home, it can be easy to get a little obsessive when it comes to remodeling. If you are unsure about how to proceed at any point in the process, consult a professional to guide you in the right direction. It may be helpful to seek the opinion of multiple experts and compare their answers to find the best solution.
These ideas offer simple ways to freshen up the heart and soul of your home. Whether your household is big or small, choose your projects, set a budget, and have fun improving your kitchen.

 Facebook
 X
X
 Pinterest
 Copy Link


")


