
 Facebook
 X
X
 Pinterest
 Copy Link

The following analysis of the Big Island real estate market is provided by Windermere Real Estate Chief Economist Matthew Gardner. We hope that this information may assist you with making better-informed real estate decisions. For further information about the housing market in your area, please don’t hesitate to contact your Windermere agent.
Regional Economic Overview
The impact of COVID-19 on the Big Island’s economy remains significant. That said, jobs started to return after the spike in new infections in September. The latest available employment data (November) showed that the labor market has recovered 14,650 of the jobs that were shed and that employment is now only 6,850 jobs lower than in February of 2020. The unemployment rate on the Island continues to improve but still stands at 9.8%. For perspective, the rate in November of 2019 was only 3.3%. All of the islands continue to suffer from slow economic growth, but I remain hopeful that jobs will continue to return—assuming new infection rates do not go up again.
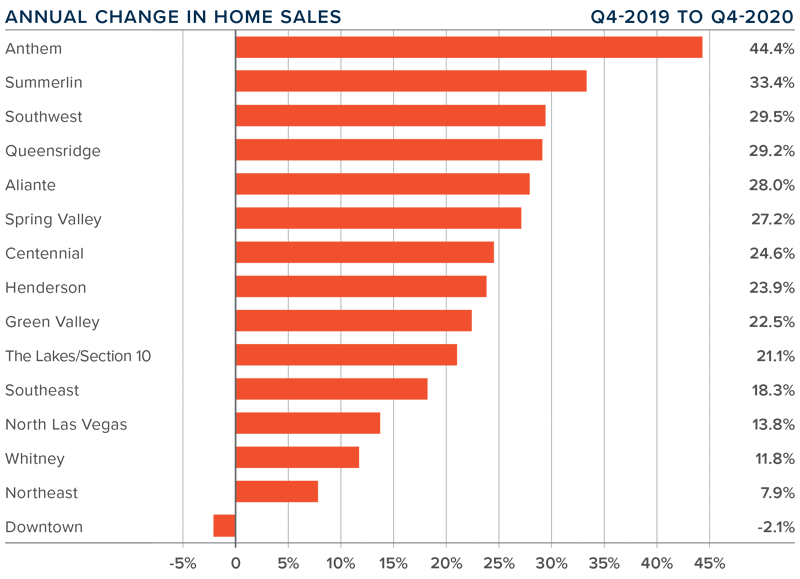
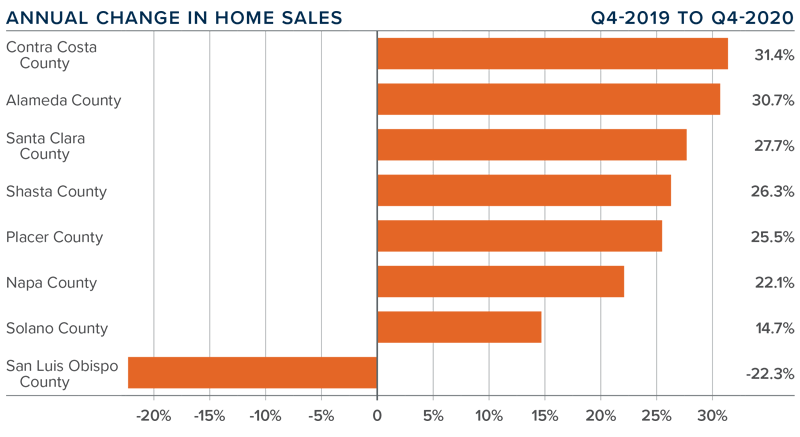
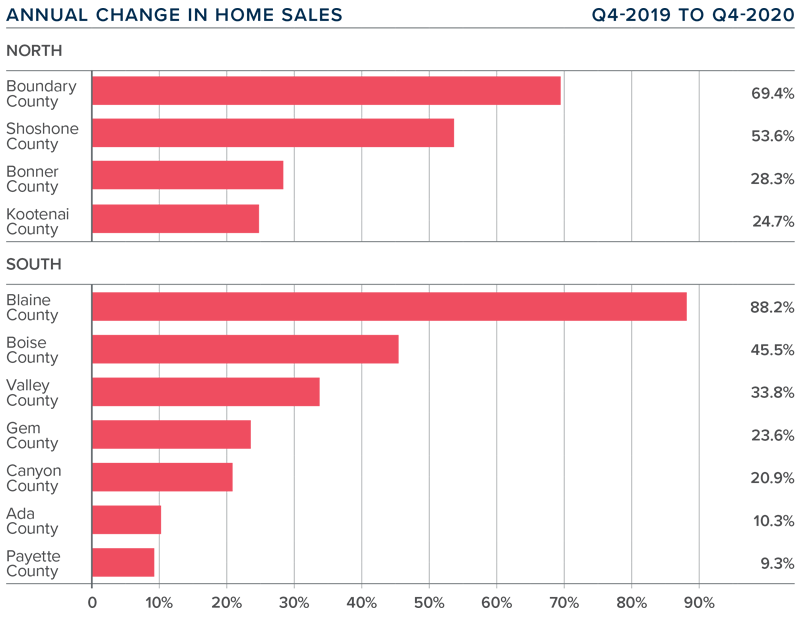
big island of hawaii Home Sales
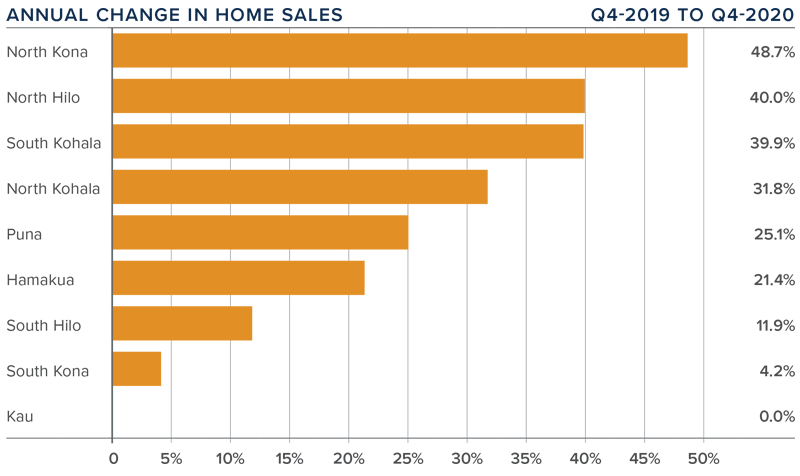
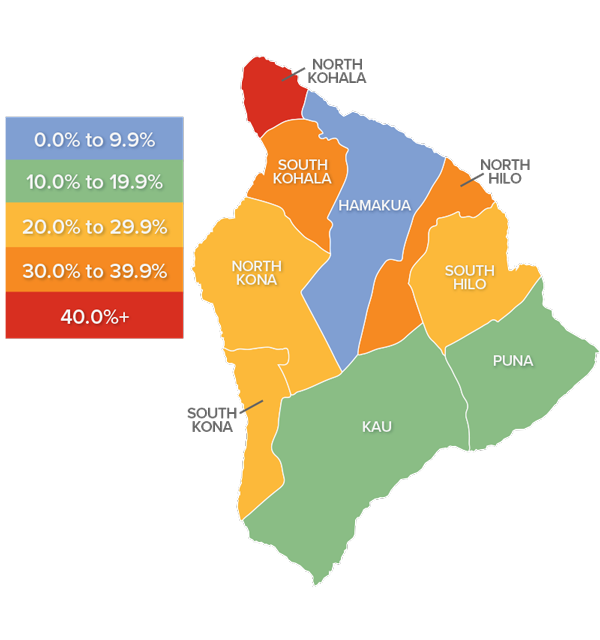
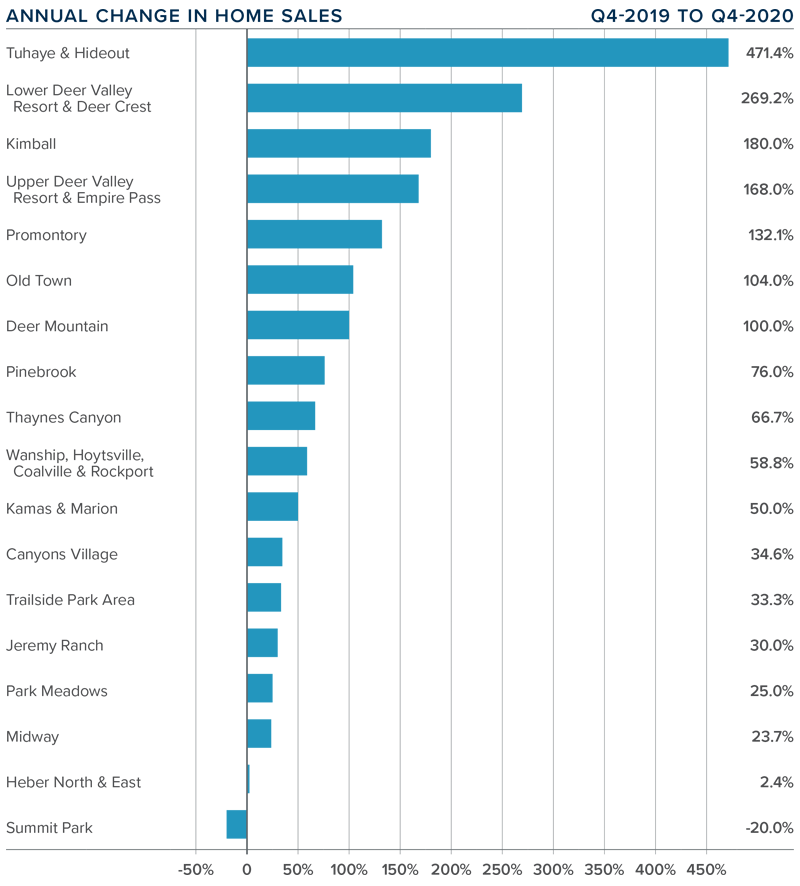
❱ In the fourth quarter of 2020, 1,083 homes sold on the Big Island. This was an increase of 30.5% compared to the final quarter of 2019 and a significant 21.7% higher than in the third quarter of 2020.
❱ Sales were static in Kau but higher in all other markets. North Kona and North Hilo saw significant increases in sales. All but two markets saw sales rise by double digits.
❱ The growth in sales came even though inventory levels were 33.5% lower year-over-year. The average number of homes for sale in the quarter was also down 14.4% from the third quarter of 2020.
❱ Pending home sales fell .9% compared to the third quarter of 2020, but this can most easily be attributed to a lack of supply of homes to buy—not a lack of demand.
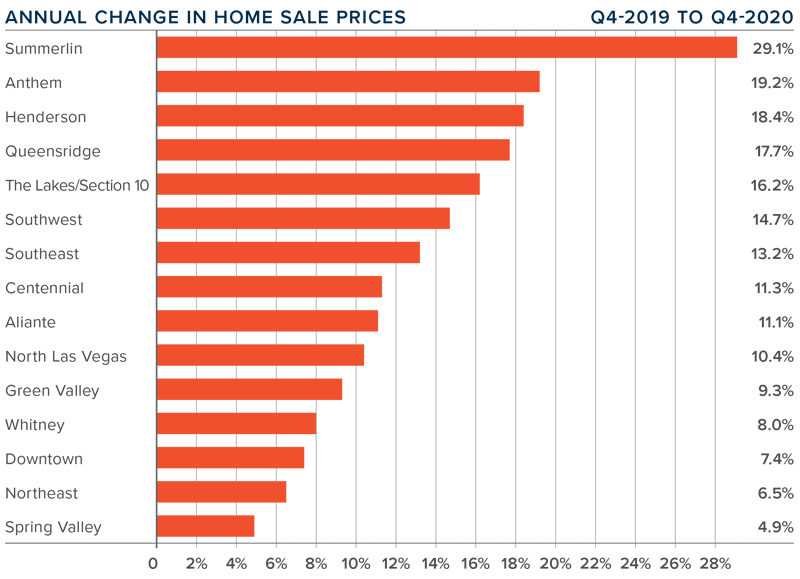
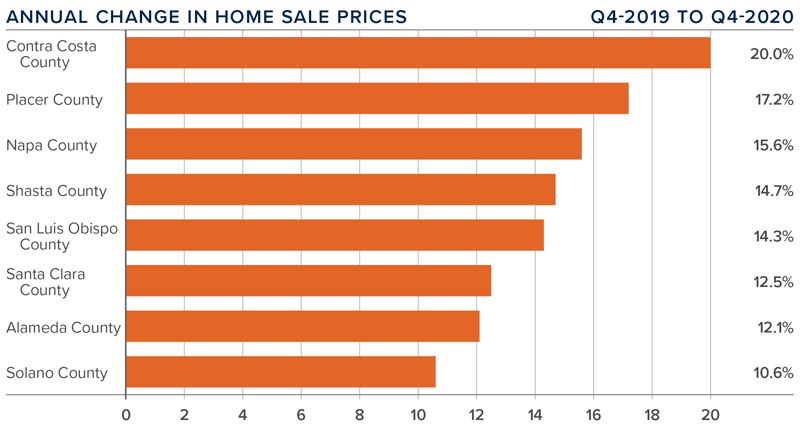
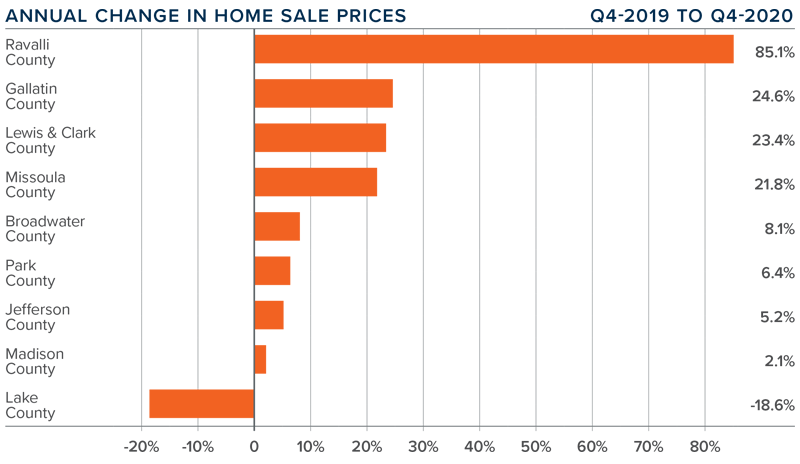
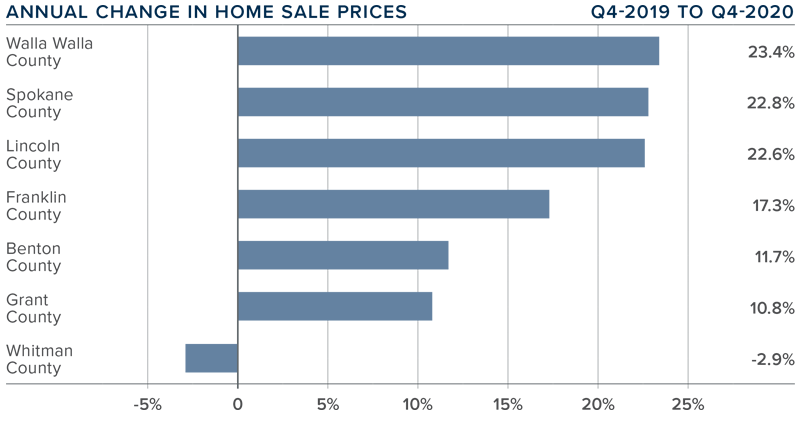
big island of hawaii Home Prices
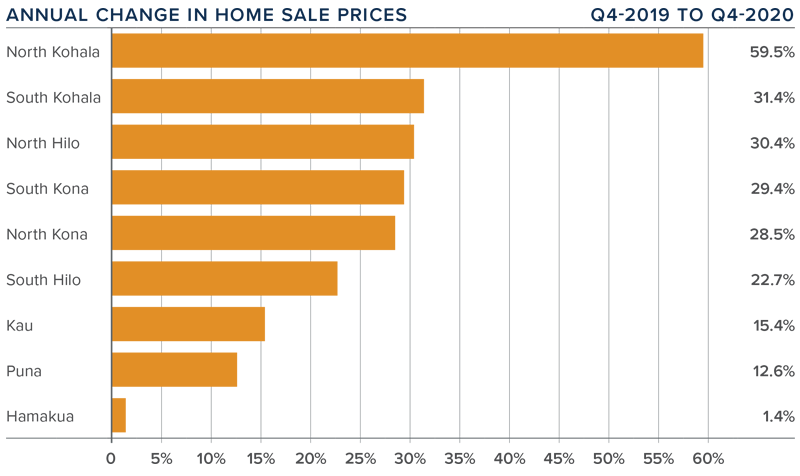
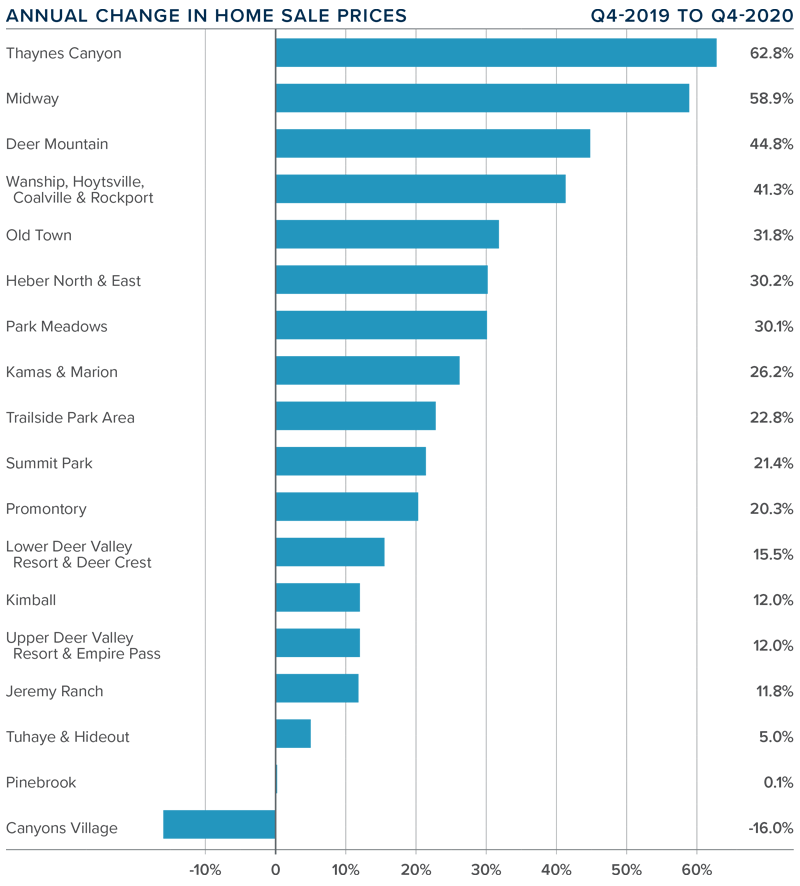
❱ The average home price on the Island rose an impressive 33.9% year-over-year to $775,902. Prices were also 23.2% higher than in the third quarter of 2020.
❱ Affordability continues to be an issue, but competitive mortgage rates and the desire for vacation homes kept demand from mainland buyers very robust.
❱ The substantial increase in average sale prices was driven by significant price growth in North and South Kohala, but all markets except Hamakua saw double-digit price growth compared to a year ago.
❱ Given the events of 2020, the housing market has recovered very admirably.
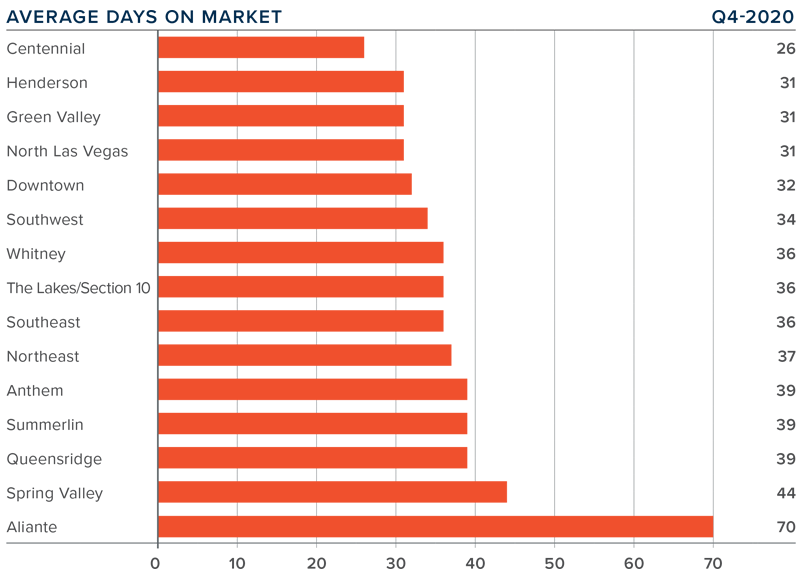
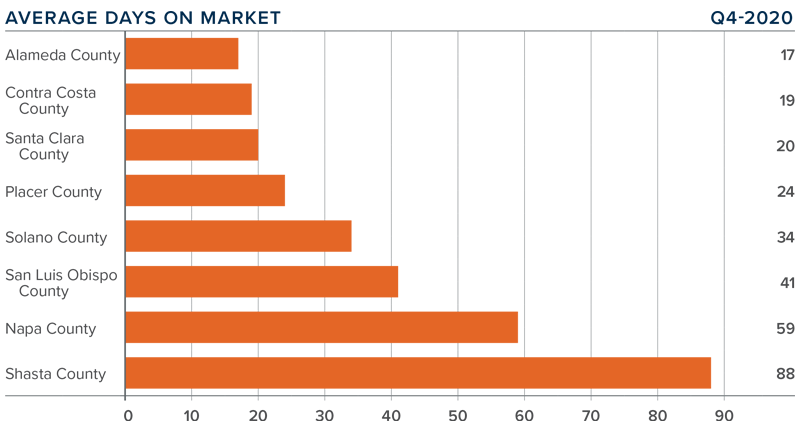
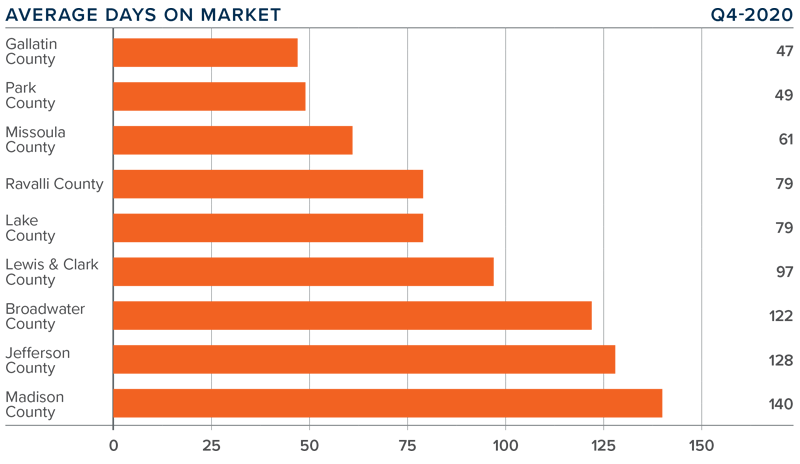
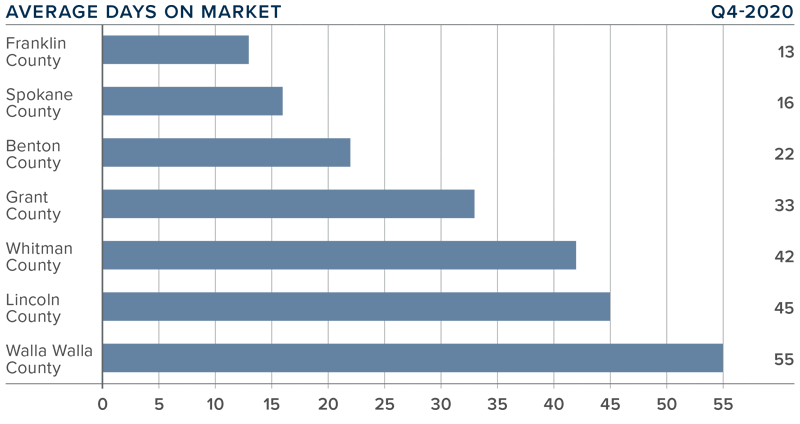
Days on Market
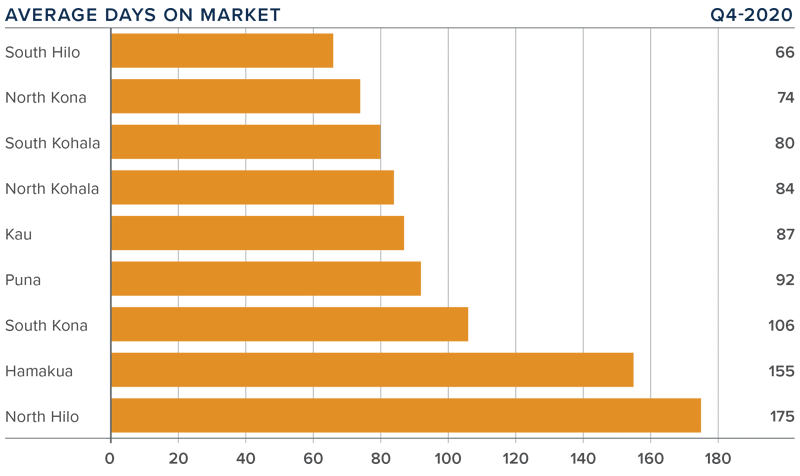
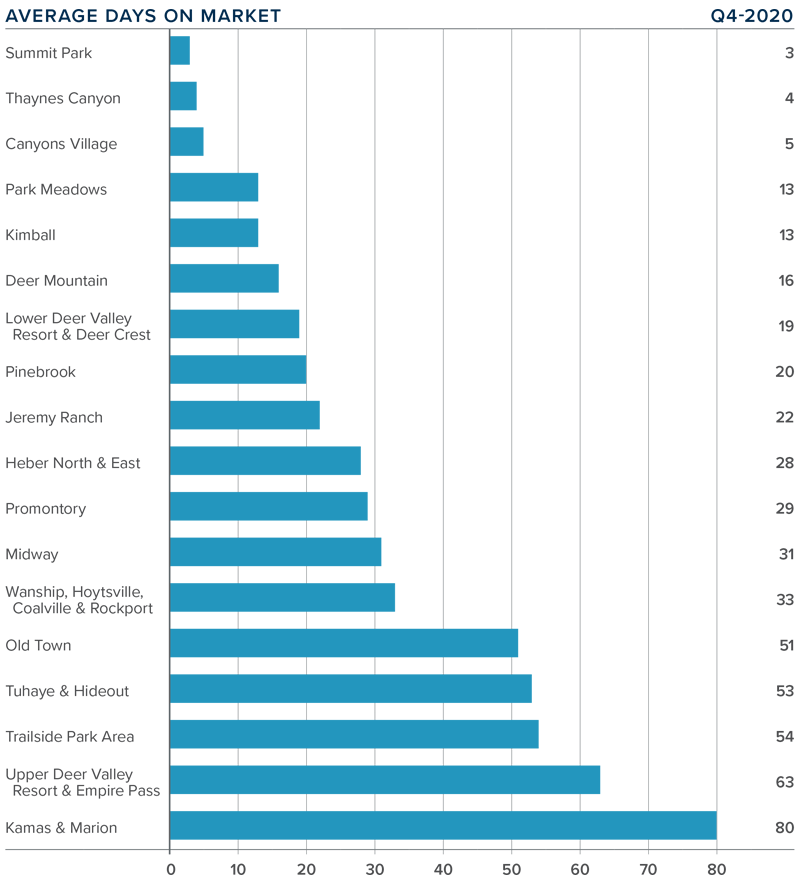
❱ The average time it took to sell a home on the Big Island dropped one day compared to the final quarter of 2019.
❱ The amount of time it took to sell a home dropped in North & South Kohala, North Kona, Kau, and South Hilo, but rose in the other four markets.
❱ It took an average of 102 days to sell a home in the fourth quarter, with the fastest sales occurring in South Hilo and the slowest in North Hilo.
❱ It took four fewer days to sell a home in the fourth quarter of 2020 than in the third.
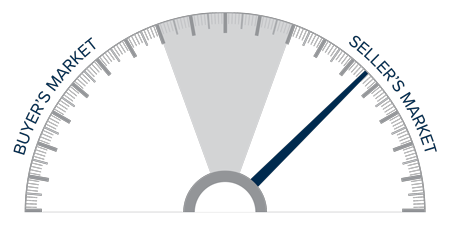
Conclusions
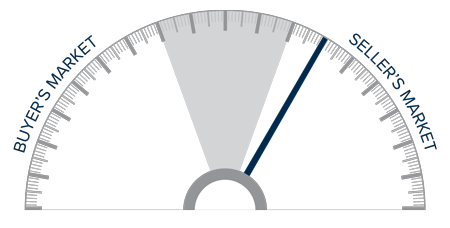
This speedometer reflects the state of the region’s real estate market using housing inventory, price gains, home sales, interest rates, and larger economic factors.
Even though the economy and job market are still suffering from the fallout of COVID-19, the housing market is recovering nicely.
Demand appears to be in place, but buyers who want to get into the market are still finding limited choices, which has allowed prices to continue to rise at very significant rates. Even though I anticipate mortgage rates will not drop much further, demand is likely to continue to be strong. Therefore, I am moving the needle back a bit more in favor of home sellers.
About Matthew Gardner

As Chief Economist for Windermere Real Estate, Matthew Gardner is responsible for analyzing and interpreting economic data and its impact on the real estate market on both a local and national level. Matthew has over 30 years of professional experience both in the U.S. and U.K.
In addition to his day-to-day responsibilities, Matthew sits on the Washington State Governors Council of Economic Advisors; chairs the Board of Trustees at the Washington Center for Real Estate Research at the University of Washington; and is an Advisory Board Member at the Runstad Center for Real Estate Studies at the University of Washington where he also lectures in real estate economics.


")


