
 Facebook
 X
X
 Pinterest
 Copy Link

Each year, design pros eagerly await the Color of the Year announcement from the experts at Pantone®. No matter what the hue, it’s always sure to make a splash—and home goods are no exception. From appliances and décor to tile and paint, manufacturers will start rolling out options to match (and complement) the Pantone Color of the Year.
Pantone® Ultra Violet is the pick for 2018. This is no shrinking violet: It’s a deep blue-purple that isn’t for the shy. No wonder that the Pantone announcement referenced icons known for showmanship like David Bowie, Prince and Jimi Hendrix.
Embracing a color this bold into your home might seem like a giant leap, but it could make a big mood difference in your home during the long, grey days of Seattle winters. We have assembled a few ways to incorporate Ultra Violet into your home – some large and some small.
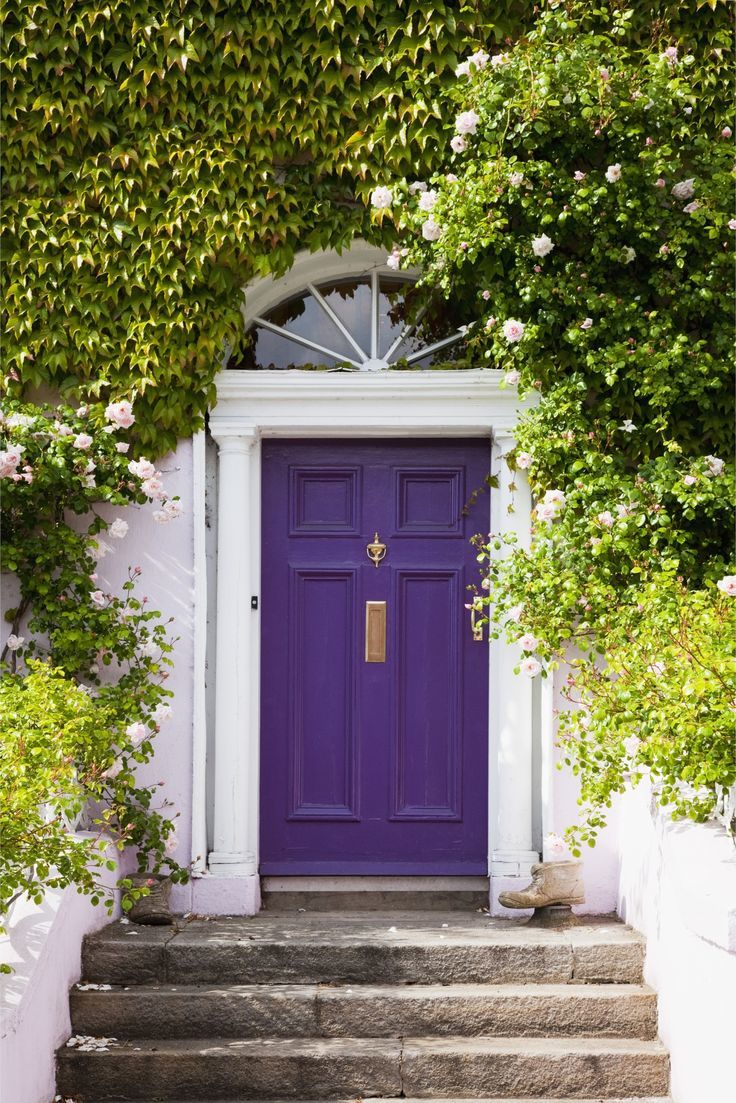
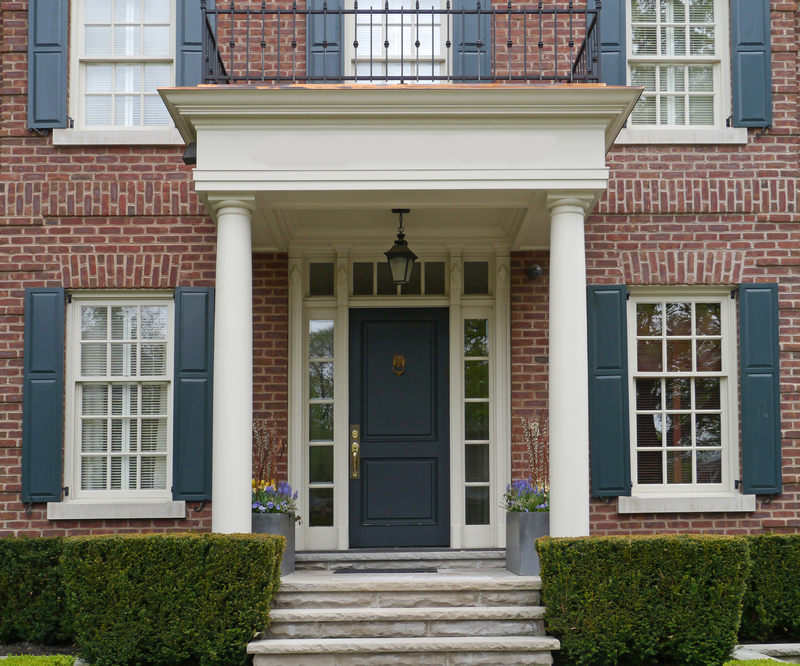
Make an Entrance
Painting your front door adds instant curb appeal. Red's a classic hue and teal is an up-and-comer, but this entry's regal purple is a real knockout.
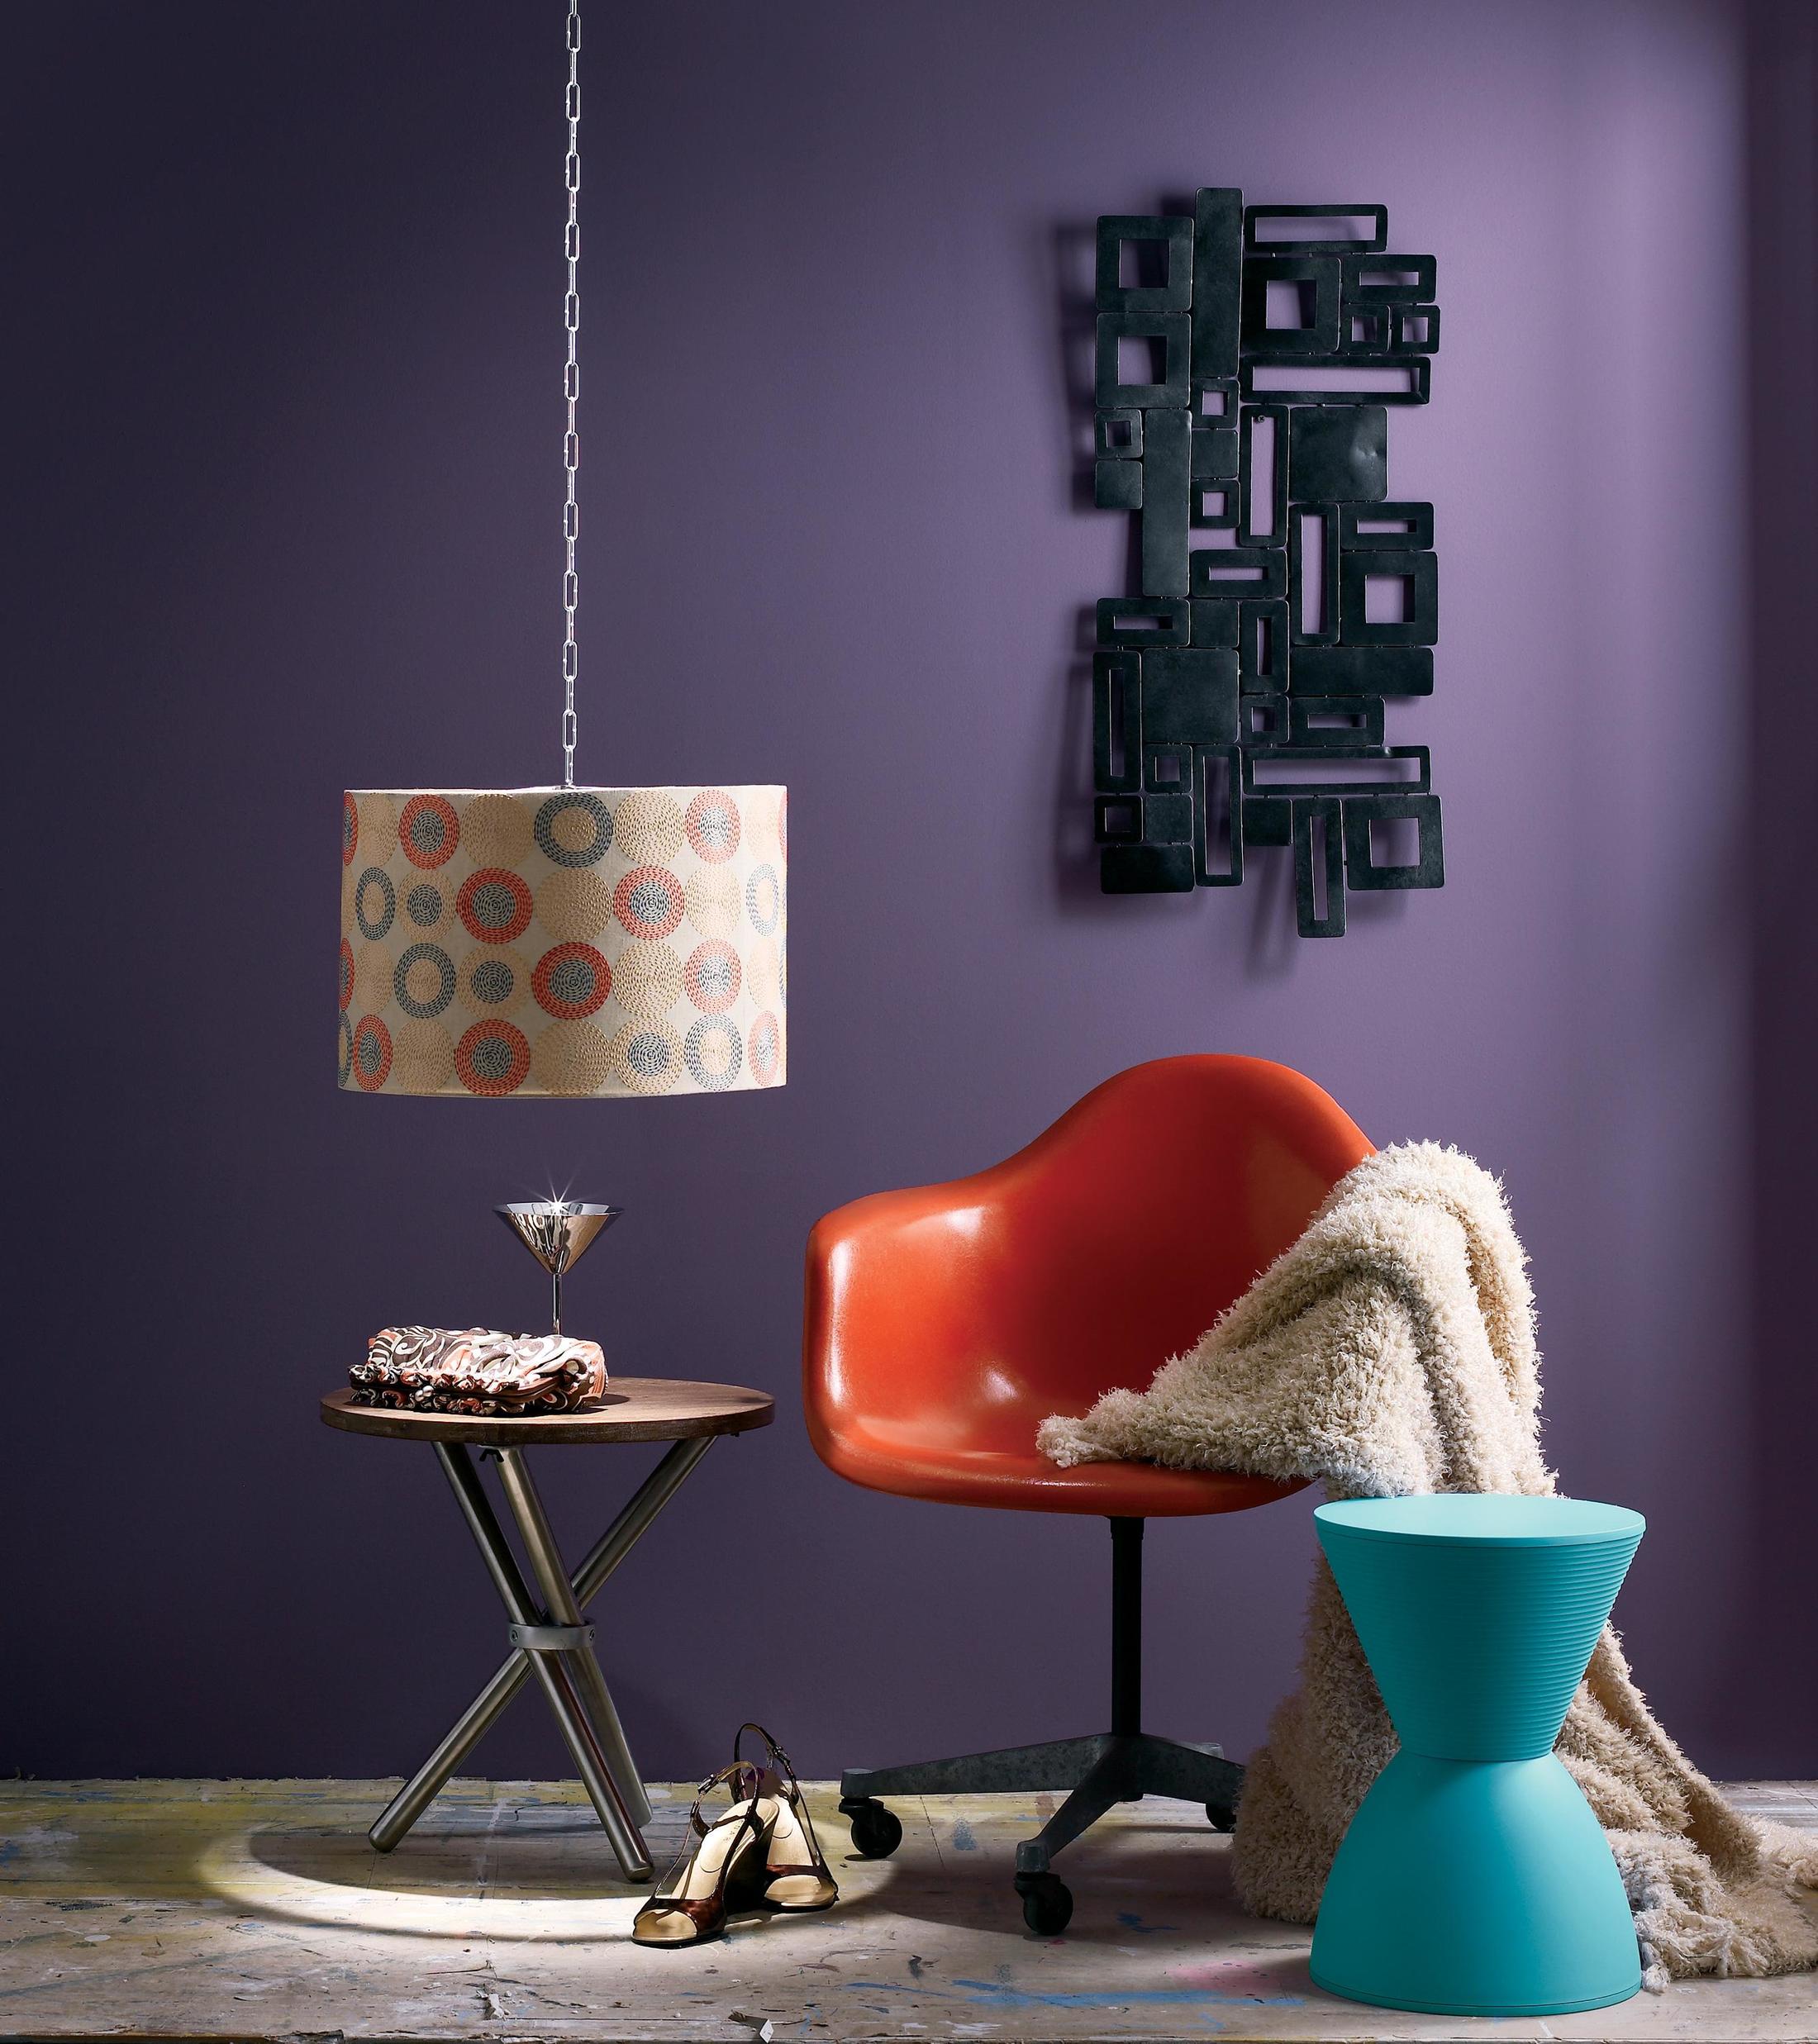
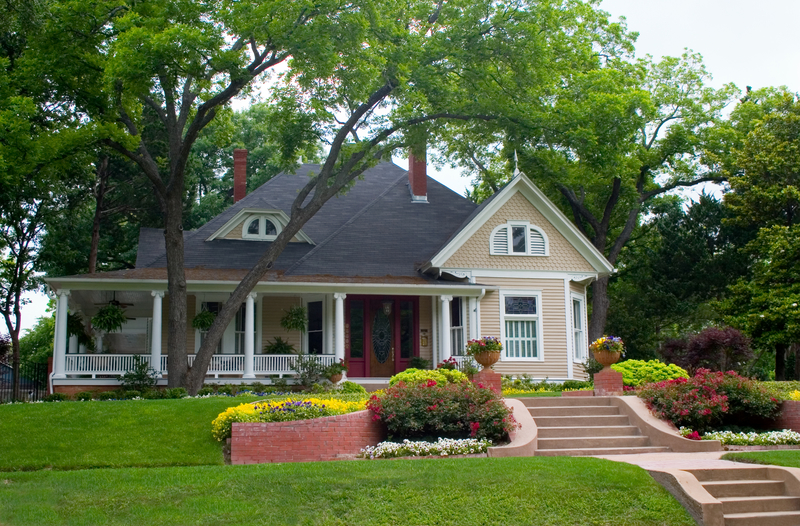
Set the Scene
Funny thing about purple: Though we tend to think of it as a scene-stealer, cooler shades in the blue-gray range can work almost like neutrals. Here, purple walls marry an eclectic mix of midcentury-inspired décor.
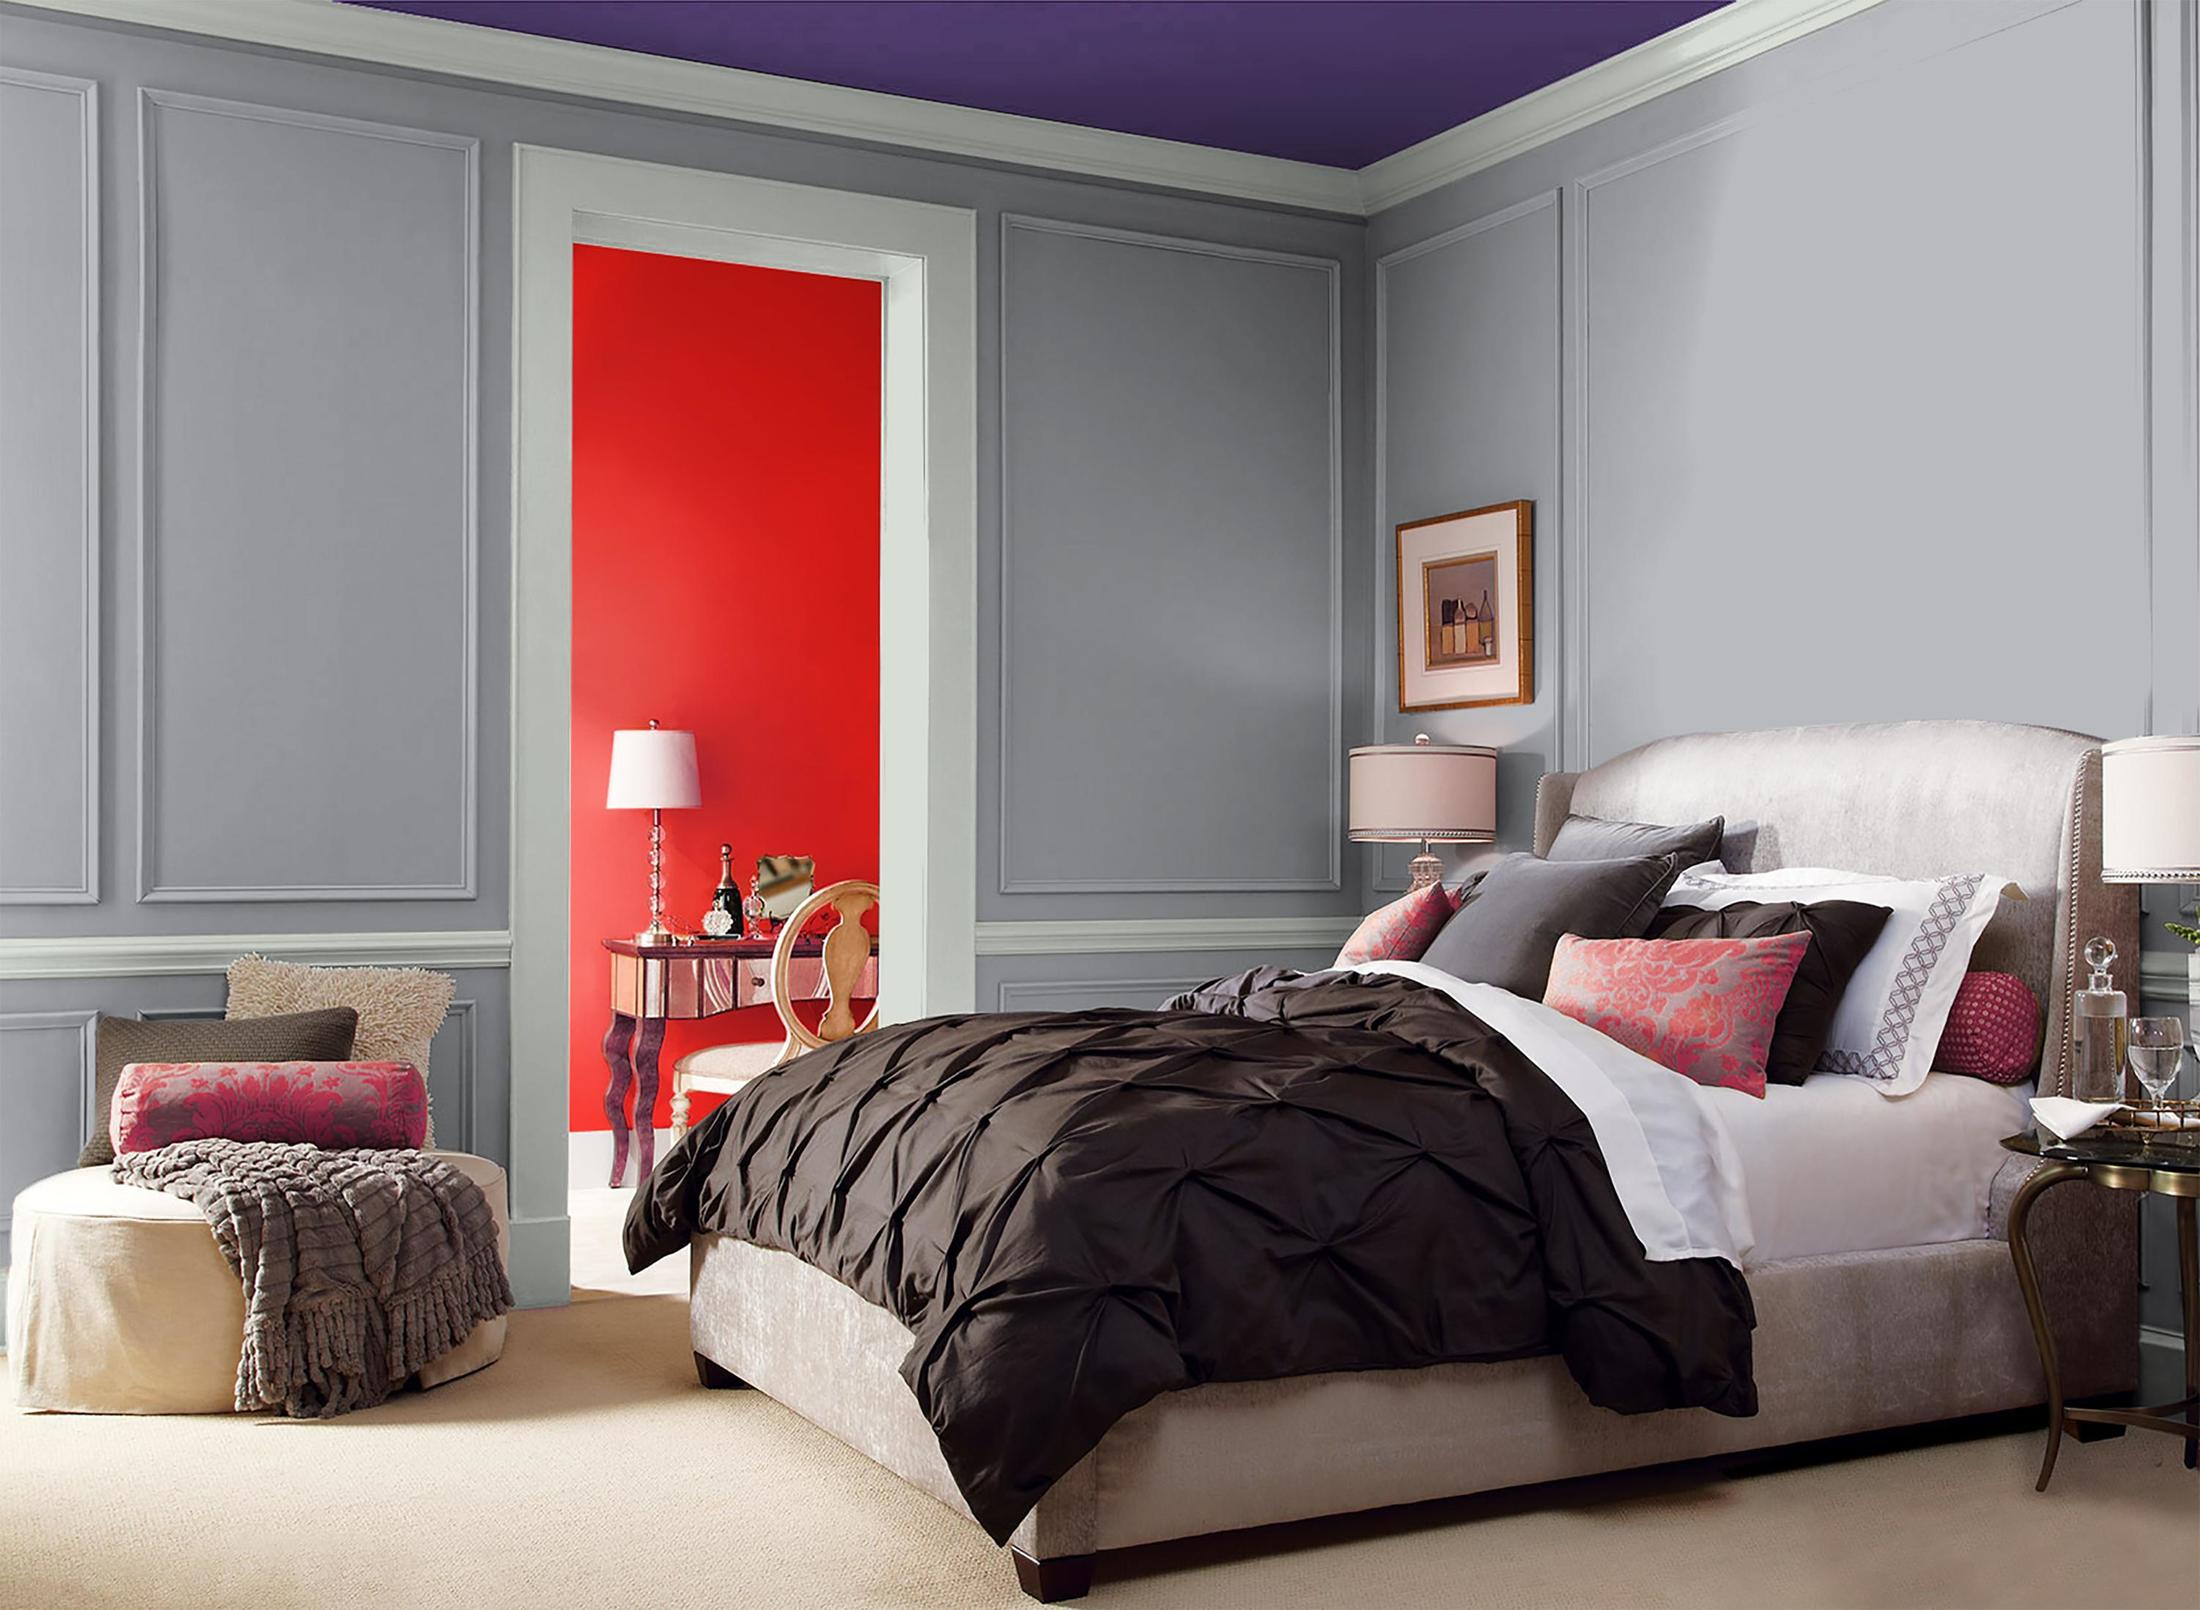
Look Around
You've seen the accent wall. How about the accent ceiling? A rich grape hue adds an unexpected twist to this bedroom's gray walls and white trim. It gets extra punch from the peek of red seen through the doorway.
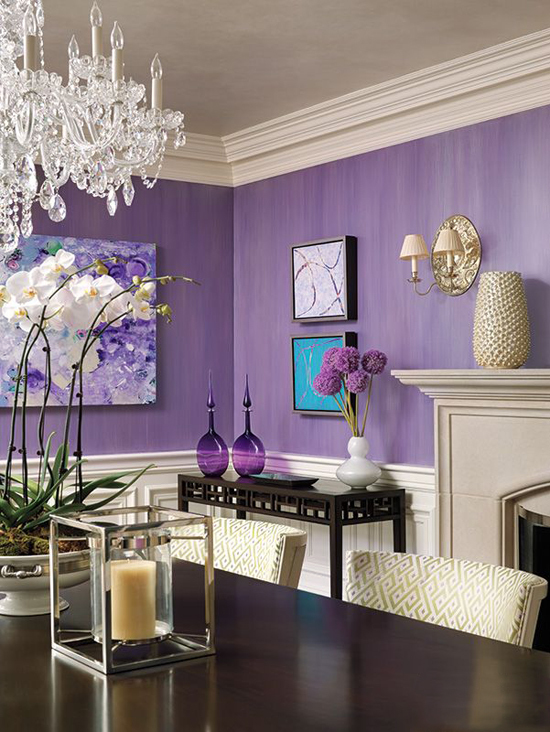
Consider Texture and Sheen
One secret to pulling off a jewel tone like these royal purple walls: Choose a matte finish. Shine plus color can be hard to pull off, but a flatter finish is, well, flattering.
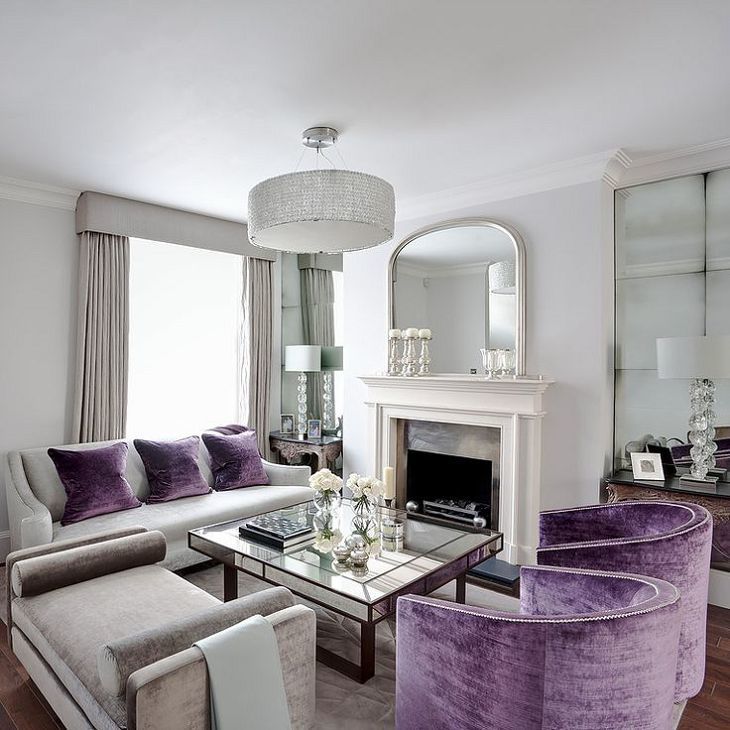
Add Statement Furniture
If you’re planning on using Ultra Violet in a bedroom or living area, consider incorporating it in a piece of statement furniture. In this case, the piece will act as the focal point of the room, since it will undoubtedly capture plenty of attention. With that in mind, bed frames, ottomans and reading chairs are excellent options to fill this role.
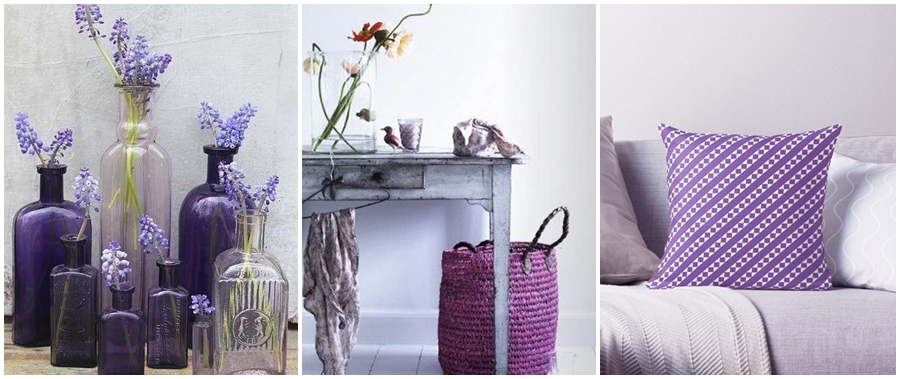
Opt for Accessories
For those who are a bit nervous about jumping into a design full of intense shades, keep in mind that you can always incorporate Ultra Violet into your accessories. These are a great starting point because they generally include lower-cost items that can easily be replaced when your tastes change or if you decide you’re not a big fan of the look.


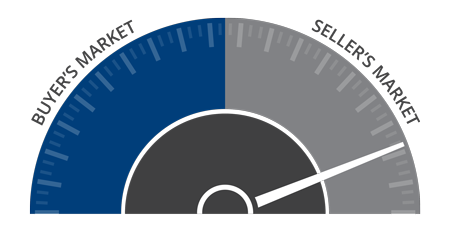
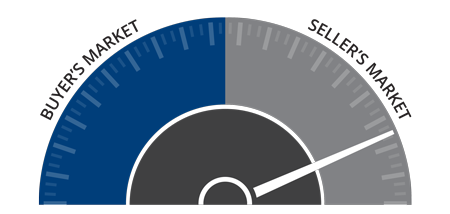
 The speedometer reflects the state of the region’s housing market using housing inventory, price gains, home sales, interest rates, and larger economic factors. Consumer confidence in the housing market seems to have returned, causing the markets in this report to perform well overall, and for home prices to continue trending upward. As mentioned in my last report, the market remains out of balance, with more buyers than sellers. Even with the modest increase in listings seen in the quarter, the market still heavily favors sellers. Unless we see a major increase in the number of homes for sale in early spring, the market will continue to see above-average home price growth.

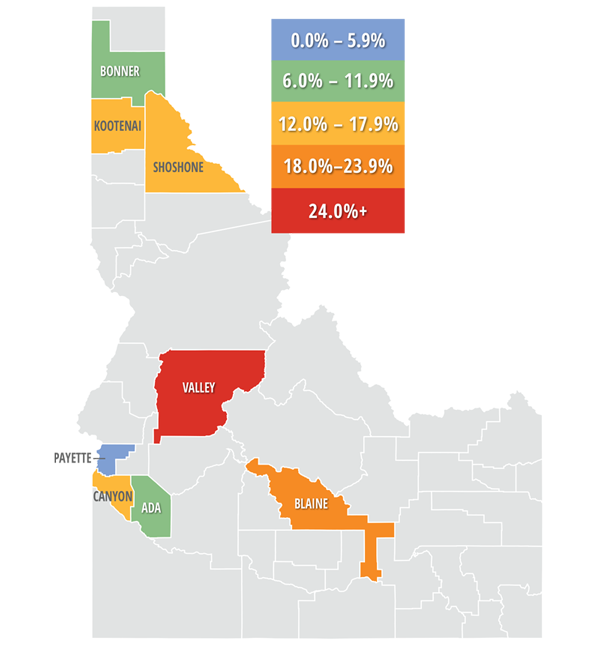
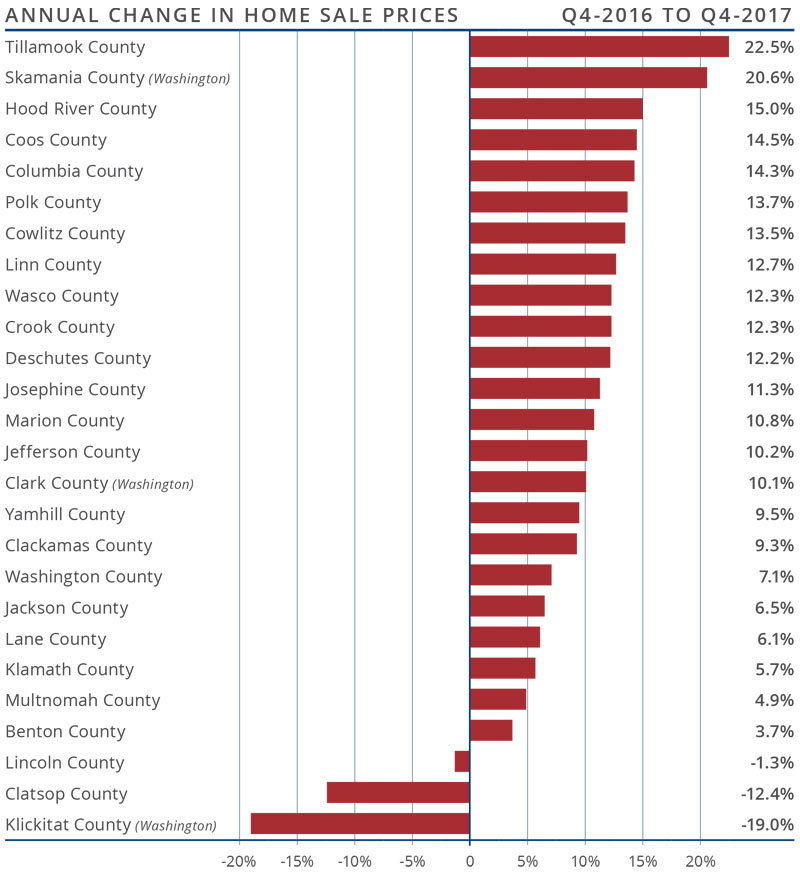
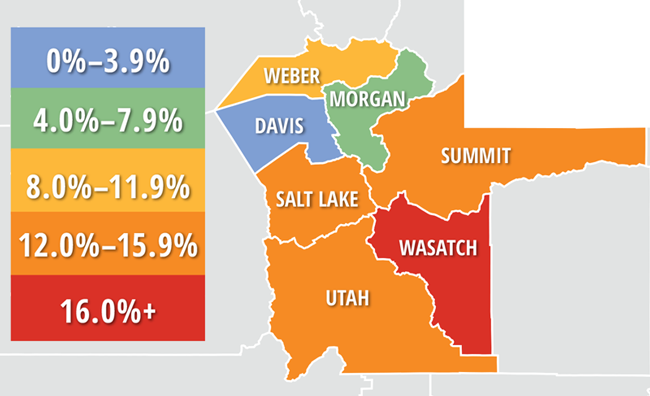
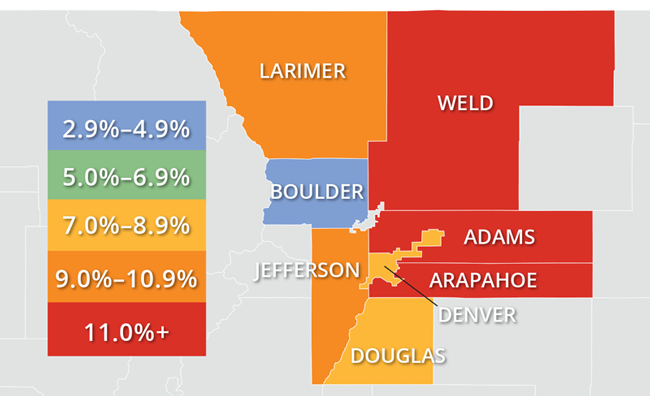
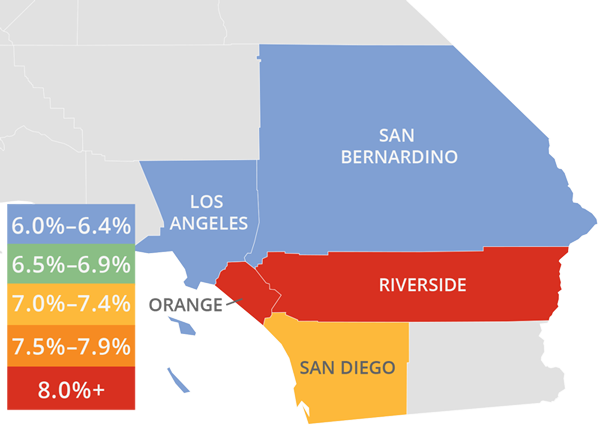
 Year-over-year, the average home price in the region rose 9.5% to $241,667. Price growth has been moderating across the region, but several counties continue to see well-above-average appreciation.
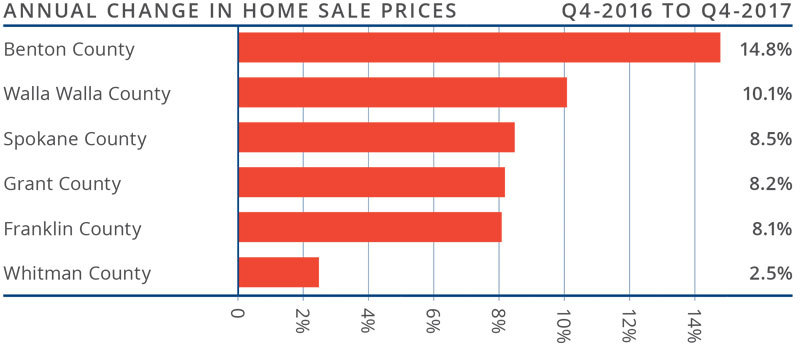
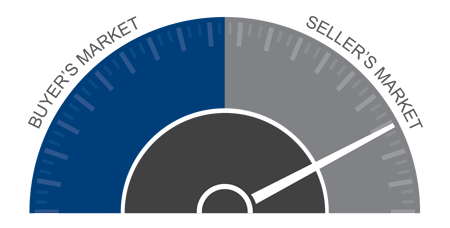
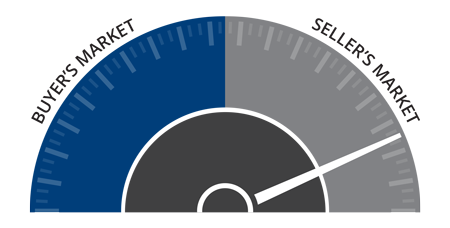 This speedometer reflects the state of the region’s housing market using housing inventory, price gains, home sales, interest rates, and larger economic factors. Given the drop in listings, rising pending and closed sales, and climbing home prices, I have nudged the needle just a little more in favor of sellers. We are all hoping for a jump in new listings in the first quarter, which would help would-be buyers. For now, however, the market clearly favors sellers.
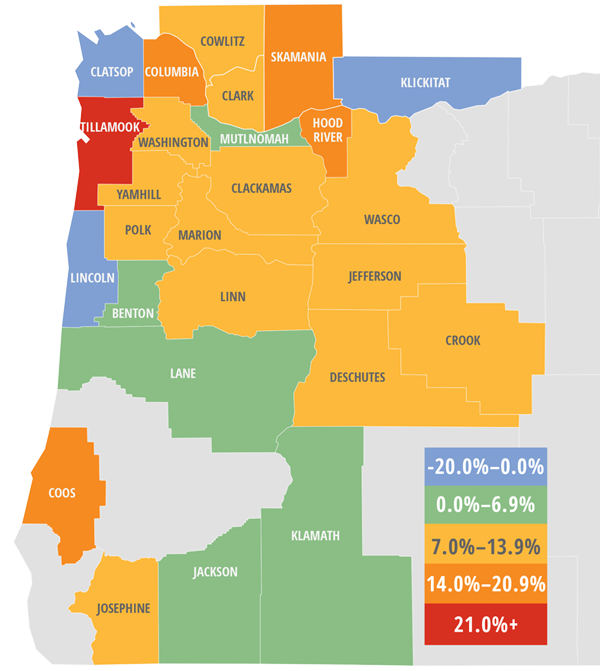
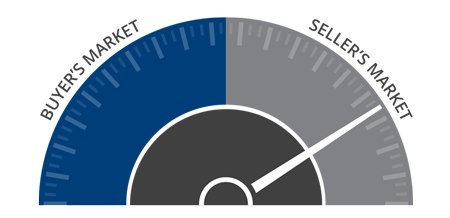 The speedometer reflects the state of the region’s housing market using housing inventory, price gains, home sales, interest rates, and larger economic factors. Housing markets throughout Oregon continue to benefit greatly from the healthy regional economy.
 Given the considerable competition for the few homes for sale in the fourth quarter, prices continue to rise at fairly rapid rates. Prices in the region were up 11.6% yearover-year to an average of $342,507.
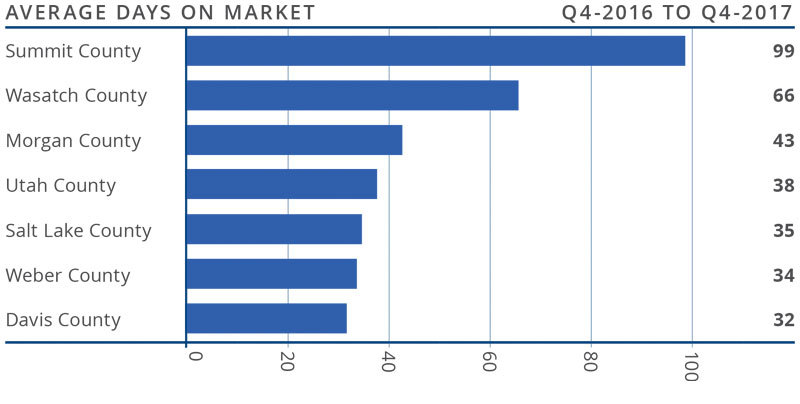
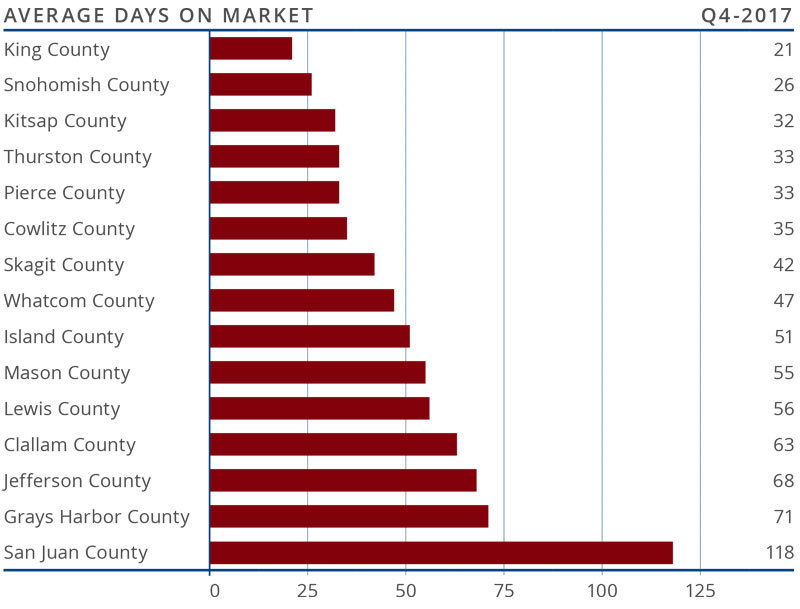
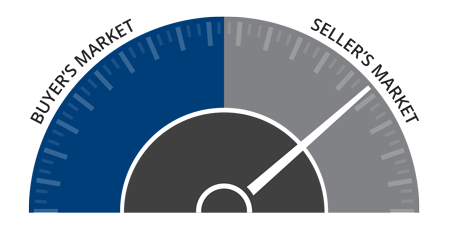 This speedometer reflects the state of the region’s housing market using housing inventory, price gains, home sales, interest rates, and larger economic factors. For the fourth quarter of 2017, I left the needle at the same point as third quarter. Supply issues persist and this continues to create competition for well-priced and well-located homes. The increase we’re seeing in the amount of time it takes to sell a home may suggest that the market is either getting weary of all the competition or buyers are delaying their purchase until there are more homes to choose from.

 With continued competition for the limited number of available homes, prices continued their upward trend. Average prices were up 9.8% year-over-year to a regional average of $431,403, which was slightly higher than the third quarter of 2017.

 This speedometer reflects the state of the region’s housing market using housing inventory, price gains, home sales, interest rates, and larger economic factors.

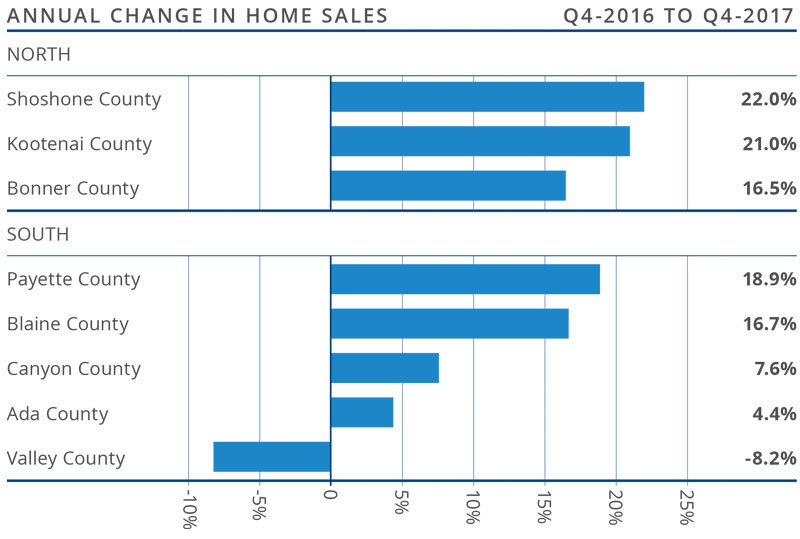
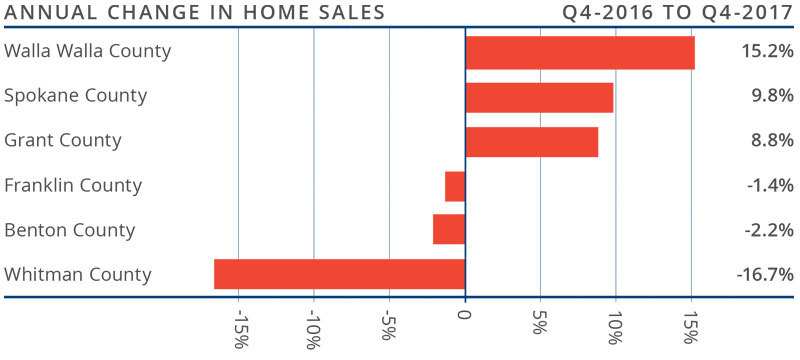
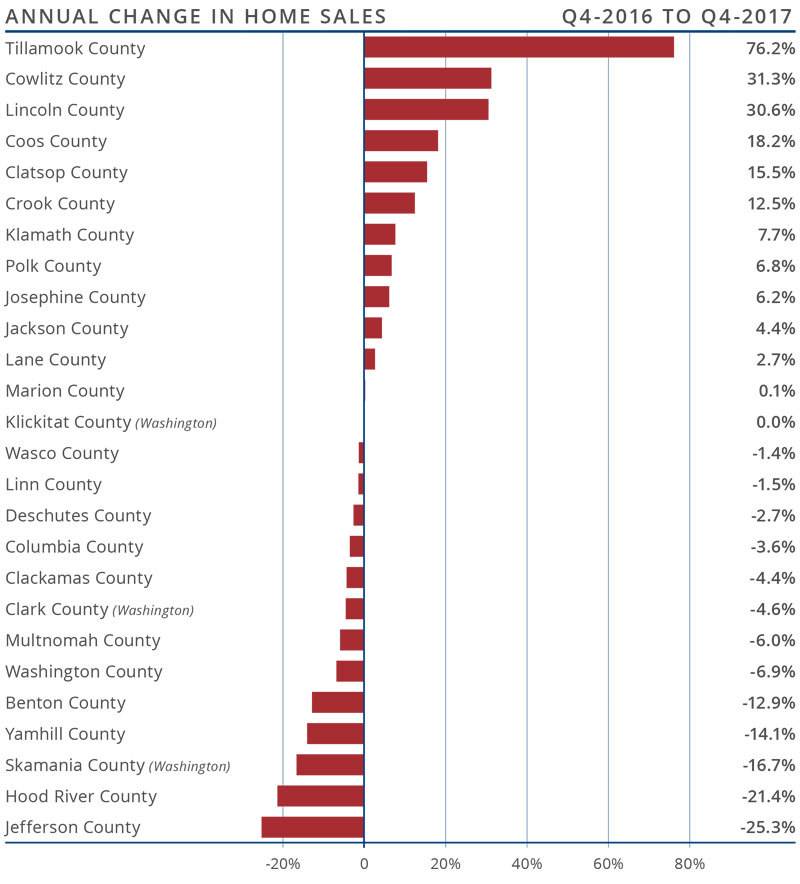
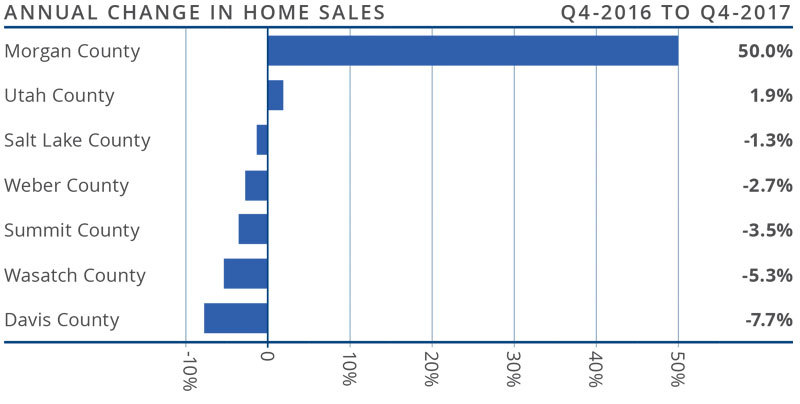
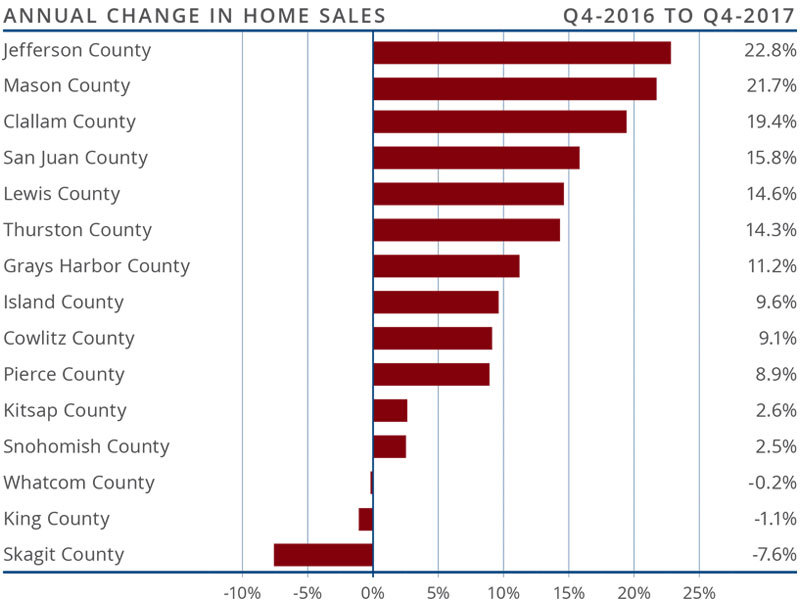
 There were 45,342 home sales in the final quarter of 2017. This was 2.4% lower than the same period in 2016.


 The speedometer reflects the state of the region’s housing market using housing inventory, price gains, home sales, interest rates, and larger economic factors.
 Employment in the Las Vegas metropolitan area continues to moderate but, with a year-over-year employment growth rate of 2.7%, the region is still performing well above the national average of 1.4%. Over the past 12 months, the area has added 25,500 new jobs. This has led to a respectable unemployment rate of 5.3%. This is the same rate as a year ago, but that should not be any cause for concern, as we have seen a fairly large increase in the labor force, which can slow the drop in the unemployment rate.
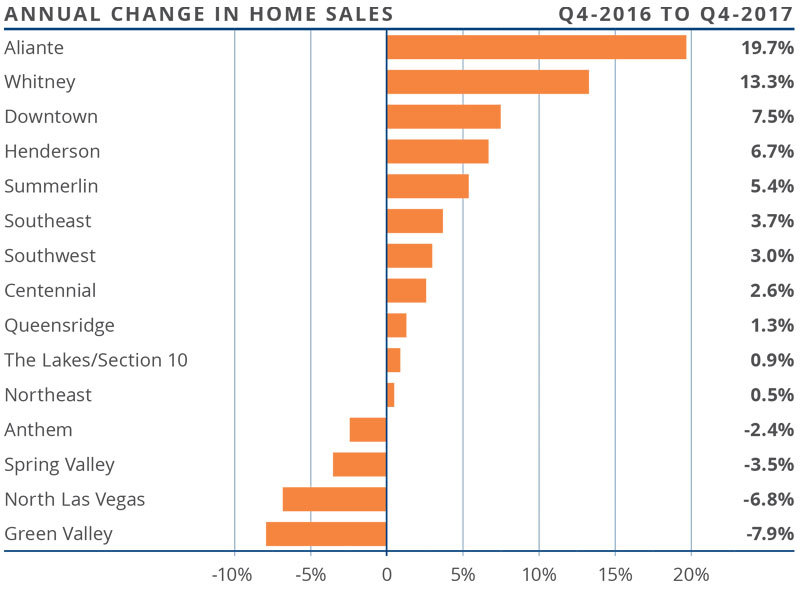
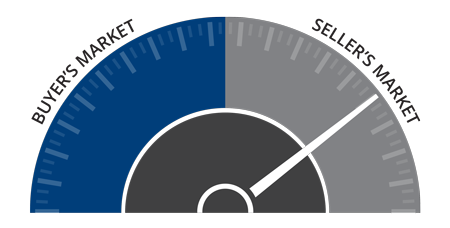
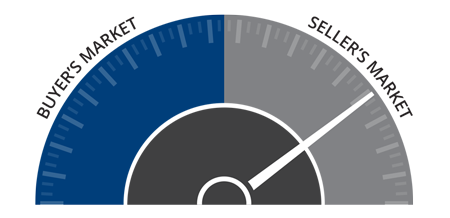 The speedometer reflects the state of the region’s housing market using housinginventory, price gains, home sales, interest rates, and larger economic factors. Employment growth in Clark County, although slowing modestly, is still very positive. This, when combined with low inventory levels and competitive mortgage rates, will push home prices higher. Given these factors, I have moved the speedometer a little further in favor of sellers.

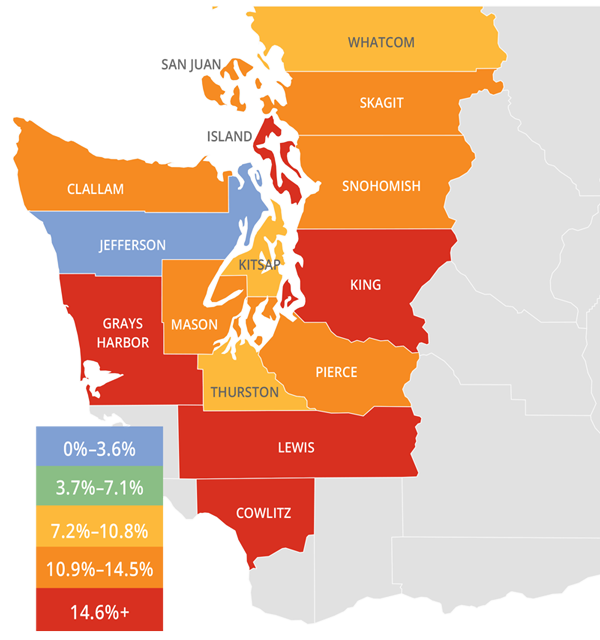 Because of low inventory in the fall of 2017, price growth was well above long-term averages across Western Washington. Year-over-year, average prices rose 12% to $466,726.
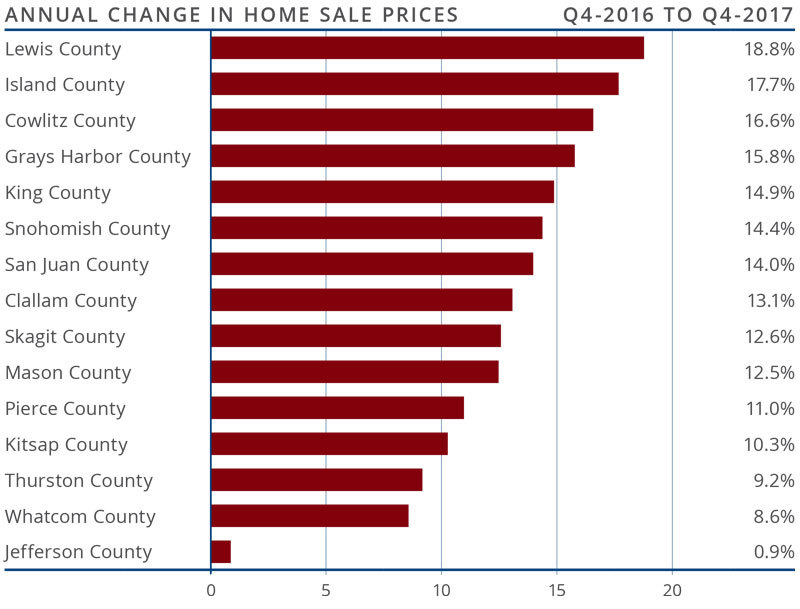
 This speedometer reflects the state of the region’s housing market using housing inventory, price gains, home sales, interest rates, and larger economic factors. For the fourth quarter of 2017, I have left the needle at the same point as third quarter. Price growth remains robust even as sales activity slowed. 2018 is setting itself up to be another very good year for housing.
")


