
 Facebook
 X
X
 Pinterest
 Copy Link

ECONOMIC OVERVIEW
The Washington State economy added 104,600 new jobs over the past 12 months. This impressive growth rate of 3.1% is well above the national rate of 1.4%. Interestingly, the slowdown we experienced through most of the second half of the year reversed in the fall, and we actually saw more robust employment growth. The counties contained in this report added 13,597 new jobs over the past 12 months, representing a respectable employment growth of 2.8%. It should be noted that the rate of growth continues to drop, but this is to be expected as the area approaches full employment.
HOME SALES ACTIVITY
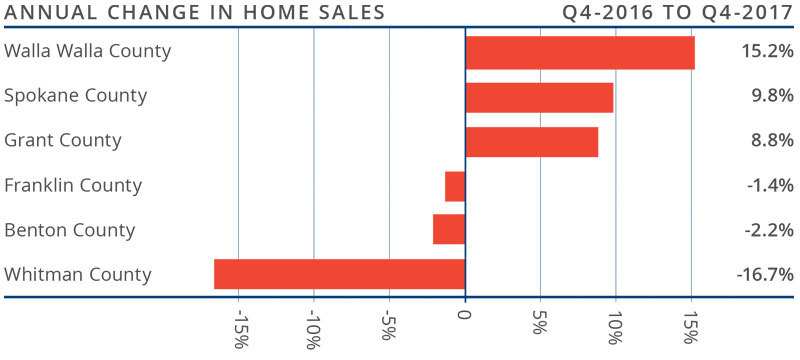
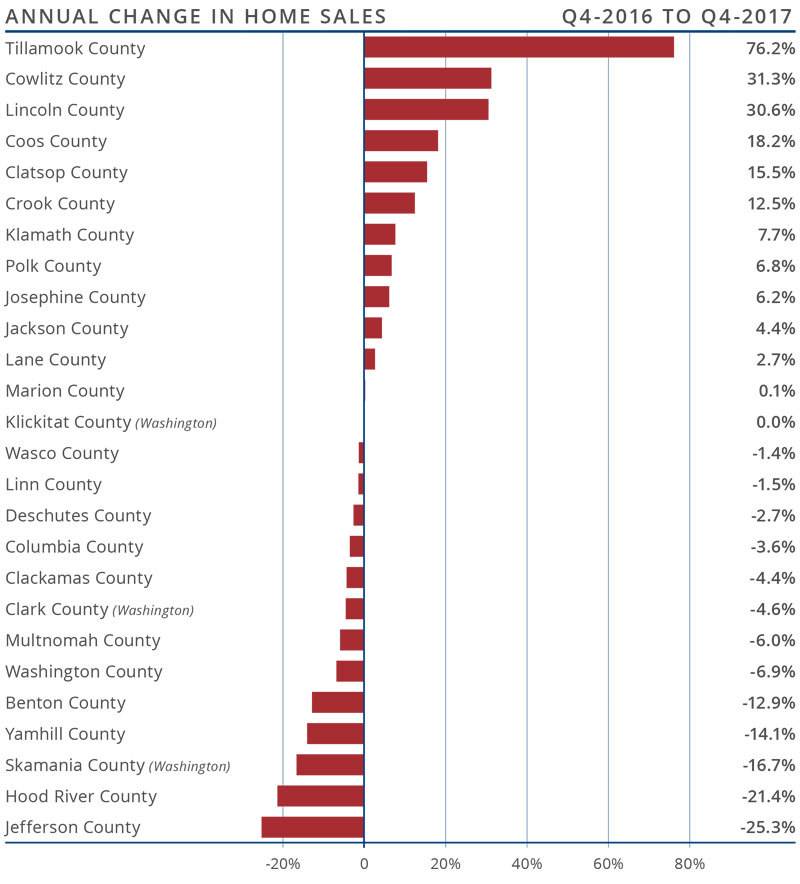
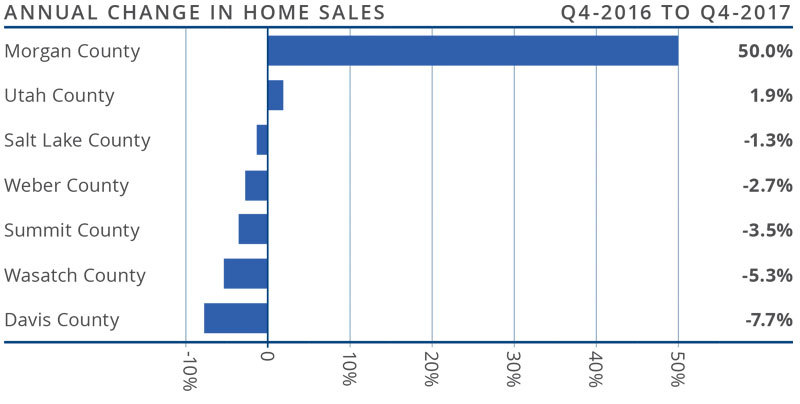
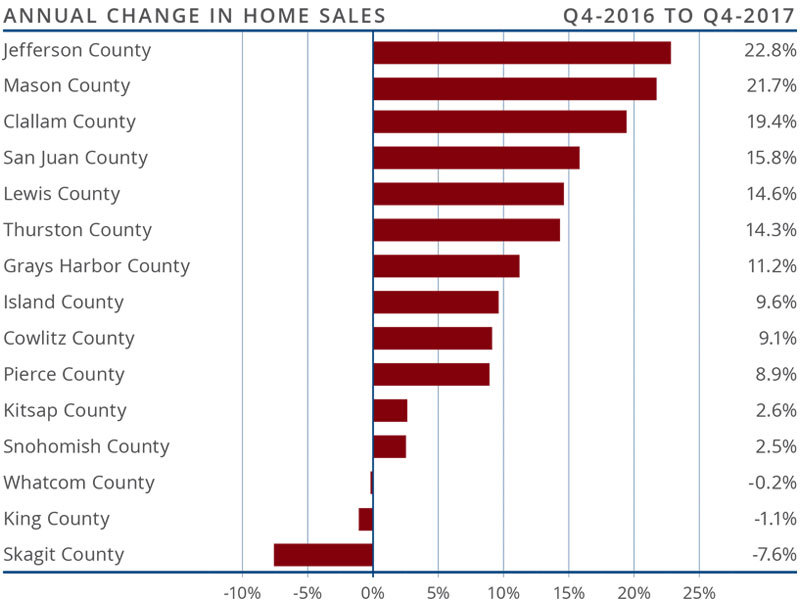
- In aggregate, home sales throughout Eastern Washington performed well in the fourth quarter, with sales rising 6.3% compared to the same quarter of 2016. Year-over-year, home sales rose in three markets and decreased in three. In total, there were 3,469 home sales in the fourth quarter.
- Sales rose at the fastest rate in Walla Walla County, which increased 15.2% over a year ago. That said, the market is relatively small, so a slight shift in sales can dramatically change the numbers.
- Sales fell in half of the counties in this report, mainly as a function of low inventory levels—a problem across the whole of Washington State.
- The number of homes for sale was down 9.3% from last year. Inventory clearly remains an issue and this will continue to push home prices higher.
HOME PRICES
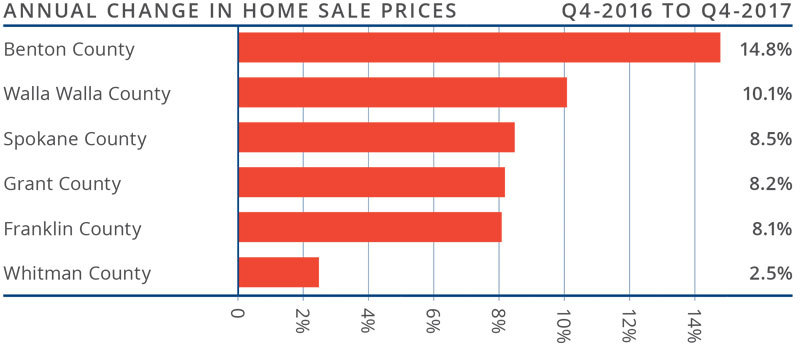
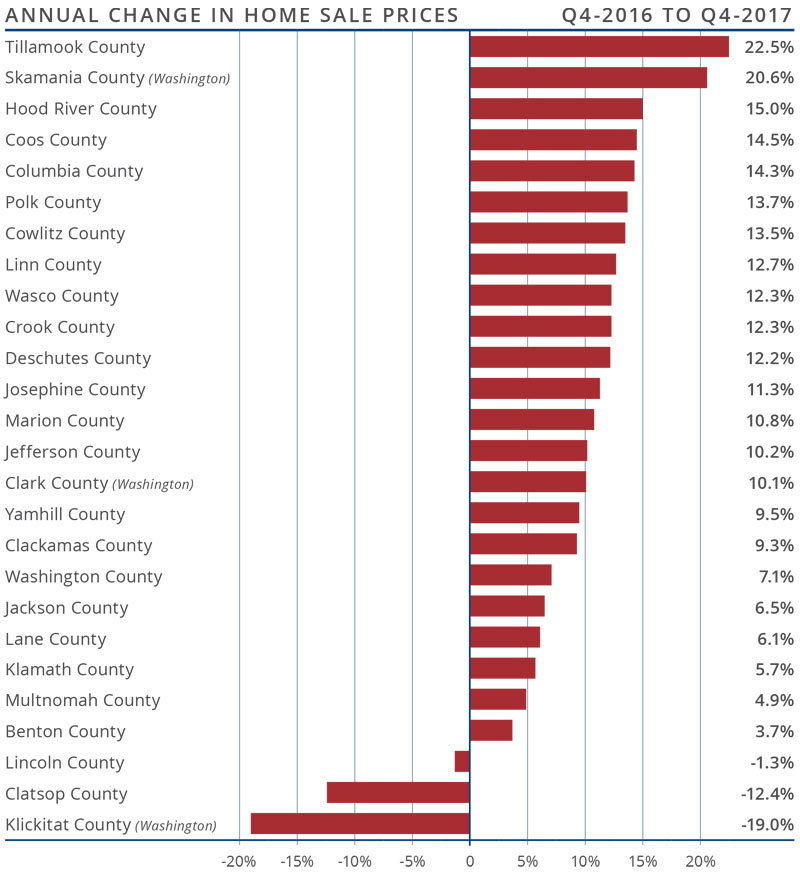
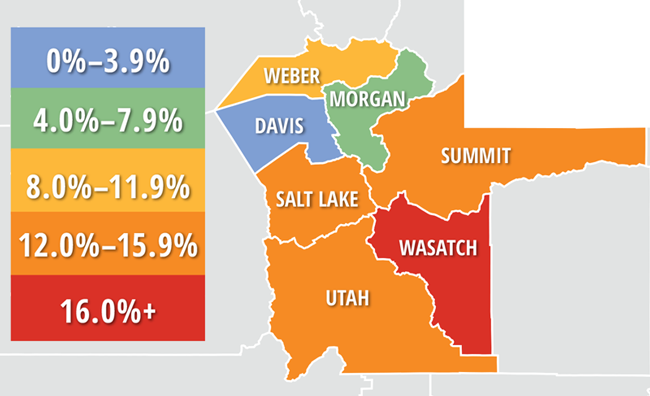
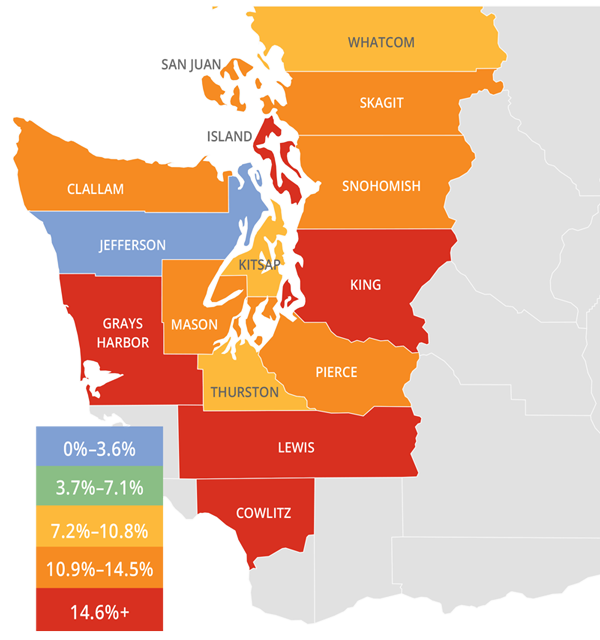
![]() Year-over-year, the average home price in the region rose 9.5% to $241,667. Price growth has been moderating across the region, but several counties continue to see well-above-average appreciation.
Year-over-year, the average home price in the region rose 9.5% to $241,667. Price growth has been moderating across the region, but several counties continue to see well-above-average appreciation.- Limited inventory continues to drive prices higher. This is unlikely to change as we move into the winter months.
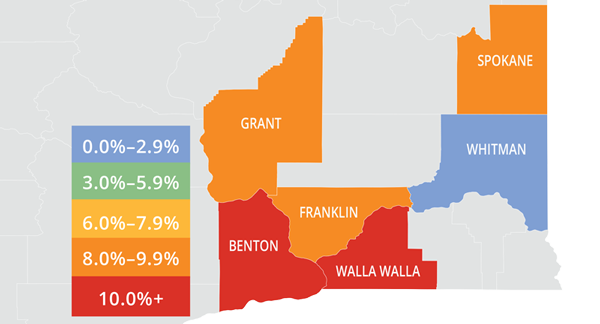
- All of the counties in this report saw prices rise compared to the final quarter of 2016. Benton County led the way again with an increase of 14.8%.
- The takeaway here is that home-price growth continues at above-average rates and, as long as mortgage rates remain favorable to would-be buyers, prices will continue to rise.
 Year-over-year, the average home price in the region rose 9.5% to $241,667. Price growth has been moderating across the region, but several counties continue to see well-above-average appreciation.
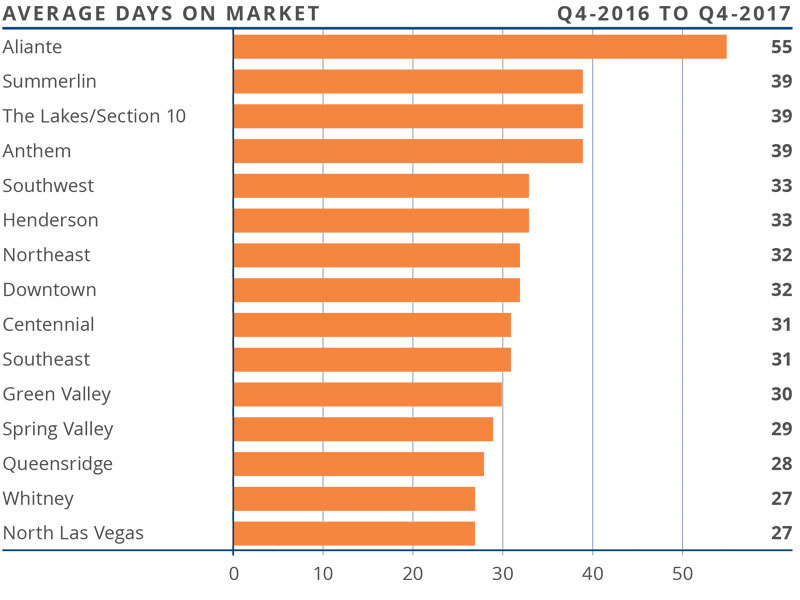
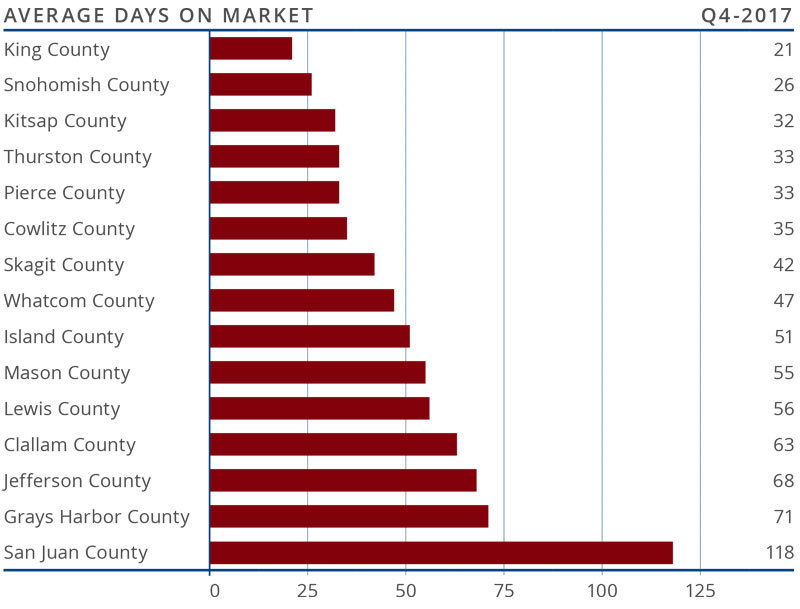
DAYS ON MARKET
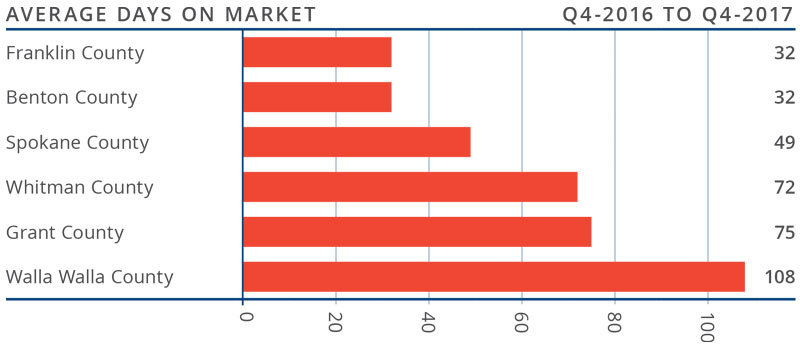
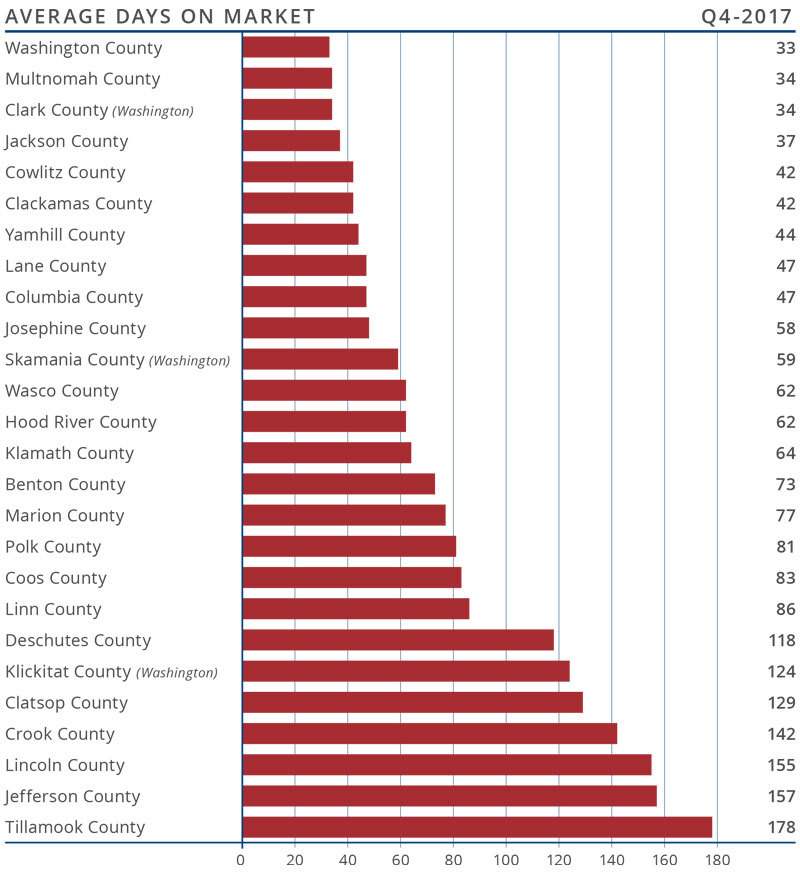
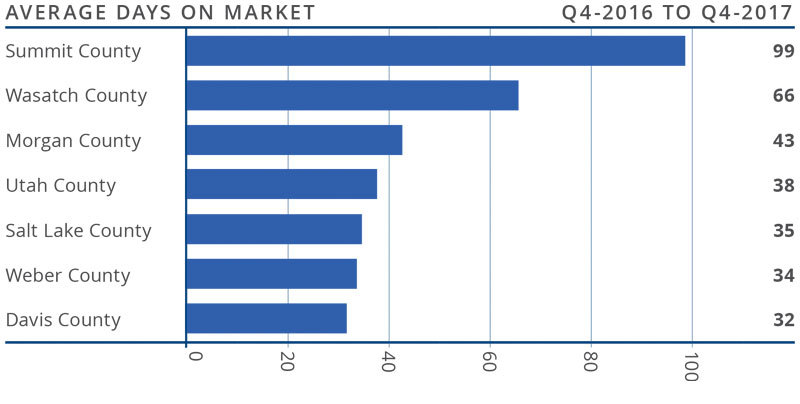
- The average number of days it took to sell a home dropped by two days compared to the fourth quarter of 2016.
- The average time it took to sell a home in the region was 61 days.
- Every county except Grant saw the time it took to sell a home drop from the same quarter in 2016.
- Spokane County had the biggest drop in days on market. The time it took to sell a home there dropped by seven days compared to the fourth quarter of 2016.
CONCLUSIONS
 This speedometer reflects the state of the region’s housing market using housing inventory, price gains, home sales, interest rates, and larger economic factors. Given the drop in listings, rising pending and closed sales, and climbing home prices, I have nudged the needle just a little more in favor of sellers. We are all hoping for a jump in new listings in the first quarter, which would help would-be buyers. For now, however, the market clearly favors sellers.

Matthew Gardner is the Chief Economist for Windermere Real Estate, specializing in residential market analysis, commercial/industrial market analysis, financial analysis, and land use and regional economics. He is the former Principal of Gardner Economics, and has more than 30 years of professional experience both in the U.S. and U.K.

 The speedometer reflects the state of the region’s housing market using housing inventory, price gains, home sales, interest rates, and larger economic factors. Housing markets throughout Oregon continue to benefit greatly from the healthy regional economy.
 Given the considerable competition for the few homes for sale in the fourth quarter, prices continue to rise at fairly rapid rates. Prices in the region were up 11.6% yearover-year to an average of $342,507.
 This speedometer reflects the state of the region’s housing market using housing inventory, price gains, home sales, interest rates, and larger economic factors. For the fourth quarter of 2017, I left the needle at the same point as third quarter. Supply issues persist and this continues to create competition for well-priced and well-located homes. The increase we’re seeing in the amount of time it takes to sell a home may suggest that the market is either getting weary of all the competition or buyers are delaying their purchase until there are more homes to choose from.

 With continued competition for the limited number of available homes, prices continued their upward trend. Average prices were up 9.8% year-over-year to a regional average of $431,403, which was slightly higher than the third quarter of 2017.

 This speedometer reflects the state of the region’s housing market using housing inventory, price gains, home sales, interest rates, and larger economic factors.


 There were 45,342 home sales in the final quarter of 2017. This was 2.4% lower than the same period in 2016.


 The speedometer reflects the state of the region’s housing market using housing inventory, price gains, home sales, interest rates, and larger economic factors.
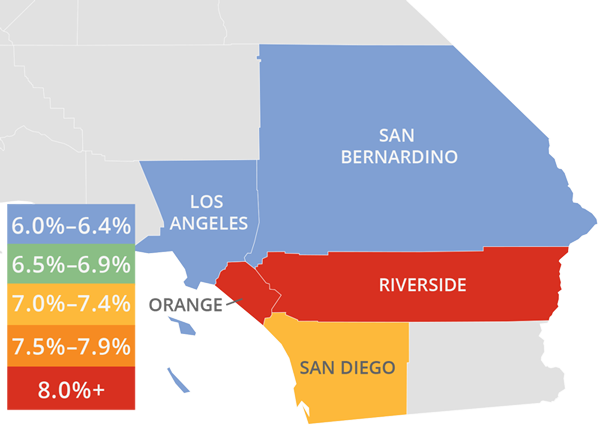
 Employment in the Las Vegas metropolitan area continues to moderate but, with a year-over-year employment growth rate of 2.7%, the region is still performing well above the national average of 1.4%. Over the past 12 months, the area has added 25,500 new jobs. This has led to a respectable unemployment rate of 5.3%. This is the same rate as a year ago, but that should not be any cause for concern, as we have seen a fairly large increase in the labor force, which can slow the drop in the unemployment rate.
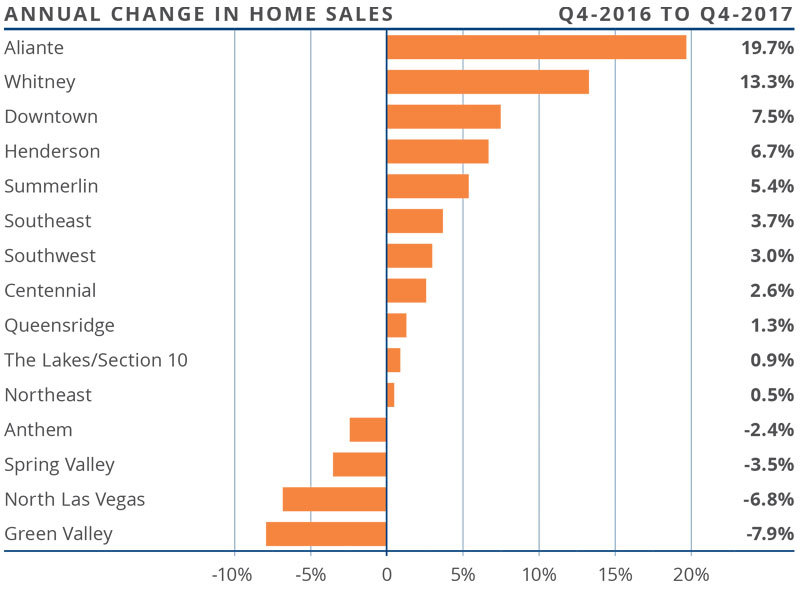
 The speedometer reflects the state of the region’s housing market using housinginventory, price gains, home sales, interest rates, and larger economic factors. Employment growth in Clark County, although slowing modestly, is still very positive. This, when combined with low inventory levels and competitive mortgage rates, will push home prices higher. Given these factors, I have moved the speedometer a little further in favor of sellers.

 Because of low inventory in the fall of 2017, price growth was well above long-term averages across Western Washington. Year-over-year, average prices rose 12% to $466,726.
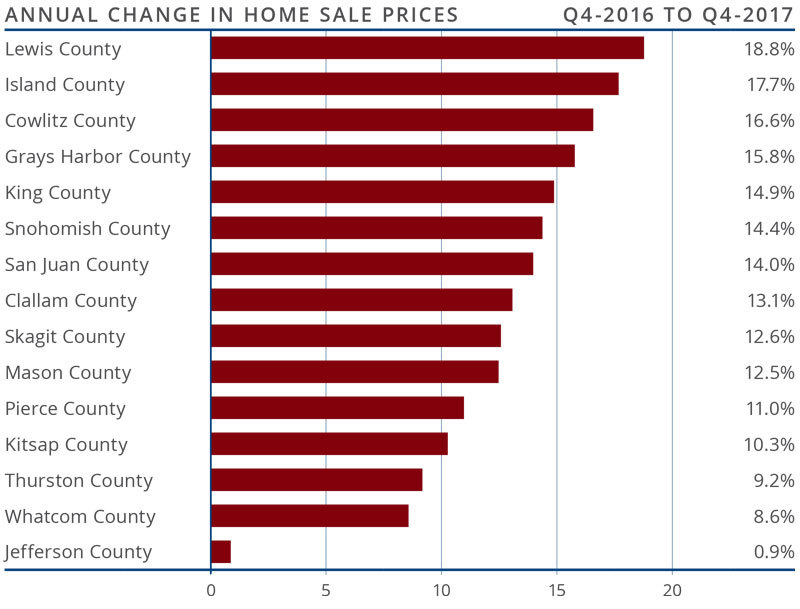
 This speedometer reflects the state of the region’s housing market using housing inventory, price gains, home sales, interest rates, and larger economic factors. For the fourth quarter of 2017, I have left the needle at the same point as third quarter. Price growth remains robust even as sales activity slowed. 2018 is setting itself up to be another very good year for housing.


")


