
 Facebook
 X
X
 Pinterest
 Copy Link

The following analysis of the Central Washington real estate market is provided by Windermere Real Estate Chief Economist Matthew Gardner. We hope that this information may assist you with making better-informed real estate decisions. For further information about the housing market in your area, please don’t hesitate to contact your Windermere agent.
ECONOMIC OVERVIEW
The Washington State economy continues to add jobs at an above-average rate, though the pace of growth is starting to slow as the business cycle matures. Over the past 12 months, the state added 96,600 new jobs, representing an annual growth rate of 2.9% — well above the national rate of 1.7%. Private sector employment gains continue to be quite strong, increasing at an annual rate of 3.6%. Public sector employment was down 0.3%. The strongest growth sectors were Real Estate Brokerage and Leasing (+11.4%), Employment Services (+10.3%), and Residential Construction (+10.2%). During fourth quarter, the state’s unemployment rate was 4.3%, down from 4.7% a year ago.
The counties within Central Washington have added 12,257 new jobs over the past 12 months, representing a very significant growth rate of 5.7%. A majority of that increase was in Yakima County, where total employment rose by 7.4% (or 8,500 jobs). The local unemployment rate rose when compared to a year ago from 5.7% to 5.9%. However, this increase can be attributed to a significant increase in the labor force.
HOME SALES ACTIVITY
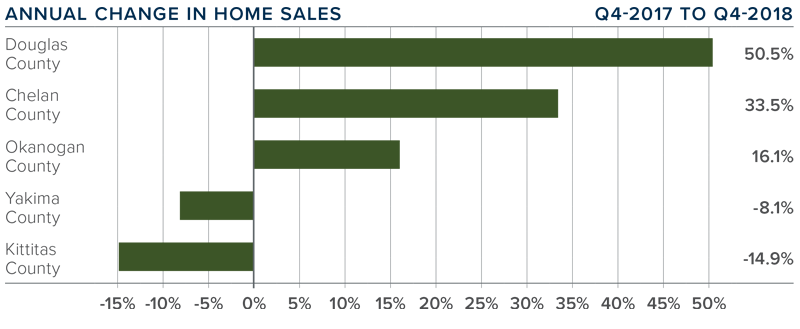
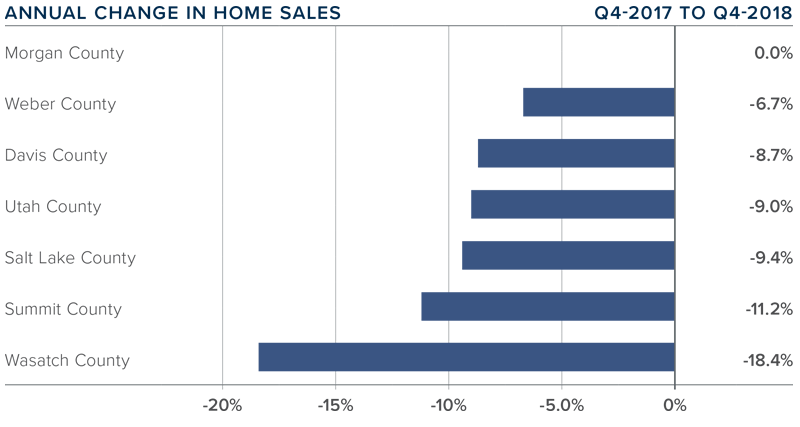
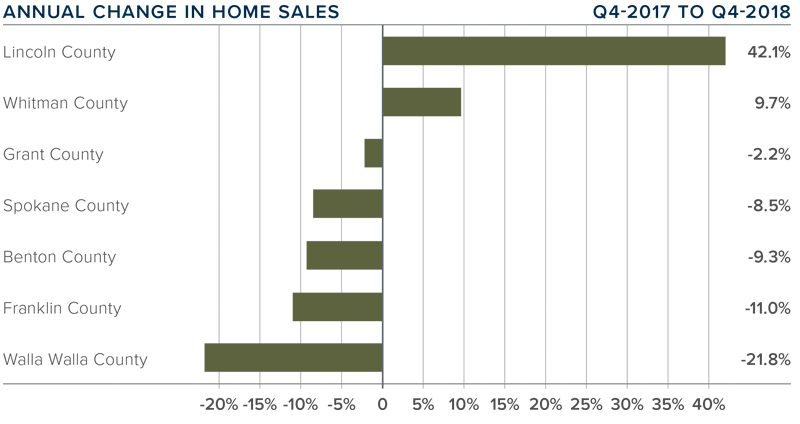
- In the fourth quarter of this year, home sales throughout Central Washington rose by 2.8% to a total of 1,363 but sales were 1.7% lower than the third quarter of 2018.
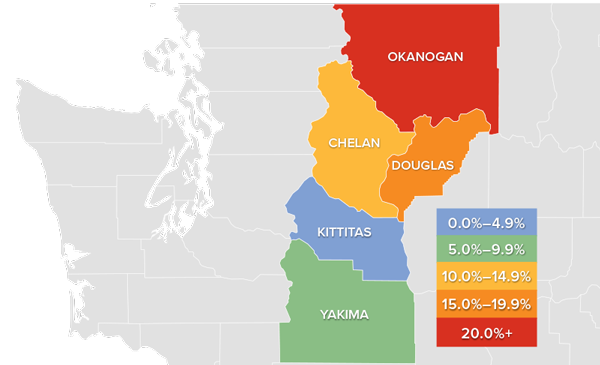
- Sales rose most in Douglas County, which had a very impressive increase of 50.5% over the fourth quarter of 2017. Yakima and Kittitas counties saw sales activity slow, but I do not see it as a pervasive trend or cause for concern.
- The number of pending home sales was up 4.1% compared to the third quarter, indicating that closings will likely rise in the first quarter of 2019.
- Listing activity rose by 1.4% when compared to the final quarter of 2017. This should offer some relief to would-be home buyers. I will be interested to see how much listing activity rises as we move into the spring selling market. I believe we will see more homes for sale as we start to trend toward a balanced market in the Central Washington area.
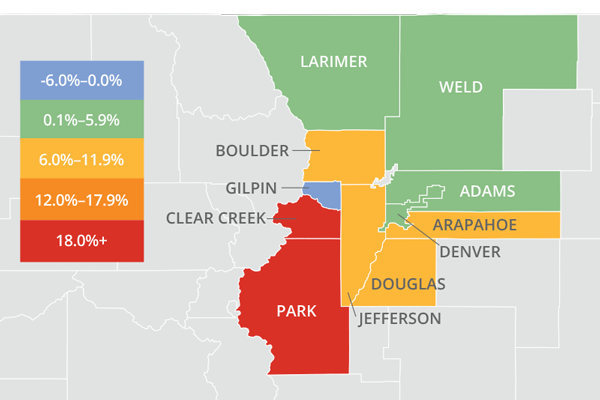
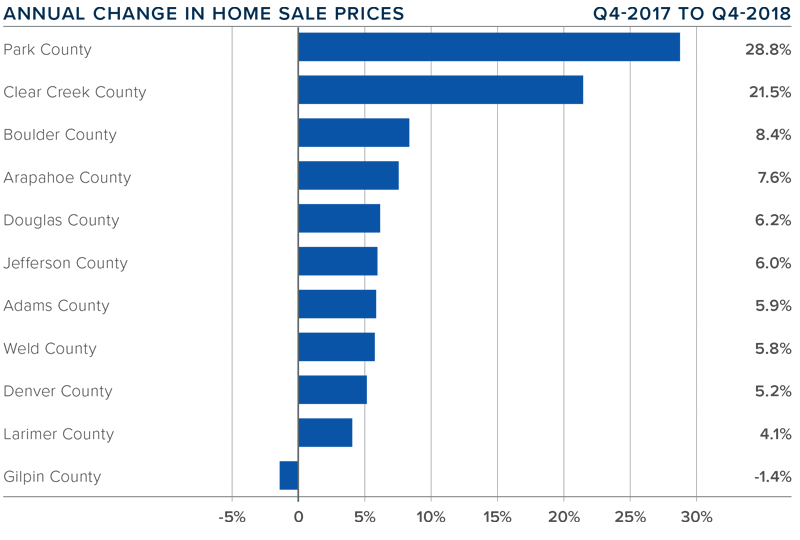
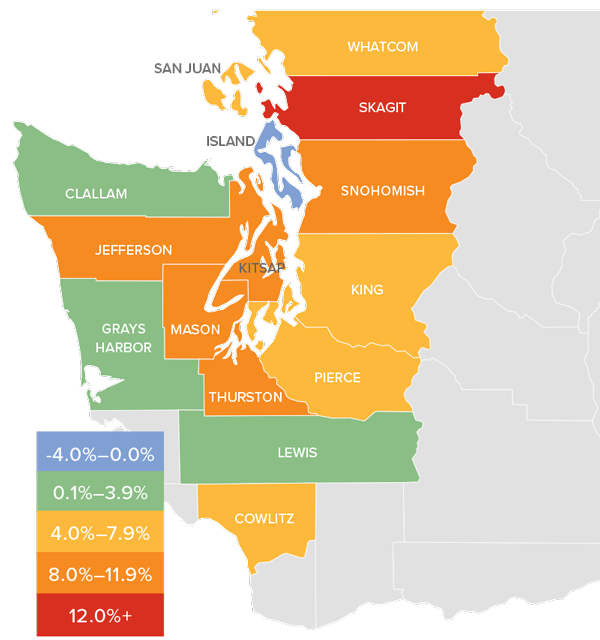
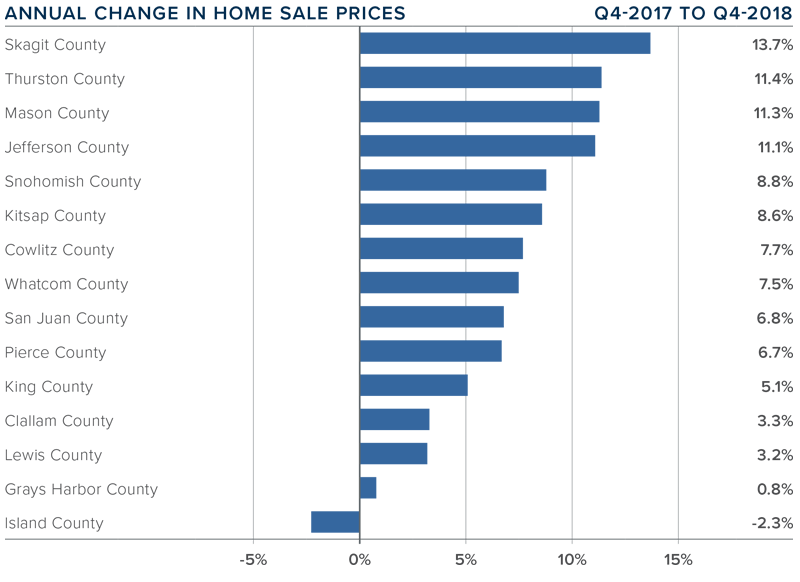
HOME PRICES
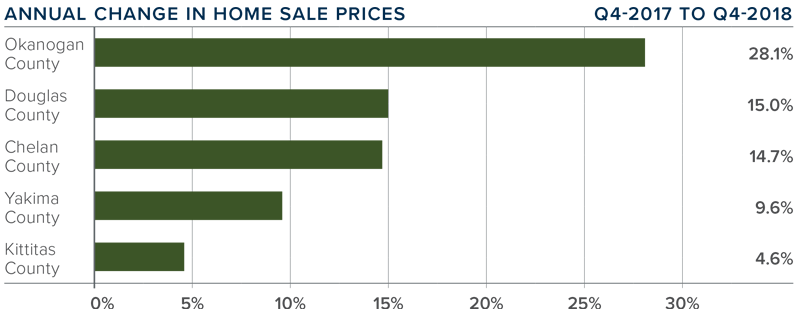
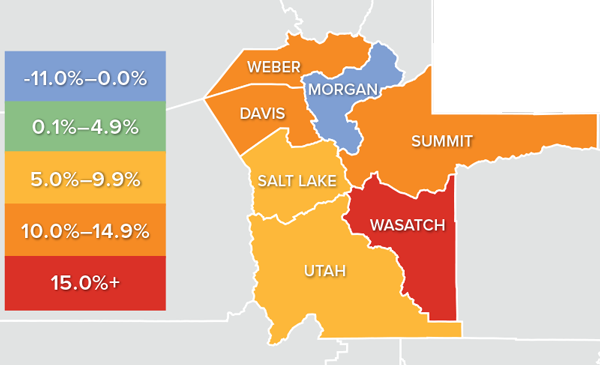
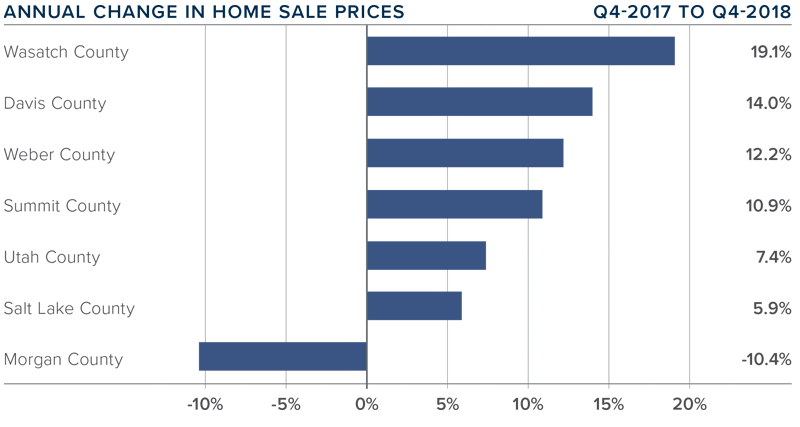
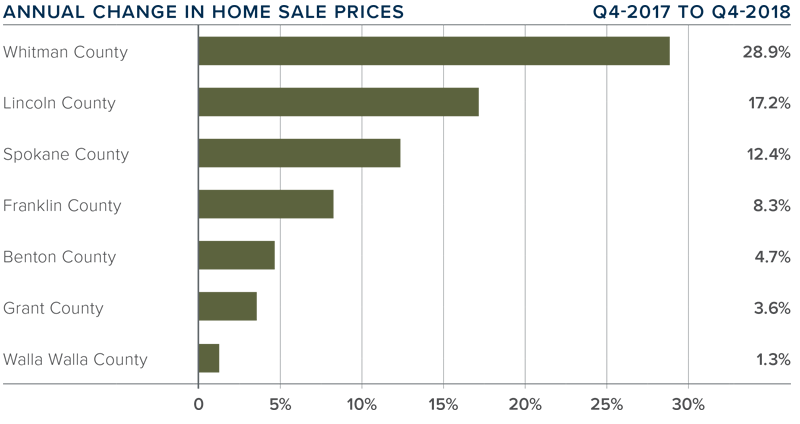
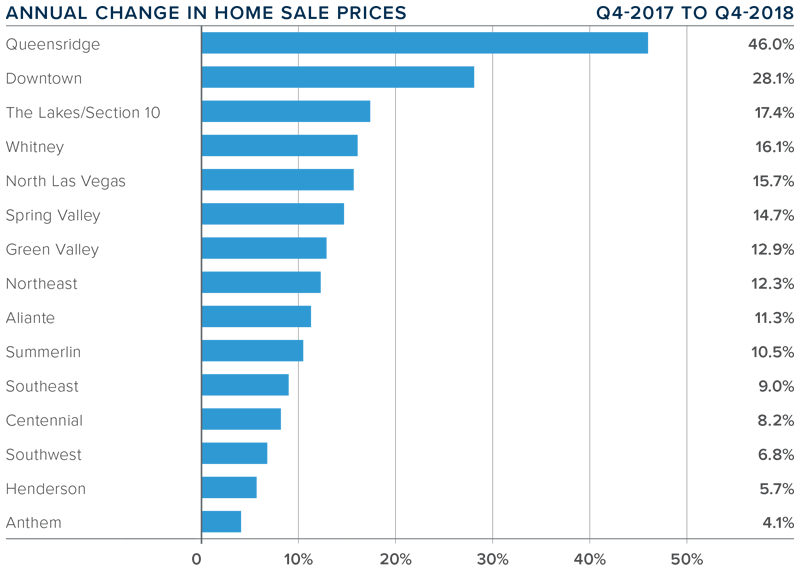
- Year-over-year, the average home price in the region rose 12.9% to $317,064. Price growth continues to trend well above the long-term average, but I am hopeful that increasing supply in the spring will start to cool home-price appreciation.
- Kittitas and Yakima counties were the only areas where the average sale prices rose by single digits, suggesting that even with increasing inventory it remains a solidly sellers’ market.
- Prices rose in all counties contained in this report compared to the fourth quarter of 2017. Okanogan County stood out with a very substantial increase of 28.1%.
- Home-price growth continues to trend at above-average rates due to supply constraints, but I hope increasing listing activity will start to take some heat off the market.
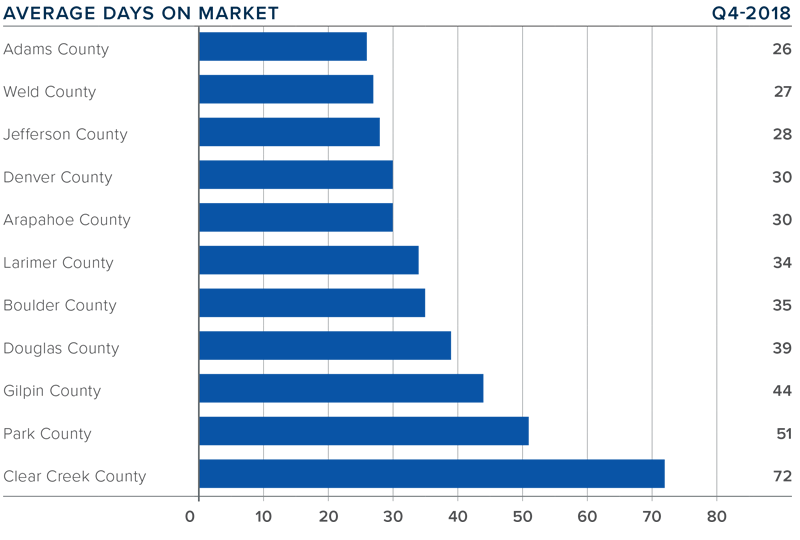
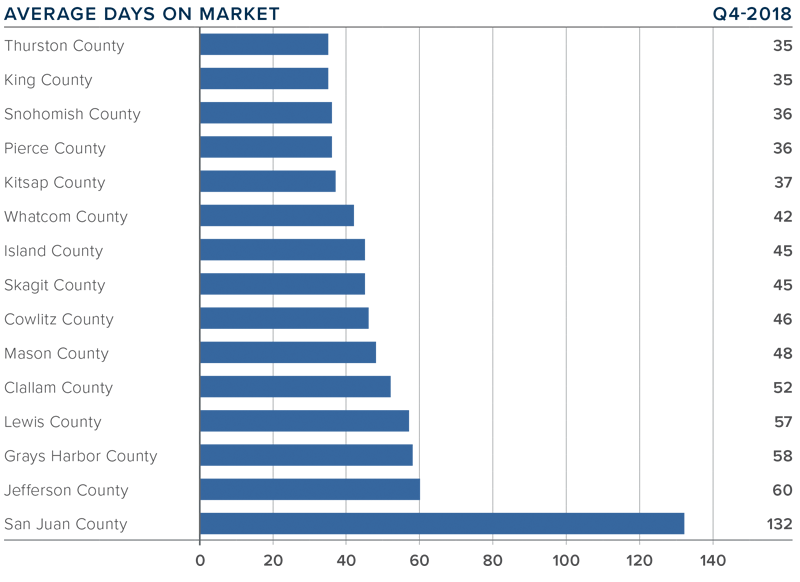
DAYS ON MARKET
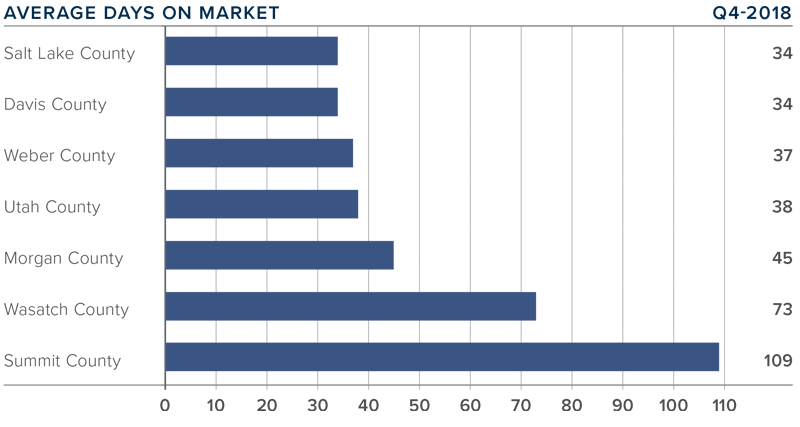
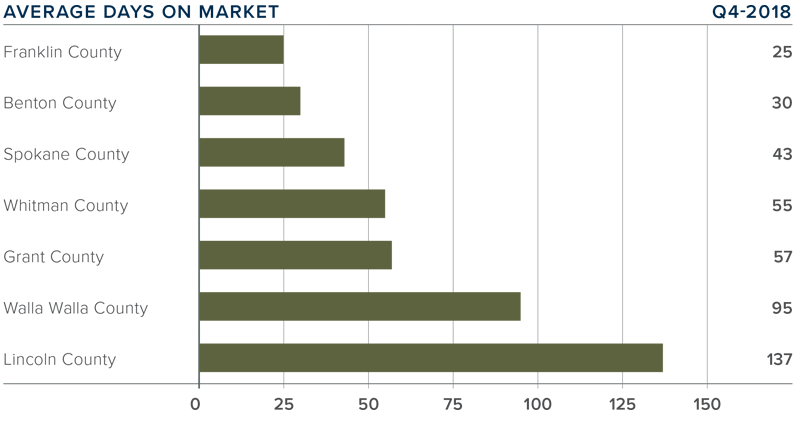
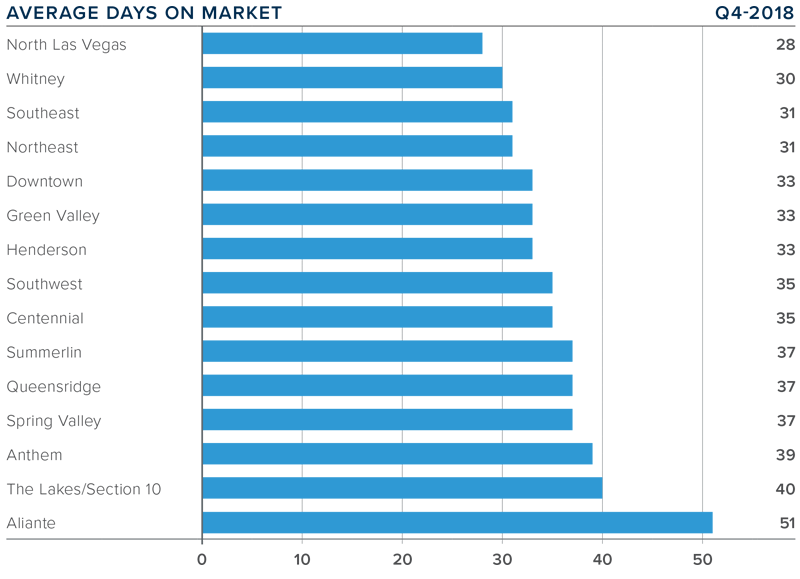
- The average number of days it took to sell a home dropped four days compared to the fourth quarter of 2017.
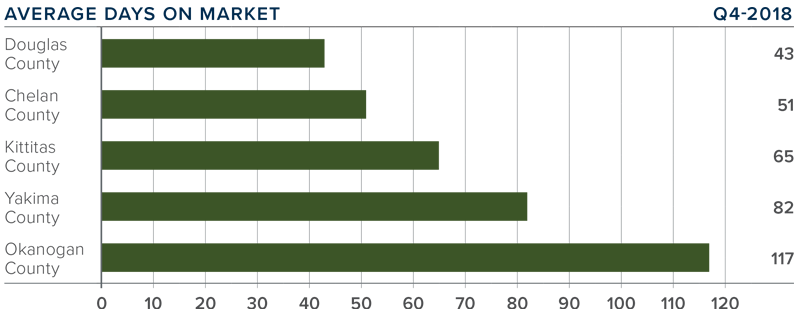
- The average time it took to sell a home in the region was 71 days, up 16 days compared to the third quarter of 2018. This is to be expected in the traditionally slower winter months.
- Three markets contained in this report— Okanogan, Chelan, and Douglas — saw days-on-market drop from the same quarter in 2017. Homes in Kittitas and Yakima counties took the same time to sell as a year ago.
- Homes sold fastest in Douglas County, where it took an average of 43 days to sell a home. The greatest drop in the time it took to sell a home was in Chelan County, where it took 11 fewer days than in the final quarter of 2017.
CONCLUSIONS

The speedometer reflects the state of the region’s real estate market using housing inventory, price gains, home sales, interest rates, and larger economic factors.
For the final quarter of 2018, I have held the needle at the same position as third quarter. Although we did see an increase in the number of homes for Chelan County sale, price growth is still well above the long-term average and the market clearly continues to favor Kittitas County home sellers.

As Chief Economist for Windermere Real Estate, Matthew Gardner is responsible for analyzing and interpreting economic data and its impact on the real estate market on both a local and national level. Matthew has over 30 years of professional experience both in the U.S. and U.K.
In addition to his day-to-day responsibilities, Matthew sits on the Washington State Governor’s Council of Economic Advisors; chairs the Board of Trustees at the Washington Center for Real Estate Research at the University of Washington; and is an Advisory Board Member at the Runstad Center for Real Estate Studies at the University of Washington where he also lectures in real estate economics.


 ECONOMIC OVERVIEW
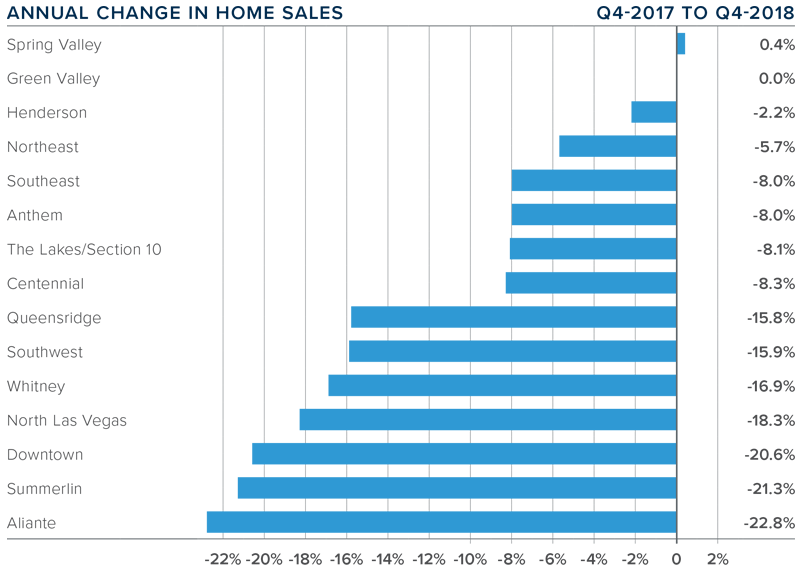


")


