
 Facebook
 X
X
 Pinterest
 Copy Link
Twelve weeks into the COVID-19 pandemic and we are certainly seeing the impact it has had on the housing market. Today’s episode of “Mondays with Matthew” covers home prices now, and what to expect for the rest of 2020.
Market News •
June 1, 2020
Matthew Gardner Weekly COVID-19 Housing & Economic Update: 6/1/2020

This week on "Mondays with Matthew": Now that things have settled down somewhat following the initial impact of COVID-19, Matthew dives into the topic of mortgage rates. Will they go below 3%? Matthew discusses this and the factors that have formed his updated 2020 and 2021 mortgage rate forecast.
Living •
May 27, 2020
Saving in the Laundry Room

Image Source: Shutterstock
When it comes to household expenses, staying at home has brought about savings in some areas, while increasing expenses in others. The laundry room has likely seen an uptick in usage, with its associated costs following suit. Save your energy and money by keeping these tips in mind as we continue to adapt to being home more often.
Master your machine settings
Review the owner’s manuals for your washer and dryer. There may very well be energy-saving settings you’re not using. For example, your washer’s “high-speed” or “extended wash” cycles will remove more moisture, which can help reduce drying time. A dryer’s “cool down cycle” allows clothes to finish drying using only residual heat.
Think twice before washing
Once you’re aware of the costs associated with washing and drying, and the natural resources this consumes, you may decide you don’t need to launder certain clothes as often – which can also extend the life of these garments. Some clothing, like jeans, sweatshirts, and sweatpants, can be worn a few times without a cleaning. Washing these items only when necessary will help you cut down. Another tip – keep another laundry basket in your room for those lightly worn clothes that you could wear again, so they keep separate from your clean clothes.
Use hot water only when necessary
Using warm water instead of hot can significantly cut down your washer’s energy expense. Using cold water puts less pressure on electricity grids, saving your household even more money and energy. Cold water washes are less likely to shrink or fade your clothing as well. To ensure your clothes still get clean, try using a cold-water detergent.
Right-size your loads
For both washing and drying, taking into consideration the size of your load can factor greatly into your savings. No matter the size of the load you wash, it costs the same amount to run a cycle. So instead of doing two small loads, wait until you have one large load. When drying, keep in mind that an overly full dryer will take longer to dry the clothes. A dryer with too few items inside costs more to operate.
Clean the dryer vent and filter
When the lint filter in your dryer gets clogged, airflow is reduced, and the dryer can’t operate effectively. Make a point to clean the filter after every use. If you use dryer sheets, scrub the filter every month to remove any film buildup. The venting that attaches to the back of your dryer also needs to be kept clean and clear.
Air dry
When the weather is sunny and warm, consider putting your clothes out to hang-dry. Doing so will keep your drying expenses to a minimum. It can also be a better drying method for clothing with delicate tailoring.
With staying at home being the new status quo, taking a look at the ways our homes use energy and incur expenses is more relevant than ever. These small changes in the laundry room are just some of the minor adjustments you can make in your household during these unique times.
Buying •
May 20, 2020
Questions to Ask During Your Virtual Home Tour
Image Source: Canva
Thanks to COVID-19, the new reality is that many open houses and home tours are being conducted virtually. For prospective home buyers, this new territory brings an added element to prepare for in the home buying process. Some of the questions that should be asked in a virtual home tour parallel those of in-person tours, but others are unique to today’s virtual world.
Could you zoom in?
- Sometimes it can be difficult to get a true glimpse at what you want to see in a room. Asking the agent to zoom in on specific features is commonplace in virtual home tours, and they understand this is part of the viewer experience. Don’t hesitate to ask multiple times. Getting a better look at everything you want to see will help you feel like you’ve gotten the most out of your virtual tour.
How many square feet are in this room?
- Virtual tours can slightly distort space, making it tough to gauge the size. The room-to-room square footage is information the agent is sure to have handy. Since you can’t be there in person, it will help you piece together the virtual visuals with the sense of physical space that we’re all accustomed to feeling in the places we live.
What color is that?
- In the smartphone era, and computer era at large, we have come to understand that digital representations of color are not always true to the eye. Ask the agent to confirm specific colors so you can plan accordingly. Have a color swatch on hand or look the colors up online as you go through the tour.
When were the appliances last updated?
- The importance of this question rings true in past, present, and future. Knowing the state of the home’s appliances, and the likelihood and timing of when they will need replacement, is vital information for both assessing the move-in readiness of the home and understanding what costs might lie ahead.
Has the seller provided an inspection?
- This is another example of a critical question, whether your home tour is virtual or physical. If the seller has already done an inspection, ask the agent to lead you to any areas of concern based on the inspector’s findings. If there is anything that has not yet been addressed by the seller, have your agent ask what their plan is for making the necessary repairs/updates.
When is the offer review date?
- Understanding the seller’s timeline for reviewing and accepting offers will help guide your decision-making process and allow you to strategize based on the timeline.
Whether your home tour is physical or virtual, getting the information you need to make an informed decision remains paramount. Although there is no substitute for physically being in the home you are looking to buy, keeping these questions in mind will position you well as you progress through the home buying journey.
Market News •
May 18, 2020
Matthew Gardner Weekly COVID-19 Housing & Economic Update: 5/18/2020
In this week’s episode of Mondays with Matthew, Windermere Chief Economist Matthew Gardner kicks off a series of episodes in which he answers questions from his followers. The first deals with how COVID-19 will impact buyer behaviors, especially in more urban markets.
Market News •
May 11, 2020
Matthew Gardner Weekly COVID-19 Housing & Economic Update: 5/11/2020
Job growth is critical to the health of the housing market, so on this week’s episode of “Mondays with Matthew,” Windermere Chief Economist Matthew Gardner analyzes the effect of COVID-19 on employment and what we can expect for the duration of the year.
Market News •
May 5, 2020
Northern California Real Estate Market Update

We are excited to introduce the Gardner Report to Northern California! The following analysis of the real estate market in select counties of Northern California is provided by Windermere Real Estate Chief Economist Matthew Gardner. We hope that this information may assist you with making better-informed real estate decisions. For further information about the housing market in your area, please don’t hesitate to contact your Windermere agent.
A MESSAGE FROM MATTHEW GARDNER
Needless to say, any discussion about the U.S. economy, state economy, or housing markets in the first quarter of this year is almost meaningless given events surrounding the COVID-19 virus.
Although you will see below data regarding housing activity in the region, many markets came close to halting transactions in March and many remain in some level of paralysis. As such, drawing conclusions from the data is almost a futile effort. I would say, though, it is my belief that the national and state housing markets were in good shape before the virus hit and will be in good shape again, once we come out on the other side. In a similar fashion, I anticipate the national and regional economies will start to thaw, and that many of the jobs lost will return with relative speed. Of course, all of these statements are wholly dependent on the country seeing a peak in new infections in the relatively near future. I stand by my contention that the housing market will survive the current economic crisis and it is likely we will resume a more normalized pattern of home sales in the second half of the year.
HOME SALES
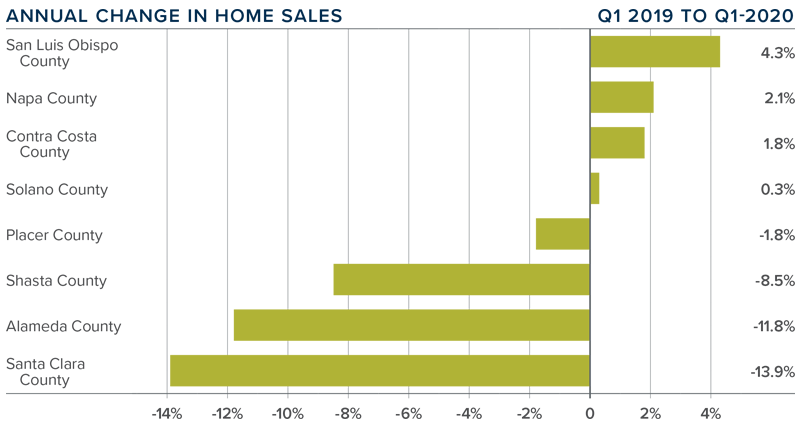
- In the first quarter of 2020, 6,191 homes sold, a drop of 3.8% compared to the first quarter of 2019.
- Sales were a mixed bag, with increases in half of the counties contained in this report and half seeing sales slow. Of note was the decent increase in sales in Contra Costa County, but this was offset by a drop in sales in Alameda County.
- The contraction of sales may be attributed to a significant drop in inventory, which was down 24.7% from a year ago. This decline is likely due to COVID-19. Second quarter data will confirm or refute this thesis.
- Pending home sales dropped 6.1% compared to the first quarter of 2019. Again, this is likely due to COVID-19.
HOME PRICES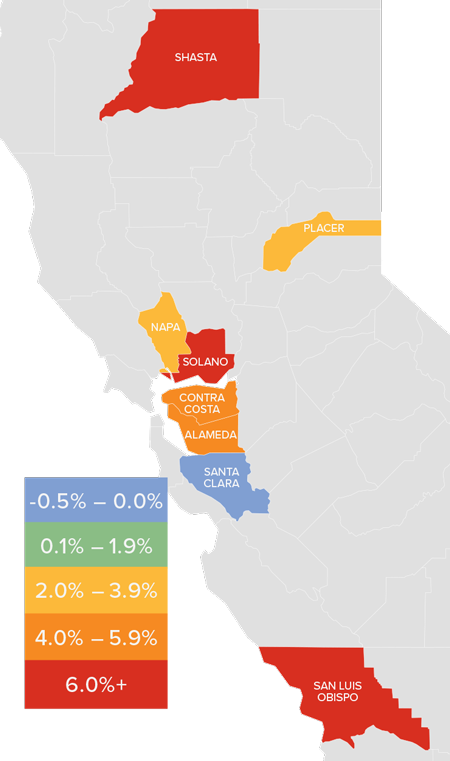
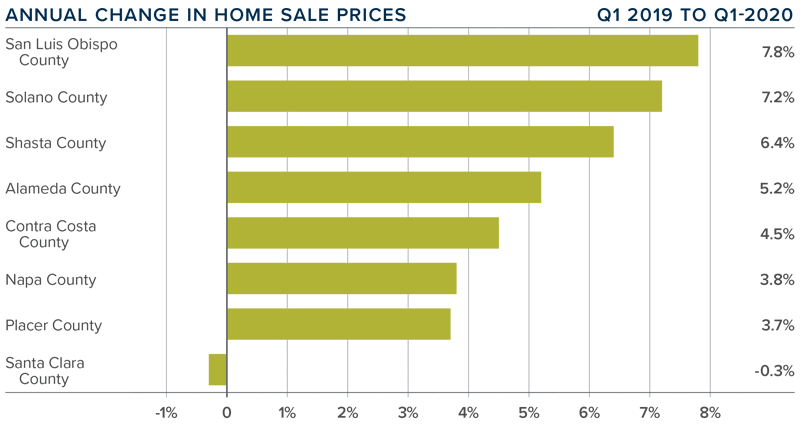
- The average home price in the Northern Californian counties contained in this report rose 3.7% year-over-year to $784,843.
- The most affordable counties in terms of average sale prices were Shasta and Solano. Price growth in these markets was very solid.
- Average prices rose in all counties other than Santa Clara, which is not surprising given it is the most expensive market covered in this report. Prices across most counties rose at above-average long-term rates, with impressive increases in San Luis Obispo and Solano counties.
- As this is the first report prepared for counties within Northern California, my ability to comment is limited. That said, it will be interesting to see how the market further reacts to COVID-19 and we look forward to offering analysis and perspective when we get second quarter data.
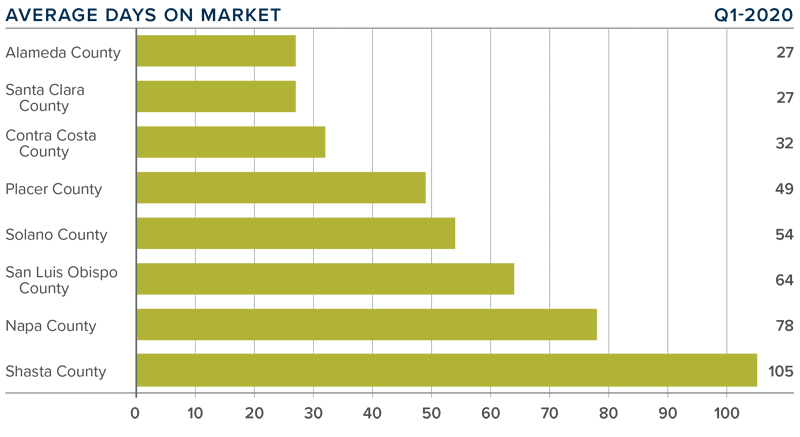
DAYS ON MARKET
- The average time it took to sell a home in the Northern Californian counties covered by this report dropped five days compared to the first quarter of 2019.
- In the first quarter, it took an average of 55 days to sell a home. Homes sold fastest in Alameda and Santa Clara counties, and slowest in Shasta County.
- The amount of time it took to sell a home dropped in all counties other than Shasta (+2 days) and San Luis Obispo (+4 days).
- The greatest drop in market time was in Napa County, where it took 17 fewer days to sell a home than in the first quarter of 2019.
CONCLUSIONS
 This speedometer reflects the state of the region’s real estate market using housing inventory, price gains, home sales, interest rates, and larger economic factors.
Given the current economic environment, I have decided to freeze the needle in place until we see
a restart in the economy. Once we have resumed “normal” economic activity, there will be a period of adjustment with regard to housing. Therefore, it is appropriate to wait until later in the year to offer my opinions about any quantitative impact the pandemic will have on the housing market.
ABOUT MATTHEW GARDNER
 As Chief Economist for Windermere Real Estate, Matthew Gardner is responsible for analyzing and interpreting economic data and its impact on the real estate market on both a local and national level. Matthew has over 30 years of professional experience both in the U.S. and U.K.
In addition to his day-to-day responsibilities, Matthew sits on the Washington State Governors Council of Economic Advisors; chairs the Board of Trustees at the Washington Center for Real Estate Research at the University of Washington; and is an Advisory Board Member at the Runstad Center for Real Estate Studies at the University of Washington where he also lectures in real estate economics.
Market News •
May 4, 2020
Matthew Gardner Weekly COVID-19 Housing & Economic Update: 5/4/2020
Chief Economist for Windermere Real Estate, Matthew Gardner, returns for his weekly update, Mondays with Matthew. This week, he discusses forbearance options available to homeowners who are struggling to pay their mortgage.
Market News •
May 4, 2020
Hawaii/Maui Real Estate Market Update

The following analysis of select Maui real estate markets is provided by Windermere Real Estate Chief Economist Matthew Gardner. We hope that this information may assist you with making better-informed real estate decisions. For further information about the housing market in your area, please don’t hesitate to contact your Windermere agent.
A MESSAGE FROM MATTHEW GARDNER
Needless to say, any discussion about the U.S. economy, state economy, or housing markets in the first quarter of this year is almost meaningless given events surrounding the COVID-19 virus.
Although you will see below data regarding housing activity in the region, many markets came close to halting transactions in March and many remain in some level of paralysis. As such, drawing conclusions from the data is almost a futile effort. I would say, though, it is my belief that the national and state housing markets were in good shape before the virus hit and will be in good shape again, once we come out on the other side. In a similar fashion, I anticipate the national and regional economies will start to thaw, and that many of the jobs lost will return with relative speed. Of course, all of these statements are wholly dependent on the country seeing a peak in new infections in the relatively near future. I stand by my contention that the housing market will survive the current economic crisis and it is likely we will resume a more normalized pattern of home sales in the second half of the year.
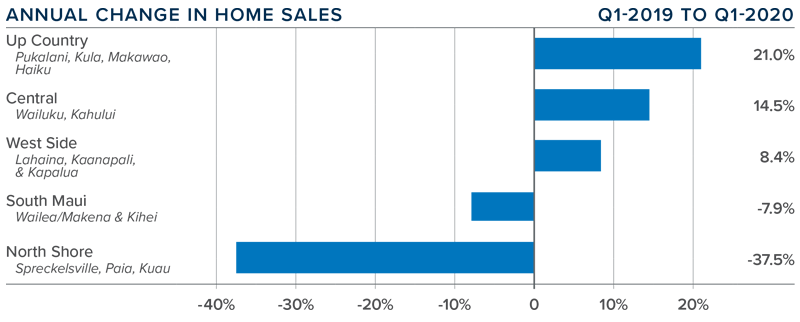
HOME SALES
- In the first quarter of 2020, 545 homes sold. This was an increase of 3% over the first quarter of 2019, but a drop of 1.1% from the fourth quarter of 2019.
- Not all markets saw a drop in sales, with notable increases in the Up Country and Central markets compared to the first quarter of 2019.
- The rise in sales came as aggregate inventory levels rose 6.3%. Clearly, the market did not experience any effects from COVID-19 in the first quarter. It will be interesting to see how the numbers look in the second quarter.
- Pending home sales were up 0.4% compared to the fourth quarter of 2019, suggesting that second quarter closings may be reasonably good.
HOME PRICES
![]() The average home price in the region rose 2.6% year-over-year to $880,006 but was down 5.8% compared to the final quarter of 2019.
The average home price in the region rose 2.6% year-over-year to $880,006 but was down 5.8% compared to the final quarter of 2019.- Affordability remains a significant issue. As we move through the second quarter, I will be interested to see how demand reacts to COVID-19. Any significant slowdown in demand will put downward pressure on home prices.
- Price changes on Maui were uneven, rising in three areas and falling in two. There were significant price gains in the North Shore market area.
- It is too early to say what effects COVID-19 will have on housing values on Maui. I will be watching this closely, specifically as it pertains to buyers of vacation homes.
 The average home price in the region rose 2.6% year-over-year to $880,006 but was down 5.8% compared to the final quarter of 2019.
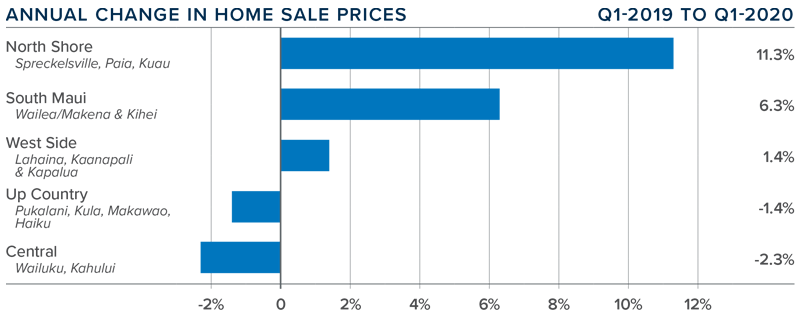
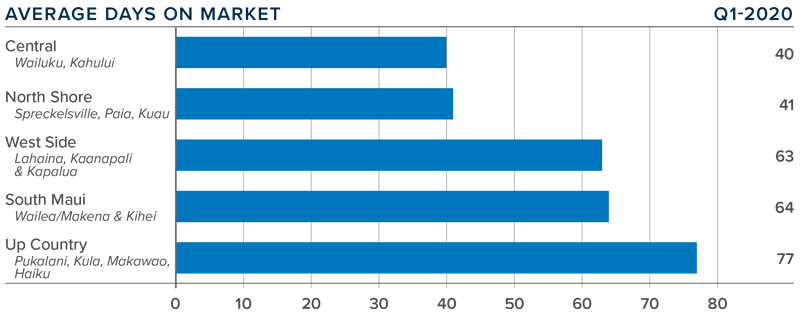
DAYS ON MARKET
- The average number of days it took to sell a home on Maui dropped 17 days compared to the first quarter of 2019.
- In the first quarter it took an average of 57 days to sell a home, with the Central market selling at the fastest pace. Up Country homes are taking the longest time to sell.
- The amount of time it took to sell a home dropped in all markets other than South Maui.
- It is likely we will see the length of time it takes to sell homes on Maui trend higher until the effects of COVID-19 are fully realized.
CONCLUSIONS
 This speedometer reflects the state of the region’s real estate market using housing inventory, price gains, home sales, interest rates, and larger economic factors.
Given the current economic environment, I have decided to freeze the needle in place until we see a restart in the economy. Once we have resumed “normal” economic activity, there will be a period of adjustment with regard to housing. Therefore, it is appropriate to wait until later in the year to offer my opinions about any quantitative impact the pandemic will have on the housing market.
ABOUT MATTHEW GARDNER
As Chief Economist for Windermere Real Estate, Matthew Gardner is responsible for analyzing and interpreting economic data and its impact on the real estate market on both a local and national level. Matthew has over 30 years of professional experience both in the U.S. and U.K.
In addition to his day-to-day responsibilities, Matthew sits on the Washington State Governors Council of Economic Advisors; chairs the Board of Trustees at the Washington Center for Real Estate Research at the University of Washington; and is an Advisory Board Member at the Runstad Center for Real Estate Studies at the University of Washington where he also lectures in real estate economics.
Market News •
May 4, 2020
Big Island of Hawaii Real Estate Market Update

The following analysis of the Big Island real estate market is provided by Windermere Real Estate Chief Economist Matthew Gardner. We hope that this information may assist you with making better-informed real estate decisions. For further information about the housing market in your area, please don’t hesitate to contact your Windermere agent.
A MESSAGE FROM MATTHEW GARDNER
Needless to say, any discussion about the U.S. economy, state economy, or housing markets in the first quarter of this year is almost meaningless given events surrounding the COVID-19 virus.
Although you will see below data regarding housing activity in the region, many markets came close to halting transactions in March and many remain in some level of paralysis. As such, drawing conclusions from the data is almost a futile effort. I would say, though, it is my belief that the national and state housing markets were in good shape before the virus hit and will be in good shape again, once we come out on the other side. In a similar fashion, I anticipate the national and regional economies will start to thaw, and that many of the jobs lost will return with relative speed. Of course, all of these statements are wholly dependent on the country seeing a peak in new infections in the relatively near future. I stand by my contention that the housing market will survive the current economic crisis and it is likely we will resume a more normalized pattern of home sales in the second half of the year.
HOME SALES
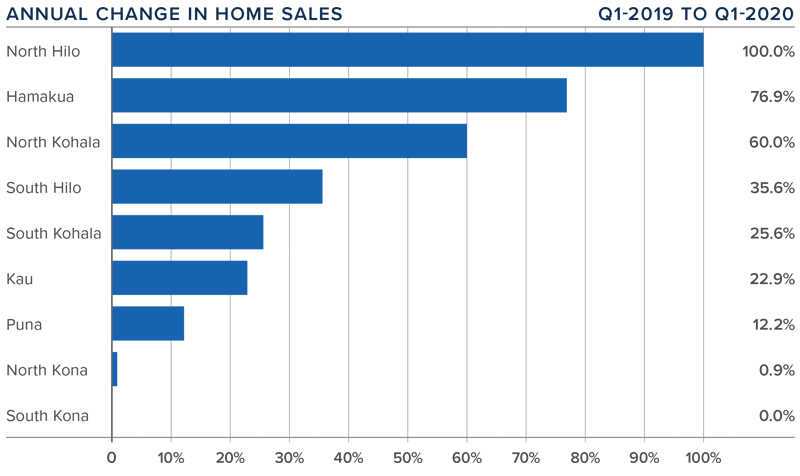
- In the first quarter of 2020, 814 homes sold on the Big Island, an increase of 15.6% compared to the first quarter of 2019 but 1.2% lower than the fourth quarter of 2019.
- Sales either matched year ago numbers or were higher in all markets. There was significant growth in sales in the North Hilo market. Hamakua and North Kohala markets also saw a significant increase in sales activity.
- The growth in sales came as inventory levels dropped 14.3% from a year ago. The average number of homes for sale in the quarter was also down 2.9% from the fourth quarter of 2019.
- It should be noted that pending home sales dropped 2.8% from the final quarter of 2019. I will be watching to see if this contraction can be attributed to COVID-19 or if it was just a normal fluctuation.
HOME PRICES
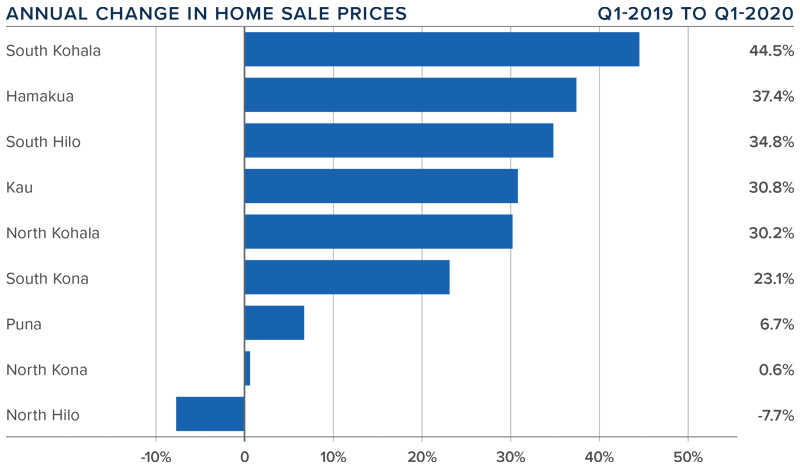
- The average home price in the region rose 15% year-over-year to $620,813. When compared to the fourth quarter of 2019, prices rose an impressive 7%.
- Affordability remains an issue, but low interest rates have clearly been motivating buyers. As a result, prices continue to rise.
- Prices rose in all market areas other than North Hilo. Appreciation was strongest in the small South Kohala market area. All other areas except North Kona saw significant increases.
- The second quarter will likely give us good data about any fallout in the housing market associated with COVID-19.
DAYS ON MARKET
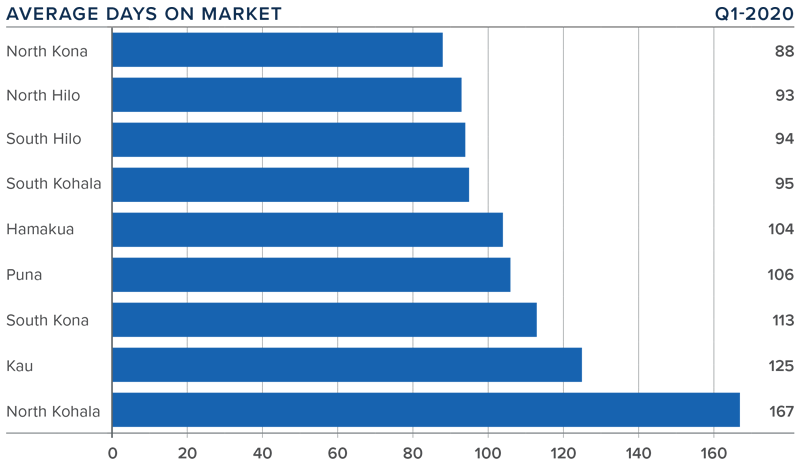
- The average time it took to sell a home on the Big Island rose 28 days compared to the first quarter of 2019.
- In the first quarter, it took an average of 109 days to sell a home. Homes sold fastest in North Kona and North Hilo and slowest in North Kohala.
- The amount of time it took to sell a home rose in all market areas other than in South Kona and Kau, which dropped by one and 30 days respectively.
- It took six days longer to sell a home in the first quarter versus the final quarter of 2019.
CONCLUSIONS
 This speedometer reflects the state of the region’s real estate market using housing inventory, price gains, home sales, interest rates, and larger economic factors.
Given the current economic environment, I have decided to freeze the needle in place until we see
a restart in the economy. Once we have resumed “normal” economic activity, there will be a period of adjustment with regard to housing. Therefore, it is appropriate to wait until later in the year to offer my opinions about any quantitative impact the pandemic will have on the housing market.
ABOUT MATTHEW GARDNER
As Chief Economist for Windermere Real Estate, Matthew Gardner is responsible for analyzing and interpreting economic data and its impact on the real estate market on both a local and national level. Matthew has over 30 years of professional experience both in the U.S. and U.K.
In addition to his day-to-day responsibilities, Matthew sits on the Washington State Governors Council of Economic Advisors; chairs the Board of Trustees at the Washington Center for Real Estate Research at the University of Washington; and is an Advisory Board Member at the Runstad Center for Real Estate Studies at the University of Washington where he also lectures in real estate economics.
")


