
 Facebook
 X
X
 Pinterest
 Copy Link

This is a recurring series of blog posts taking a closer look at the U.S. economy and several major regional markets in Windermere’s nine-state footprint. Updates will be released on a quarterly basis.
Economic Overview
At the end of February, the spring housing market appeared poised for a rebound. Mortgage rates dipped below 6% for the first time in over three years, driven by a combination of narrowing mortgage-Treasury spreads, falling Treasury yields, reduced interest rate volatility, and the FHFA’s announcement that Fannie Mae and Freddie Mac would buy substantial amounts of mortgage-backed securities.

Source: Freddie Mac via FRED.
Then the market was thrown for a loop by the sudden onset of the war in Iran. The effects on the economy, interest rates, and the housing market are only just coming into focus, but so far, the signals are negative. Mortgage rates jumped by as much as half a point in the six weeks after the war began, and March saw the highest one-month increase in the gasoline consumer price index in decades.

Source: BLS via FRED.
As the energy shock ripples through the global economy, it is likely to slow economic growth while pushing prices higher. The magnitude of those effects will depend on how quickly the Strait of Hormuz reopens to tanker traffic, as well as how long it takes to restart oil production and other industrial activity across the Gulf states.
Against that backdrop, local housing market data for the first quarter of 2026 largely reflect conditions before the impacts of the war began to take hold. By the second quarter, we should have a clearer picture of those effects.
The following is a detailed overview of housing trends across six regional markets within Windermere’s footprint during the first quarter of 2026. They include:
- Greater Seattle Area
- Greater Portland Area
- Greater Sacramento Area
- Northwest Washington State
- Spokane, WA and Coeur d’Alene, ID
- Salt Lake County, UT
Greater Seattle Area (King, Snohomish, Pierce, and Kitsap Counties)
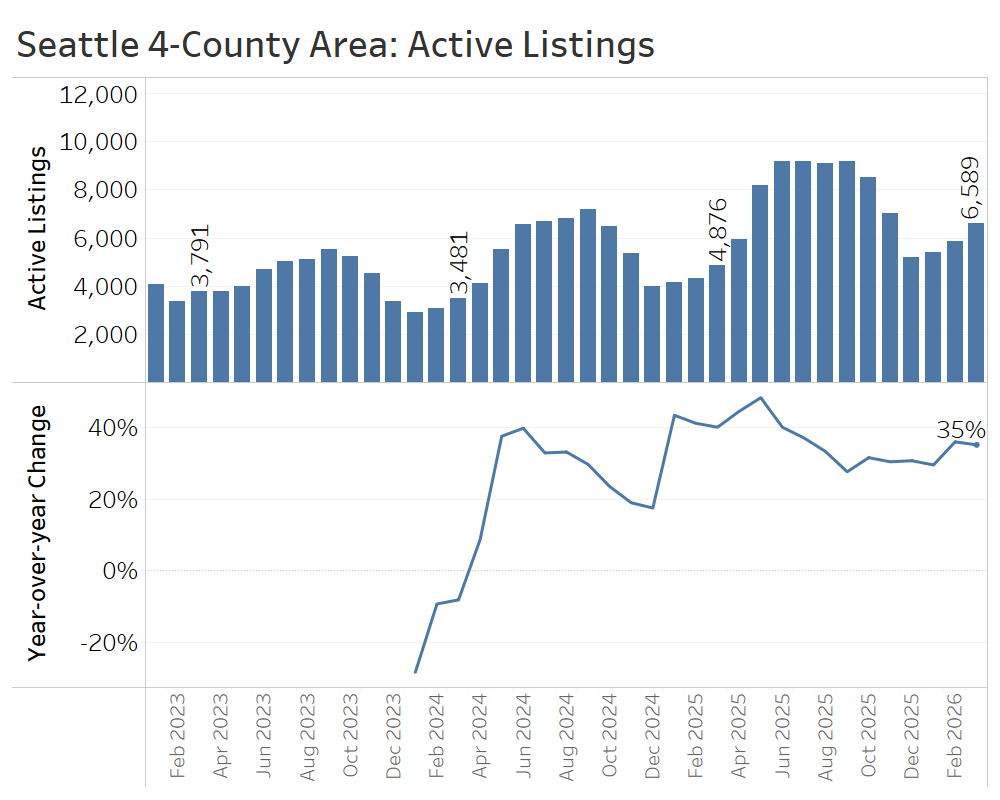
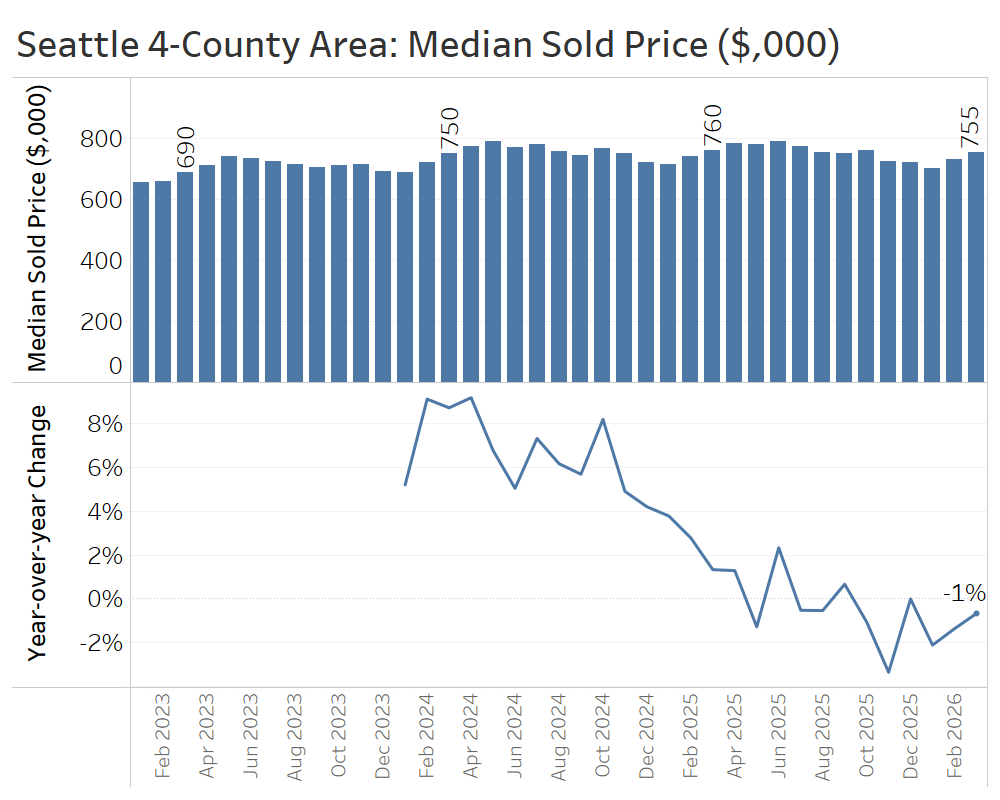
While the spring selling season is typically the strongest time of year for sellers, conditions this year in the greater Seattle area look closer to a balanced market, as abundant listings are meeting only modest demand. Active listings at the end of March were 35% higher than the same time in 2025, a substantial increase and an acceleration from the pace of growth observed in late 2025.
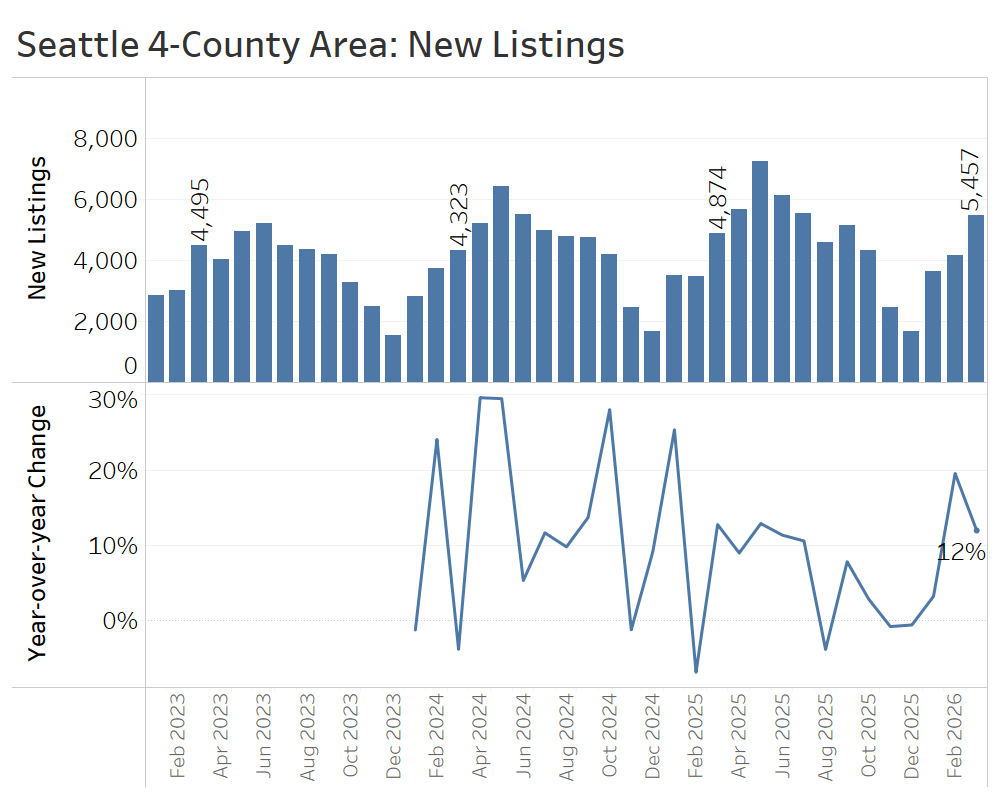
Some of that growth in active listings stemmed from the growth of new listings. More than 13,000 homes hit the market in the first quarter, or about 12% more than in the first quarter of 2025. The flow of new listings may have been particularly strong this spring with the return of patient sellers who held off, or de-listed, late last year.
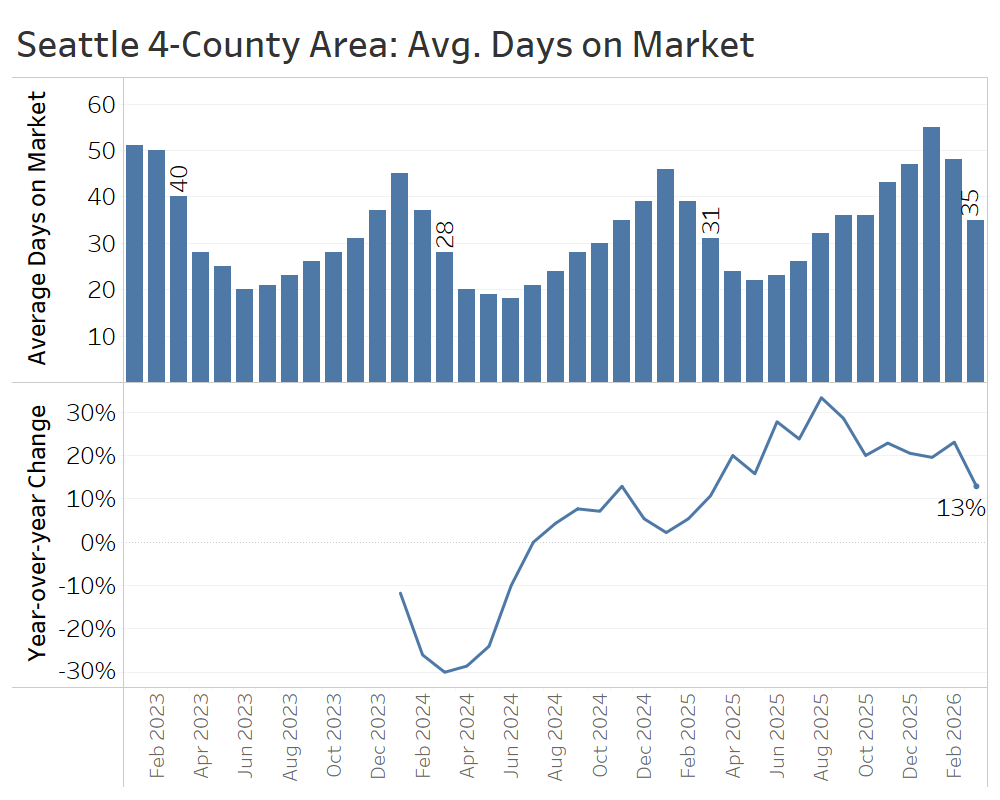
The usual seasonal acceleration in time-on-market took hold this spring, but the median home still took 35 days to sell in March, up from 31 days a year earlier.
Closed sales in March fell just short of their level one year ago, and for the quarter as a whole, 4% fewer closed sales were recorded than throughout the first quarter of 2025. This is a clear indication of softer demand this year.
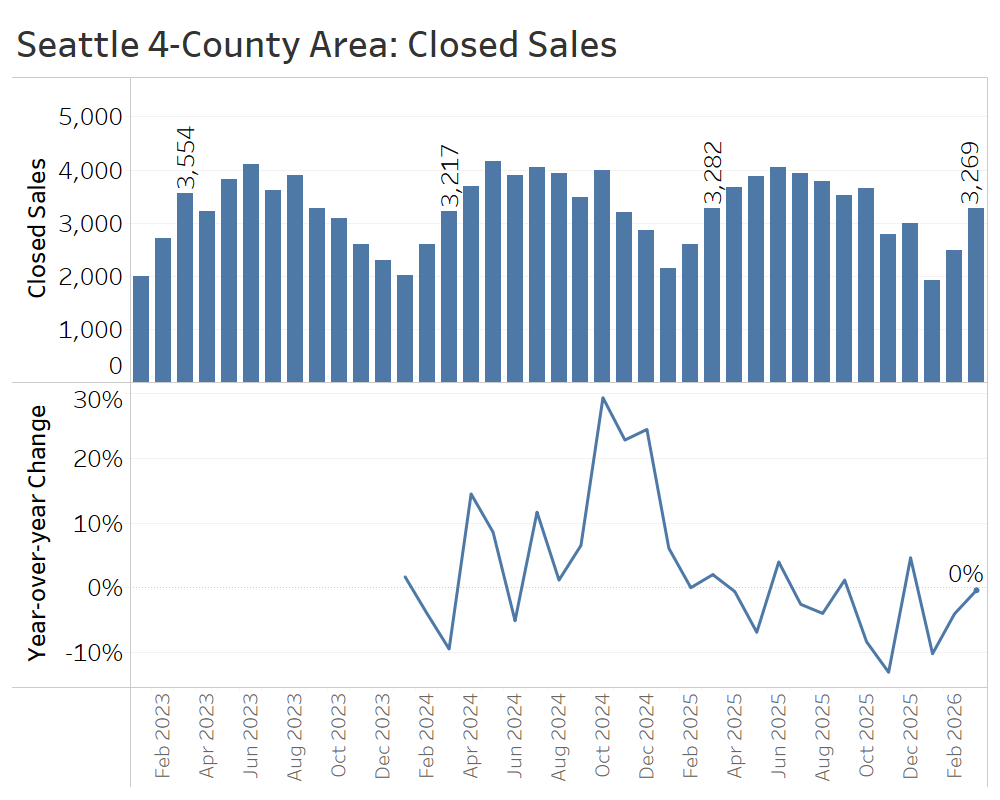
Cooler demand this quarter showed up in prices, too. Median home sale prices hovered 1%-2% below year-ago levels throughout the first quarter.
The first quarter of 2026 brought a seasonal bump in demand, as usual, but it was smaller and more selective than the increase observed in the first quarter of last year. In this environment, sellers need to put their best foot forward and enter the market with realistic expectations, given the competition from other homes.
Greater Portland Area (Multnomah, Washington, Clackamas, and Clark Counties)
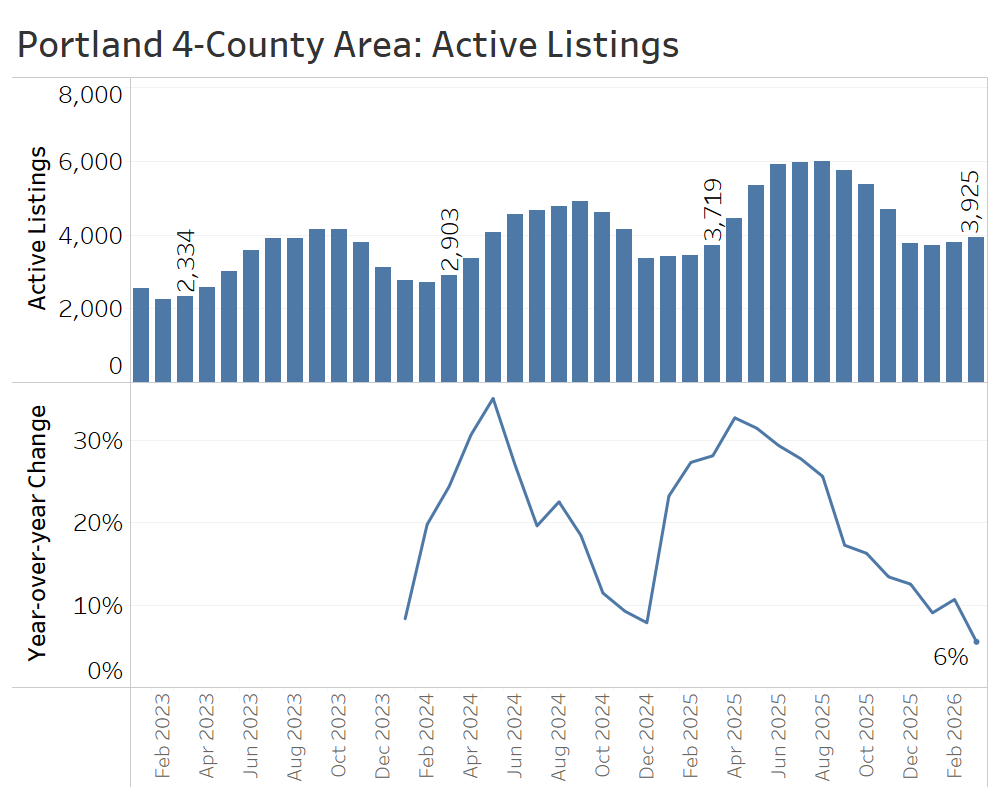
The greater Portland Area edged toward a balanced—or even a buyer’s— market in the first quarter of 2026, as inventory growth slowed to near zero, leaving active listings up only slightly from last year at this time, and sales rebounded modestly.
There were 3,925 active listings at the end of the quarter, which was 6% higher than one year earlier. That continues a trend of decelerating inventory growth since May of 2025.
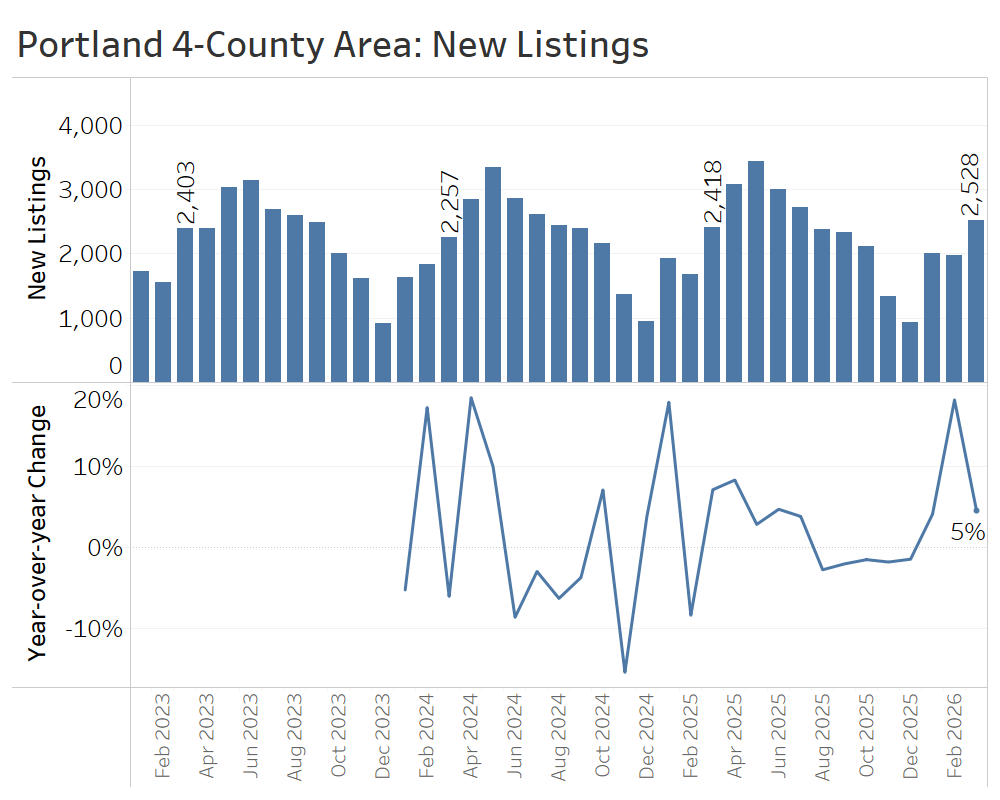
New listings in the first quarter jumped for the first time in several months, with a total of 8% more new listings in the quarter than in the first quarter of 2025.
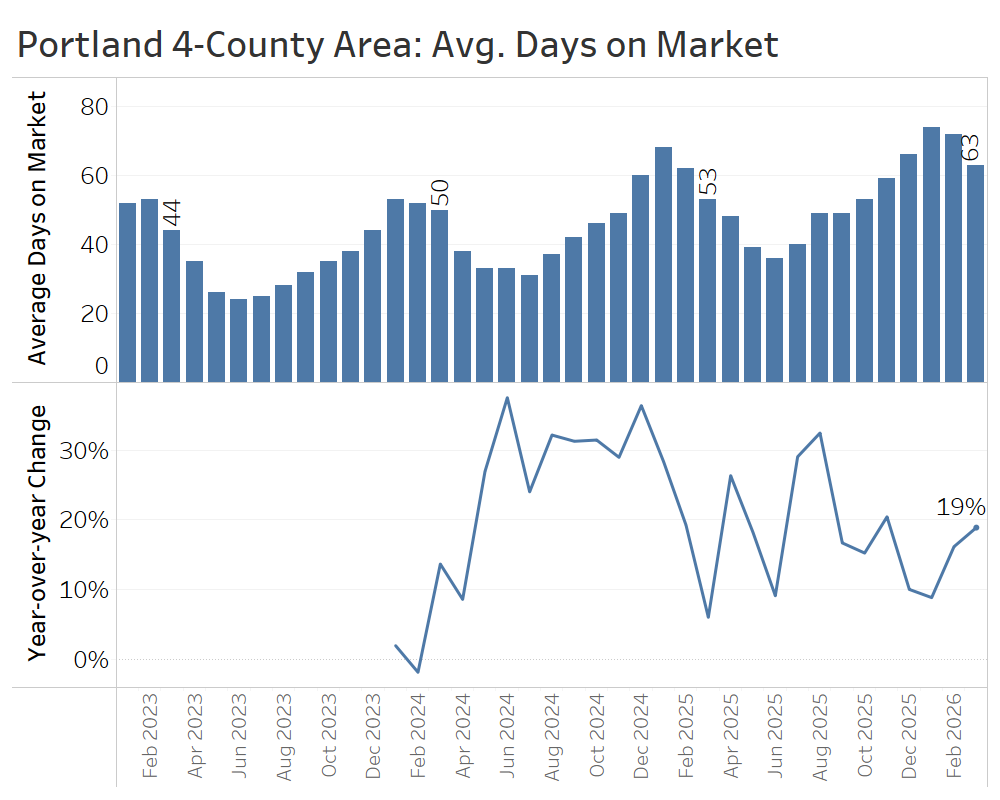
The average home sold after 63 days on the market—about 10 days longer than in March 2025. Nonetheless, that represents an acceleration from the seasonal trough for selling speed in January, when time on market topped out at 74 days.
Closed sales of single-family homes jumped 10% year over year in March, offsetting a decline in January and bringing total first-quarter sales to 2% above the same period in 2025.

Median home sale prices in the Portland area were flat year over year at $600,000 in March, following slight declines of 1%-2% in January and February. While demand may be starting to pick back up, it is not yet translating into price appreciation given the high inventory levels.
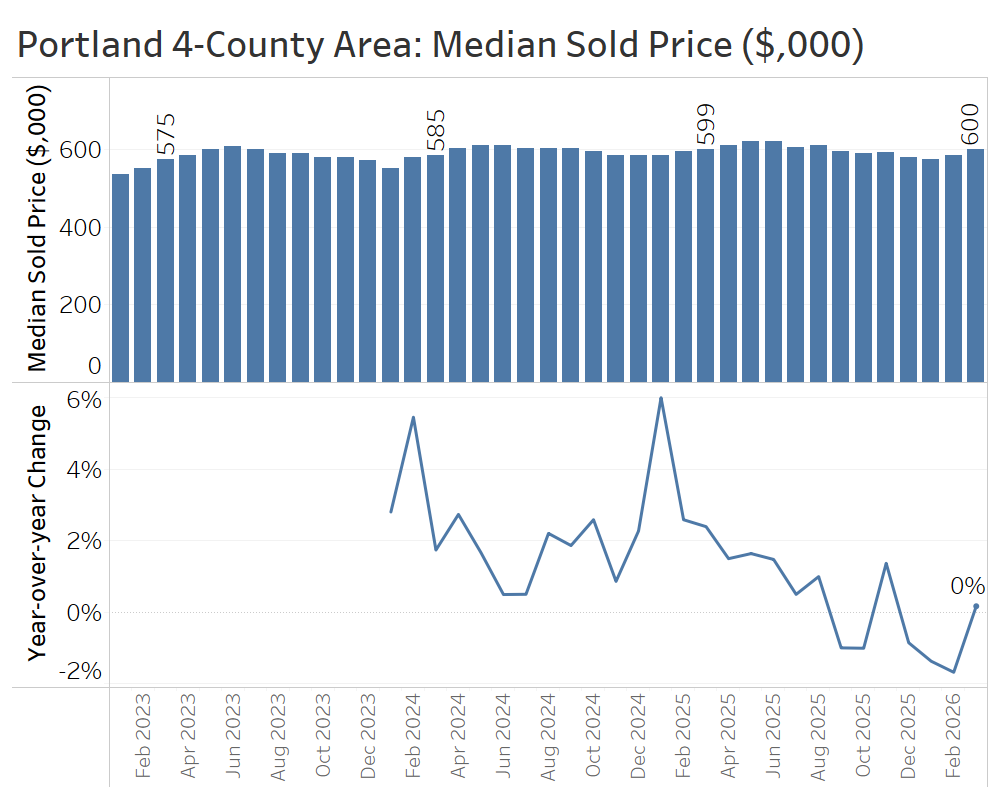
Portland’s first-quarter market looked balanced this year, with flat pricing, modest sales growth, and renewed activity from sellers jumping into the market.
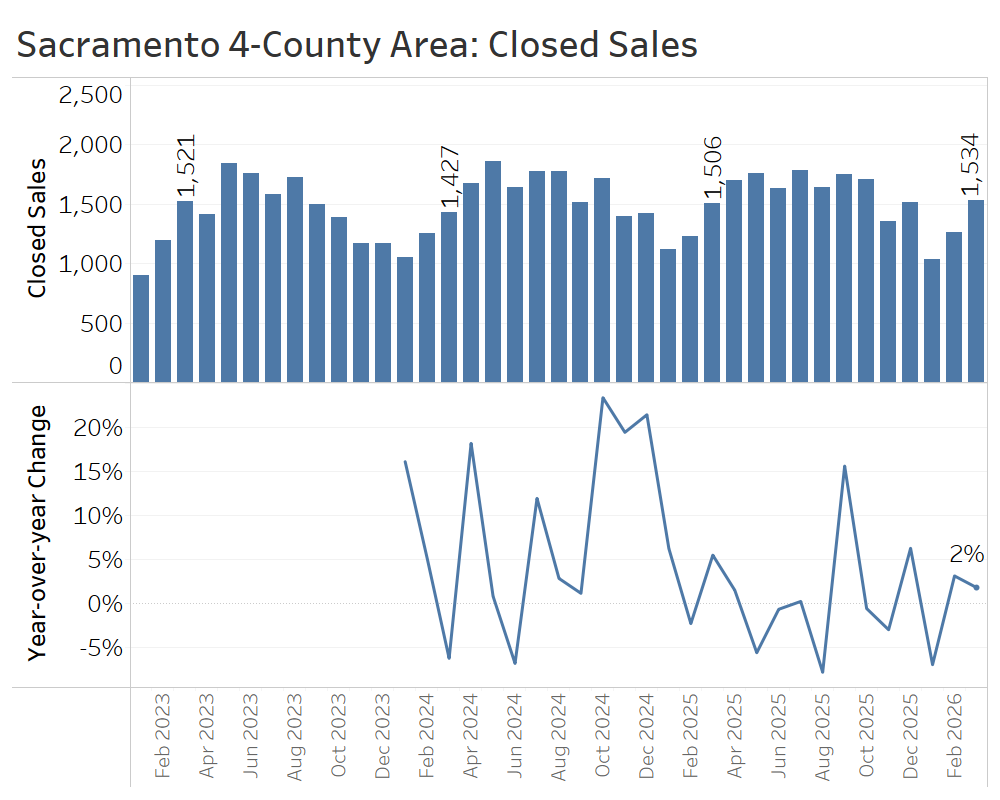
Greater Sacramento Area (Sacramento, Yolo, El Dorado, and Placer Counties)
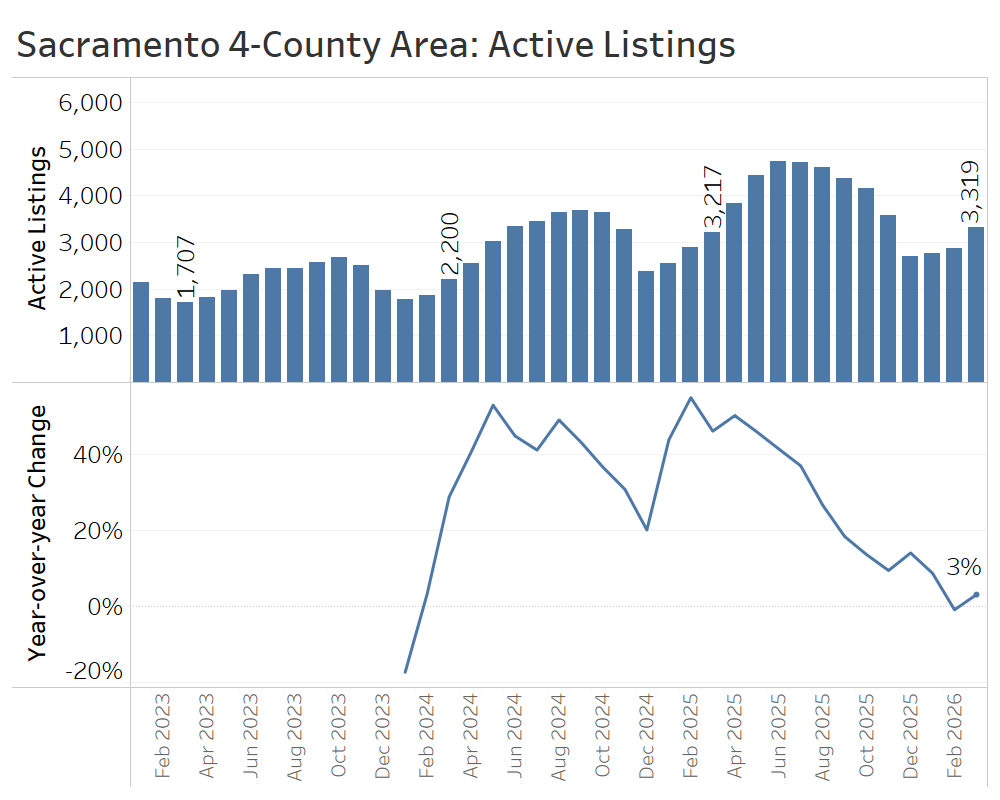
The greater Sacramento area appears to be at a possible inflection point after swinging in buyers’ favor in 2025.
At the end of March, there were about 3,300 active listings—an increase of just 3% compared to March 2025—continuing a trend of decelerating inventory growth over the past year.
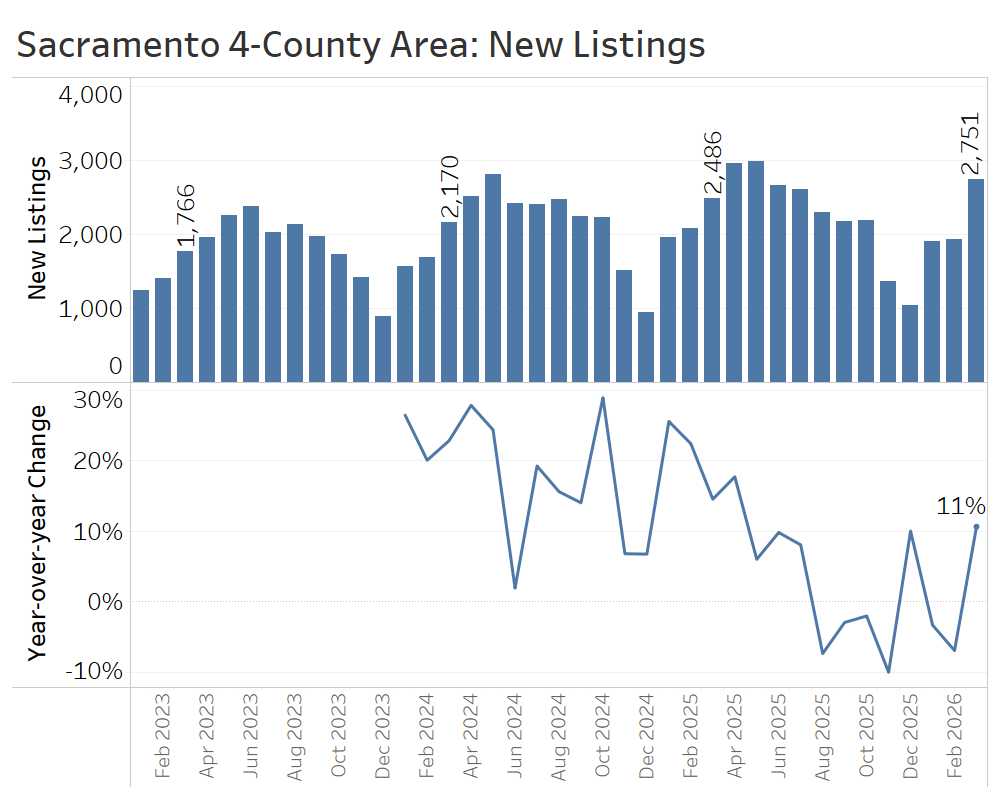
On a monthly basis, the new listings data has been volatile, with small declines in January and February followed by an 11% year-over-year jump in March. Overall, the quarter saw just 1% more new listings than that of the prior year.
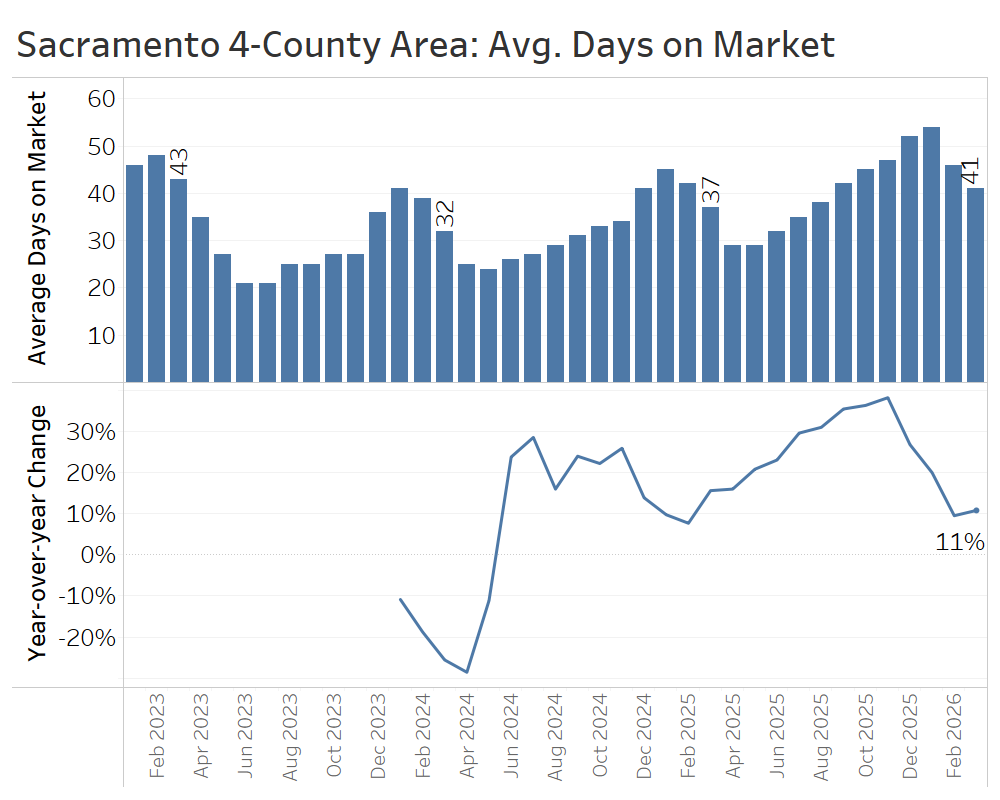
Average days on market rose by about four days compared to March 2025, reaching 41 days. That is a much more modest increase than the larger gains in days on market seen in late 2025.
Much like in the fourth quarter, total closed sales for the first quarter were almost identical to the prior year: about 3,840 so far this year compared to roughly 3,850 in the first quarter of 2025.
The median sale price of $605,000 in March was higher than the seasonal winter lows, but still 1% below the March 2025 median.
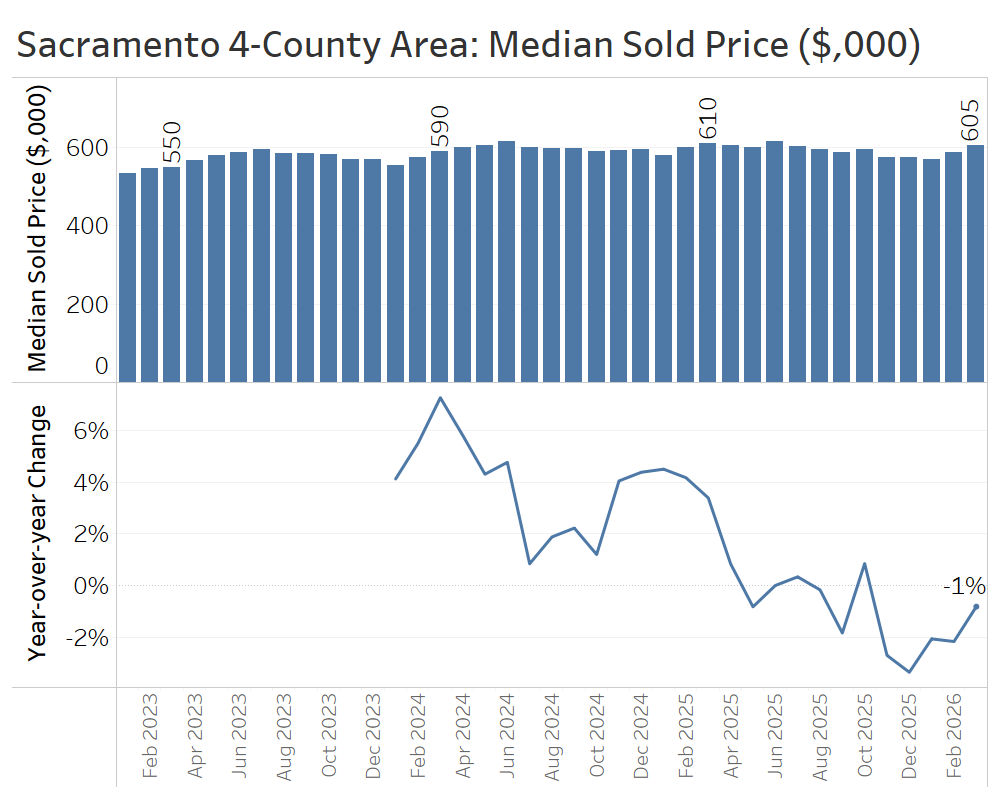
Overall, last year’s inventory growth around the Sacramento region led to a cooldown in pricing over the winter and into spring. Looking ahead, more modest inventory gains suggest that the pendulum won’t swing much further in favor of buyers.
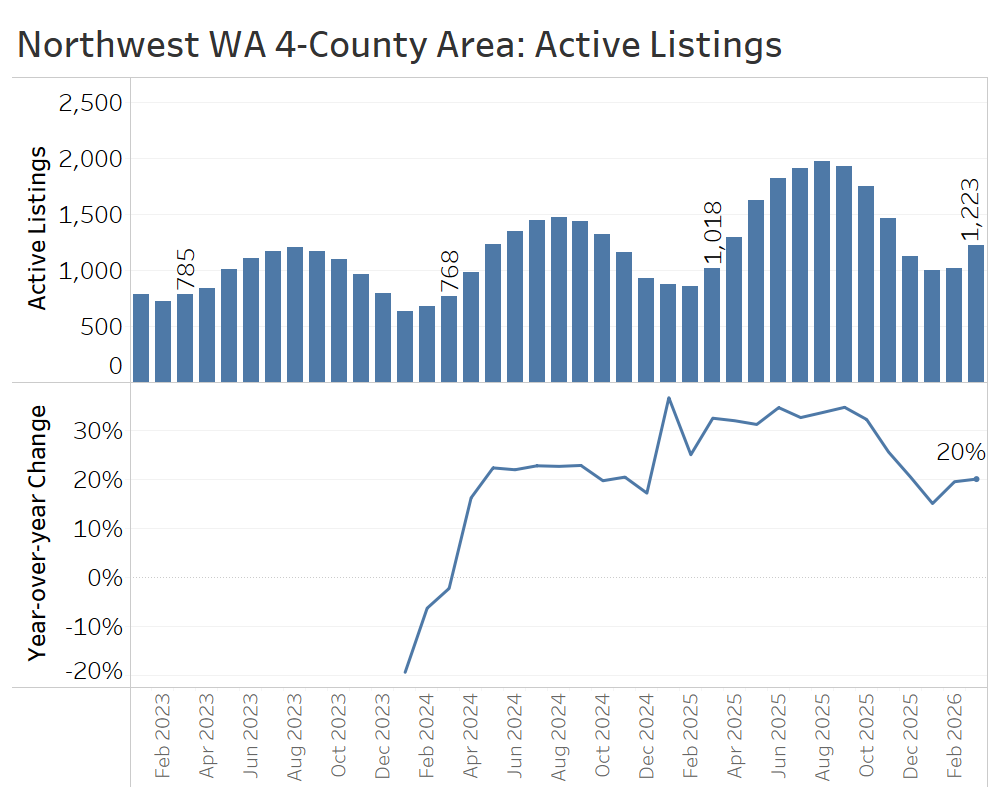
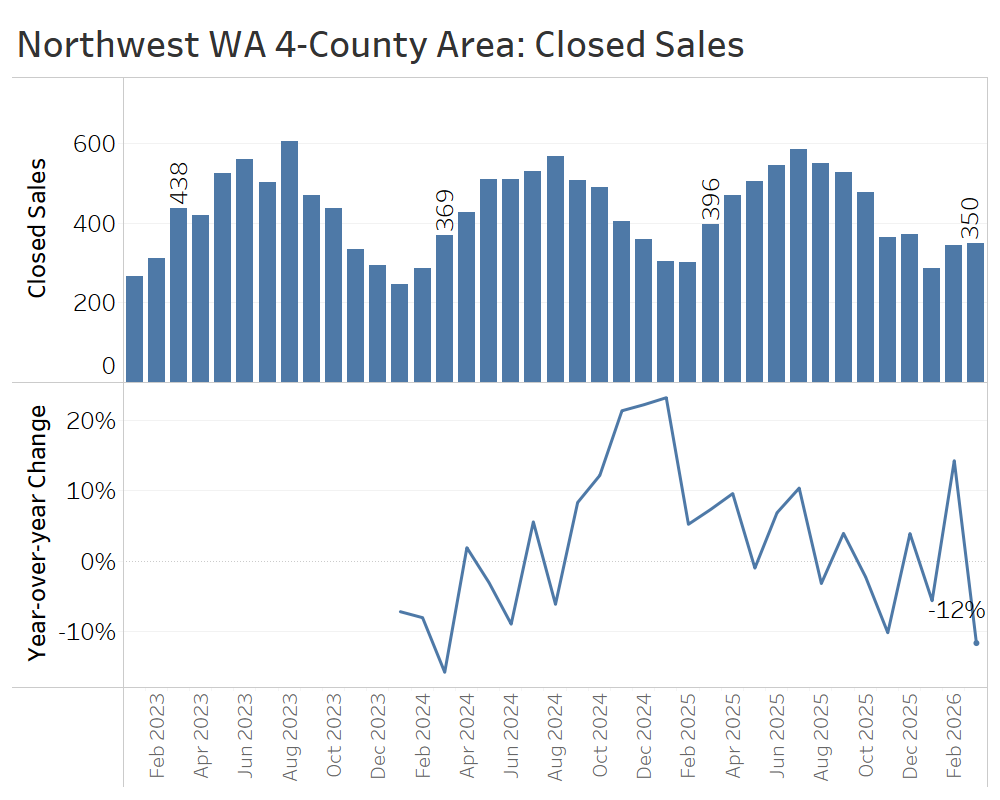
Northwest Washington (Skagit, Whatcom, San Juan, and Island Counties)
The market conditions in the four northernmost counties of Western Washington are still shifting toward buyers.
At the end of March, there were 1,223 active listings, up 20% from a year earlier. While that is slower than last summer’s inventory growth of 30% or more, it’s also no longer clearly decelerating.
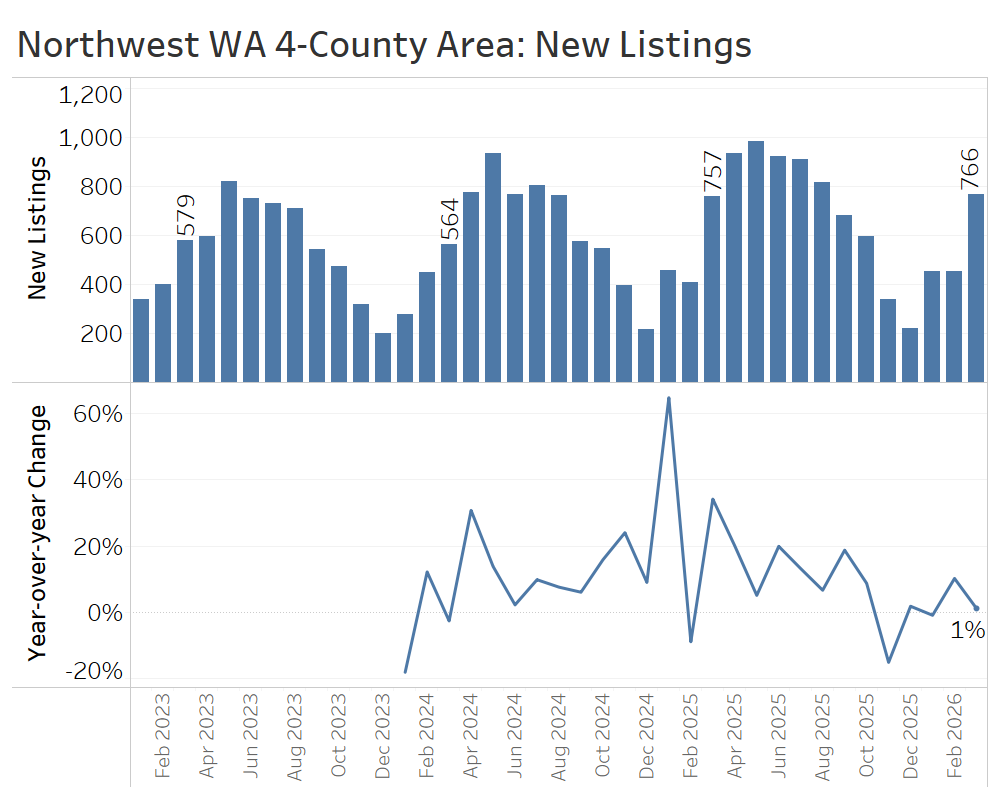
The flow of new listings slightly exceeded the first quarter of 2025, with a total of 1,669 new listings in the quarter, up 3% from last year’s 1,622. That is far from a flood of listings and likely reflects some discretionary sellers waiting until spring to list.
Days on market continued to climb compared to a year earlier, with homes in March taking nine days longer to sell than in March 2025.
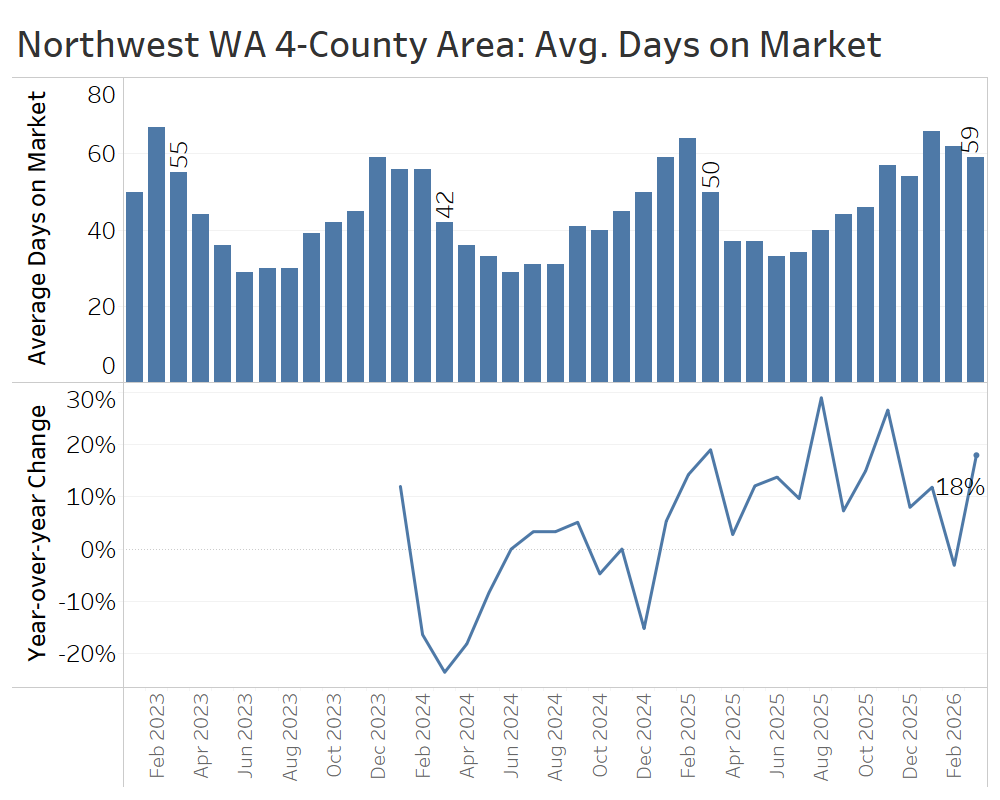
Closed home sales in the first quarter generally trailed first-quarter 2025 levels, except for a bump in February. In total, the 981 closed sales for the quarter fell 2% short of the 1,001 homes sold in the first quarter of 2025, but as the quietest quarter of the year, that statistic is prone to random variation.
Median sale prices actually ticked up in January and March, reaching a recent high of $652,000 in March. That likely doesn’t reflect true price appreciation, given the lack of growth in sales volume, but rather reflects a shift in the composition of sales toward higher-end segments.
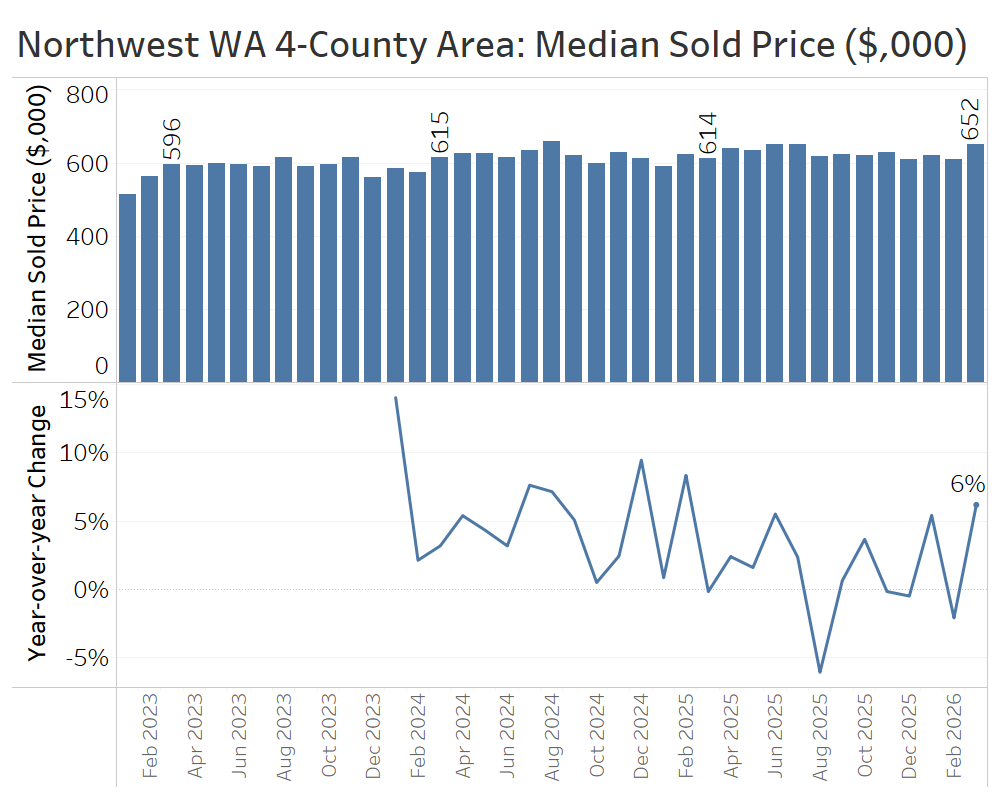
Overall, the first-quarter data has shown that the Northwest Washington housing market is off to a sluggish start this year.
Spokane, WA and Coeur d’Alene, ID Area (Spokane and Kootenai Counties)
The greater Spokane-Coeur d’Alene region, spanning the Washington-Idaho border, is experiencing many of the same market trends seen in Western Washington, including higher inventory, softer buyer demand, and flattening home prices.
At the end of March, there were 1,921 active listings, up 17% from March 2025.
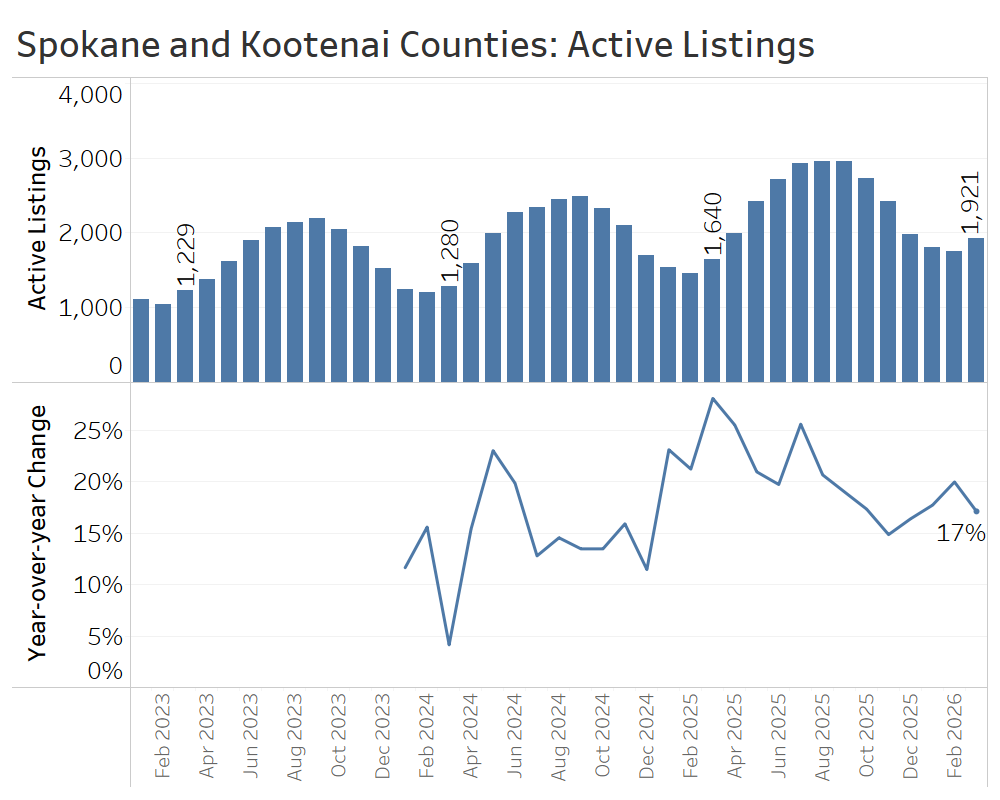
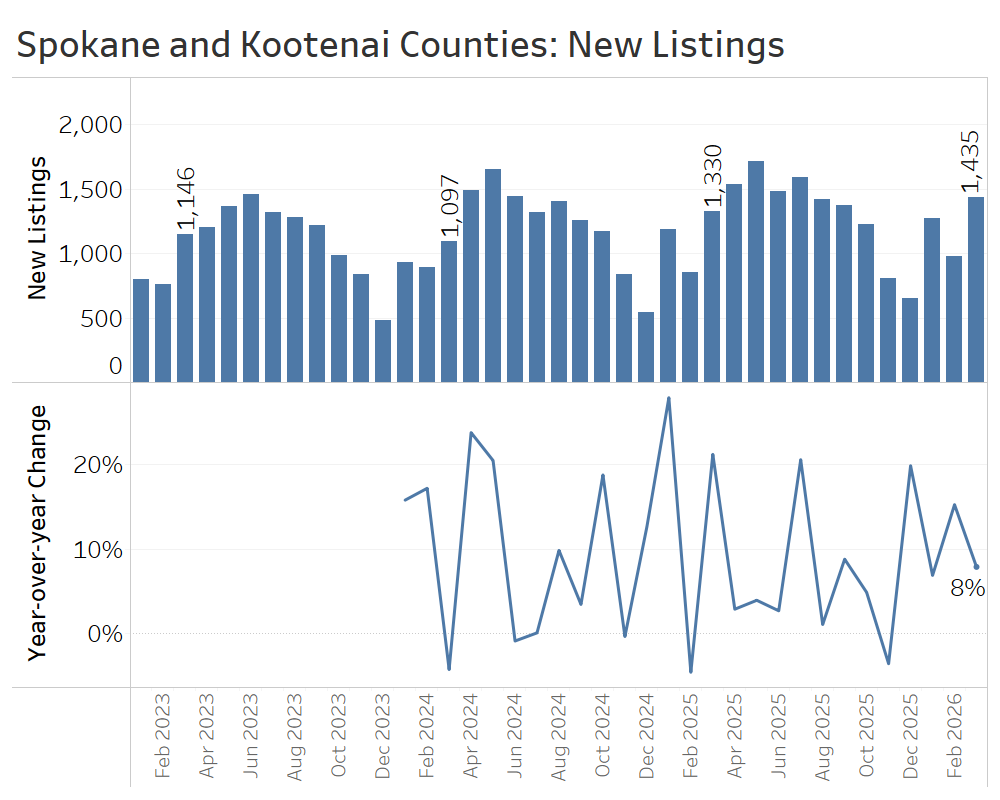
The greater Spokane area has seen strong growth in new listings since December. During the first quarter, there were 3,688 new listings, up 9% from the first quarter of 2025.
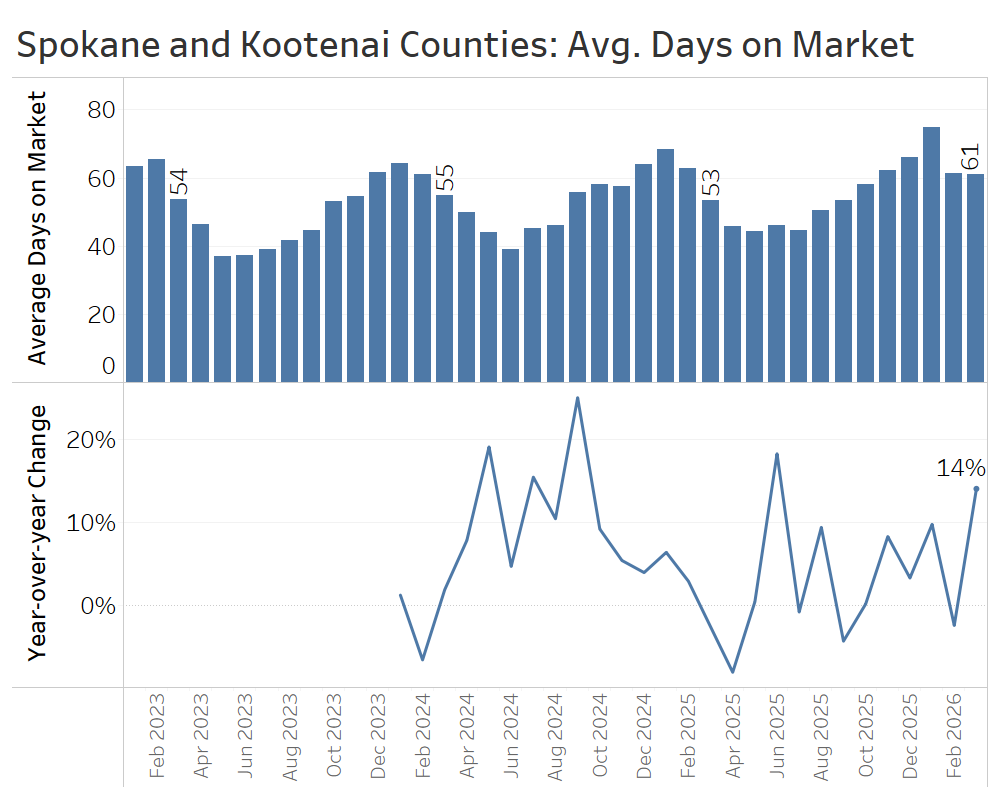
Days on market fell from its seasonal winter high to 61 days in March, though that is still 8 days slower than in March of 2025. That average also masks a wide gap across the state border, between 94 average days on market in Kootenai County compared to roughly half that—46 days—in Spokane County.
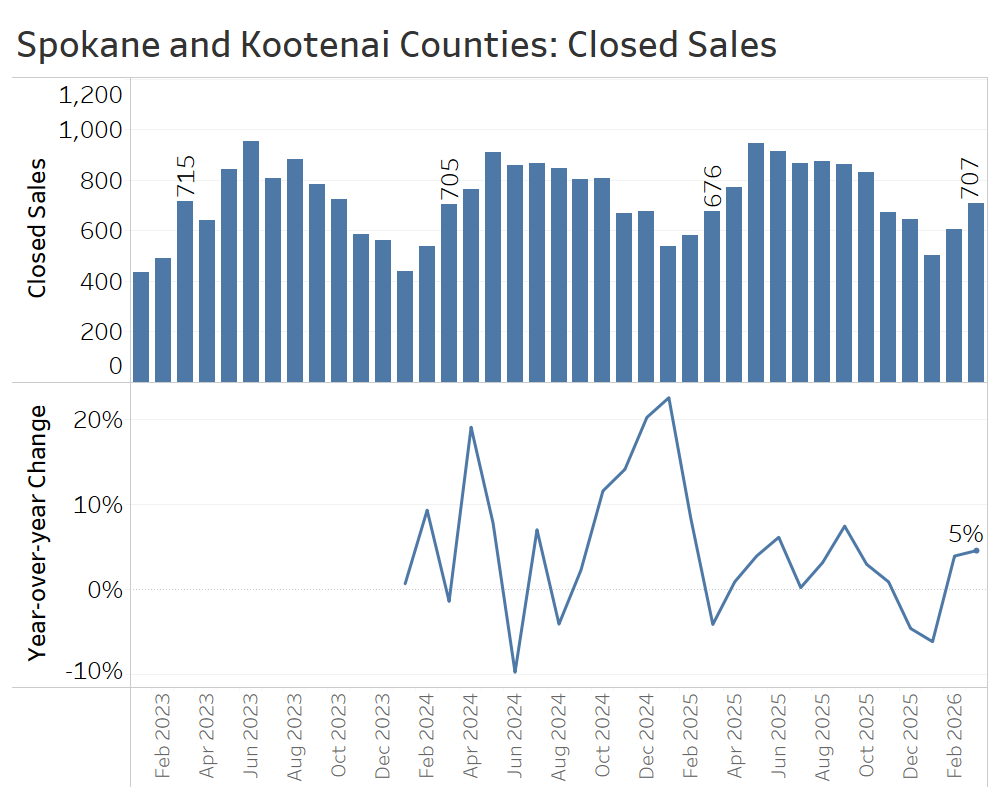
Closed sales were up 5% in March, helping to offset a weak January so that first-quarter closed sales totaled 1,817, about 1% more than first quarter of 2025.
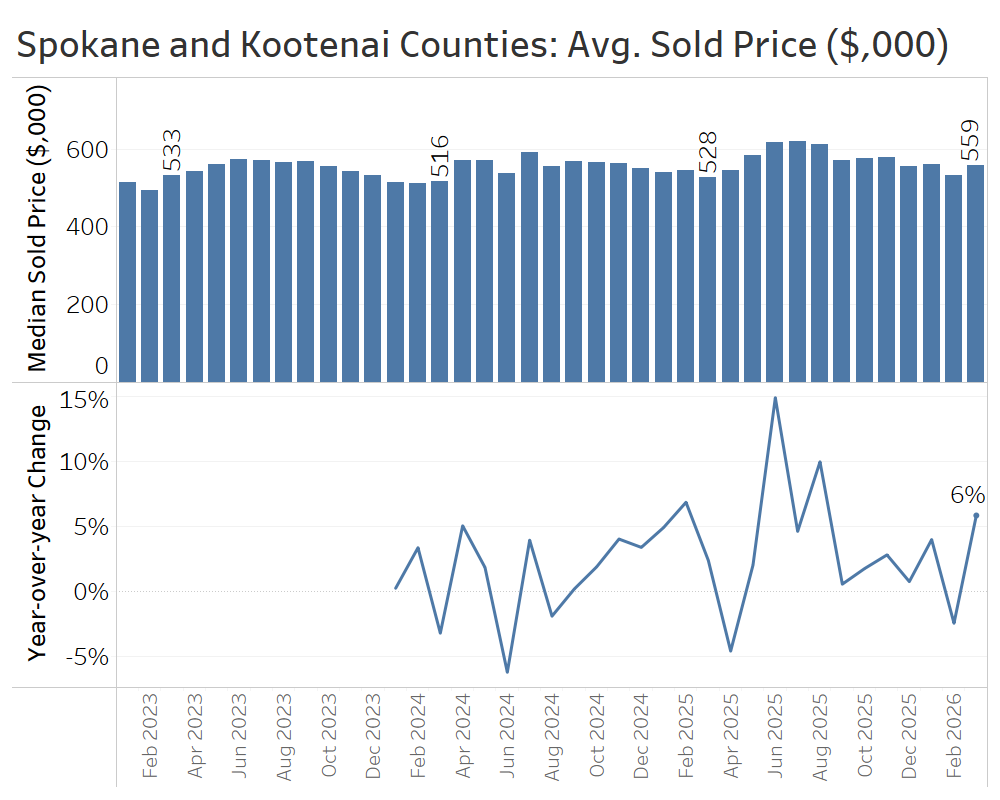
Compared with March 2025, the average sale price in March rose about 6%, from $528,000 to $559,000. For the quarter as a whole, prices increased 2%, rising from $537,000 in the first quarter of 2025 to $550,000 in the first quarter of this year.
Altogether, the greater Spokane-Coeur d’Alene area has looked like a balanced market so far this spring, with modest year-over-year gains in both sales (1%) and average sale prices (2%).
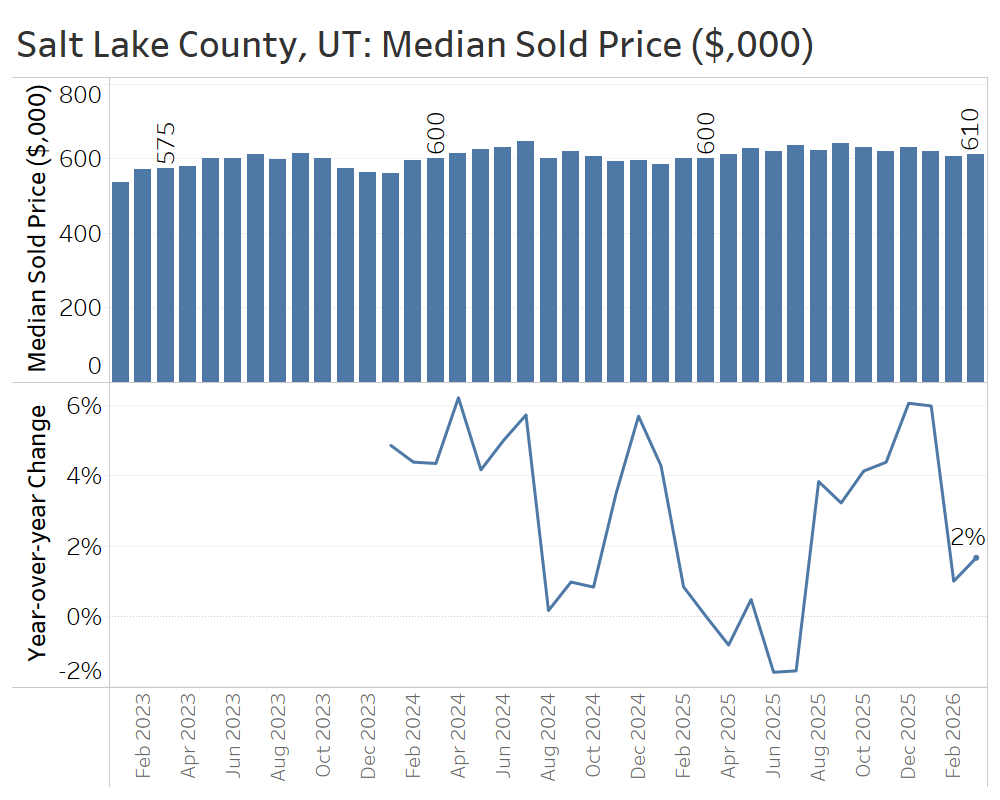
Salt Lake County, Utah
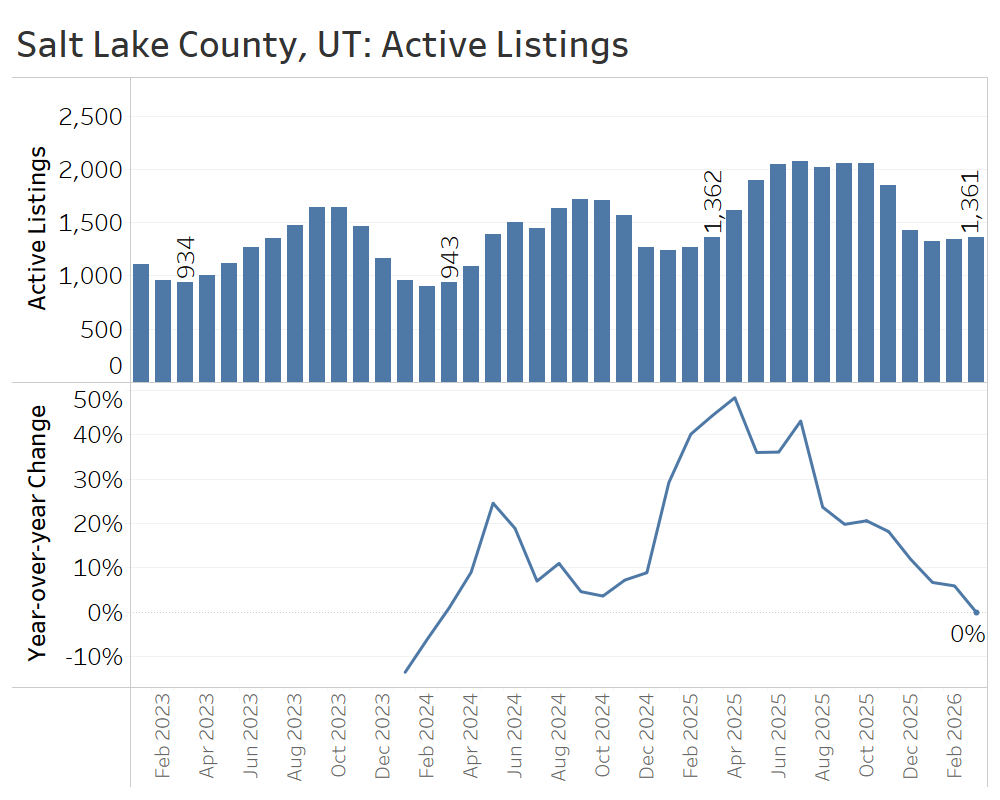
In the first quarter of 2026, the Salt Lake County market saw strong sales activity and the clearing of an inventory overhang. That continues a broader shift in Utah’s largest market, from conditions favoring buyers in early 2025 to a more balanced market—and in some segments, even a seller’s market—by spring 2026.
Active listings at the end of March stood at 1,361 homes, virtually identical to a year earlier. That completes a round trip from rapid inventory buildup last spring to slowing year-over-year growth last fall, suggesting that supply and demand have returned to a more balanced state in the Salt Lake market.
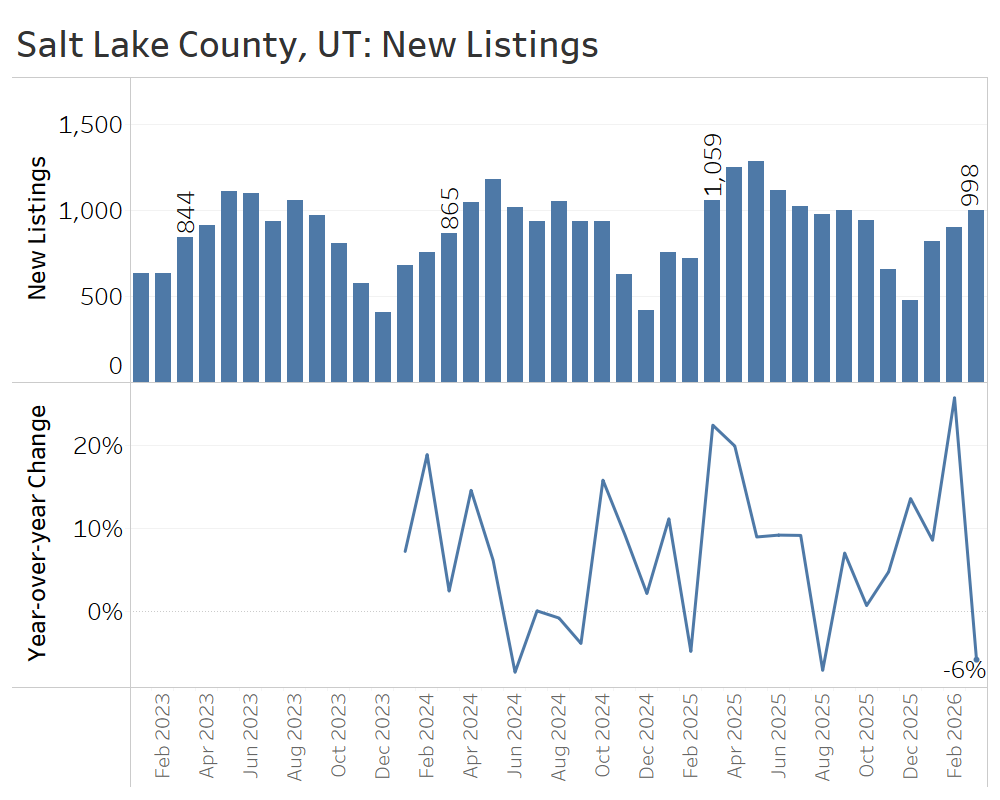
New listings dipped 6% year over year in March, but strong growth in January and February meant the flow of new listings still rose 7% in the first quarter compared to the year prior.
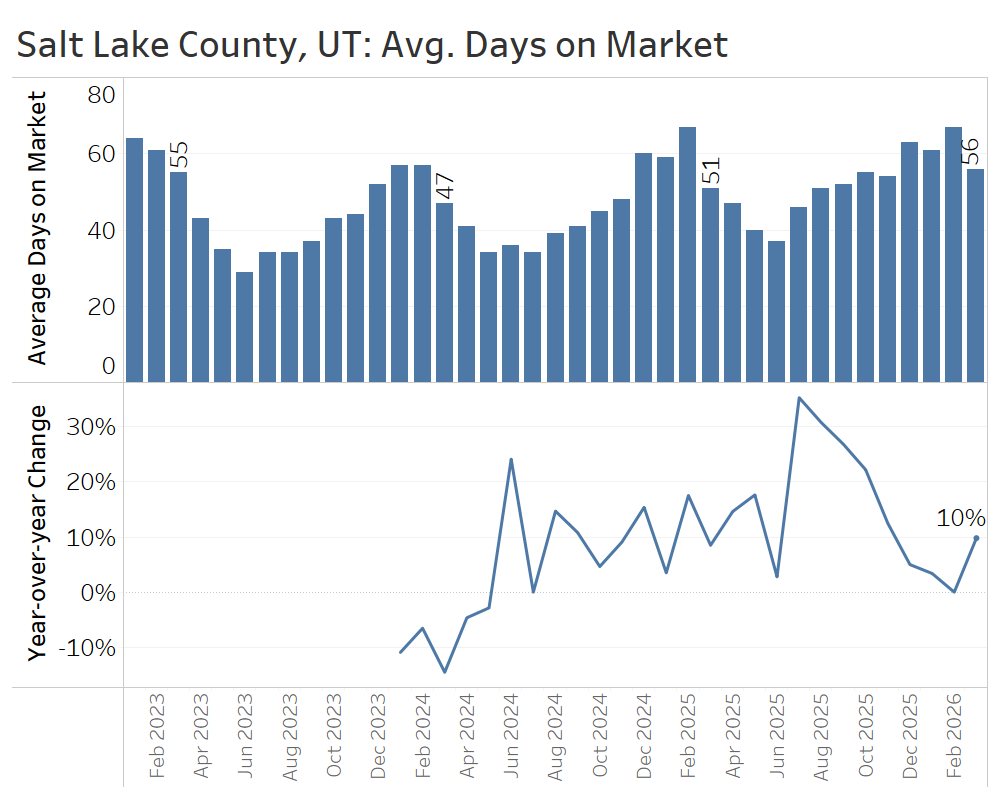
The average number of days it took to sell a home in Salt Lake County ended the first quarter at 56 days, up from 51 days a year earlier. This reflects the typical seasonal pattern of declining days on market in spring, but the year-over-year increase suggests the market has not yet shifted into a decisive seller’s market.
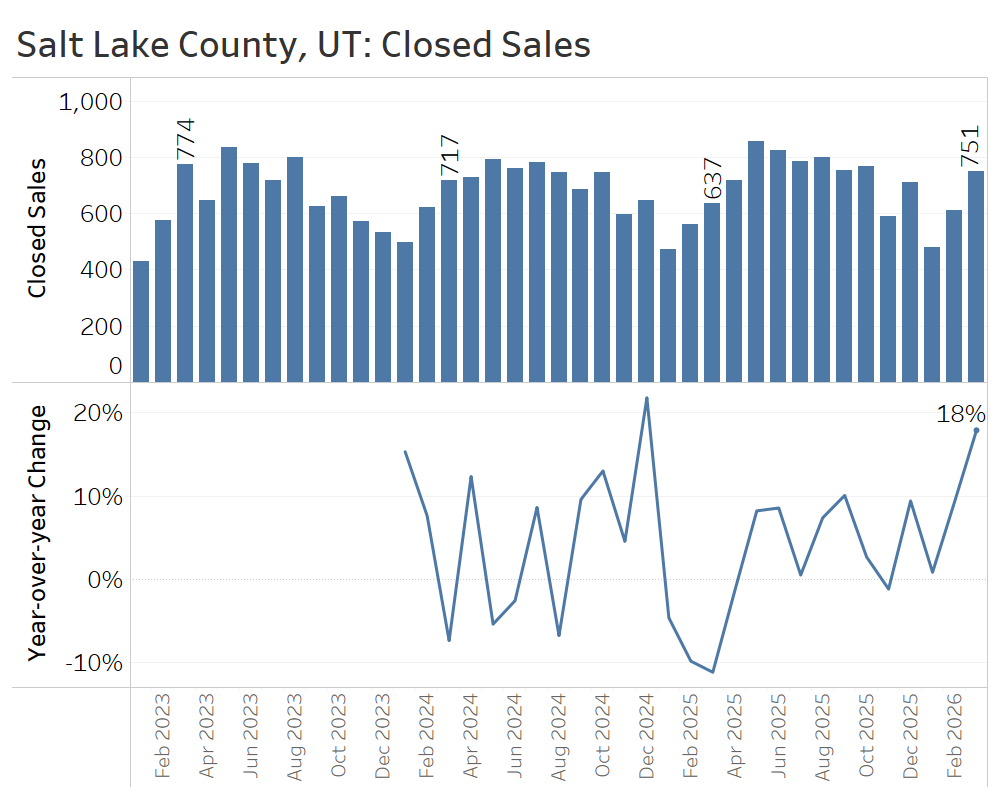
Closed home sales in March 2026 rose 18% compared to March 2025, capping a strong first quarter with about 10% more closed sales in total than in the weak first quarter of 2025.
In March, the median sale price in Salt Lake County rose 2% year over year—from $600,000 to $610,000. That marked the eighth straight month of price gains but reflected a slowdown in the pace of price gains from late 2025.
Salt Lake County’s strong start to the spring selling season was driven by growth in unit sales, not big price gains, suggesting a broad-based growth in activity as buyers return while having plenty of inventory to choose from. The lack of inventory growth year over year suggests Salt Lake County has completed its transition from a buyer’s market early in 2025 to more balanced conditions today.
Conclusion:
The housing market is cyclical, with predictable seasonal swings in demand alongside less predictable longer-term shifts. At the end of the first quarter of 2026, many of the markets highlighted here are in a somewhat unusual balance, where the seasonally strongest period of demand—the spring selling season—is meeting a broader market cooldown marked by higher inventory, longer time on market, and slower price appreciation.
That combination makes for a more difficult market to navigate than usual. Buyers may feel whiplash, moving from being outbid by a dozen offers on one home to getting a below-list offer accepted on another down the street that just needs a fresh coat of paint. Sellers, meanwhile, may decide to list their home at an aggressive price after hearing about nearby homes selling far above list price, only to wonder why they’re not receiving any offers.
In a market like this, it pays to work with a skilled real estate professional who can cut through the noise of local data to determine a home’s fair price, while also understanding the nuances of which homes are selling quickly and which are selling at a discount in this unusual spring selling season.
Sources: TrendGraphix analysis of NWMLS, RMLS, Spokane MLS, Coeur d’Alene MLS, MetroList MLS, and Wasatch Front MLS data.
")


