Market News December 4, 2023

10 Housing Predictions for 2024


This video shows Windermere Chief Economist Matthew Gardner’s Top 10 Predictions for 2024. Each month, he analyzes the most up-to-date U.S. housing data to keep you well-informed about what’s going on in the real estate market. See more market insights on our blog here. 


Matthew Gardner’s Top 10 Predictions for 2024

1. Still no housing bubble

This was number one on my list last year and, so far, my forecast was spot on. The reason why I’m calling it out again is because the market performed better in 2023 than I expected. Continued price growth, combined with significantly higher mortgage rates, might suggest to some that the market will implode in 2024, but I find this implausible.

2. Mortgage rates will drop, but not quickly

The U.S. economy has been remarkably resilient, which has led the Federal Reserve to indicate that they will keep mortgage rates higher for longer to tame inflation. But data shows inflation and the broader economy are starting to slow, which should allow mortgage rates to ease in 2024. That said, I think rates will only fall to around 6% by the end of the year.

3. Listing activity will rise modestly

Although I expect a modest increase in listing activity in 2024, many homeowners will be hesitant to sell and lose their current mortgage rate. The latest data shows 80% of mortgaged homeowners in the U.S. have rates at or below 5%. Although they may not be inclined to sell right now, when rates fall to within 1.5% of their current rate, some will be motivated to move.

4.Home prices will rise, but not much

While many forecasters said home prices would fall in 2023, that was not the case, as the lack of inventory propped up home values. Given that it’s unlikely that there will be a significant increase in the number of homes for sale, I don’t expect prices to drop in 2024. However, growth will be a very modest 1%, which is the lowest pace seen for many years, but growth all the same.

5. Home values in markets that crashed will recover

During the pandemic there were a number of more affordable markets across the country that experienced significant price increases, followed by price declines post-pandemic. I expected home prices in those areas to take longer to recover than the rest of the nation, but I’m surprised by how quickly they have started to grow, with most markets having either matched their historic highs or getting close to it – even in the face of very high borrowing costs. In 2024, I expect prices to match or exceed their 2022 highs in the vast majority of metro areas across the country.

6. New construction will gain market share

Although new construction remains tepid, builders are benefiting from the lack of supply in the resale market and are taking a greater share of listings. While this might sound like a positive for builders, it’s coming at a cost through lower list prices and increased incentives such as mortgage rate buy downs. Although material costs have softened, it will remain very hard for builders to deliver enough housing to meet the demand.

7. Housing affordability will get worse

With home prices continuing to rise and the pace of borrowing costs far exceeding income growth, affordability will likely erode further in 2024. For affordability to improve, it would require either a significant drop in home values, a significant drop in mortgage rates, a significant increase in household incomes, or some combination of the three. But I’m afraid this is very unlikely. First-time home buyers will be the hardest hit by this continued lack of affordable housing.

8. Government needs to continue taking housing seriously

The government has started to take housing and affordability more seriously, with several states already having adopted new land use policies aimed at releasing developable land. In 2024, I hope cities and counties will continue to ease their restrictive land use policies. I also hope they’ll continue to streamline the permitting process and reduce the fees that are charged to builders, as these costs are passed directly onto the home buyer, which further impacts affordability.

9. Foreclosure activity won’t impact the market

Many expected that the end of forbearance would bring a veritable tsunami of homes to market, but that didn’t happen. At its peak, almost 1-in-10 homes in America were in the program, but that has fallen to below 1%. That said, foreclosure starts have picked up, but still remain well below pre-pandemic levels. Look for delinquency levels to continue rising in 2024, but they will only be returning to the long-term average and are not a cause for concern.

10. Sales will rise but remain the lowest in 15 years

2023 will likely be remembered as the year when home sales were the lowest since the housing bubble burst in 2008. I expect the number of homes for sale to improve modestly in 2024 which, combined with mortgage rates trending lower, should result in about 4.4 million home sales. Ultimately though, demand exceeding supply will mean that sellers will still have the upper hand.


About Matthew Gardner

As Chief Economist for Windermere Real Estate, Matthew Gardner is responsible for analyzing and interpreting economic data and its impact on the real estate market on both a local and national level. Matthew has over 30 years of professional experience both in the U.S. and U.K.

In addition to his day-to-day responsibilities, Matthew sits on the Washington State Governors Council of Economic Advisors; chairs the Board of Trustees at the Washington Center for Real Estate Research at the University of Washington; and is an Advisory Board Member at the Runstad Center for Real Estate Studies at the University of Washington where he also lectures in real estate economics.

Selling November 27, 2023

High ROI Upgrades for Equestrian Properties

For equestrian homeowners who are thinking about selling, there’s a long list of to-dos to get to. Not only do you need to spruce up the home itself, but your surrounding property should be in prime condition as well. To maximize your return on investment and drive buyer interest, consider making strategic upgrades that enhance both your home and your land. Improvements like these will add value to your home and cater to the equestrian enthusiasts.

Boost Equestrian Property Value

Equestrian Facilities

What truly matters to equestrian buyers? Their horses. Knowing that their horses have access to high-quality facilities will be the key to attracting serious buyers. Focus your upgrading efforts on the stables and barns. Proper ventilation, spacious stalls, and easy access to the surrounding pastures on the property.

Buyers also want to know that their horses will be safe, so secure fencing is a must. Consider investing in durable fencing materials like vinyl, wood, or pipe fencing depending on the area that needs fixing and/or upgrading. Make sure all paddocks are fenced off appropriately. This is certainly a factor equestrian buyers will consider as they compare your property to other listings.

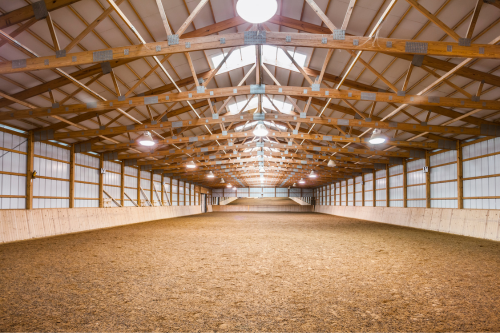
Depending on what discipline you’ve trained on your property, your riding arena will have different footing. Talk to an equestrian real estate specialist about best practices for upgrading and cleaning up your arena as you prepare to sell, they’ll be aware of any recent buyer trends and patterns you might want to lean into. What’s most important is that your riding arena look professional and clean, ready for buyers who are looking to train or compete.

The inside of a large enclosed riding arena on an equestrian property.

Image Source: Getty Images – Image Credit: JamesBrey

Equestrian Property Value: Landscaping

Maintaining an equestrian property is more time consuming than caring for a typical single-family home, but as you prepare to sell, your land maintenance will kick into high gear. Well-kept landscaping will not only increase your home value, but it will also provide a safe environment for the eventual buyer’s horses. This is especially important if your property has scenic trails; landscaping features like these are a selling point and should be treated with care accordingly.

Home Improvements

The typical high ROI remodeling projects like upgrading your bathrooms, bedrooms, and kitchen apply for equestrian homeowners as well, but there are certain equestrian-specific upgrades that will apply uniquely to home buyers with horses. A remodeled mudroom or tack room will help you differentiate your listing, as will sustainable upgrades like solar panels or renewable energy capabilities throughout the property. Sustainability continues to grow in importance for homeowners of all types, equestrian included. Now more than ever buyers are mindful of ways they can sustainably manage their property. If you invest in eco-friendly improvements, your property could appeal to a wider pool of buyers.

By making upgrades like these, you’ll present your equestrian property in the best light, and you’ll significantly increase your chances of engaging buyers who are willing to pay a premium. For more information on how to prepare your property for sale, connect with an experienced equestrian advisor:

Windermere Equestrian Advisors

Buying November 13, 2023

Multigenerational Home Buying Guide

For any family looking forward to multigenerational living, there’s much to consider when trying to find the right property. Whether you’re planning to welcome your parents or grandparents, provide a comfortable space for adult children, or simply want to create a home that accommodates your extended family, finding the right place takes time. Let’s take a look at some of the key factors that play a role in your home search.

Multigenerational Home Buying

Prioritize Location

Just as with any real estate purchase, location is vital to finding the right home for your extended family. For your young ones, you might consider the nearby schools. For the older folks in your home, you’ll want to know your proximity to healthcare facilities and community spaces. And for everyone under your roof, you’ll want to be close to the places that help you all enjoy life, such as parks, bodies of water, and other recreational areas.

How to Search for a Home

Floor Plan

With more people living in a multigenerational home, layout can often take precedence over aesthetics. Of course, you still want your next home to look the part, but fundamentally, you have a lot of foot traffic to account for and future accessibility to think about. Homes with separate living spaces are a great option for accommodating a large family. Features like a furnished basement, a mother-in-law suite, an accessory dwelling unit (ADU), or a detached guesthouse can solve a lot of problems, present and future.

Private Spaces

Along with an ideal layout, it’s important to have private spaces so each person can enjoy their time at home. Make sure there are separate bedrooms, bathrooms, and if possible, separate living areas to allow family members to make the most of their personal space while still enjoying the benefits of living together. You can either look for homes that have defined private spaces or identify the ones that are good candidates for remodeling projects that can create them.

Buying with Remodeling in Mind

Home Inspection

A thorough home inspection is a necessity. With several people living with you—some of whom may be elderly—you need to know that your home can provide for everyone for years to come. The home inspection will help you to identify any potential issues with the property and make informed decisions about how to negotiate with the seller.

When looking for properties, look at the condition of the roof, plumbing, electrical systems, and identify any potential structural concerns. Talk to your agent about the findings of the home inspection and what it means for you as you prepare to make an offer.

Home Inspection: A Reality Check from a Pro

Think About the Future
How will your needs change at home in the future? Thinking about the long term can help you narrow your home search. Maybe you’ll need additional space as your children grow up or as your parents age into their elderly years.

A home with a more flexible design and layout may be a better investment for you in the long term.


For more information on finding the right home, connect with a local, experienced Windermere agent today:

Button to Connect with an Agent


­­­­­­Featured Image Source: Getty Images – Image Credit: PeopleImages

Living November 6, 2023

How to Stay Safe at Home During a Power Outage

A stormy night with the lights out can complicate things at home. But with the right preparation, you and your household can switch gears quickly and ride out the blackout period, however long it may last. Power outages can happen unexpectedly, so taking the necessary steps to have a plan in place should be a priority. We’ll walk through some essential steps to stay safe, calm, and cozy when the lights go out.
Lighting During a Power Outage

The first thing you’ll miss during a power outage is light. Make sure you have flashlights, candles, lanterns, and plenty of batteries readily available. Check your devices to see which size batteries they require and make sure you have all the necessary sizes on hand. LED lanterns are energy-efficient and will stay lit for a long time to provide some illumination during an extended blackout.

Emergency Kit

A well-stocked emergency kit is essential during a power outage. Make sure you have a substantial supply of non-perishable food, bottled water, and an assortment of basic utensils. Along with your emergency kit, keep a first aid kit handy to ensure you’re fully prepared for a blackout-related emergency.

Staying Warm During a Power Outage

Even though the lights in your home are out, that doesn’t mean you have to be uncomfortable as you wait for them to come back on. This is especially important if the power outage occurs during the colder months of the year. Keep plenty of blankets and extra layers of clothing close by to make sure you and your family stay cozy. If you have a portable heater that you plan to use, pay attention to the manufacturer instructions to avoid possible carbon monoxide poisoning.

Home Security

Home safety and security is vital during a power outage. Make sure your home’s security system’s motion-activation is still functioning properly, and if it has a backup system, check that too. Unfortunately, some burglars may see a blackout as an opportunity to take advantage of the low-visibility conditions. Lock your windows and secure the deadbolts on your door so you and your household can wait out the power outage in peace.

Preserve Food

Try to keep your refrigerator and freezer closed as much as possible. Use your perishable food rations in your emergency kit as a first option for a meal during the power outage and stick to other non-perishable food items in your pantry. Hopefully, the power will come back on soon enough and you’ll be able to resume your normal food preparation. But if you’re constantly opening the fridge and freezer while the power’s out, your food will spoil quickly, and you could have quite a mess on your hands. 7 Tips for Cleaning Your Appliances

Staying Entertained

Who says you can’t have fun during a power outage? With all your preparations in place, a blackout presents the chance for you and your household to enjoy some electronic-free activities. Have board games, books, arts and crafts materials, and decks of cards at the ready. If you have kids, plan some fun activities ahead of time that they’ll enjoy.

For more tips on emergency planning at home, visit the Living section of our blog:

Windermere Blog | Living


­­­­­­Featured Image Source: Getty Images – Image Credit: ASphotowed

Market News November 3, 2023

Q3 2023 Arizona Real Estate Market Update

The following analysis of select counties of the Arizona real estate market is provided by Windermere Real Estate. We hope that this information may assist you with making better-informed real estate decisions. For further information about the housing market in your area, please don’t hesitate to contact your Windermere Real Estate agent.


Regional Economic Overview

Job growth in Arizona has levelled off. The addition of 57,000 new jobs over the past 12 months represents an annual growth rate of 1.8%, which matches the level in the second quarter of this year. That said, Arizona’s unemployment rate in August was 3.8%, down from 4% in the third quarter of 2022.

Looking at the metro markets contained in this report, over the past 12 months Phoenix saw its job base rise 1.9% or 40,200 positions. With the addition of only 400 new jobs, employment in Prescott rose .6%. Unemployment rates suggested that both markets remain close to full employment, with the Phoenix area showing a jobless rate of 3.5%, while the unemployment rate in Prescott was 3.8%. The jobless rate in Phoenix matched the level in the third quarter of 2022, while Prescott saw its rate rise from 3.5%.

Arizona Home Sales

In the third quarter of 2023, 14,711 homes sold. This was down 7% from the third quarter of 2022 and down 21.3% compared to the second quarter of this year.

The slowdown in sales from the second quarter came in concert with a modest .9% increase in listing activity. It appears that the impact of higher mortgage rates is starting to be felt.

Sales fell in Maricopa and Yavapai counties from the same period of 2022. Sales were up almost 8% in Pinal County. Compared to the second quarter of this year, sales fell across the board.

Pending sales fell in Pinal and Maricopa counties but rose in the smaller Prescott market compared to the second quarter of 2023. With Maricopa County accounting for 84% of the market, I think it’s safe to assume that sales in the fourth quarter may also be down.

A bar graph showing the annual change in home sales by County in Arizona from Q3 2022 to Q3 2023. From top to bottom, Pinal had a 7.8% increase, Yavapai had a 0.4% decrease, and Maricopa had a 9.4% decrease.

Arizona Home Prices

Home sale prices rose a modest 1.9% compared to the third quarter of 2022 but were 2.2% lower than in the second quarter of the year. The average sale price was $596,465.

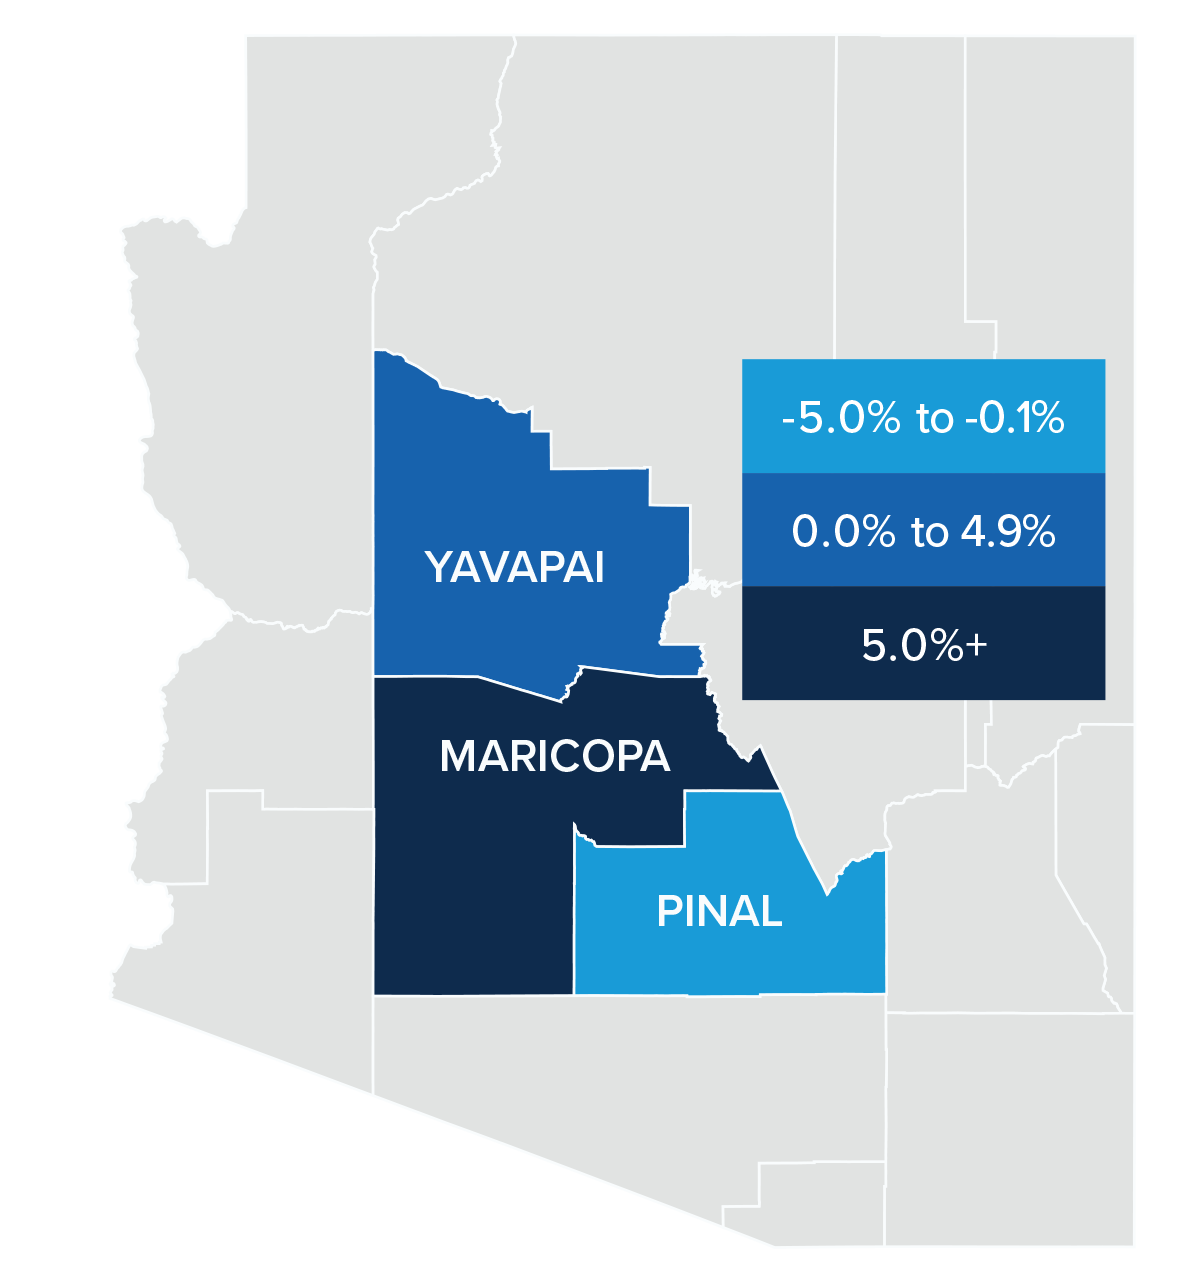
Compared to the second quarter of this year, sale prices were 24.3% higher in Yavapai County but fell in the other two markets. Pinal County prices dropped .2% and Maricopa County prices were 2.3% lower.

Lower sale prices are likely due to higher mortgage rates and decreasing affordability, as well as the fact that median list prices fell 1.7% between the second and third quarters of the year.

With list prices lower and mortgage rates substantially higher, I doubt prices will see tangible increases for the remainder of the year.

A map showing the real estate home prices percentage changes for various counties in Arizona. Different colors correspond to different tiers of percentage change. Maricopa came in above 5% and represented in the corresponding navy color. Yavapai was in the 0-4.9% range and is represented by a light blue color. Pinal was in the -5 to -1% range and is in the lightest blue color.

A bar graph showing the annual change in home sale prices by county in Arizona from Q3 2022 to Q3 2023. From top to bottom, Maricopa had a 27.6% increase, Yavapai had a 2.9% increase and Pinal had a 4.5% decrease.

Mortgage Rates

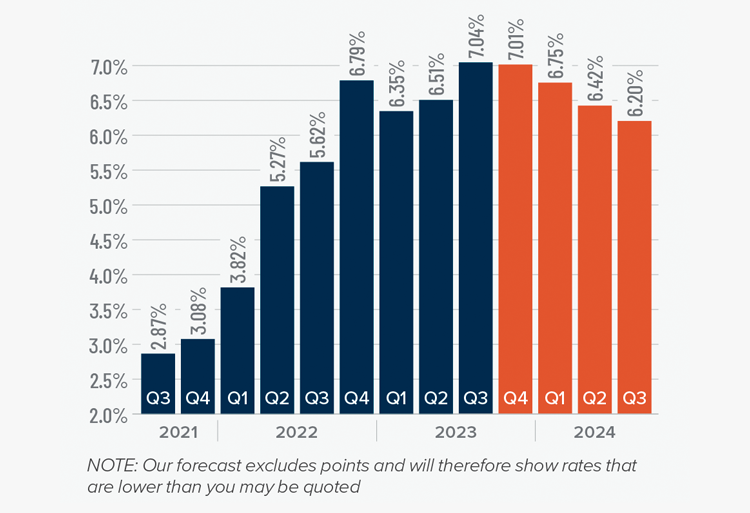
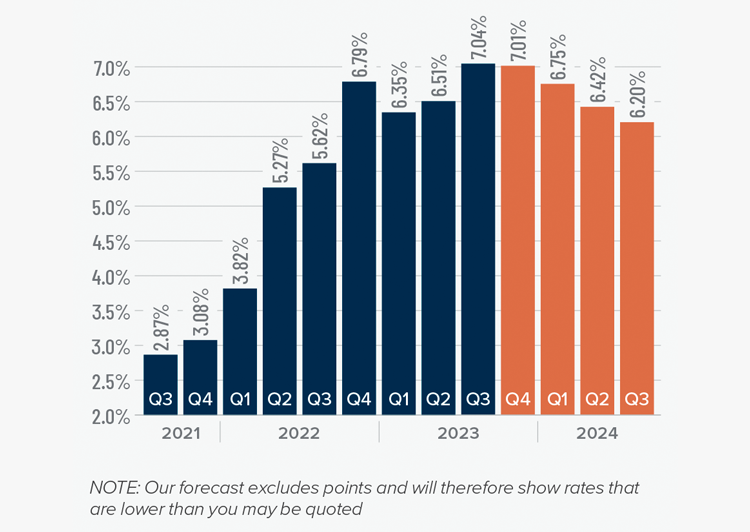
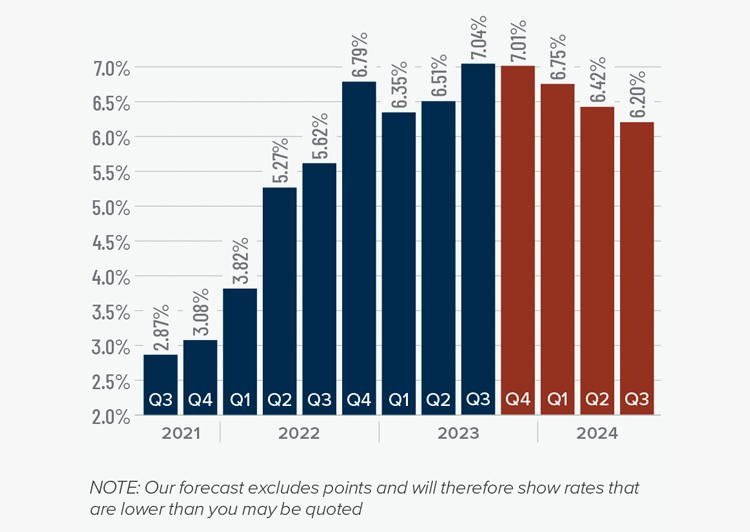
Mortgage rates continued trending higher in the third quarter of 2023 and are now at levels we have not seen since the fall of 2000. Mortgage rates are tied to the interest rate (yield) on 10-year treasuries, and they move in the opposite direction of the economy. Unfortunately for mortgage rates, the economy remains relatively buoyant, and though inflation is down significantly from its high, it is still elevated. These major factors and many minor ones are pushing Treasury yields higher, which is pushing mortgage rates up. Given the current position of the Federal Reserve, which intends to keep rates “higher for longer,” it is unlikely that home buyers will get much reprieve when it comes to borrowing costs any time soon.

With such a persistently positive economy, I have had to revise my forecast yet again. I now believe rates will hold at current levels before starting to trend down in the spring of next year.

A bar graph showing the mortgage rates from Q3 2021 to the present, as well as Matthew Gardner's forecasted mortgage rates through Q3 2024. In Q3 2023 Mortgage Rates hit 7.04% and Matthew Gardner predicts rates will decrease steadily over the next 4 quarters.

Arizona Days on Market

It took an average of 54 days for a home to sell in the third quarter of 2023. This was 20 more days than in the same quarter of 2022, but 11 fewer days compared to the second quarter of this year.

Maricopa County was the tightest market in the region, with homes taking an average of 41 days to sell. Homes in Pinal and Yavapai counties took the longest time to sell at 61 days.

All counties contained in this report saw average days on market rise from the same period in 2022, but market time fell across the board compared to the second quarter of this year.

The greatest drop in market time compared to the second quarter of this year was in Pinal County, where it took 15 fewer days for a home to sell.

A bar graph showing the days on market by county for homes in Arizona in Q3 2023. From top to bottom, Maricopa had the least at 41, Pinal and Yavapai both had 61.

Conclusions

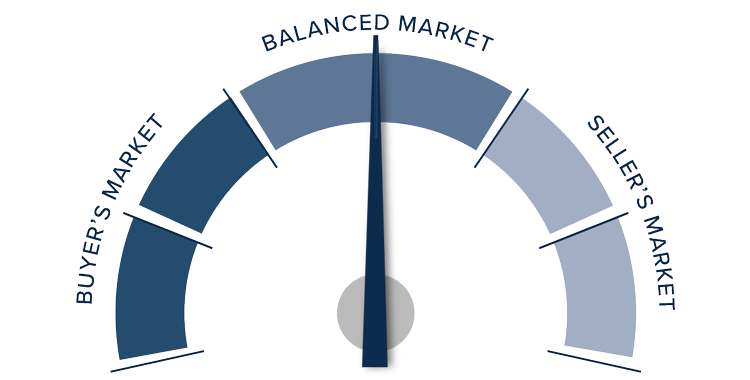
This speedometer reflects the state of the region’s real estate market using housing inventory, price gains, home sales, interest rates, and larger economic factors.

Lower pending and closed sales, in concert with falling list and sale prices, suggest that the market has shifted away from home sellers.

Although supply levels rose modestly from the previous quarter, they were down 42% from the same period in 2022, so the market cannot be described as oversupplied. This will function as some protection when it comes to home values, but prices likely won’t move much until mortgage rates start to drop, which won’t happen until early next year.

Home sales will still occur because there will always be households who have to move, but many buyers will be sidelined until rates come down, which means the housing market will remain somewhat static for the balance of the year.

A speedometer graph indicating the market in Arizona for Q3 2023. The needle points directly in the middle of “balanced market.”

Given these factors, the needle has been moved back into the balanced quadrant, with neither buyers nor sellers having the upper hand.

Market News November 3, 2023

Q3 2023 Northern California Real Estate Market Update

The following analysis of select counties of the Northern California real estate market is provided by Windermere Real Estate. We hope that this information may assist you with making better-informed real estate decisions. For further information about the housing market in your area, please don’t hesitate to contact your Windermere Real Estate agent.


Regional Economic Overview

Total employment levels in the counties covered by this report fell year over year, with losses in all eight counties.

The regional unemployment rate rose to 4.3%, which was up from 3.3% in the third quarter of 2022, and is now at the highest level since January of 2022. By county, the lowest jobless rate was in Napa (3.6%) while the highest rate was in Shasta, where 5.1% of the labor force was looking for a job.

Northern California Home Sales

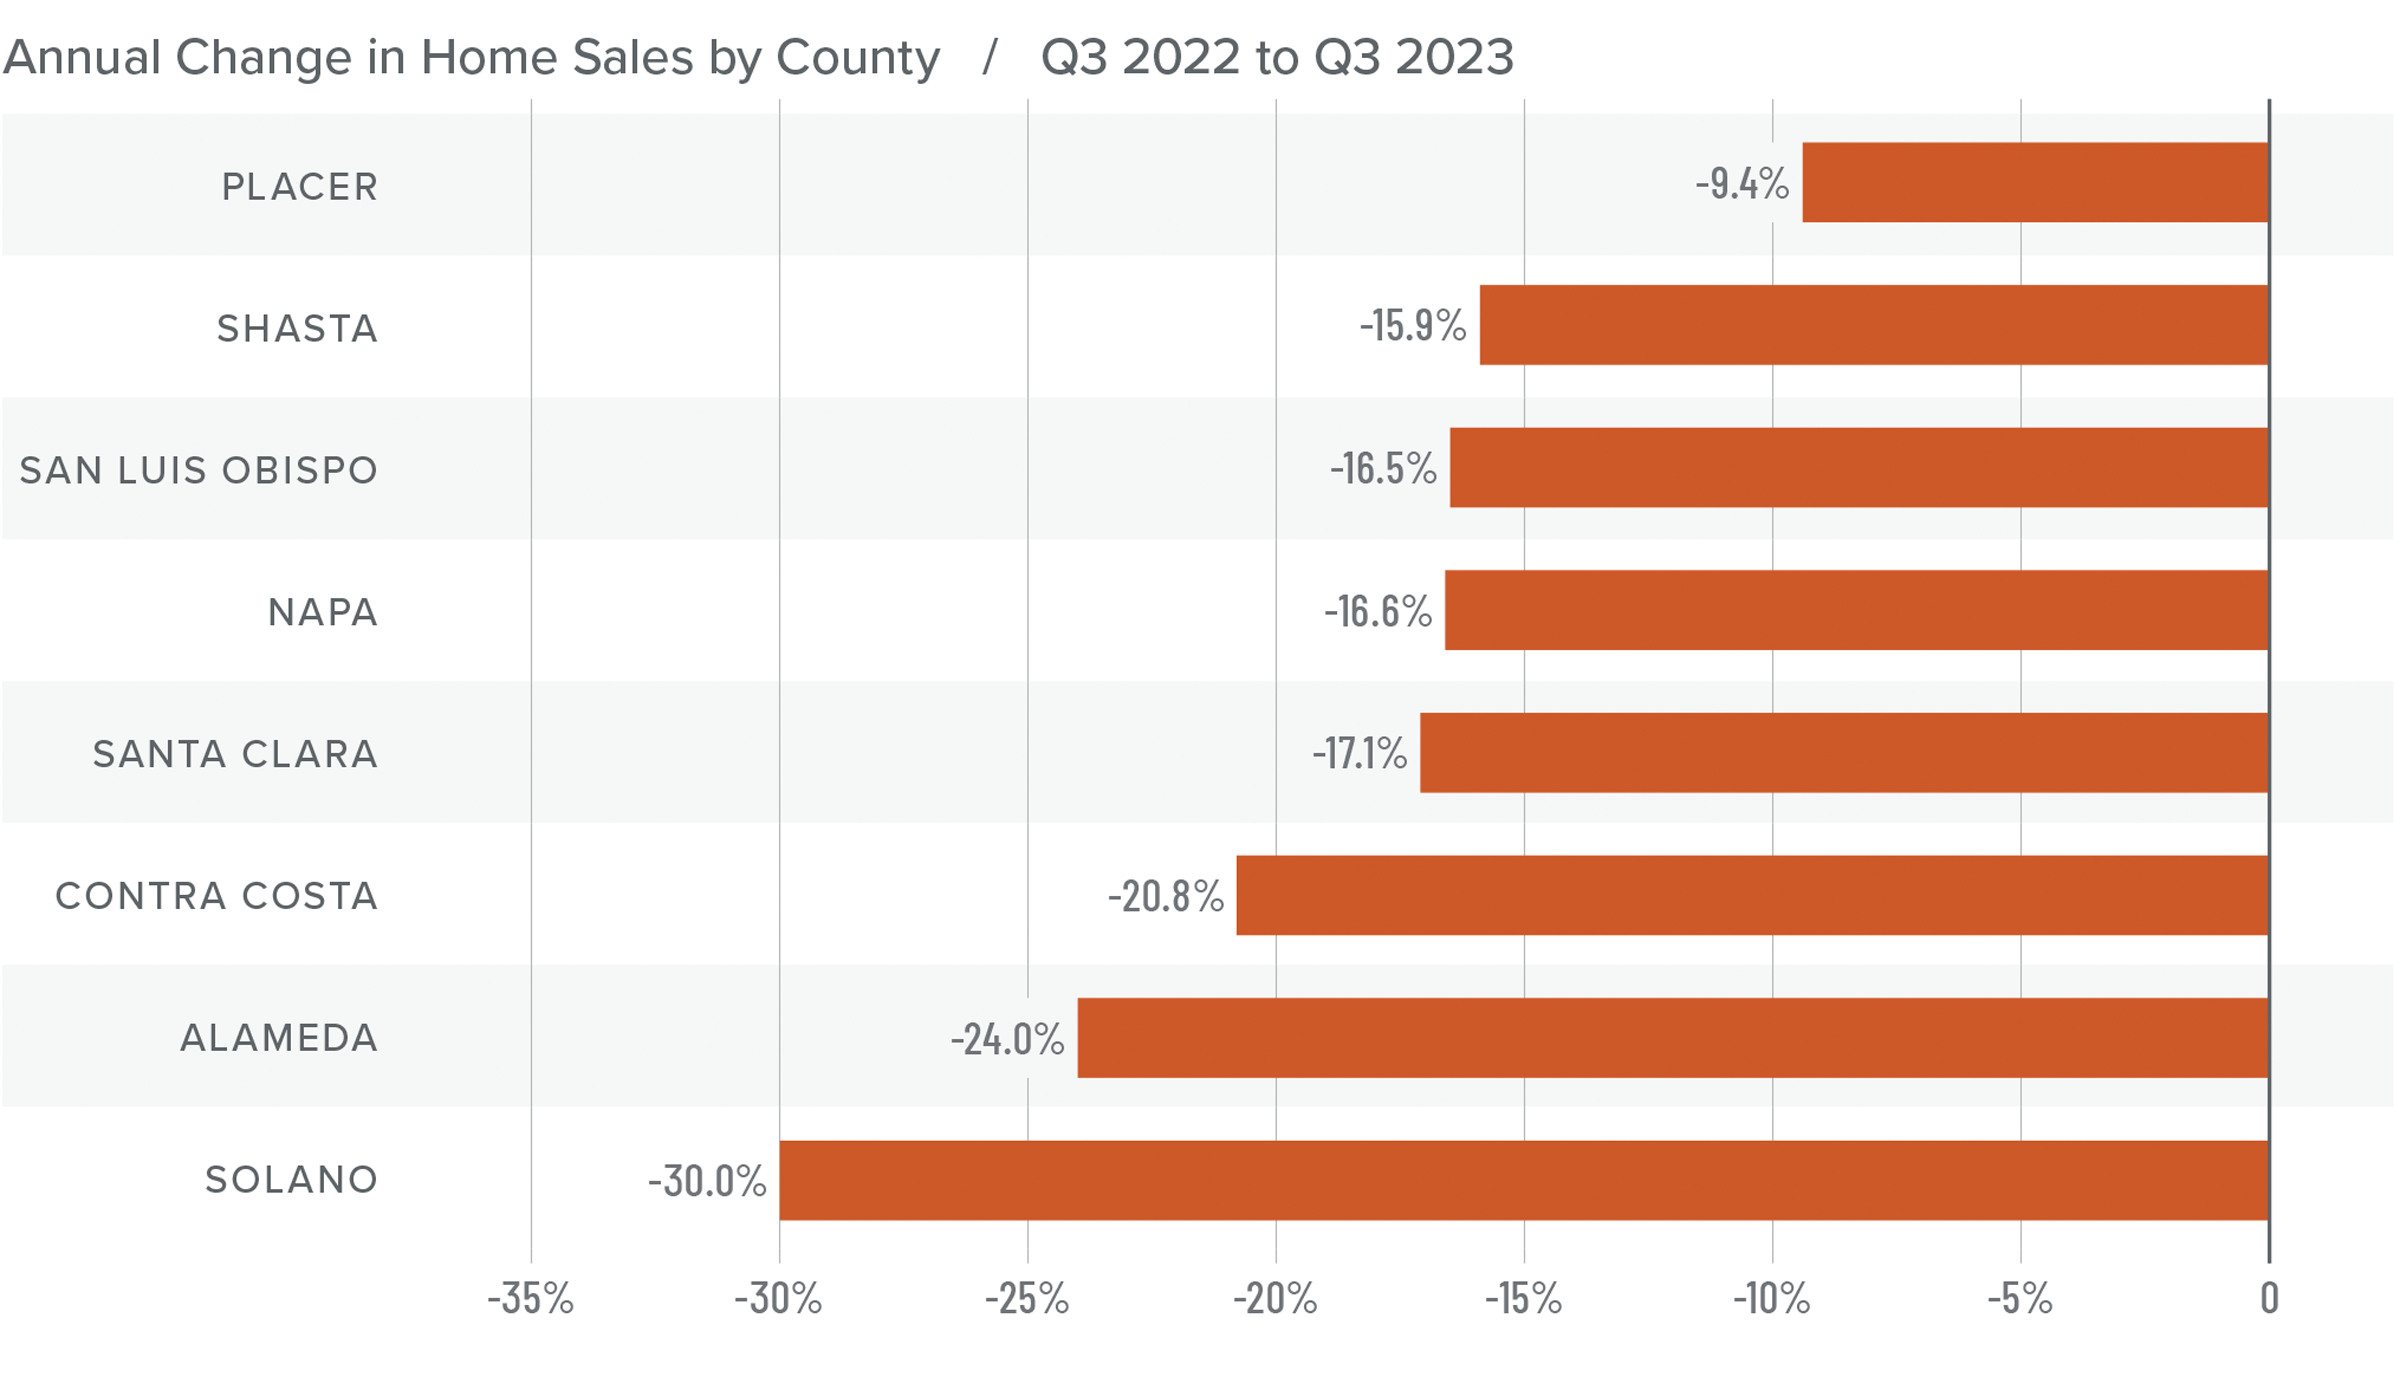
In the third quarter of 2023, 9,284 homes sold, which was a 20% drop from the third quarter of 2022. Sales were 8.4% lower than in the second quarter of this year.

Year over year, sales fell across the board. Only San Luis Obispo was able to grow sales from the previous quarter, but the increase was a very modest .9%.

Quarter over quarter, listing inventory was up 16.2%. The average number of homes for sale was down 37.2% from the third quarter of 2022.

Pending home sales were down 9.8% from the second quarter, suggesting that the market is likely going to continue cooling as we move through the balance of 2023.

A bar graph showing the annual change in home sales by County in Northern California from Q3 2022 to Q3 2023. Placer County had the least change with a 9.4% decrease and is represented with the bar at the top. Solano had the greatest decrease of 30% while Napa and Santa Clara are in the middle of the map with -16.6% and -17.1% respectively.

Northern California Home Prices

Higher financing costs are impacting home sale prices, which dropped 1.2% from the second quarter of 2023 but were 3.9% higher than during the same period of 2022. The average sale price was $1.217 million.

Median list prices in the region fell 3.8% from the second quarter, with double-digit declines in Placer and Napa counties. All counties except Santa Clara (which was flat) saw list prices fall quarter over quarter.

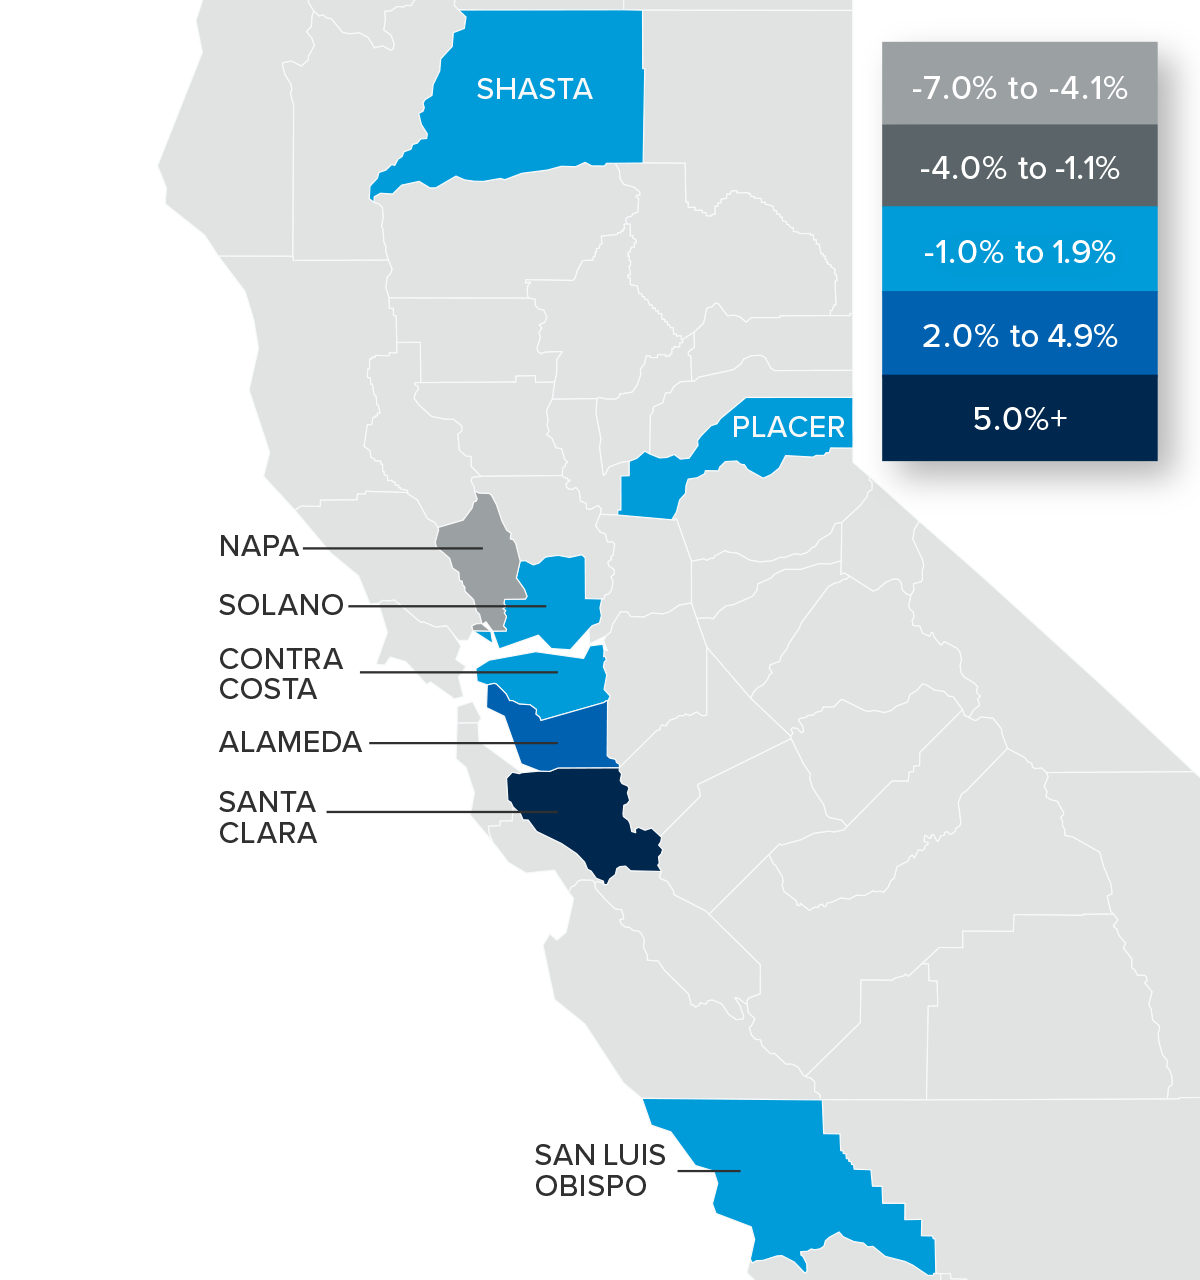
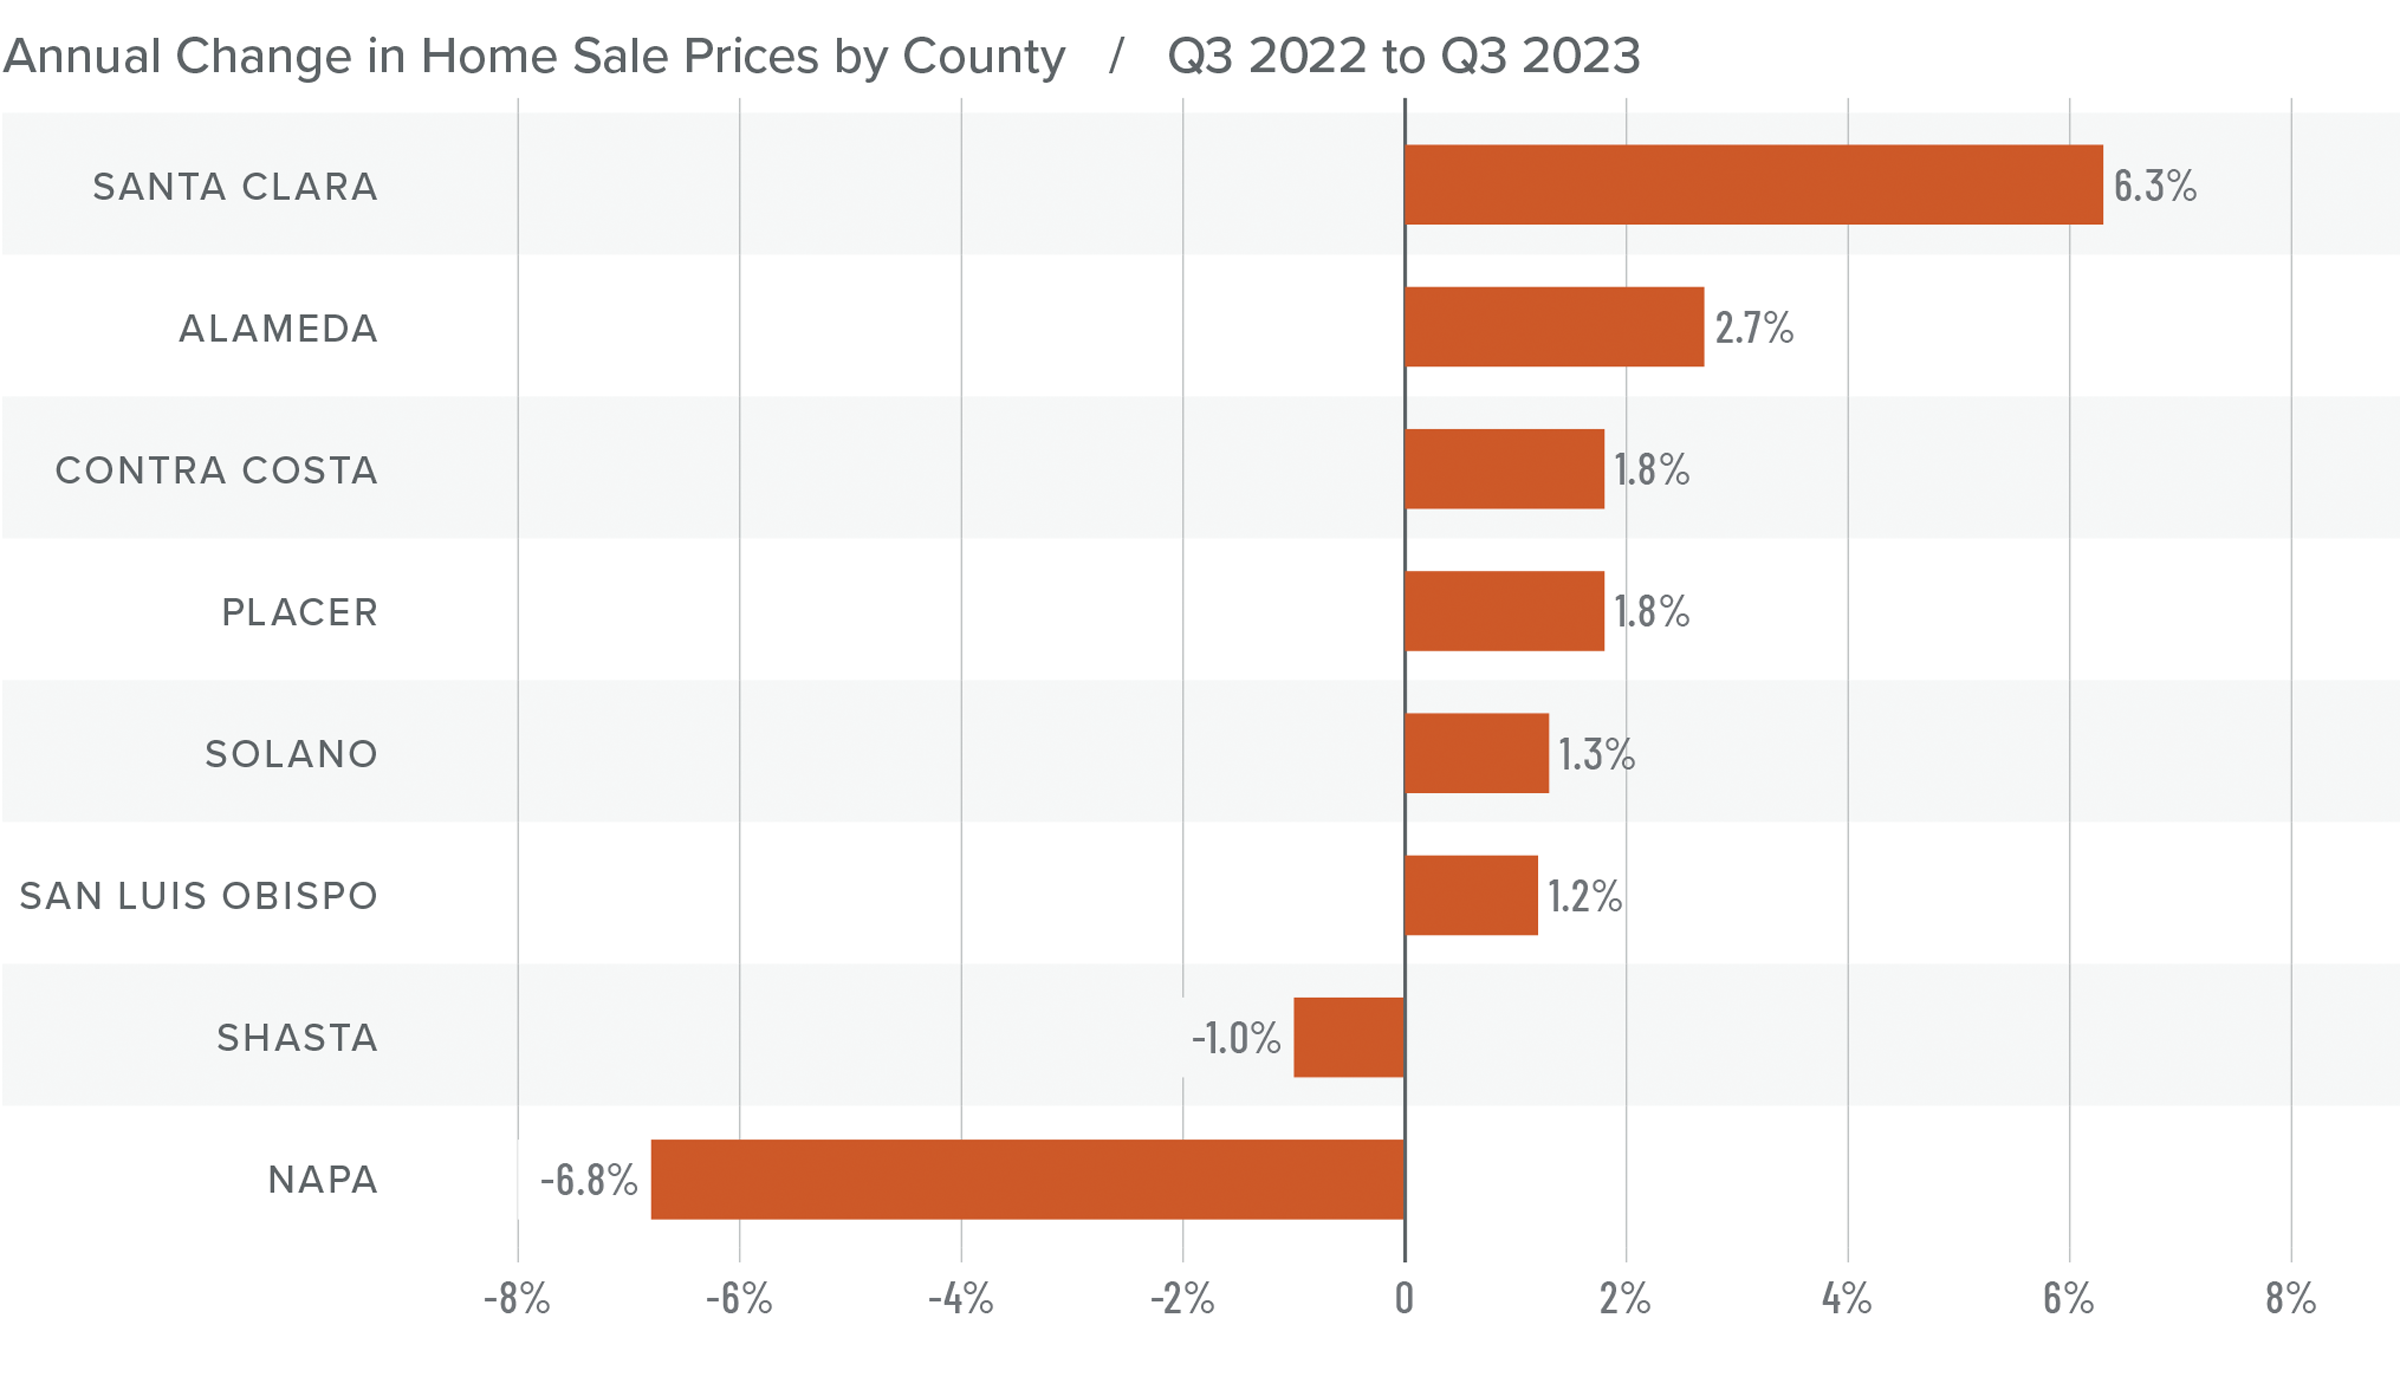
Year over year, prices rose in all counties except Napa and Shasta. Relative to the second quarter, prices were higher in all market areas other than Contra Costa and San Luis Obispo counties.

I believe that the worst of the price drops are behind us, but high mortgage rates are now having an impact.

A map showing the real estate home prices percentage changes for various counties in Northern California. Different colors correspond to different tiers of percentage change. Santa Clara came in above 5% and are represented in the corresponding navy color. Alameda came in the 2 to 4.9% range. Shasta, Placer, Solano, Contra Costa, and San Luis Obispo Counties were in the -1 to 1.9% range. Napa was in the -7 to -4.1% range and is represented in the light grey color on the map.

A bar graph showing the annual change in home sale prices by county in Northern California from Q3 2022 to Q3 2023. Shasta had the least change at -1% while Napa had the greatest decrease of 6.8% and the rest of the counties all saw increases. Santa Clara had the greatest increase of 6.3%.

Mortgage Rates

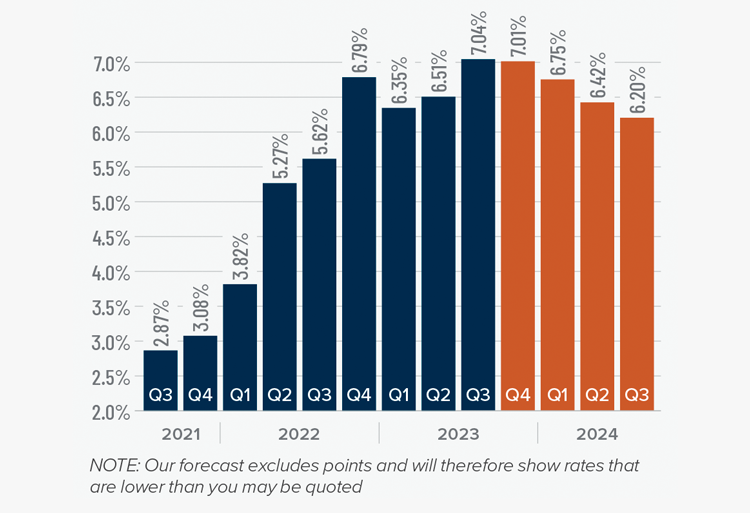
Mortgage rates continued trending higher in the third quarter of 2023 and are now at levels we have not seen since the fall of 2000. Mortgage rates are tied to the interest rate (yield) on 10-year treasuries, and they move in the opposite direction of the economy. Unfortunately for mortgage rates, the economy remains relatively buoyant, and though inflation is down significantly from its high, it is still elevated. These major factors and many minor ones are pushing Treasury yields higher, which is pushing mortgage rates up. Given the current position of the Federal Reserve, which intends to keep rates “higher for longer,” it is unlikely that home buyers will get much reprieve when it comes to borrowing costs any time soon.

With such a persistently positive economy, I have had to revise my forecast yet again. I now believe rates will hold at current levels before starting to trend down in the spring of next year.

A bar graph showing the mortgage rates from Q3 2021 to the present, as well as Matthew Gardner's forecasted mortgage rates through Q3 2024. In Q3 2023 Mortgage Rates hit 7.04% and Matthew Gardner predicts rates will decrease steadily over the next 4 quarters.

Northern California Days on Market

The average time it took to sell a home in the Northern California counties in this report fell by one day compared to the third quarter of 2022.

Year over year, the length of time it took to sell a home fell in five counties, but rose in Napa, Shasta, and San Luis Obispo counties. Compared to the second quarter of 2023, market time fell in Solano, Placer, and San Luis Obispo counties; was static in Alameda and Napa counties; and rose in Santa Clara and Shasta counties.

In the third quarter, it took an average of 36 days to sell a home, which matched the rate in the second quarter of the year.

Both year over year and quarter over quarter, homes sold the fastest in Santa Clara County and slowest in Shasta County.

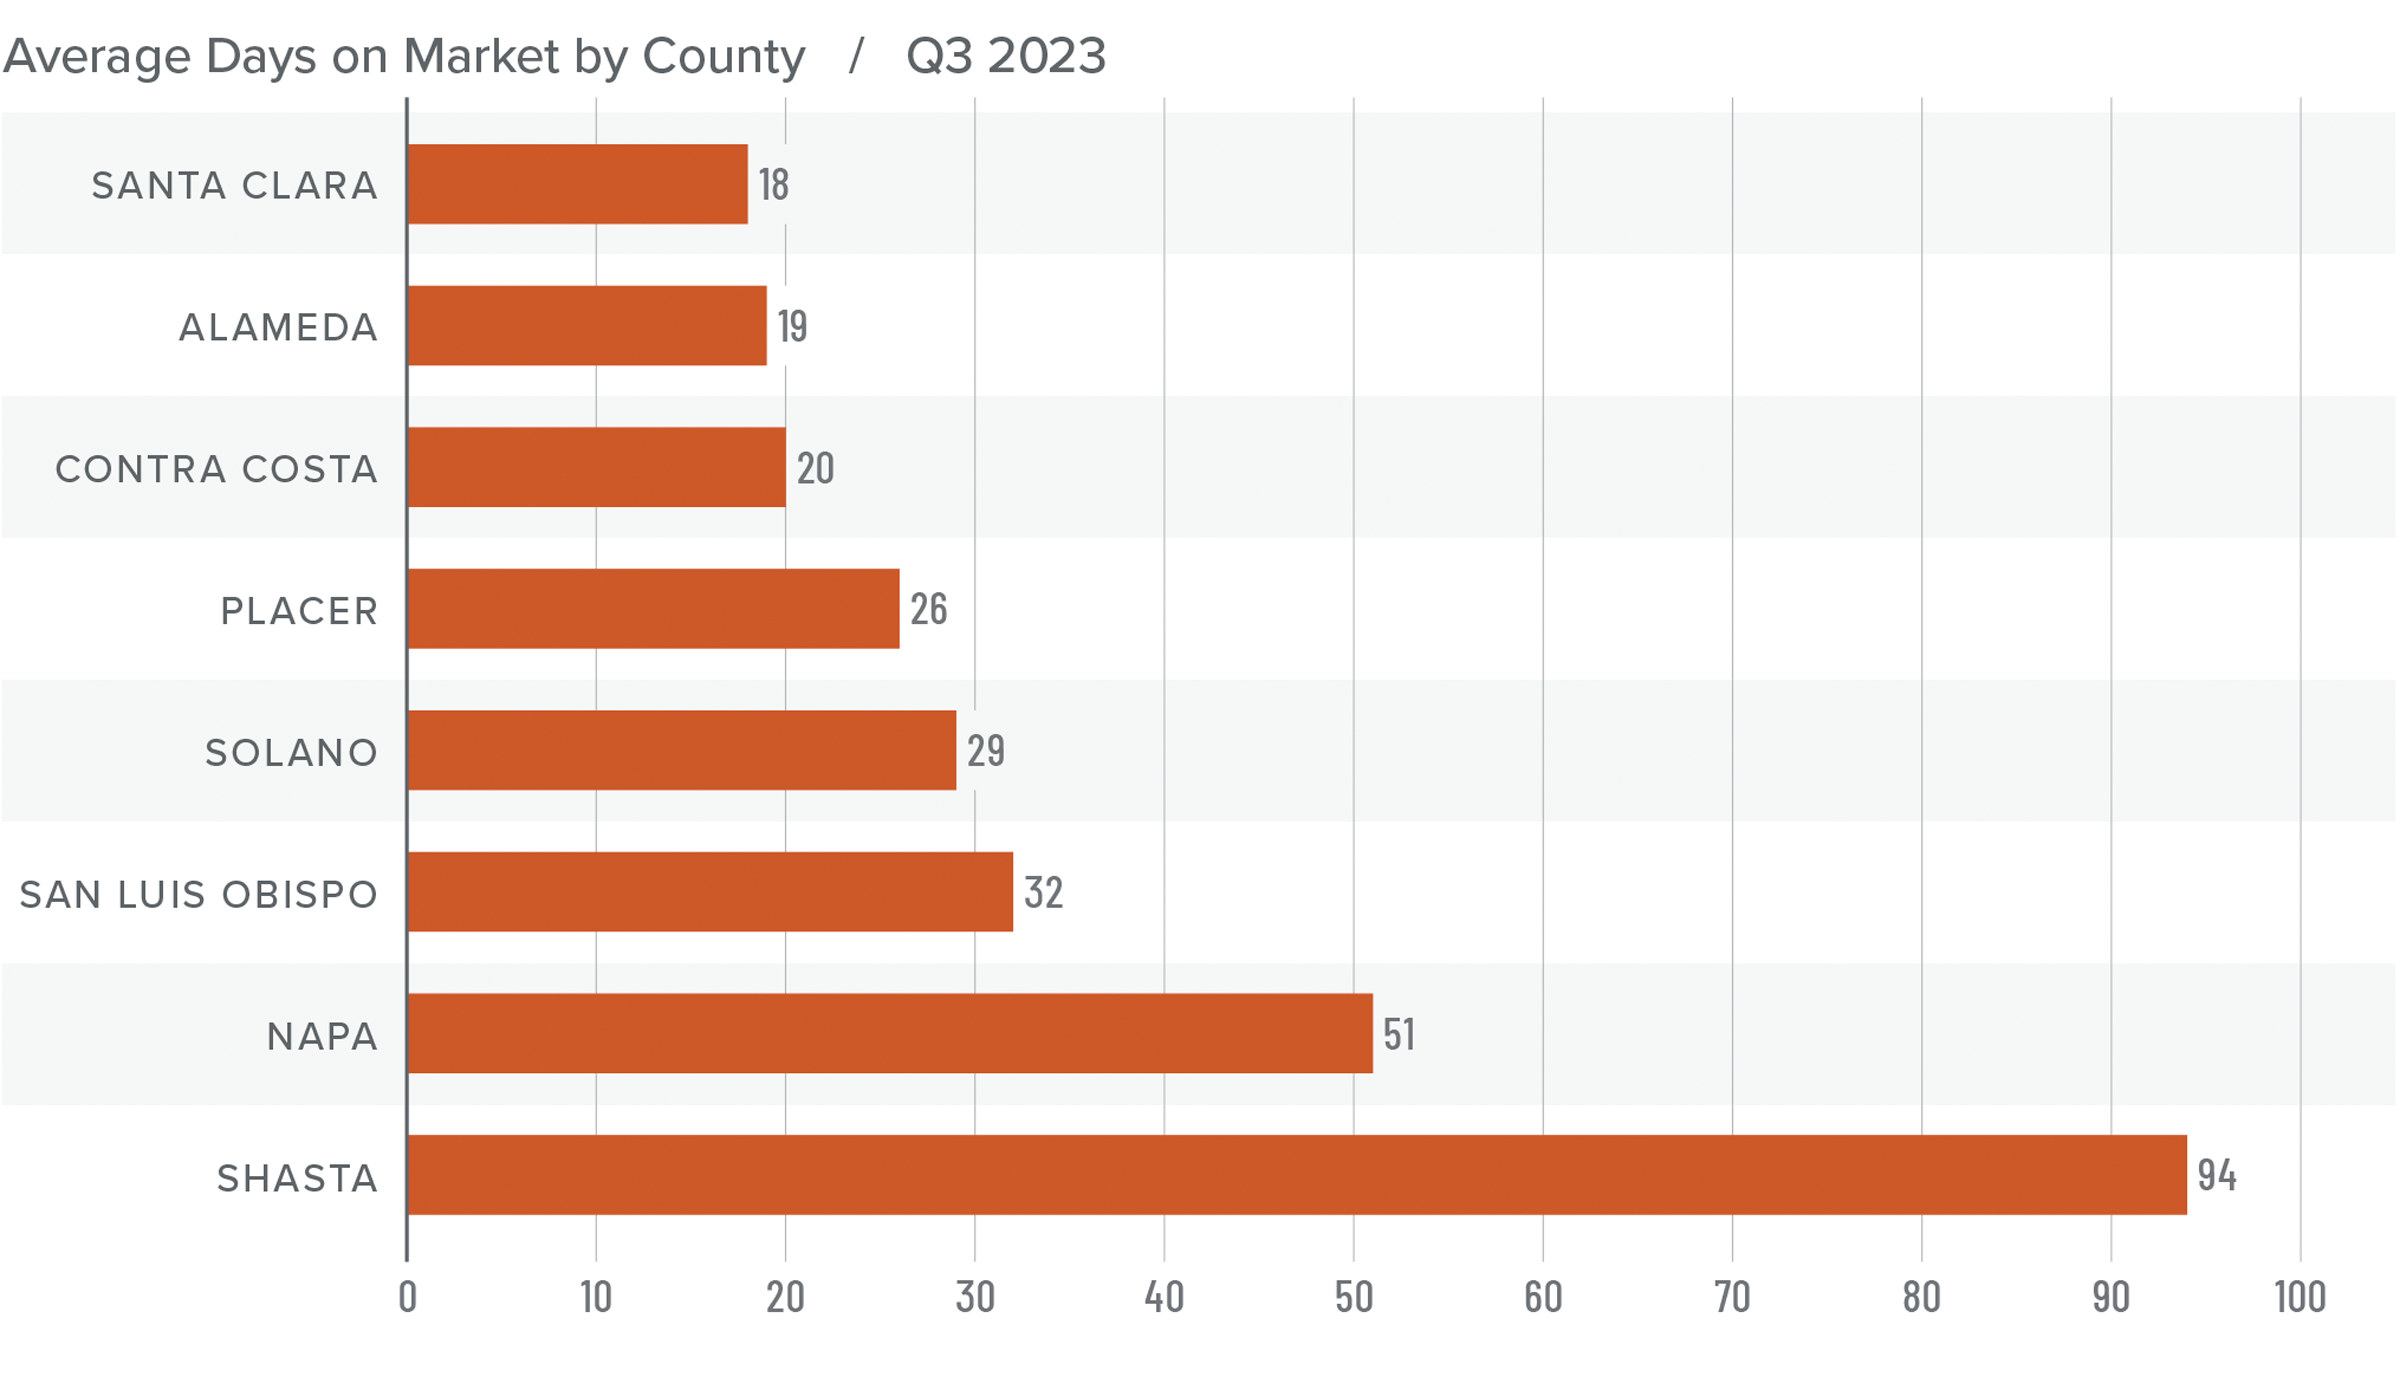
A bar graph showing the days on market by county for homes in Northern California in Q3 2023. Santa Clara is at the top with the least days on market of 18 and Shasta is at the bottom of the graph with the most days on market of 94. In the center of the graph, Placer and Solano had 26 and 29 days on the market respectively.

Conclusions

This speedometer reflects the state of the region’s real estate market using housing inventory, price gains, home sales, interest rates, and larger economic factors.

With inventory levels rising in every county other than San Luis Obispo and Shasta, home buyers are generally seeing more choice in the region. Interestingly enough, this did not impact the length of time it took for homes to sell in the third quarter.

Home price growth has halted and, given that median list prices also fell from the second quarter of this year, sale prices aren’t expected to rise as we move through the final quarter of the year. This theory is also supported by the fact that mortgage rates have yet to peak, which will certainly act as a headwind across the market.

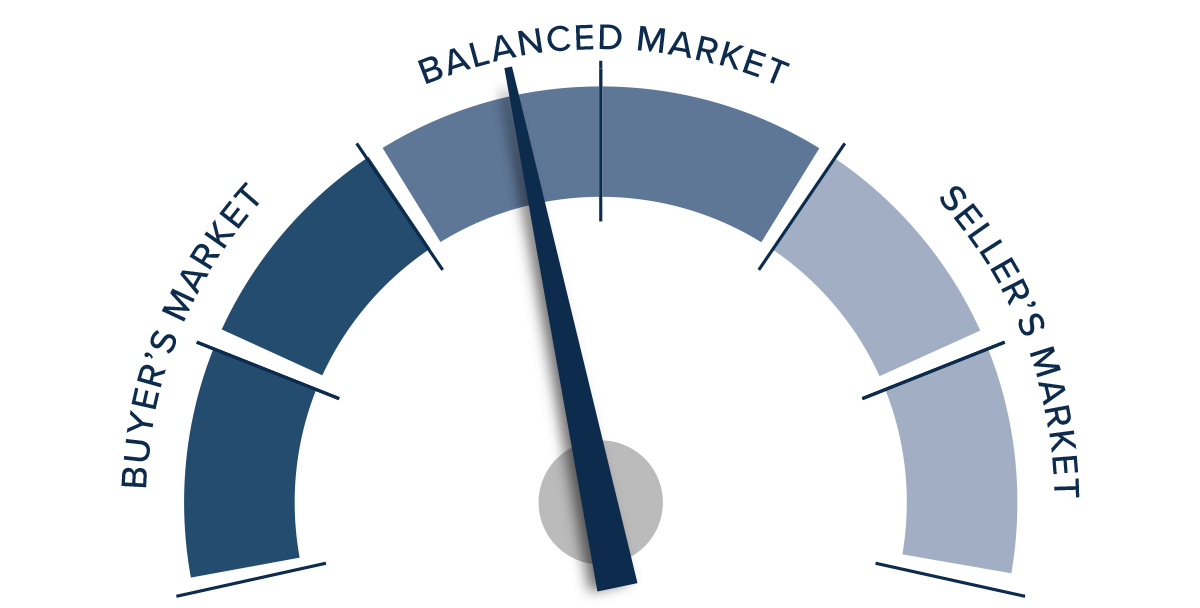
A speedometer graph indicating the market in Northern California for Q3 2023. The needle points just left of the middle of the meter in the “balanced market” portion toward the buyer’s market section.

Given all the above, the needle stays in the balanced quadrant of the speedometer, but is tilted a little toward buyers given the modest decline of list prices and the increase in the number of homes for sale.

Market News November 2, 2023

Q3 2023 Nevada Real Estate Market Update

The following analysis of select counties of the Nevada real estate market is provided by Windermere Real Estate. We hope that this information may assist you with making better-informed real estate decisions. For further information about the housing market in your area, please don’t hesitate to contact your Windermere Real Estate agent.


Regional Economic Overview

Though the pace of job growth in Clark County continues to cool, the market added 44,000 new jobs over the past 12 months, which represents a respectable growth rate of 4%.

The non-seasonally adjusted and seasonally adjusted unemployment rate in August was 6.1%. This was down .1% from August of 2022. Although the rate may be disconcerting given the national rate of 3.8%, it should be noted that the jobless rate rose more as a function of a growing labor force. The local labor force rose 2.7% while the national labor force only increased 1.9%.

My updated employment forecast for the Las Vegas metro area shows employment growth continuing to taper. Growth in 2023 will be up 3.4%, and my preliminary 2024 forecast suggests that job growth will slow to around 1.8%.

Nevada Home Sales

A total of 6,011 homes sold in the third quarter, which was a drop of 6% compared to the same period in 2022. Sales were down 10.8% from the second quarter of 2023.

Compared to the third quarter of 2022, sales fell in a majority of the markets covered by this report. Compared to the second quarter of this year, sales fell in all markets other than the Spring Valley and Aliante neighborhoods, where sales rose 3.6% and 20%, respectively.

Listing activity was flat versus the second quarter of the year, but the number of homes for sale was down more than 54% year over year.

Pending sales, which are an indicator of future closings, fell 13.1% compared to the second quarter, suggesting that sales activity may not grow in the upcoming quarter.

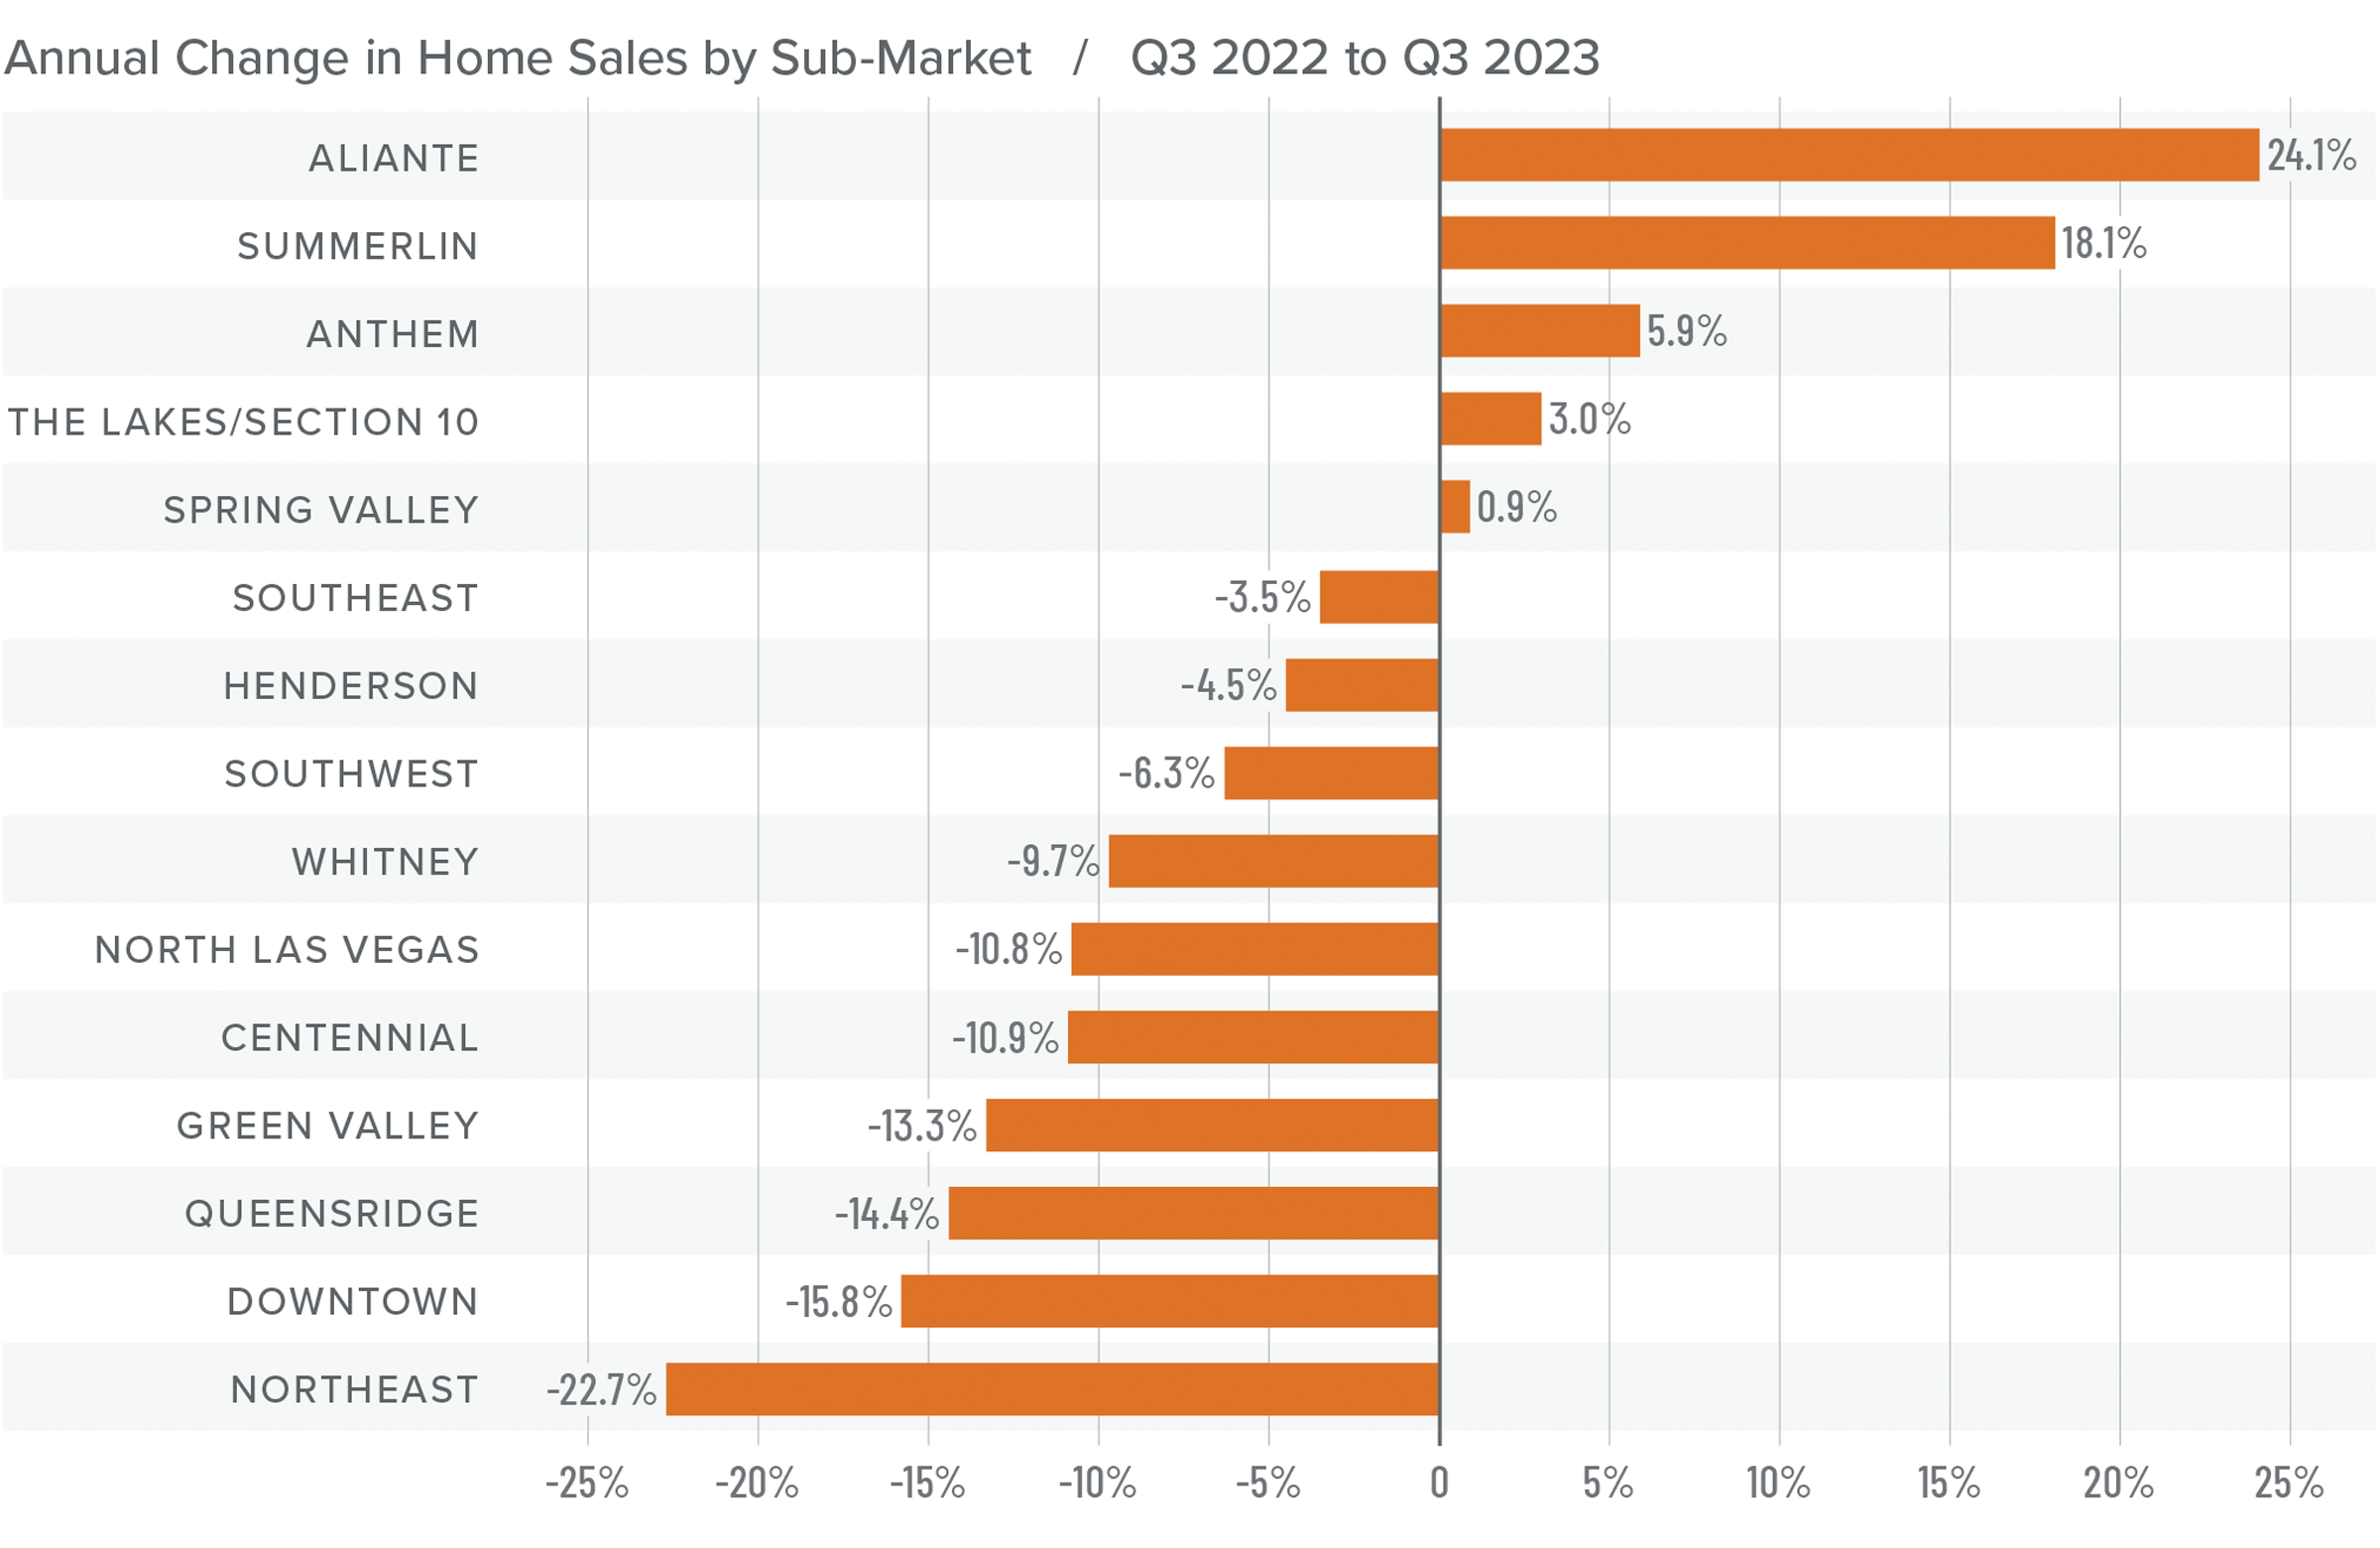
A bar graph showing the annual change in home sales by sub-market in Nevada from Q3 2022 to Q3 2023. Spring Valley had the least change with 0.9% increase and is represented with the bar 5th from the top. Aliante had the greatest increase of 24.1% and Northeast had the greatest decrease of 22.7 percent.

Nevada Home Prices

Home prices fell .3% year over year but were .6% higher than in the second quarter of 2023. The average home sale price in the area was $478,355.

Compared to the second quarter, more than half of the neighborhoods saw a drop in median list prices, which are a leading indicator of the housing market. However, increases in the remaining neighborhoods made aggregate list prices essentially flat.

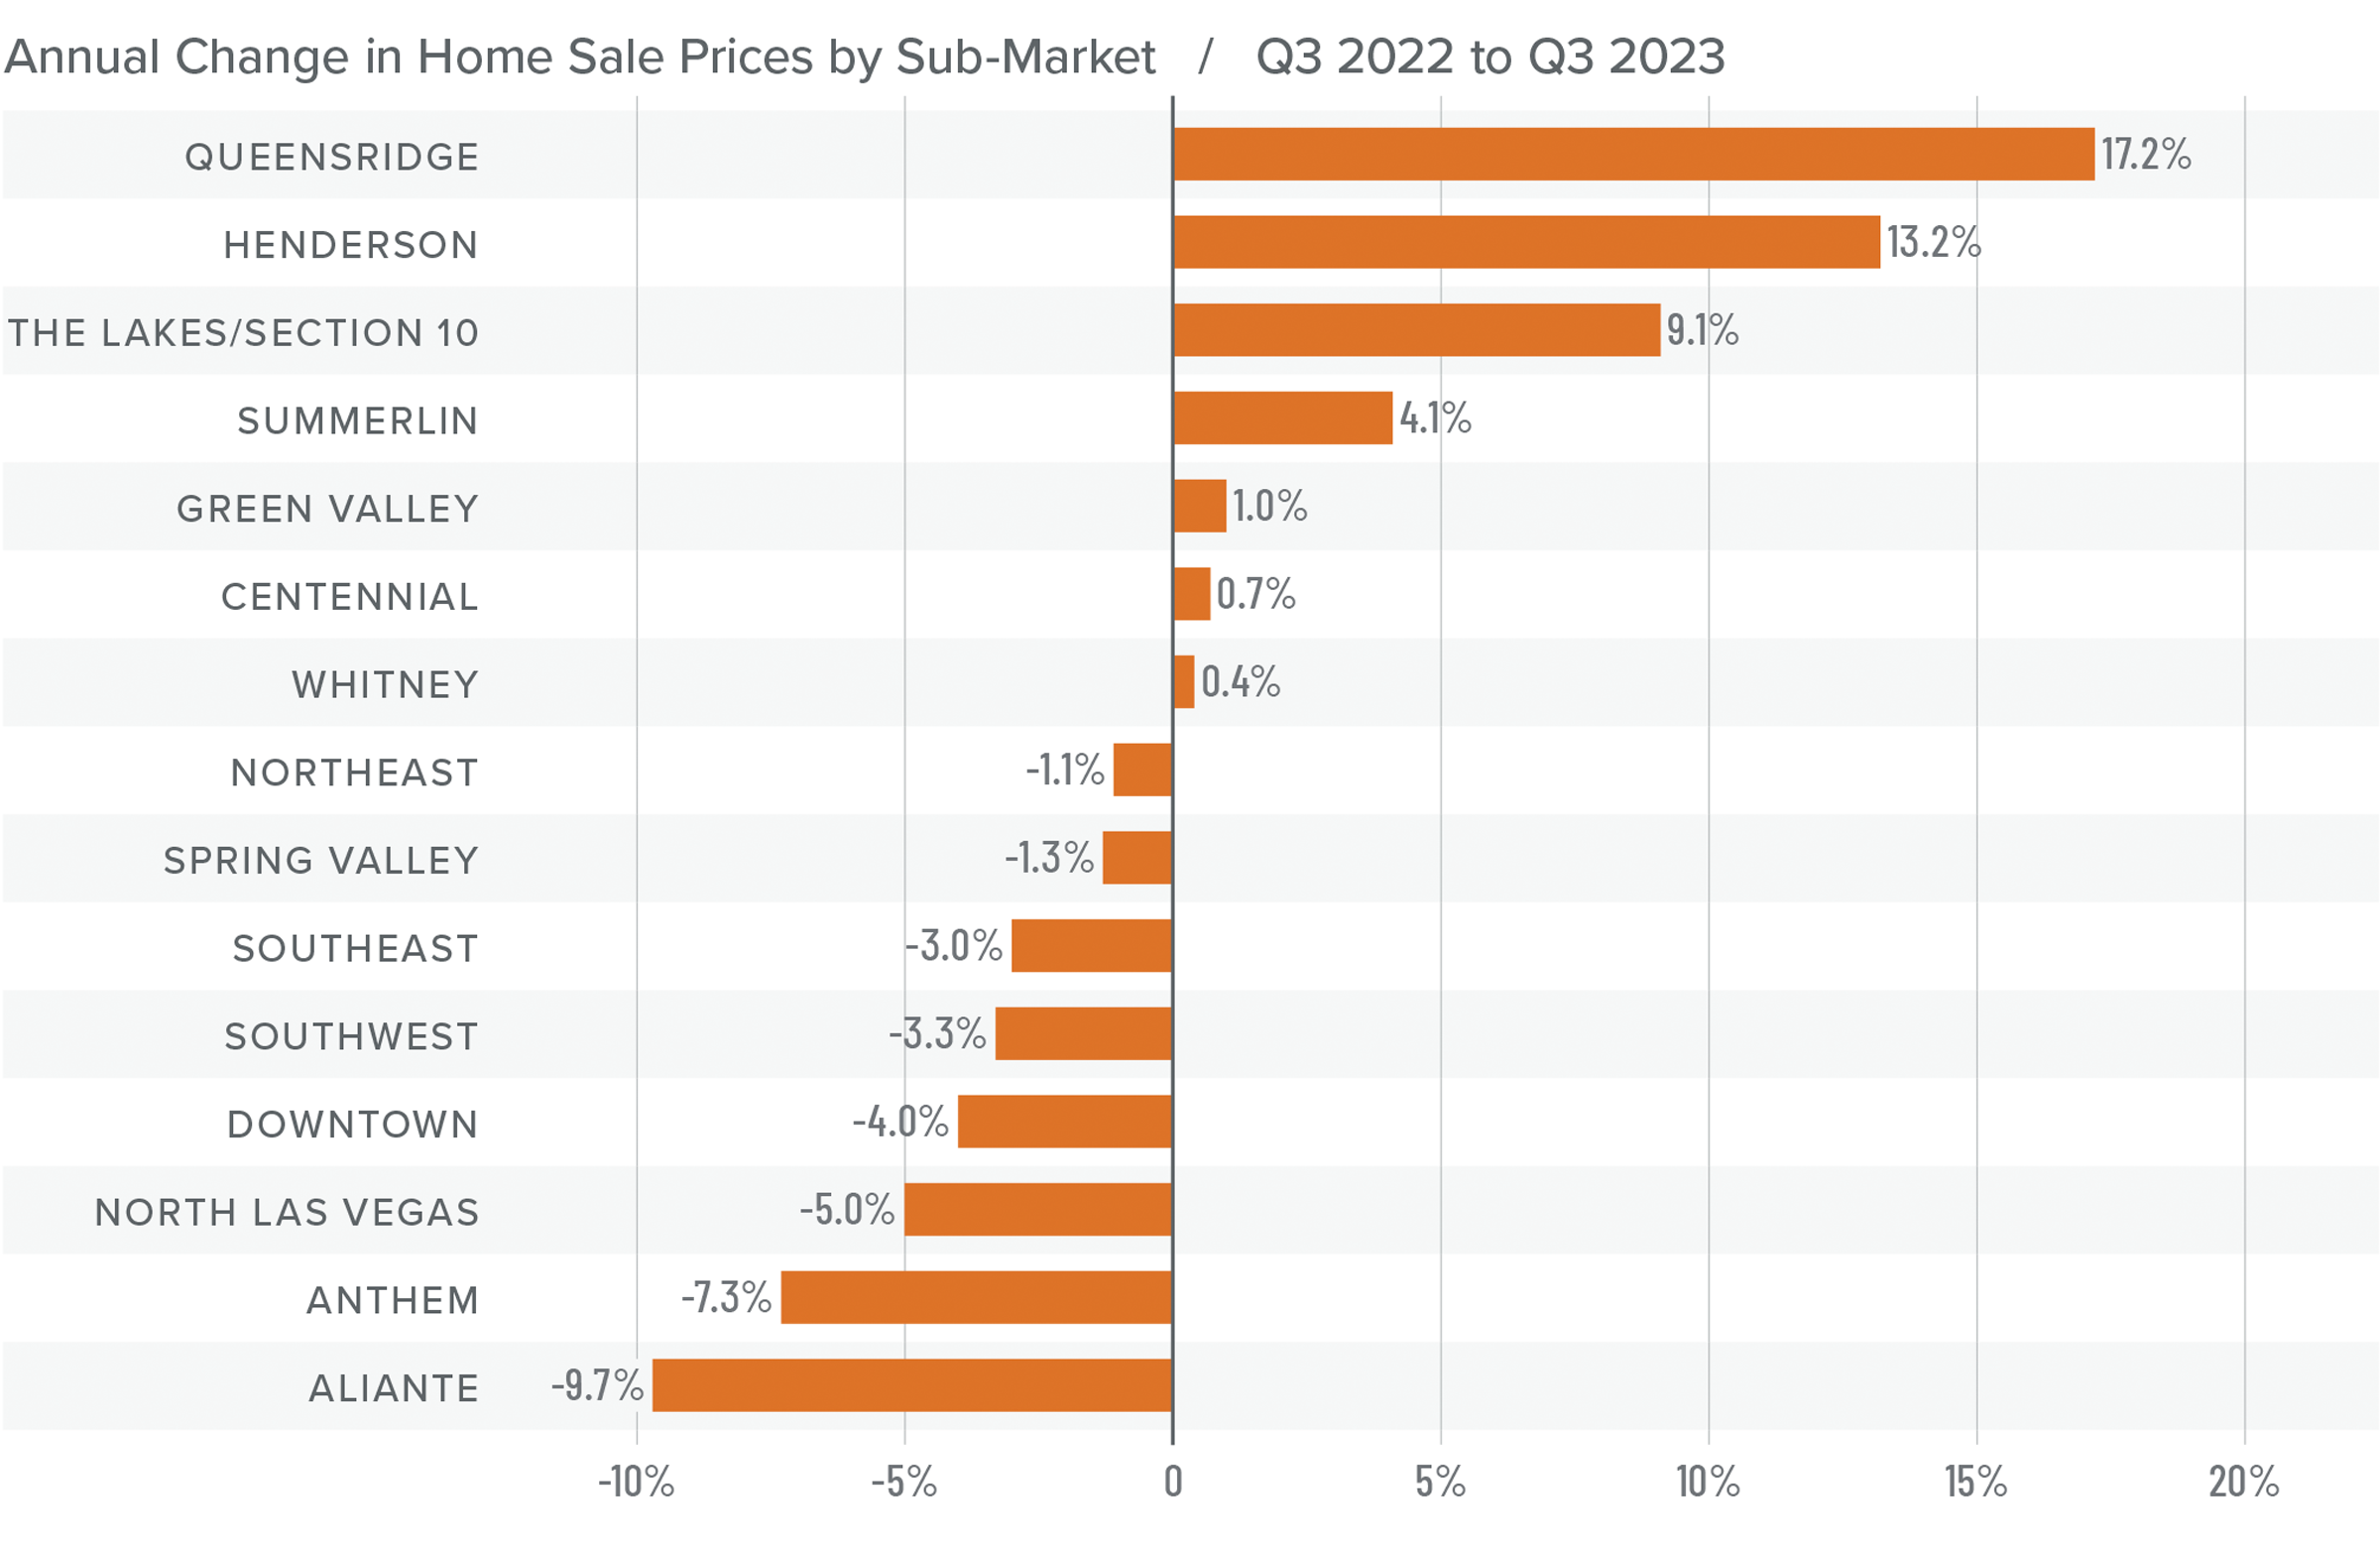
Year over year, prices fell in eight areas but rose in seven, with significant increases in the Queensridge and Henderson neighborhoods. Compared to the second quarter of this year, prices were up in every market other than Downtown, Aliante, Southeast Las Vegas, and Spring Valley.

Lower list prices and flat price growth may suggest that the market is starting to react to higher mortgage rates. I don’t expect sale prices to move much for the balance of this year, but limited inventory should continue to support current values.

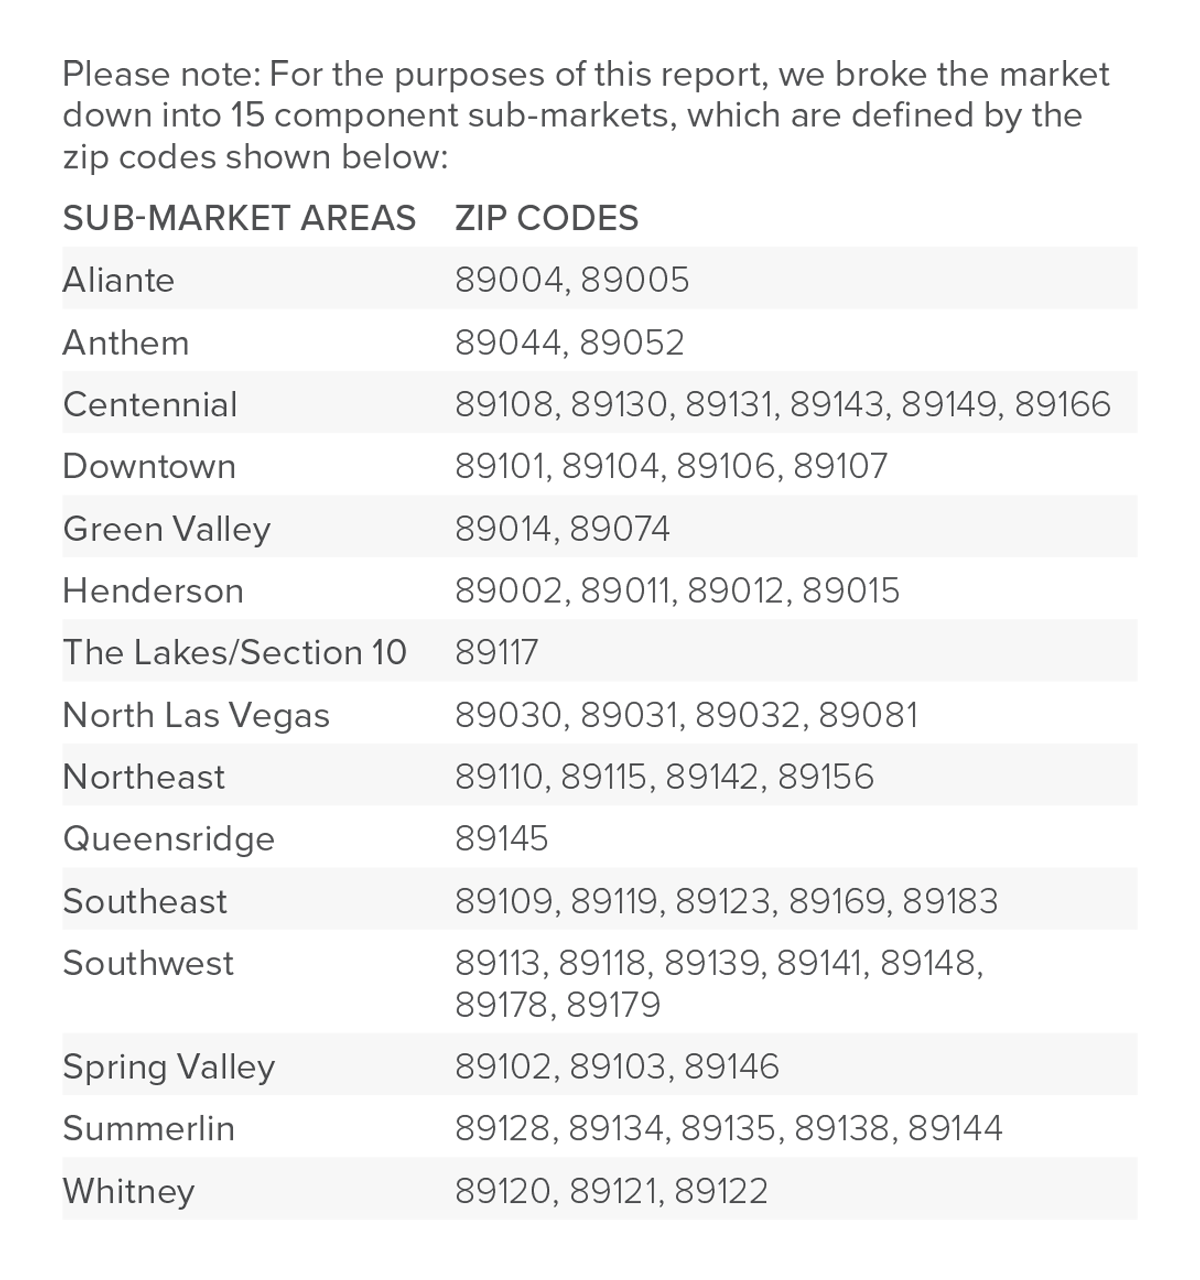
A chart showing the sub-market areas and their corresponding zip codes in the Greater Las Vegas, Nevada area.

A bar graph showing the annual change in home sale prices by sub-market in Nevada from Q3 2022 to Q3 2023. Whitney had the least change at 0.4% while Aliante had the greatest decrease of 9.7% and Queensridge had the greatest increase of 17.2%.

Mortgage Rates

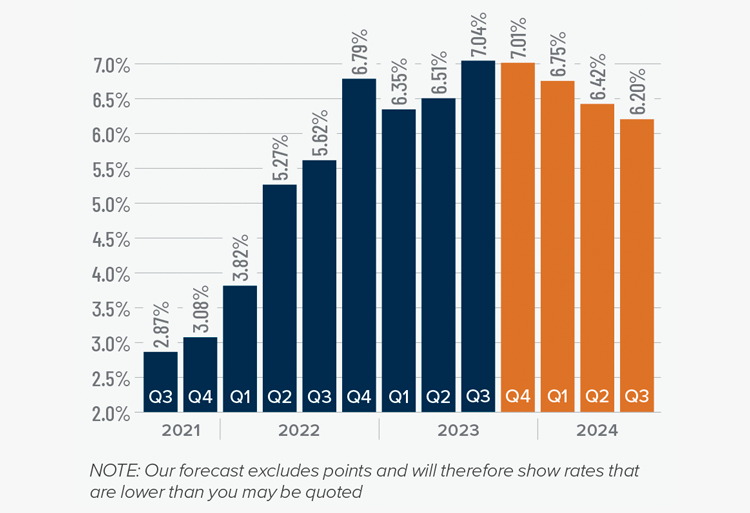
Mortgage rates continued trending higher in the third quarter of 2023 and are now at levels we have not seen since the fall of 2000. Mortgage rates are tied to the interest rate (yield) on 10-year treasuries, and they move in the opposite direction of the economy. Unfortunately for mortgage rates, the economy remains relatively buoyant, and though inflation is down significantly from its high, it is still elevated. These major factors and many minor ones are pushing Treasury yields higher, which is pushing mortgage rates up. Given the current position of the Federal Reserve, which intends to keep rates “higher for longer,” it is unlikely that home buyers will get much reprieve when it comes to borrowing costs any time soon.

With such a persistently positive economy, I have had to revise my forecast yet again. I now believe rates will hold at current levels before starting to trend down in the spring of next year.

A bar graph showing the mortgage rates from Q3 2021 to the present, as well as Matthew Gardner's forecasted mortgage rates through Q3 2024. In Q3 2023 Mortgage Rates hit 7.04% and Matthew Gardner predicts rates will decrease steadily over the next 4 quarters.

Nevada Days on Market

The average time it took to sell a home in the region rose four days from the third quarter of 2022.

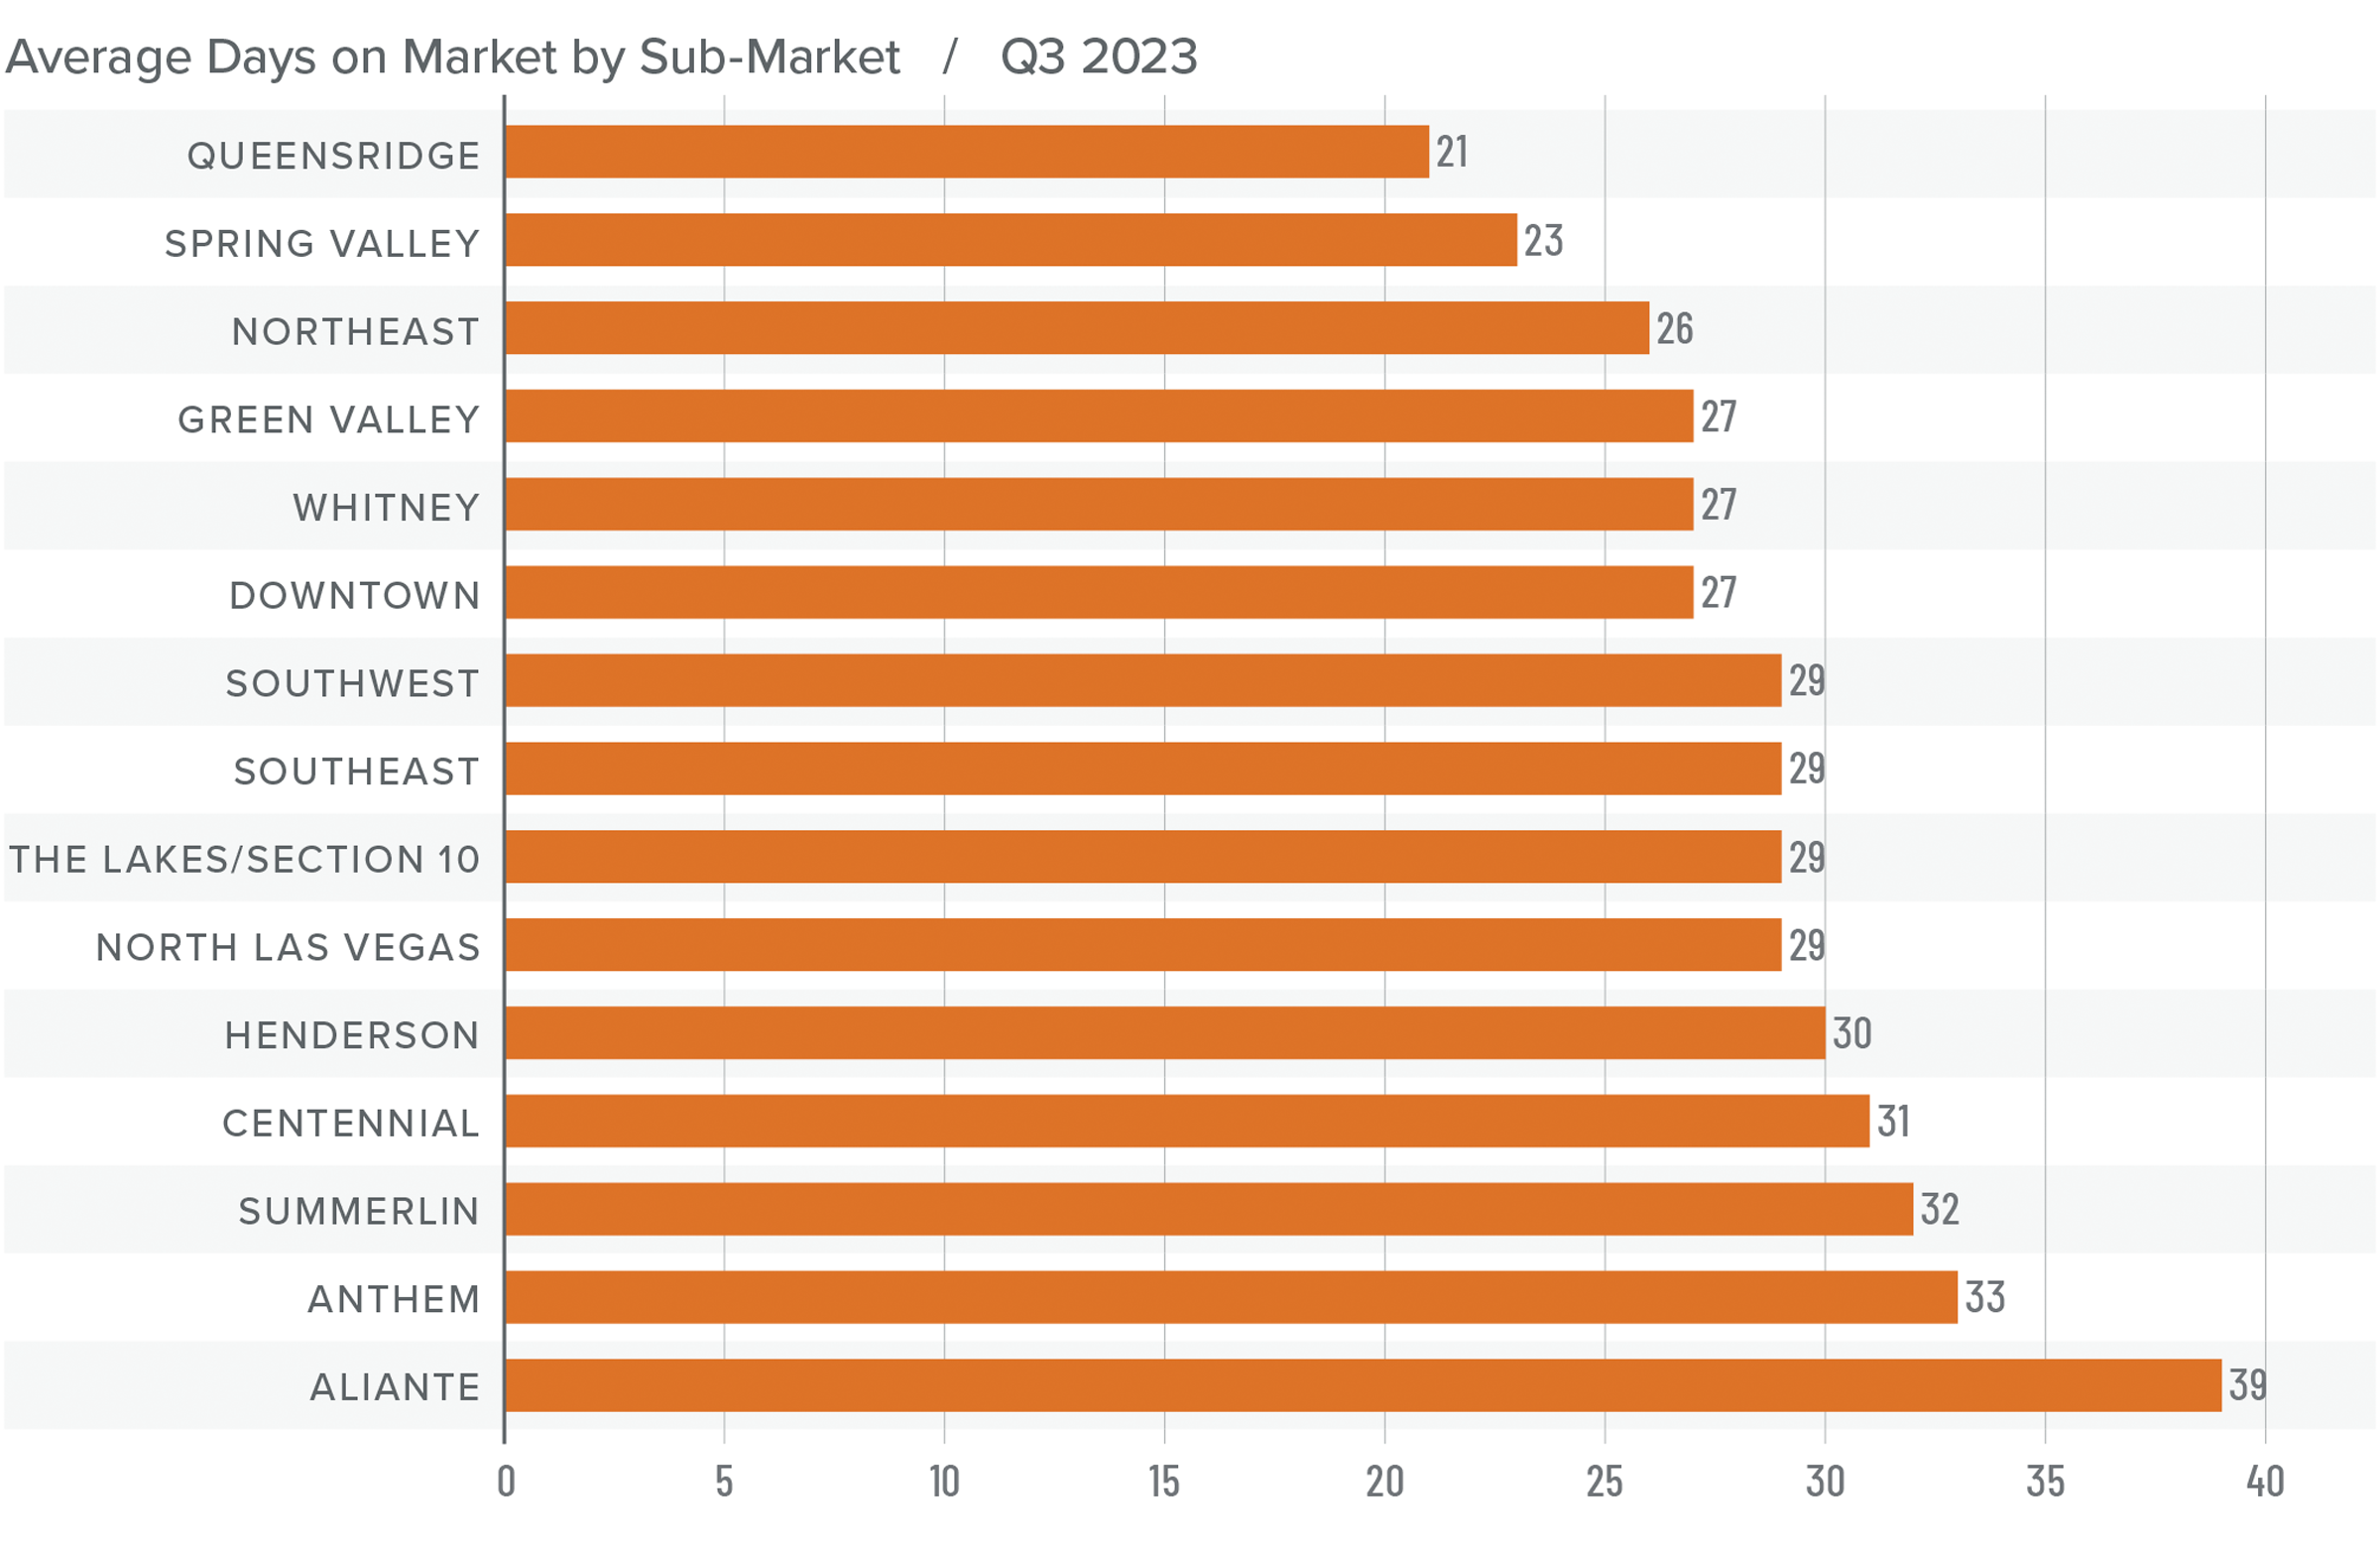
It took an average of 29 days to sell a home in the third quarter, which was 13 fewer days than it took in the second quarter of 2023.

Days on market rose in all neighborhoods except Queensridge and Spring Valley compared to the same period in 2022. However, average market time fell in every neighborhood compared to the second quarter of this year.

Low inventory levels combined with buyers who were likely rushing to lock in mortgage rates that were still in the 6% range at the start of the quarter clearly created competitive market conditions.

A bar graph showing the days on market by sub-market for homes in Nevada in Q3 2023. Queensridge is at the top with the least days on market of 21 and Aliante is at the bottom of the graph with the most days on market of 39. In the center of the graph, Southwest, Southeast, The Lakes/Section 10, and North Las Vegas all had 29 days on market.

Conclusions

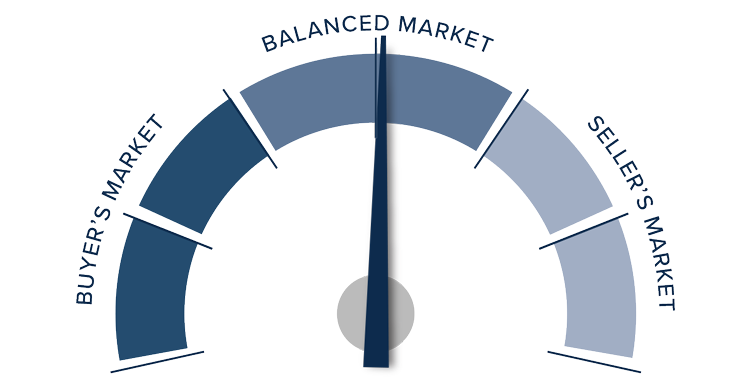
This speedometer reflects the state of the region’s real estate market using housing inventory, price gains, home sales, interest rates, and larger economic factors.

With pending and closed sales lower than earlier in the year and list prices not rising, one might infer that the market is starting to shift in favor of home buyers, but it’s uncertain this is the case.

In the second quarter market update it was suggested that the market was essentially in balance, albeit very slightly tilted toward sellers. Today, there is still a balance between buyers and sellers: limited inventory favors sellers, but lack of price growth favors home buyers (even if they are faced with significantly higher mortgage rates).

A speedometer graph indicating the market in Nevada for Q3 2023. The needle points just right of the middle of the meter in the “balanced market” portion toward the seller’s market section.

As such, the needle stays in the balanced quadrant, but it’s moved from very modestly favoring sellers to a more neutral position.

Market News November 2, 2023

Q3 2023 Utah Real Estate Market Update

The following analysis of select counties of the Utah real estate market is provided by Windermere Real Estate. We hope that this information may assist you with making better-informed real estate decisions. For further information about the housing market in your area, please don’t hesitate to contact your Windermere Real Estate agent.


Regional Economic Overview

After picking up in the second quarter of this year, year-over-year employment growth has pulled back again. Utah added 39,000 jobs over the past 12 months, which represents an annual growth rate of 2.3%. This is the lowest pace of job gains since the pandemic started. Job growth was led by the Salt Lake City metro area, where employment rose 2.7%. This was followed by the Ogden and Provo metro areas, where employment rose 2.4% and 1.7%, respectively.

Utah’s unemployment rate in August was 2.5%, which is up .1% year over year. At the county level, the lowest jobless rate was in Morgan County (2.5%) and the highest was in Weber County, where 3.1% of the workforce were without jobs. In aggregate, the unemployment rate within the counties contained in this report was 3%.

Utah Home Sales

In the third quarter of 2023, 6,675 homes sold in the areas covered by this report. This was down 9.5% compared to the third quarter of 2022 and was 5.7% lower than in the second quarter of this year.

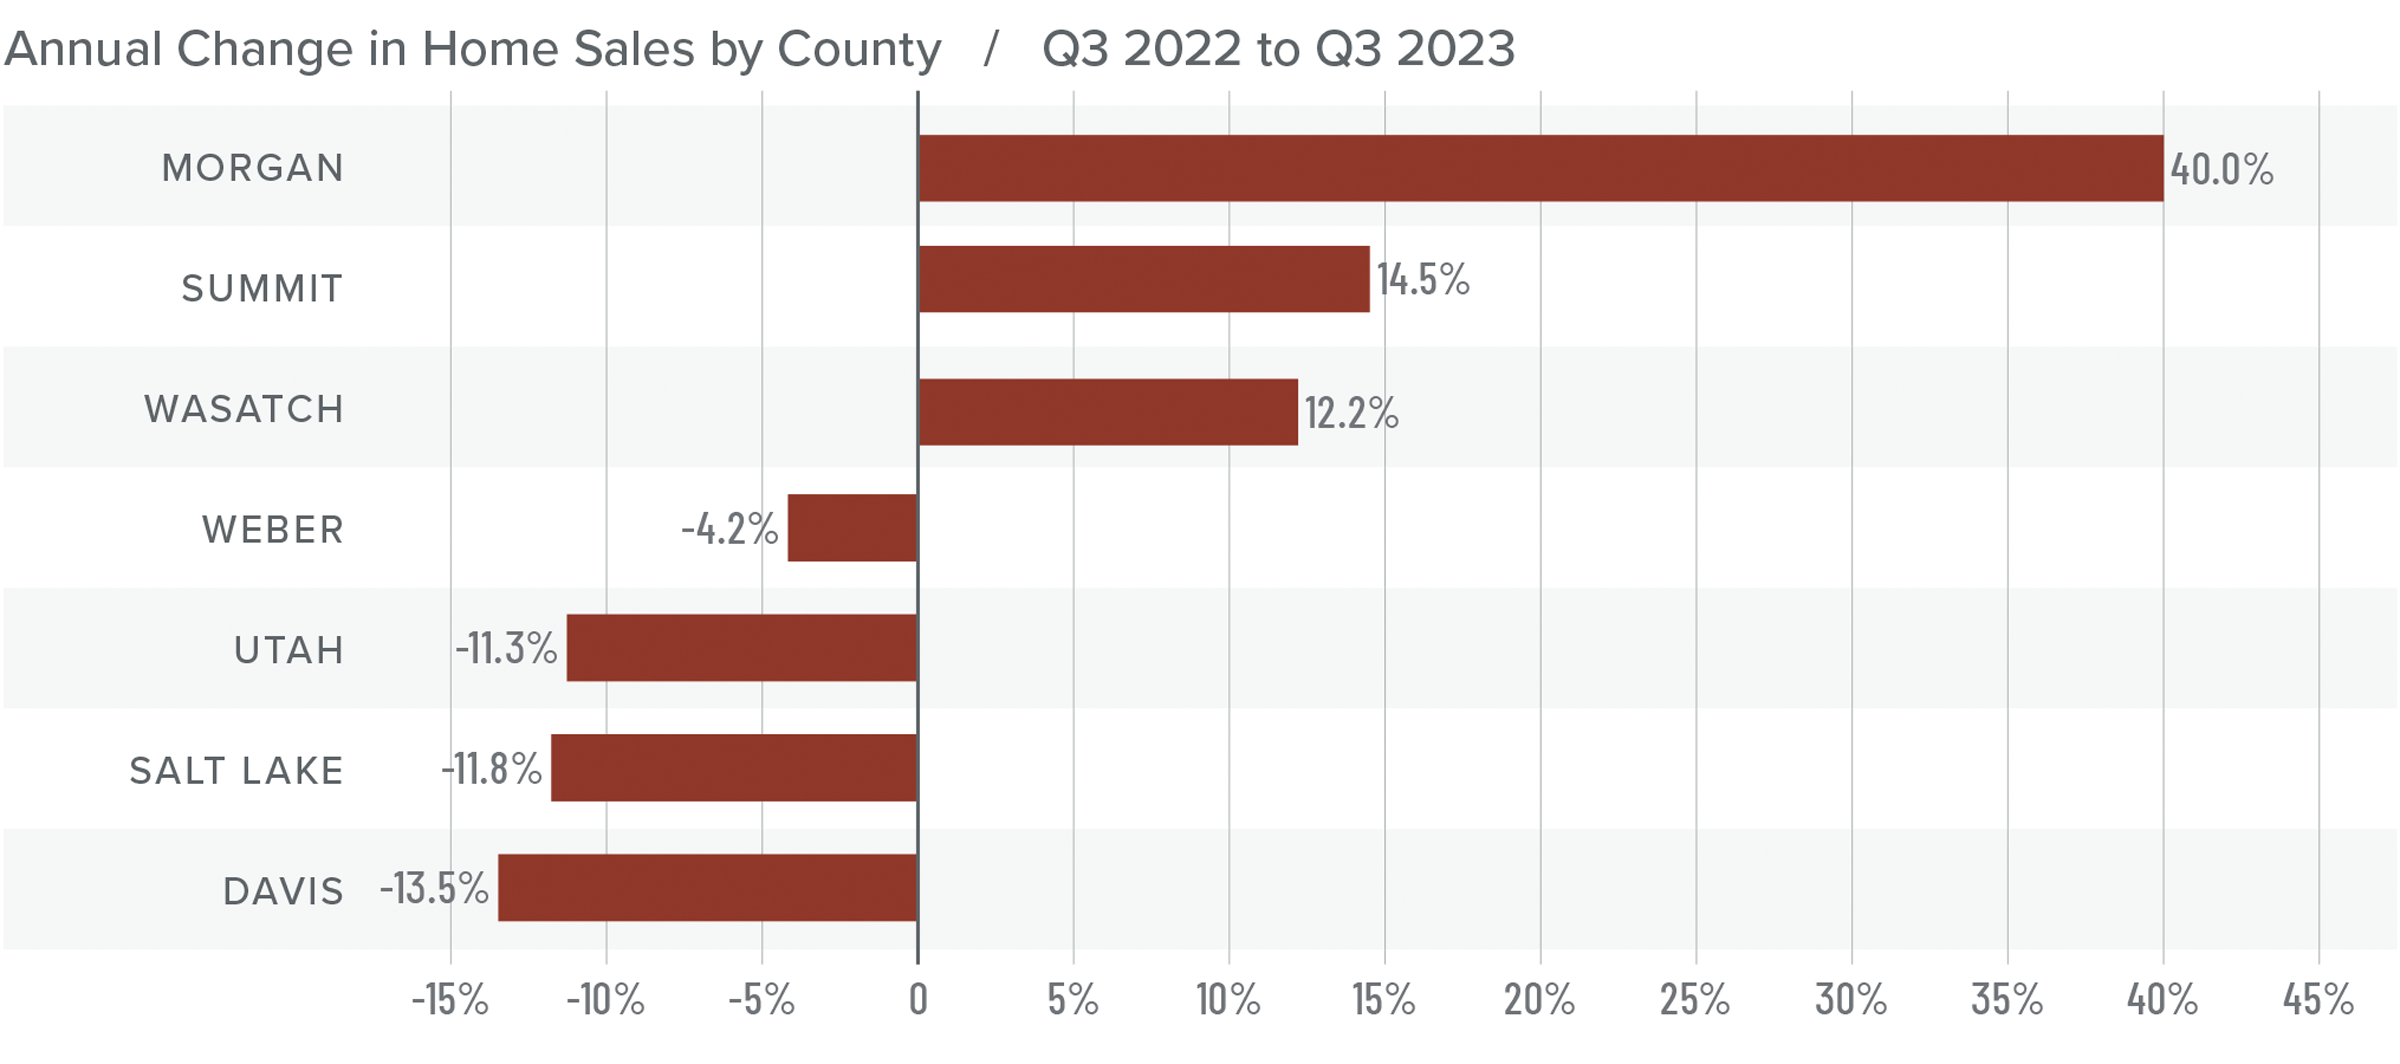
Although total sales volumes have fallen, they rose in Wasatch, Summit, and Morgan counties compared the third quarter of 2022. These same three counties also saw sales grow between the second and third quarters of this year.

As sales volumes fell, listing activity rose 28.7% compared to the second quarter of 2023. Clearly, more choice in the market was not enough to tempt buyers who were also faced with significantly higher financing costs.

Pending sales fell 8.9% from the second quarter, suggesting that closings in the fourth quarter may also be lackluster.

A bar graph showing the annual change in home sales by county in Utah from Q3 2022 to Q3 2023. Weber County had the least change with -4.2% and is represented with the bar in the center of the graph. Morgan County had the greatest increase of 40% and Davis County had the greatest decrease of 13.5 percent.

Utah Home Prices

The average sale price grew 4% from the same time in 2022 to $651,913. Prices were also 3.8% higher than in the second quarter of 2023.

Regionally, median list prices in the third quarter were flat compared to the second quarter of the year. However, asking prices were higher in Wasatch, Summit, and Morgan counties.

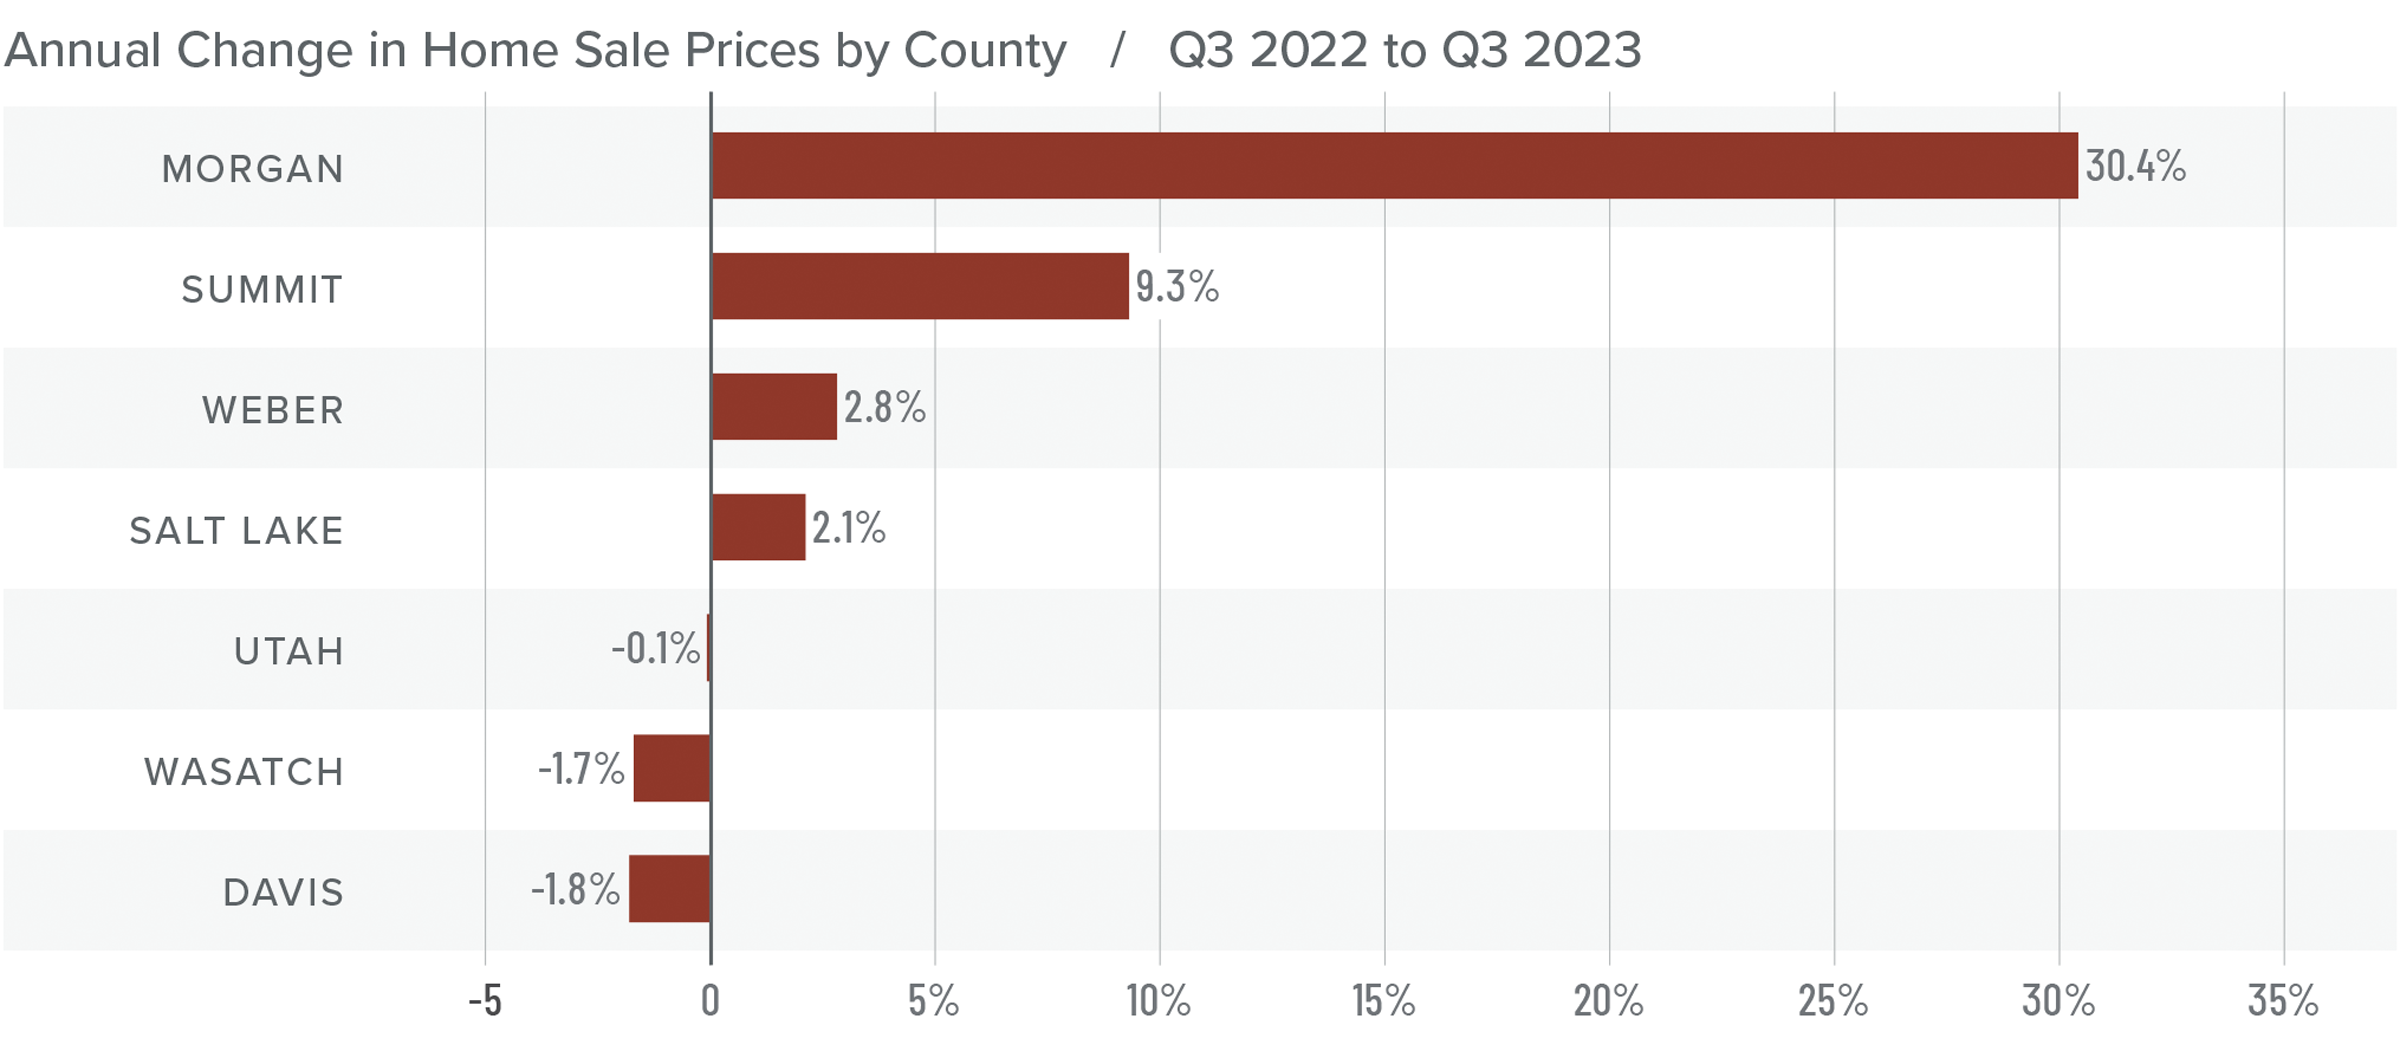
Year over year, prices rose in four counties but fell in three. With just 28 sales in the quarter, Morgan County had a significant price increase, but it’s such a small market that sizeable price swings are not unusual. Compared to the second quarter of 2023, prices rose in all counties except Davis and Summit, where prices fell 1.7% and 13.8%, respectively.

Price growth has been slowing, which is to be expected given the significant rise in mortgage rates. I don’t expect to see much in the way of price growth for the balance of the year due to both higher financing costs and more choice in the market.

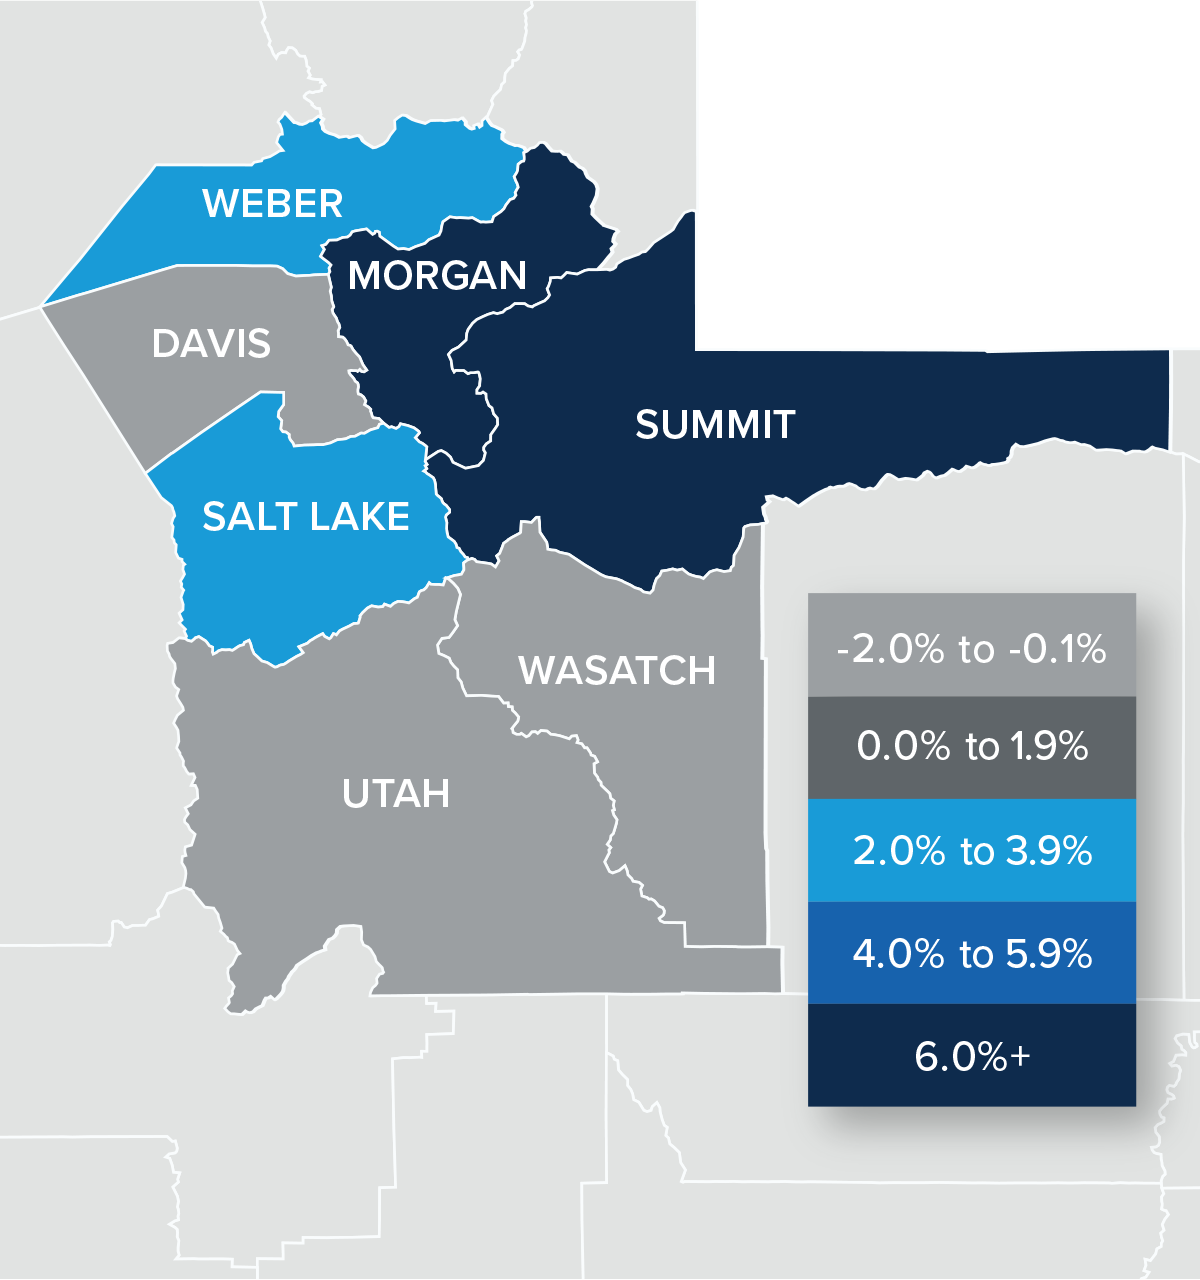
A map showing the real estate home prices percentage changes for various counties in Utah. Different colors correspond to different tiers of percentage change. Morgan and Summit Counties came in above 6% and are represented in the corresponding navy color. Weber and Salt Lake came in the 2 and 3.9% range. Davis, Wasatch, and Utah Counties were in the -0.1% to -2% range and are represented in the light grey color on the map.

A bar graph showing the annual change in home sale prices by county in Utah from Q3 2022 to Q3 2023. Utah County had the least change at -0.1% while Davis had the greatest decrease of 1.8% and Morgan had the greatest increase of 30.4%.

Mortgage Rates

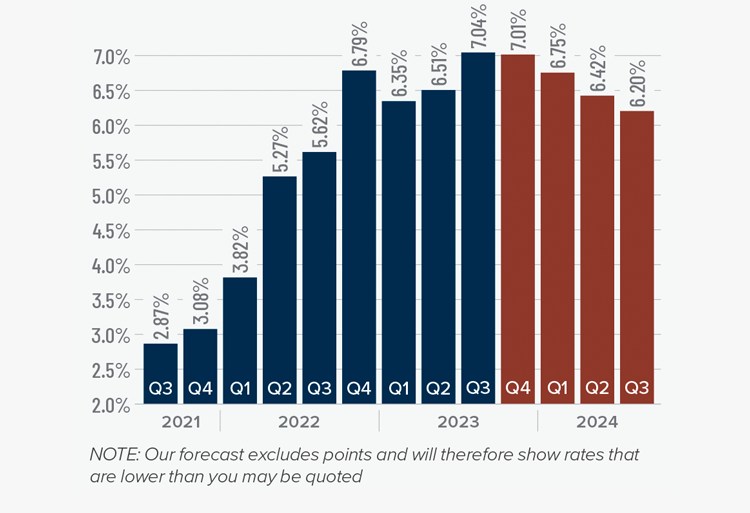
Mortgage rates continued trending higher in the third quarter of 2023 and are now at levels we have not seen since the fall of 2000. Mortgage rates are tied to the interest rate (yield) on 10-year treasuries, and they move in the opposite direction of the economy. Unfortunately for mortgage rates, the economy remains relatively buoyant, and though inflation is down significantly from its high, it is still elevated. These major factors and many minor ones are pushing Treasury yields higher, which is pushing mortgage rates up. Given the current position of the Federal Reserve, which intends to keep rates “higher for longer,” it is unlikely that home buyers will get much reprieve when it comes to borrowing costs any time soon.

With such a persistently positive economy, I have had to revise my forecast yet again. I now believe rates will hold at current levels before starting to trend down in the spring of next year.

A bar graph showing the mortgage rates from Q3 2021 to the present, as well as Matthew Gardner's forecasted mortgage rates through Q3 2024. In Q3 2023 Mortgage Rates hit 7.04% and Matthew Gardner predicts rates will decrease steadily over the next 4 quarters.

Utah Days on Market

The average time it took to sell a home in the counties covered by this report rose 17 days compared to the same period in 2022.

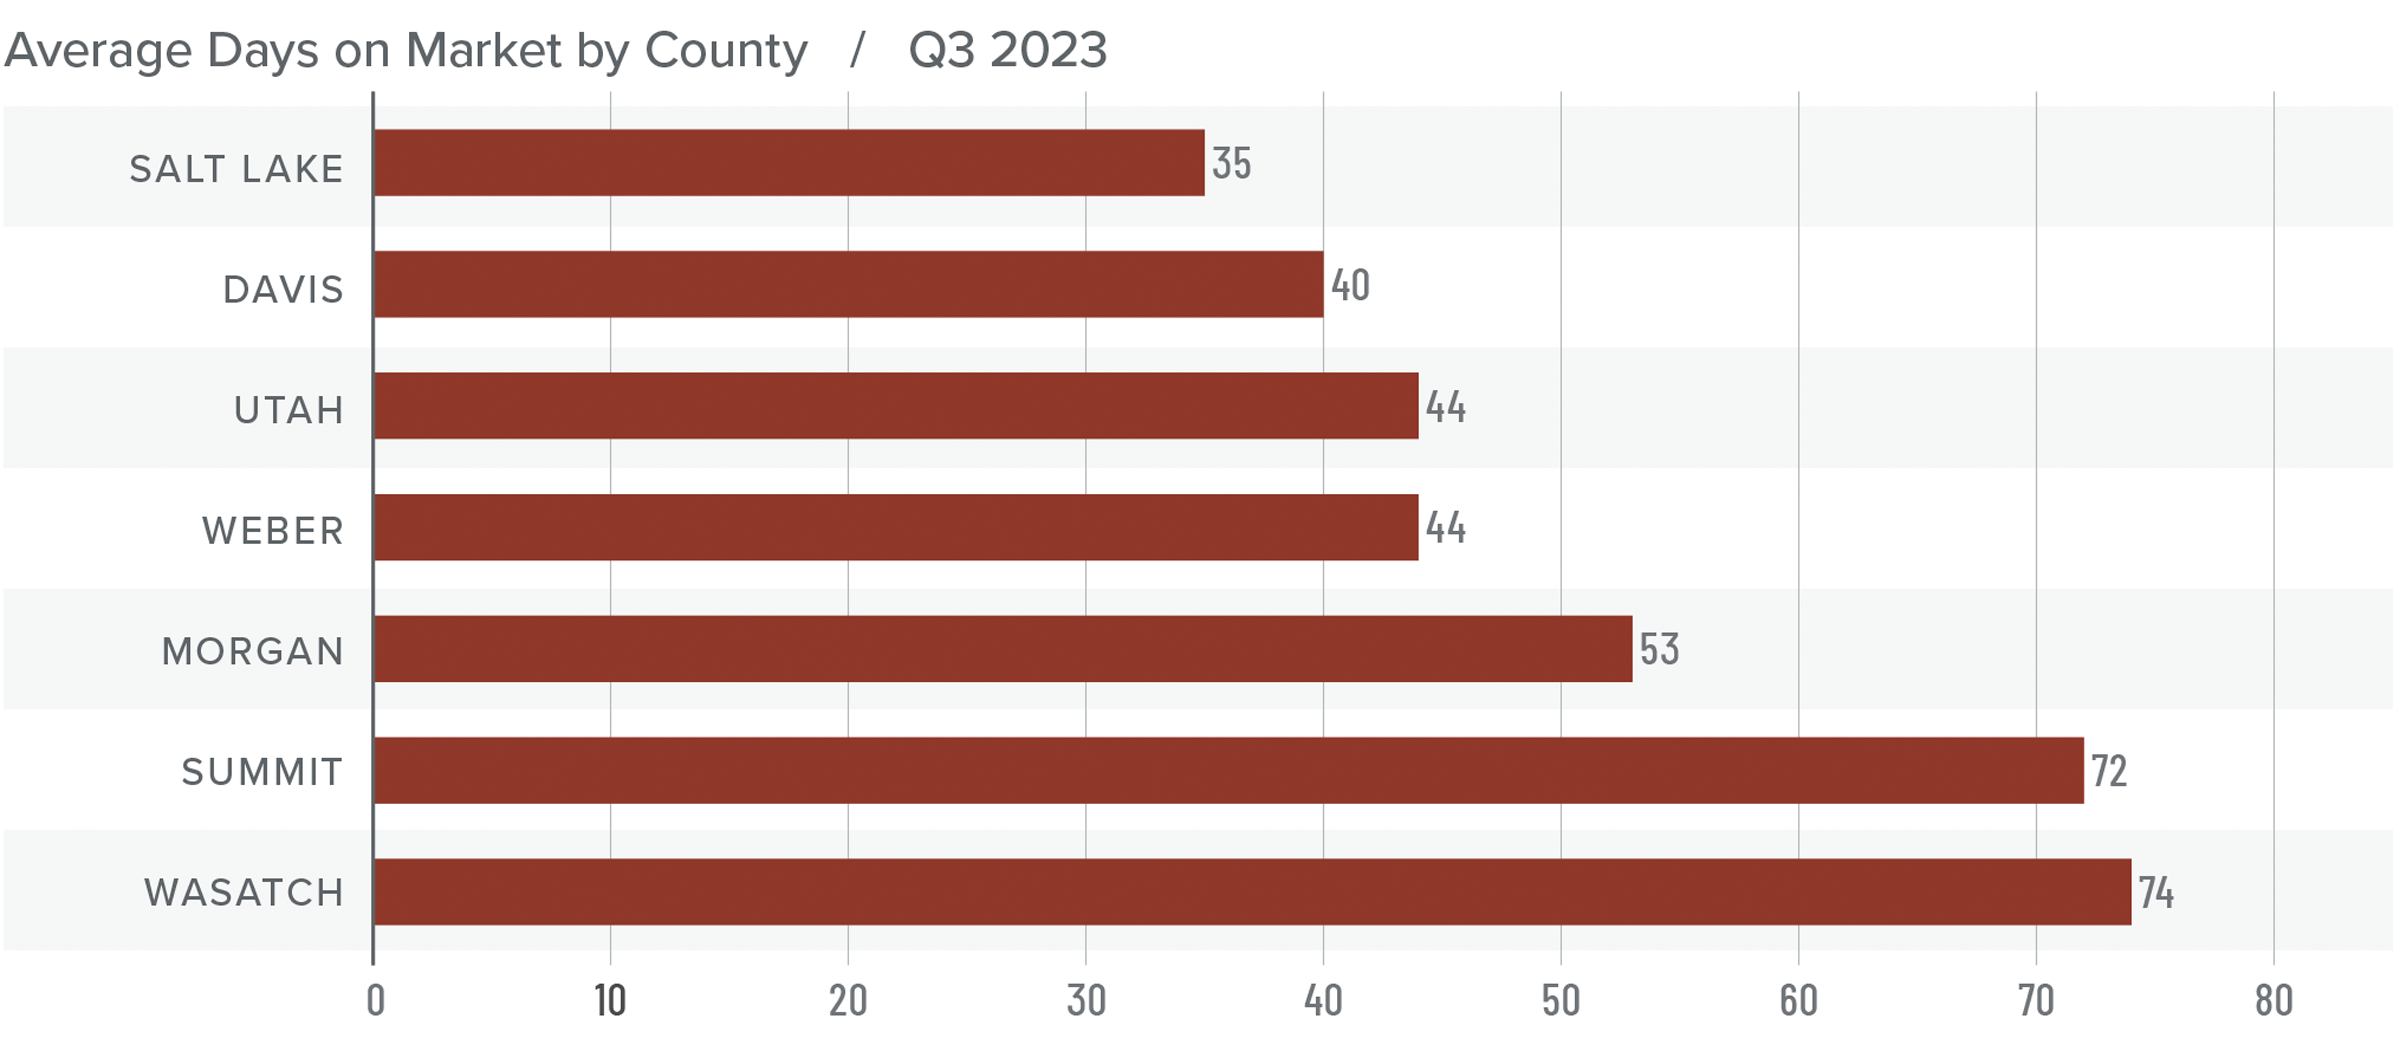
Homes sold fastest in Salt Lake County; Wasatch County was the slowest. All areas saw market time rise compared to the third quarter of 2022, but all counties except Wasatch saw market time fall compared to the second quarter of this year.

During the third quarter, it took an average of 52 days to sell a home. Market time fell three days compared to the second quarter of 2023.

Even when faced with more inventory and higher financing costs, it was impressive to see the length of time it took to sell a home in the region fall, albeit modestly, from the second quarter.

A bar graph showing the days on market by county for homes in Utah in Q3 2023. Salt Lake County is at the top with the least days on market of 35 and Wasatch is at the bottom of the graph with the most days on market of 74. Weber and Utah Counties are in the middle with 44 days on market.

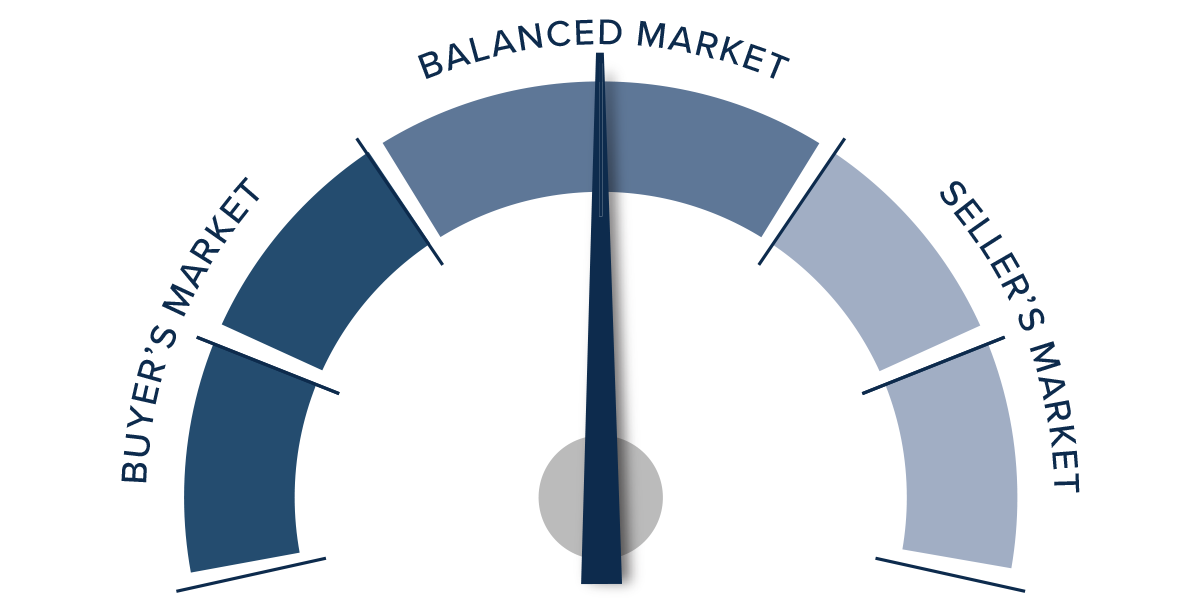
Conclusions

This speedometer reflects the state of the region’s real estate market using housing inventory, price gains, home sales, interest rates, and larger economic factors.

The region saw average market time fall even though the number of available homes rose, which should favor home sellers. That said, closed and pending sales fell, and list price growth was flat.

This suggests that the market is lacking direction, which is to be expected given that mortgage rates are at their highest level in over 20 years. Current buyers are likely weighing whether interest rates will come down and, if they do, how long they’ll have to wait to refinance out of a loan with a rate well above seven percent.

A speedometer graph indicating the market in Utah for Q3 2023. The needle points to the middle of the meter in the “balanced market” portion.

Inventory growth and mortgage rates aside, the market has seen a very significant runup in prices since the start of the pandemic, so it wouldn’t surprise me if both prices and sales remain fairly static for the balance of the year.

As such, the needle moves more toward the middle, with neither buyers nor sellers really having the upper hand.

Market News November 1, 2023

Q3 2023 Montana Real Estate Market Update

The following analysis of select counties of the Montana real estate market is provided by Windermere Real Estate. We hope that this information may assist you with making better-informed real estate decisions. For further information about the housing market in your area, please don’t hesitate to contact your Windermere Real Estate agent.


Regional Economic Overview

The pace of job growth in Montana continues to taper. The state added only 6,000 jobs, which represents an annual growth rate of 1.2%. This is the slowest pace of growth in the state since pandemic influences started to come into play.

Regional variations continued: the Billings metro area lost 600 jobs, Great Falls employment was flat, and the Missoula metro area saw employment rise 1,100 jobs.

The state unemployment rate in August was 2.5%, which was down from 2.7% in the same period of 2022. All metro areas in this report showed unemployment rates of 2.5%.

Montana Home Sales

In the third quarter of 2023, 1,959 homes sold in the counties covered by this report. This was a 10.8% decline from the third quarter of 2022 but 7% higher than in the second quarter of 2023.

Listing activity was 9.6% higher than during the same period of 2022 and 30.2% higher than in the second quarter of this year.

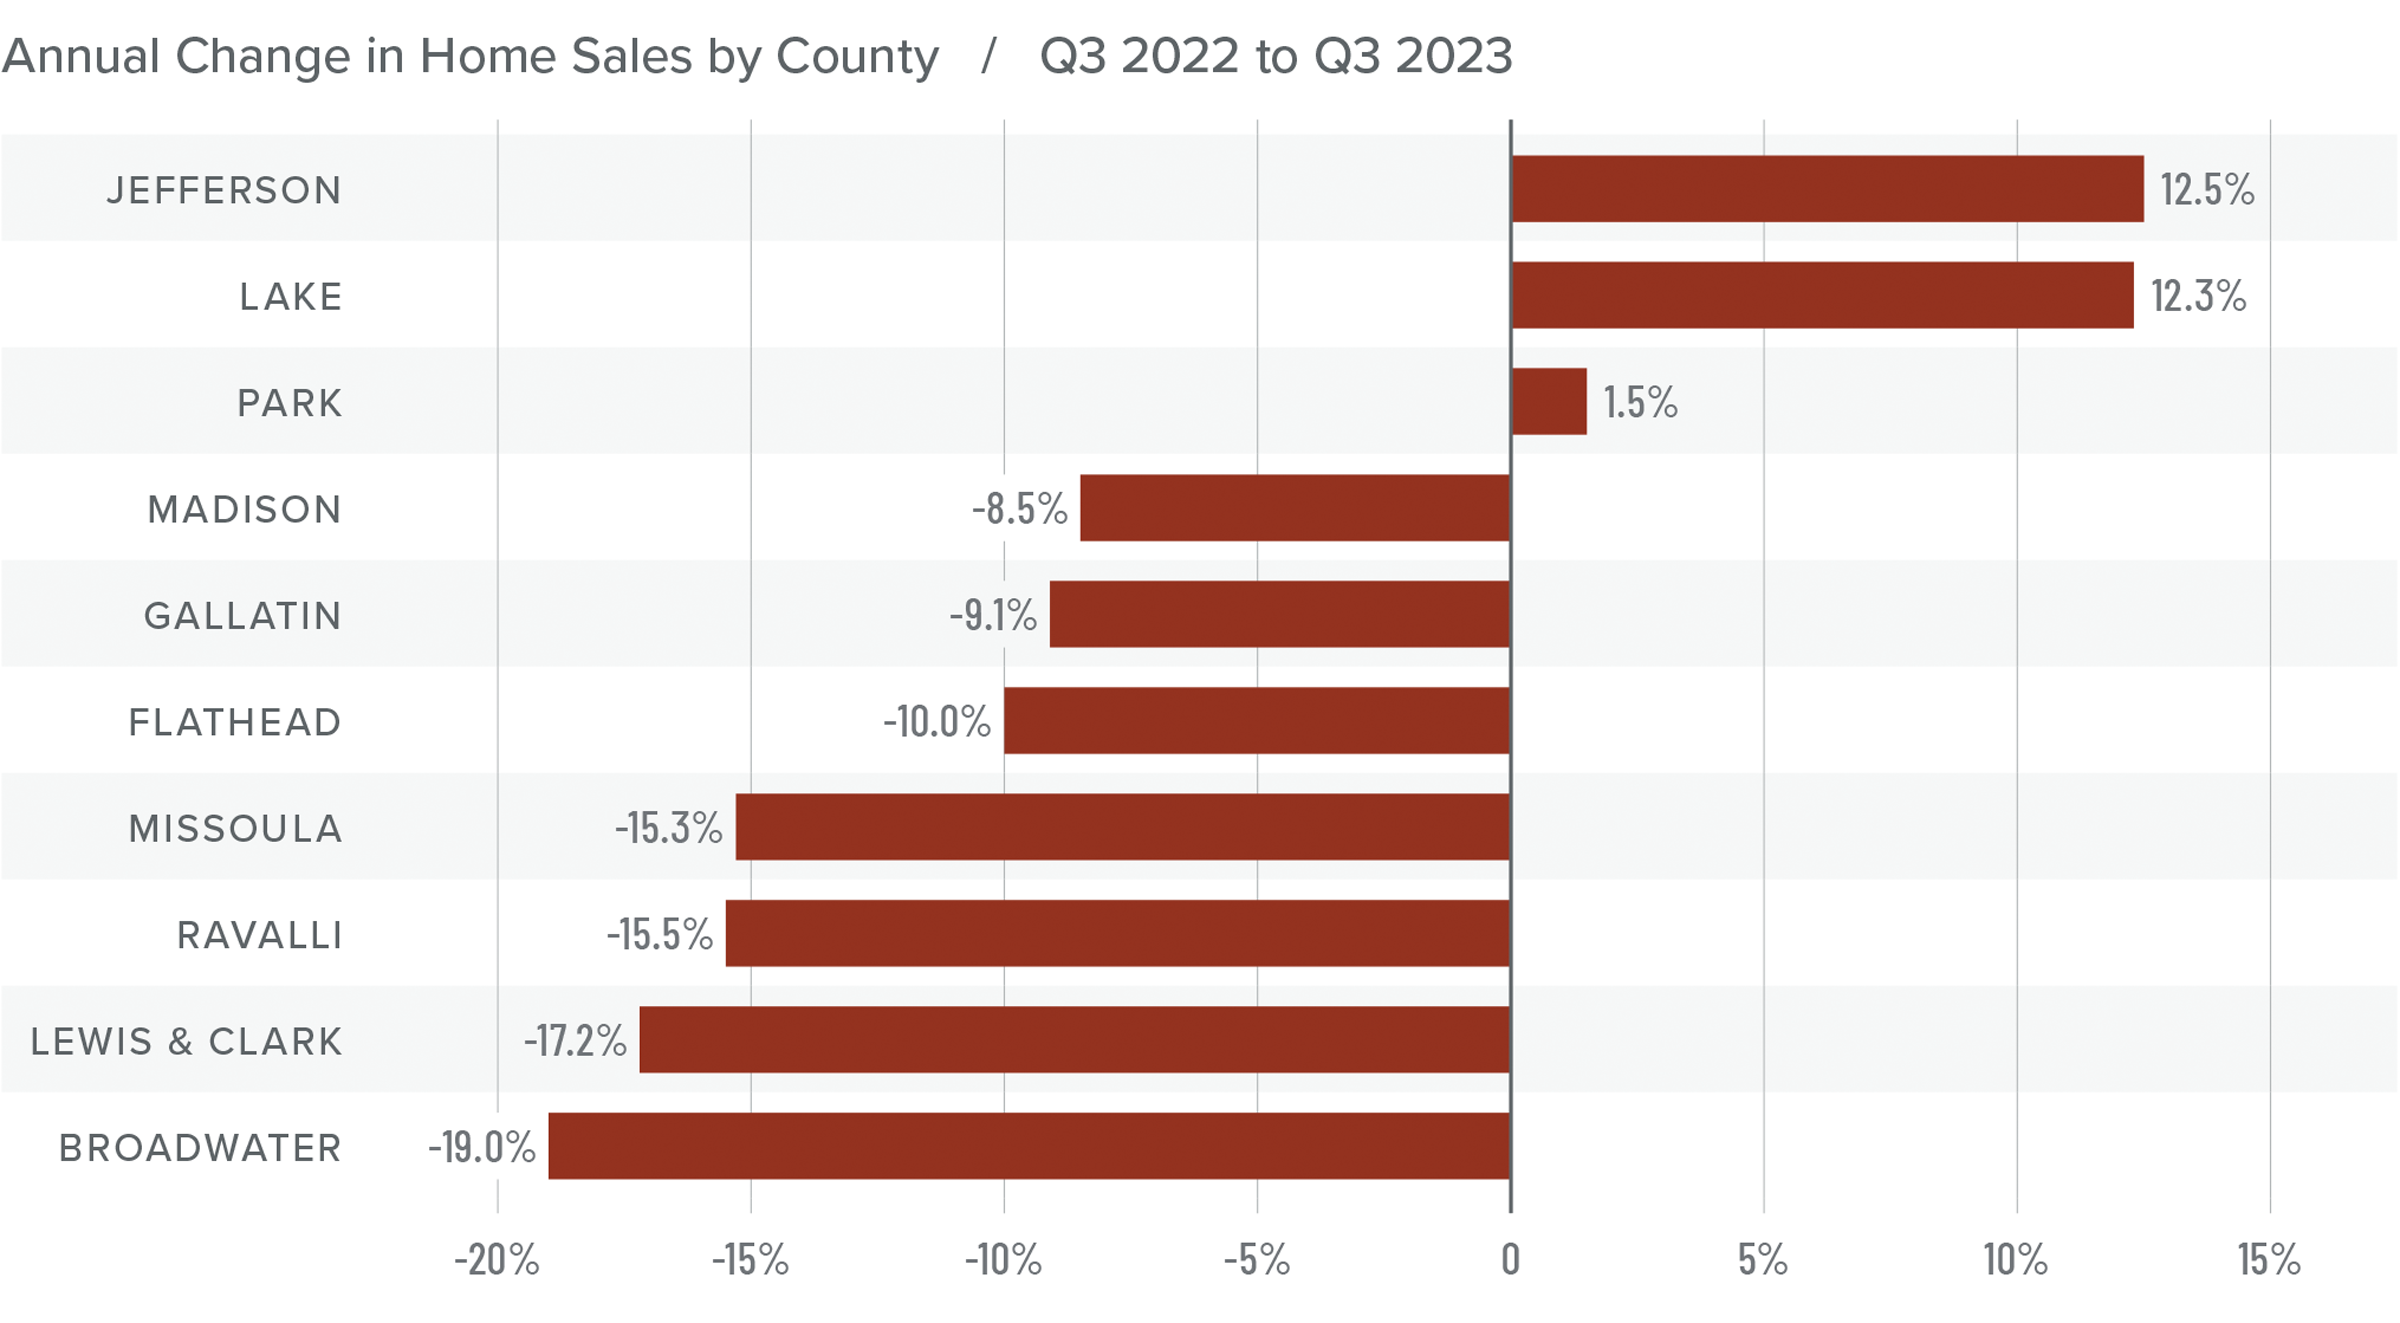
Year over year, sales fell in all but three markets. Compared to the second quarter of this year, sales were up in every county other than Broadwater and Ravalli, where sales were down 37% and 7.4%, respectively.

Pending sales fell 24.2% quarter over quarter, suggesting that closings in the final quarter of the year may be down.

A bar graph showing the annual change in home sales by county in Montana from Q3 2022 to Q3 2023. Park County had the least change at 1.5% increase, Jefferson County and Lake County had the largest increases of 12.5% and 12.3% respectively while the rest of the counties had a decrease and Broadwater had the largest decrease at 19 percent.

Montana Home Prices

Home prices were up 9.6% year over year. The average sale price was $758,641, which was 12% higher than in the second quarter of 2023.

The growth in home prices is a little surprising given rising financing costs, more choice in the market, and the fact that list prices were higher in most markets than in the second quarter of 2023.

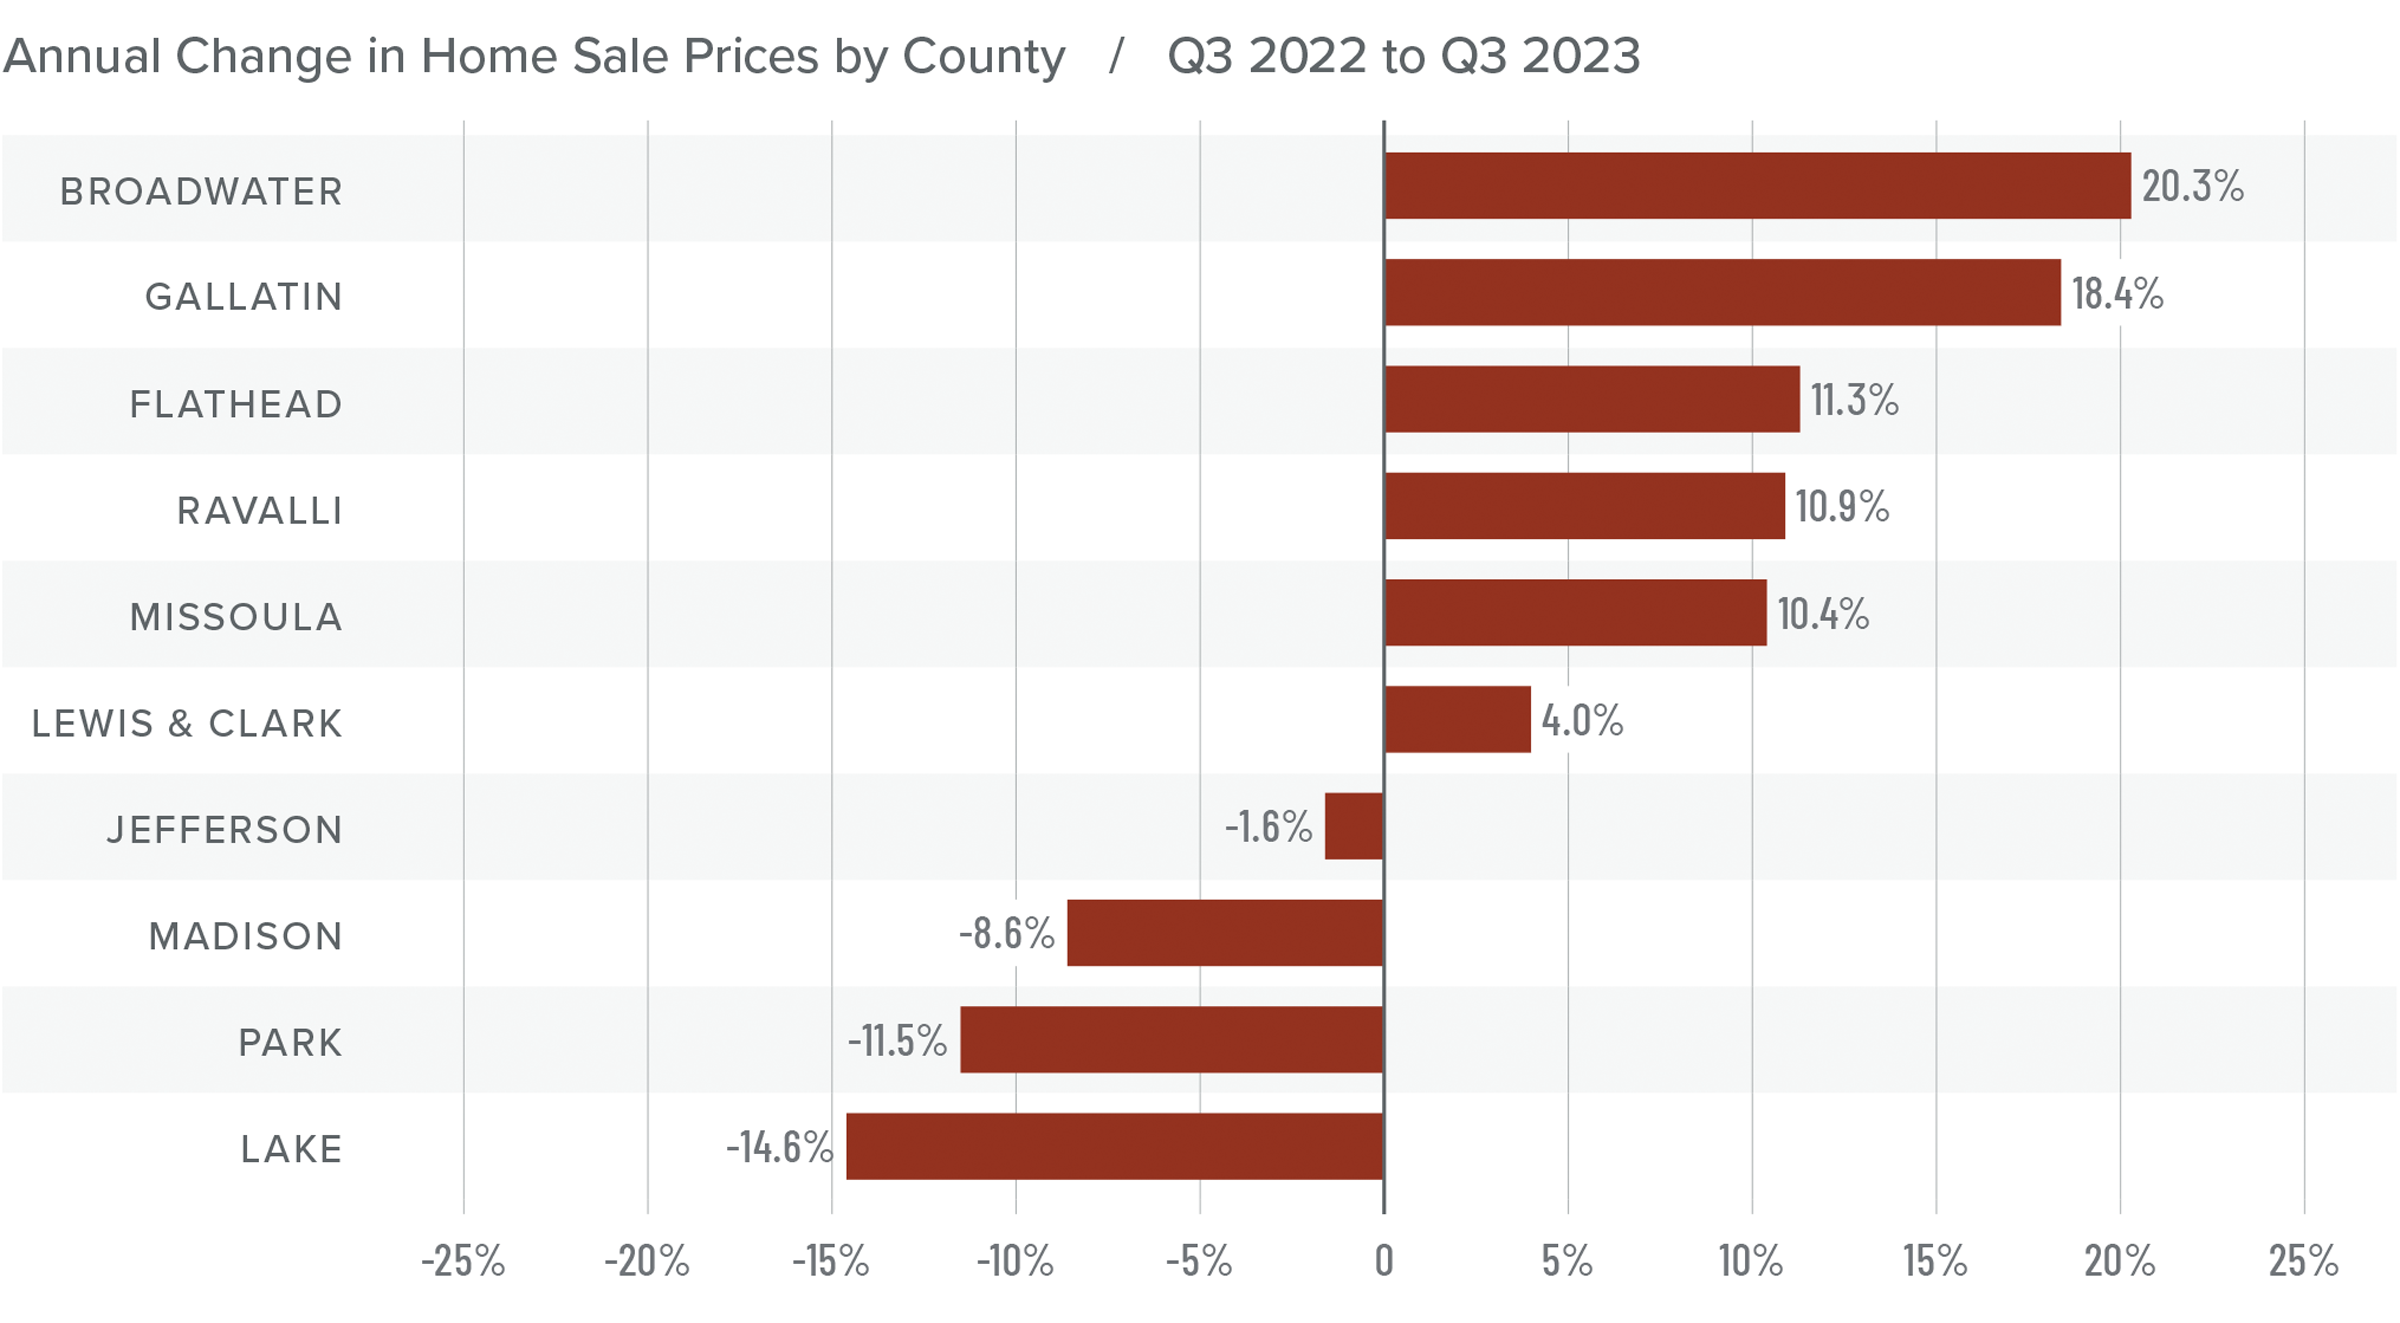
Year over year, prices rose in six counties and fell in four. Compared to the second quarter of this year, prices rose in every county other than Lake and Park.

So far, higher mortgage rates have not been much of a deterrent, at least not yet. I expected price growth to start tapering by now, but it appears I was a little premature. That said, I stand by my belief that high mortgage rates will begin to impact price growth as we move toward the end of the year.

A map showing the real estate home prices percentage changes for various counties in Montana. Different colors correspond to different tiers of percentage change. Flathead, Broadwater, and Gallatin had changes greater than 11% and are represented in the corresponding navy color. Missoula and Ravalli were in the 4.5-10.9% range. Lewis & Clark and Jefferson were in the -2 to 4.4% range. Madison, Park, and Lake Counties were in the -8.6 to -15% range and are represented in the light grey color on the map.

A bar graph showing the annual change in home sale prices by county in Montana from Q3 2022 to Q3 2023. Jefferson County had the least change at -1.6% while Lake had the greatest decrease of 14.6% and Broadwater had the greatest increase of 20.3%.

Mortgage Rates

Mortgage rates continued trending higher in the third quarter of 2023 and are now at levels we have not seen since the fall of 2000. Mortgage rates are tied to the interest rate (yield) on 10-year treasuries, and they move in the opposite direction of the economy. Unfortunately for mortgage rates, the economy remains relatively buoyant, and though inflation is down significantly from its high, it is still elevated. These major factors and many minor ones are pushing Treasury yields higher, which is pushing mortgage rates up. Given the current position of the Federal Reserve, which intends to keep rates “higher for longer,” it is unlikely that home buyers will get much reprieve when it comes to borrowing costs any time soon.

With such a persistently positive economy, I have had to revise my forecast yet again. I now believe rates will hold at current levels before starting to trend down in the spring of next year.

A bar graph showing the mortgage rates from Q3 2021 to the present, as well as Matthew Gardner's forecasted mortgage rates through Q3 2024. In Q3 2023 Mortgage Rates hit 7.04% and Matthew Gardner predicts rates will decrease steadily over the next 4 quarters.

Montana Days on Market

The average time it took to sell a home rose six days compared to the same period in 2022. Time on market fell 11 days compared to the second quarter of 2023.

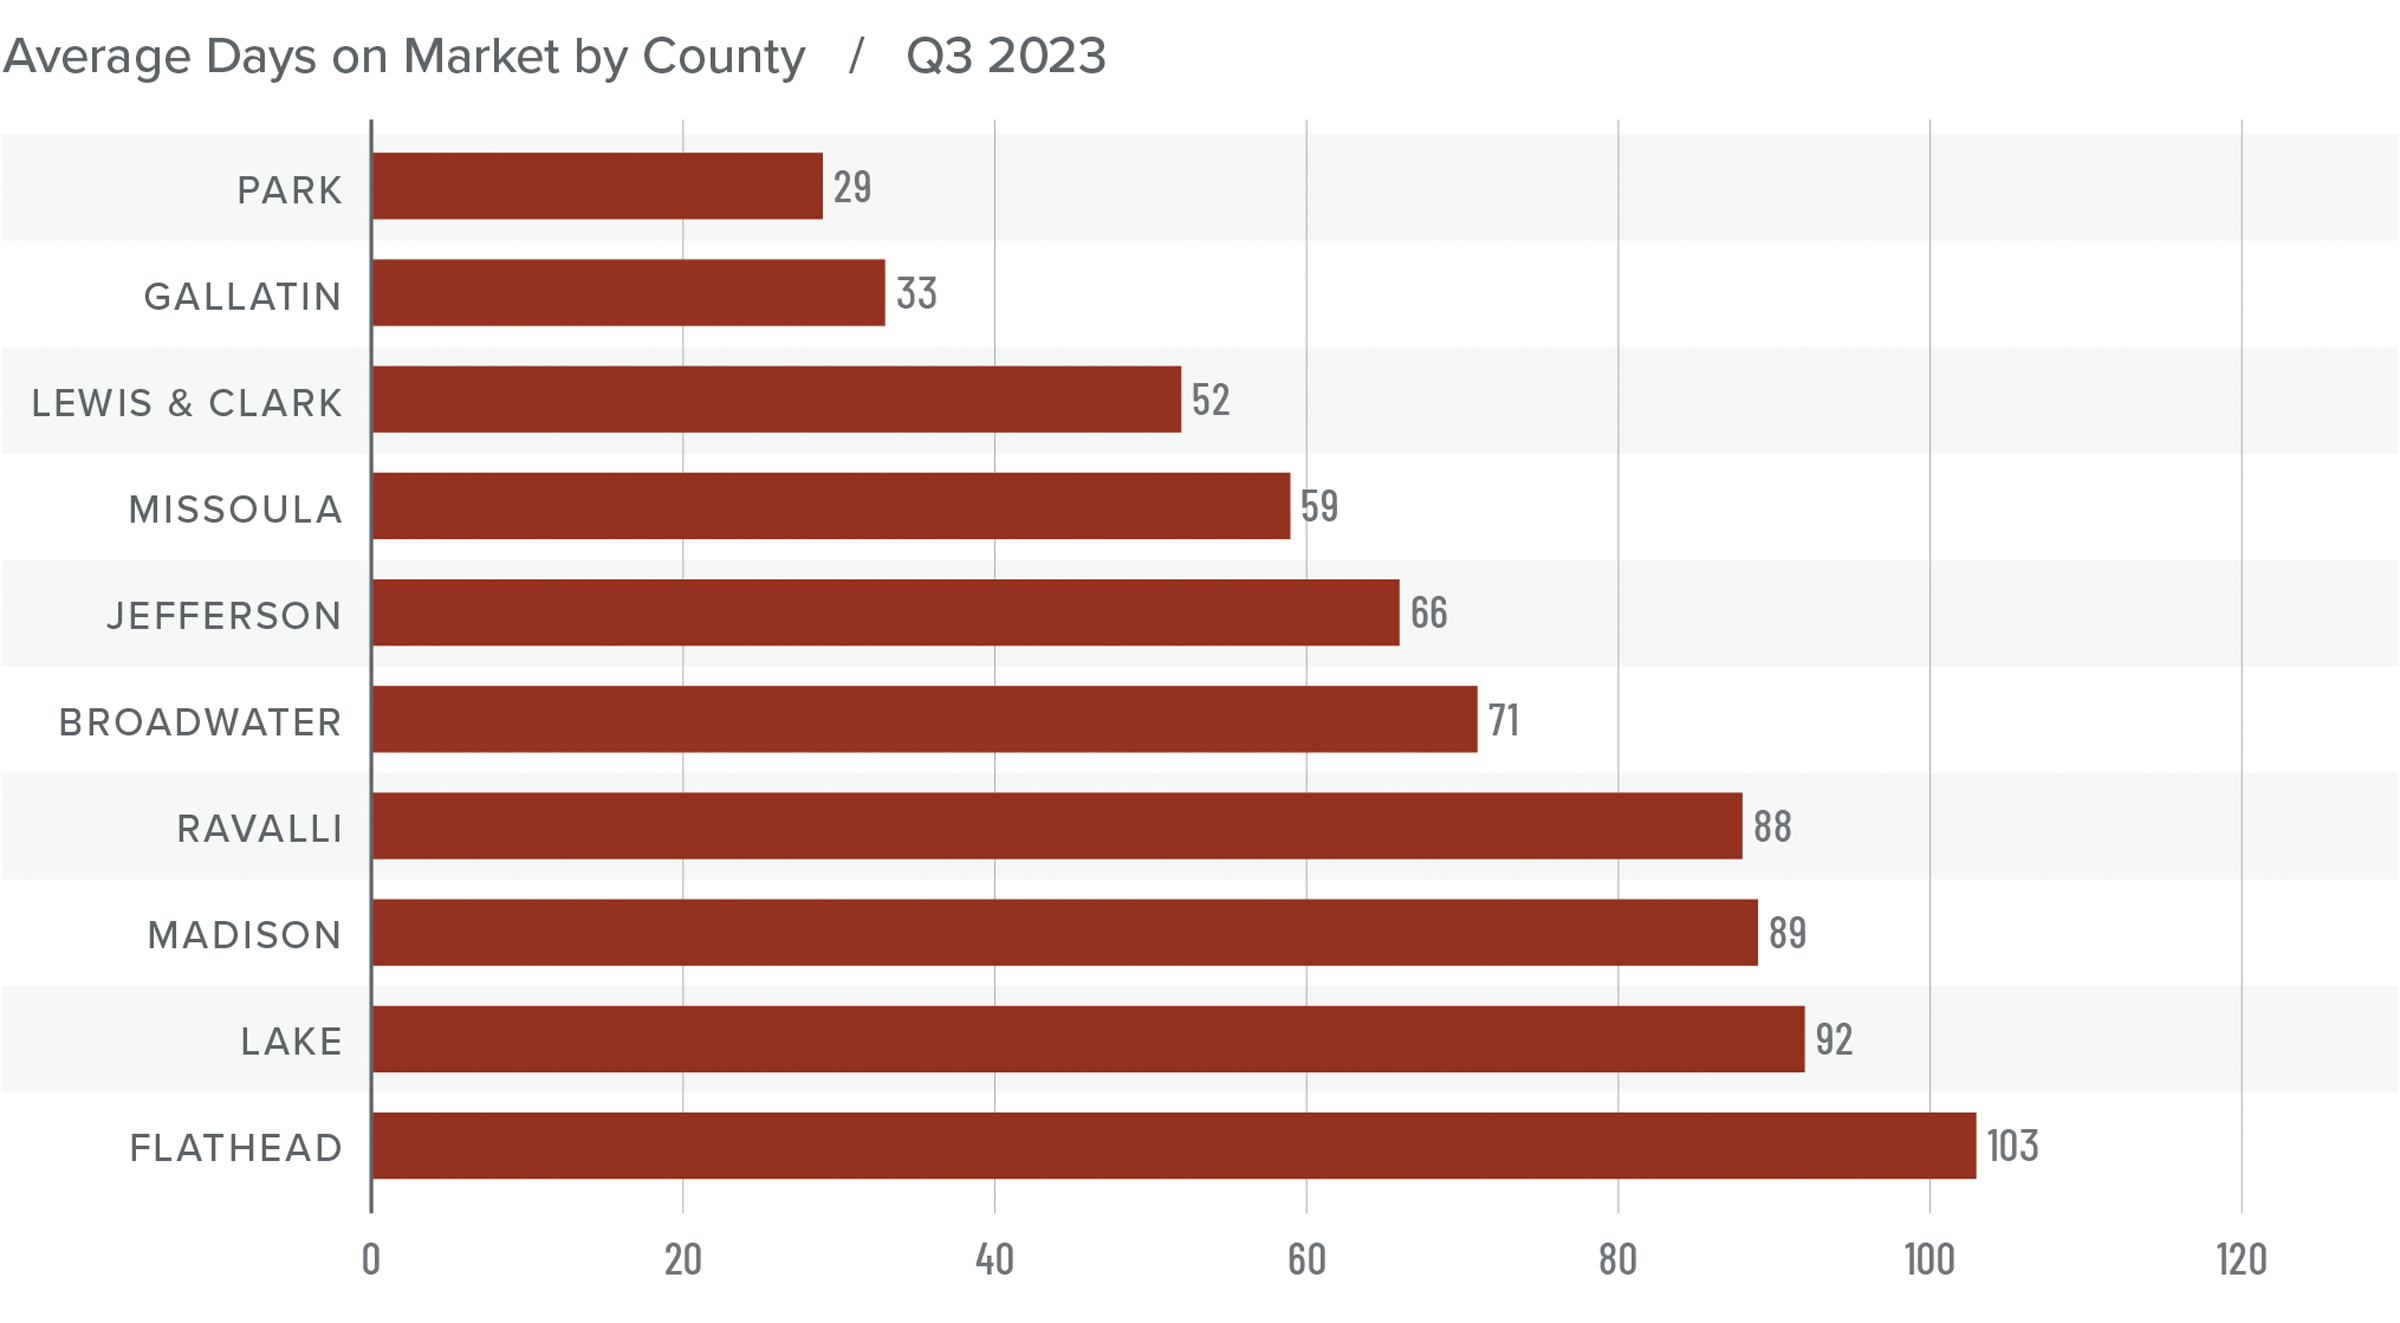
Homes sold fastest in Park County while homes in Flathead County took the longest time to sell. Compared to the third quarter of 2022, market time fell in Missoula, Lewis and Clark, Broadwater, Jefferson, and Park counties but rose in the rest of the region.

During the third quarter, it took an average of 68 days to sell a home in the markets covered by this report.

Compared to the second quarter of this year, average market time rose in only three counties (Lake, Lewis and Clark, and Madison), was flat in Ravalli, and fell everywhere else.

A bar graph showing the days on market by county for homes in Montana in Q3 2023. Park County is at the top with the least days on market of 29 and Flathead is at the bottom of the graph with the most days on market of 103. Jefferson and Broadwater Counties are in the middle with 66 and 71 days on market respectively.

Conclusions

This speedometer reflects the state of the region’s real estate market using housing inventory, price gains, home sales, interest rates, and larger economic factors.

As mentioned earlier, it doesn’t appear that rising mortgage rates have had the same negative effect in Montana that has been felt across most of the country. In the third quarter, home sales and sale/ list prices rose while market time fell, which are all factors that favor sellers. However, rising inventory and falling pending sales would suggest that the market may be ready to shift toward buyers.

A speedometer graph indicating the market in Montana for Q3 2023. The needle points to the right half of the “balanced market” portion, toward “seller’s market.”

Although the market is expected to slow, it’s too early to suggest that it will favor buyers any time soon. Given all these factors, the needle stays in the balanced quadrant but moved slightly in favor of home sellers.

Market News November 1, 2023

Q3 2023 Idaho Real Estate Market Update

The following analysis of select counties of the Idaho real estate market is provided by Windermere Real Estate. We hope that this information may assist you with making better-informed real estate decisions. For further information about the housing market in your area, please don’t hesitate to contact your Windermere Real Estate agent.


Regional Economic Overview

The annual pace of employment growth in the state continues to slow. However, the addition of 22,400 new jobs since the third quarter of 2022 represents an impressive 2.7% growth rate and is well above the national rate of 2.1%. While I expect the pace of job growth to continue to cool, jobs will still be added for the balance of the year. My current forecast calls for statewide employment to increase 2.5% in 2023 and 1.3% in 2024.

With the exception of Lewiston, where employment levels were static, all of Idaho’s metro areas had solid year-over-year nonfarm job gains. Idaho Falls saw the greatest increase at 4.2%, followed by Pocatello (+3.3%), Coeur d’Alene (+3%), Boise (+2.7%), and Twin Falls (2.6%).

The state unemployment rate was a healthy 3%, which was marginally above 2.8% in the third quarter of 2022. Regionally, the lowest jobless rate was in Idaho Falls at 2.7%. Boise’s unemployment rate was 3.5%. The highest rate was in Coeur d’Alene, where 4.5% of the workforce was actively looking for work.

Idaho Home Sales

In the third quarter of 2023, 4,945 homes sold, which was a drop of 6.2% from the third quarter of 2022 and 2.7% lower than in the second quarter of this year.

Listing activity was up 11.3% from the second quarter of the year, which appears to have resulted in rising sales in most market areas.

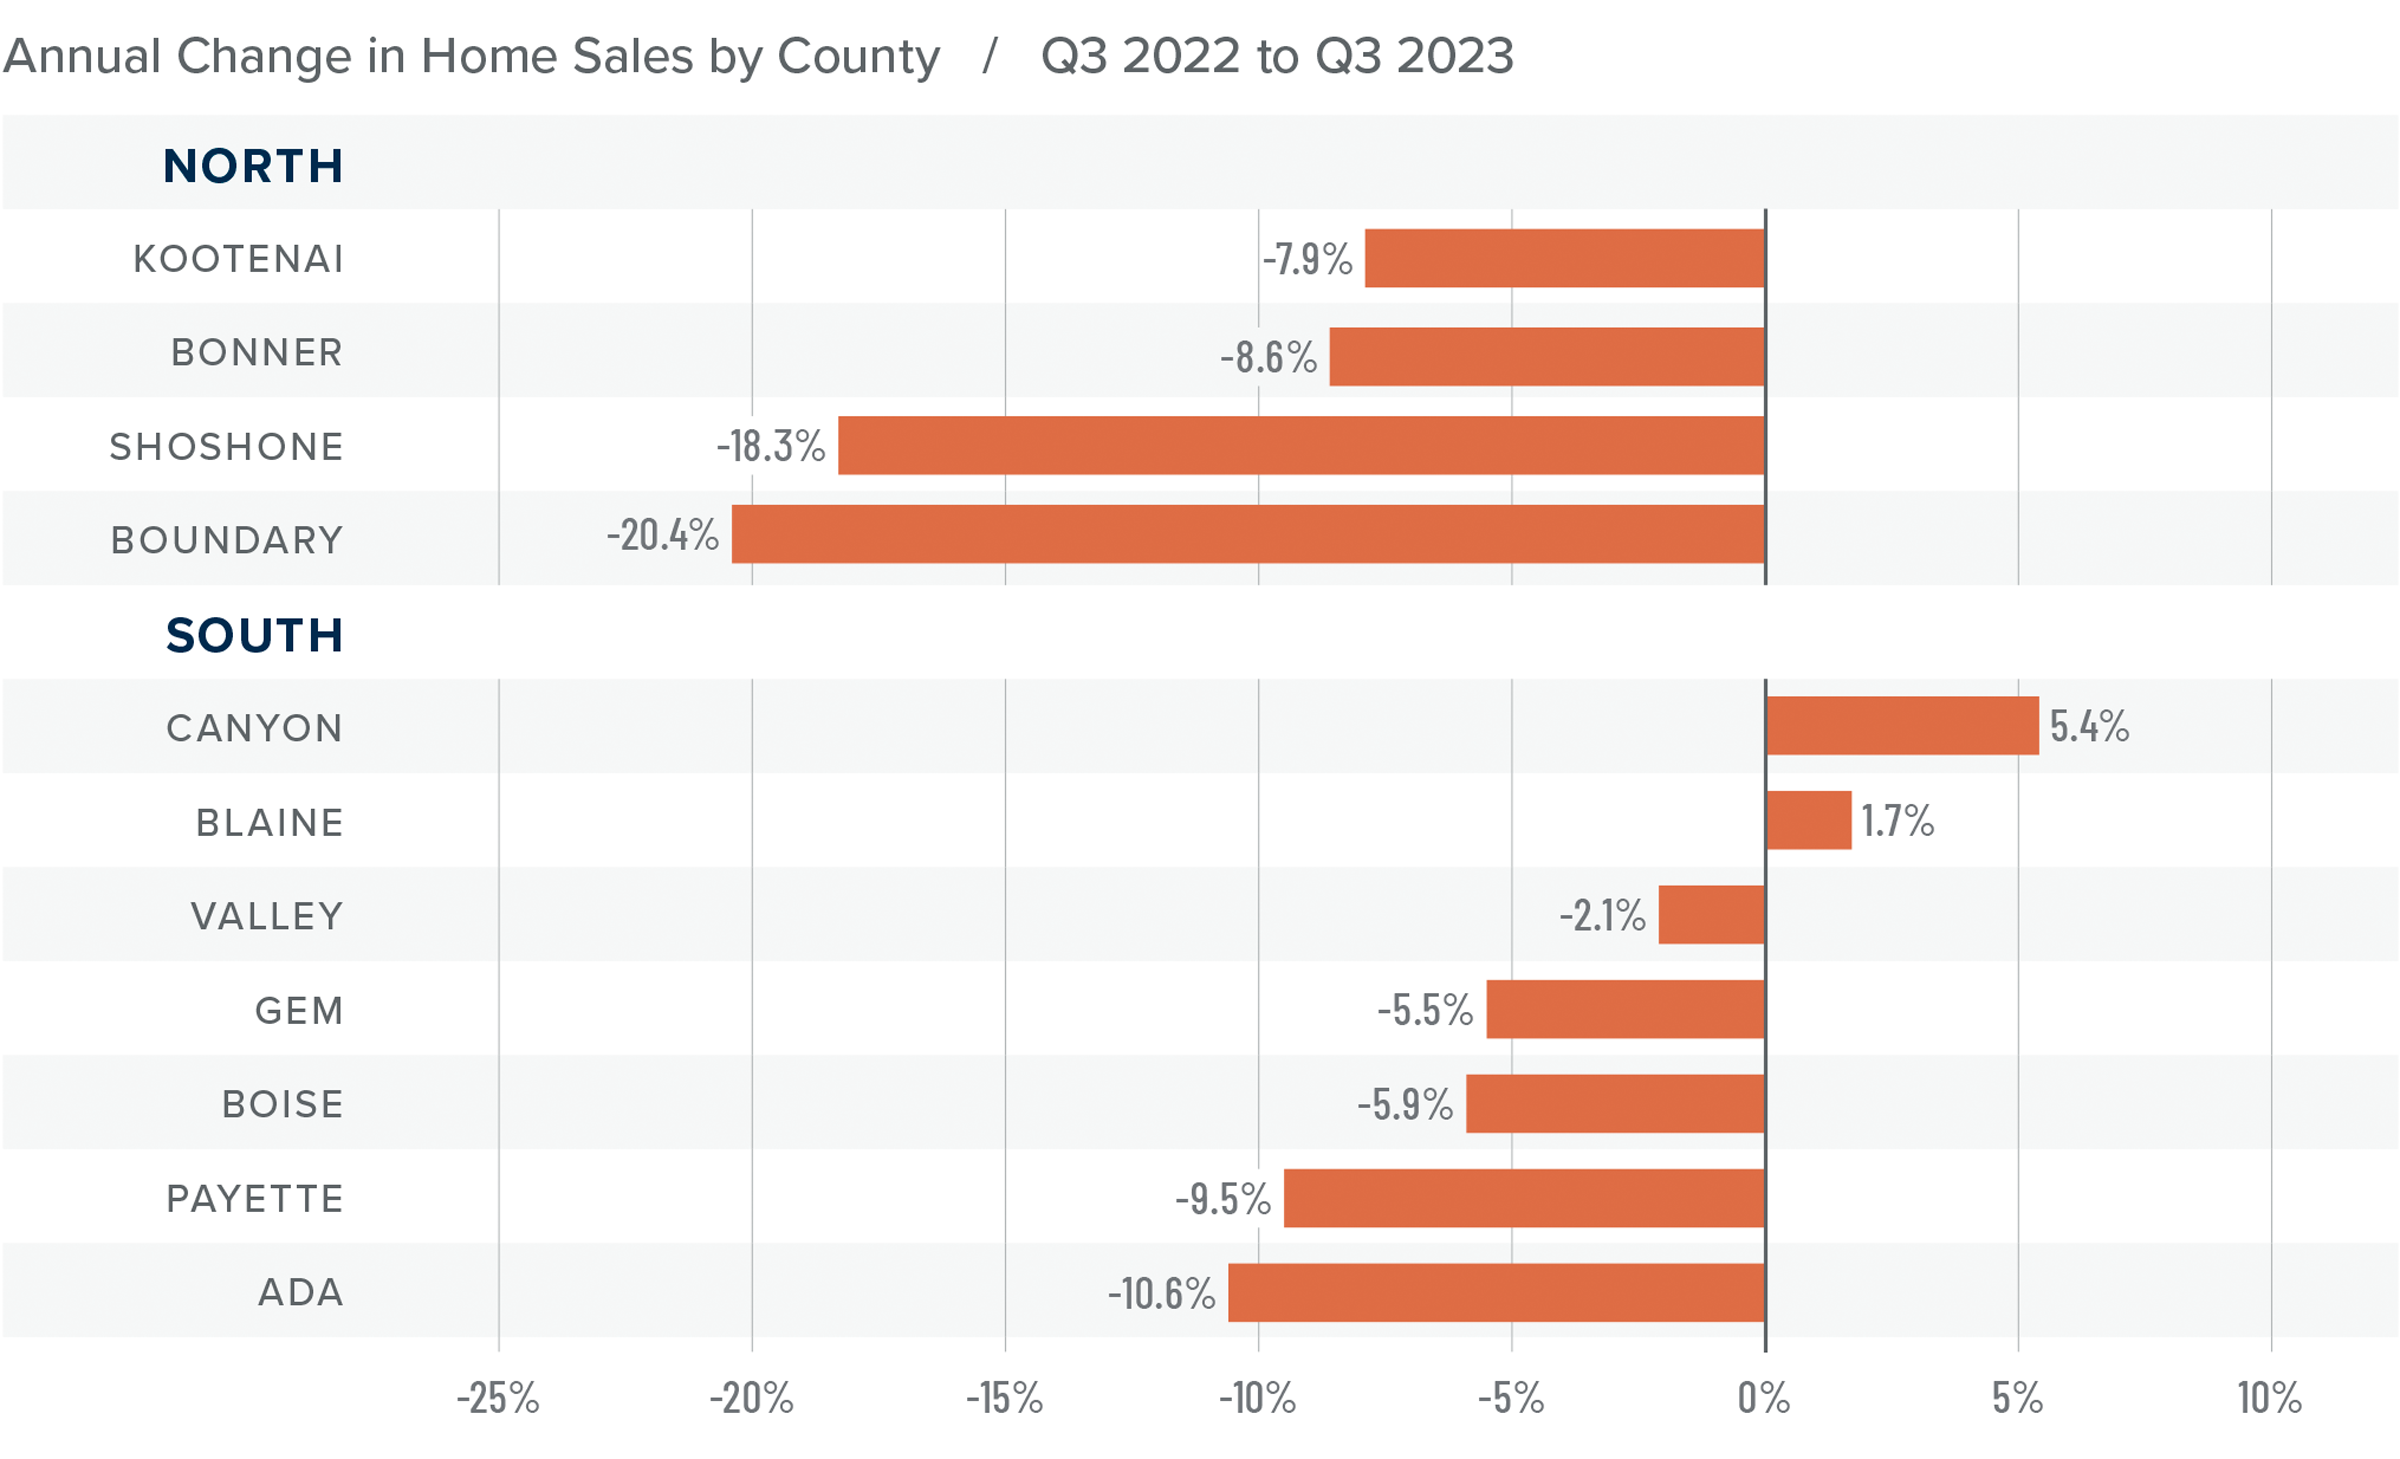
Relative to the same quarter in 2022, sales fell in all the northern counties covered by this report and in every county other than Canyon and Blaine in the Southern Idaho markets. However, compared to the second quarter of this year, sales rose in all markets other than Boundary County in Northern Idaho and Canyon, Gem, and Ada counties in the southern part of the state.

Pending sales in the third quarter were lower than in the second quarter of 2023, suggesting that sales may slow in the final quarter of the year.

A bar graph showing the annual change in home sales by county in North and South Idaho from Q3 2022 to Q3 2023. In the North Kootenai had the least change at -7.9% and Boundary had the greatest change at -20.4%. In the South, Blaine had the least change at 1.7% and Canyon County had the greatest increase at 5.4% while Ada had the greatest decrease of 10.6%.

Idaho Home Prices

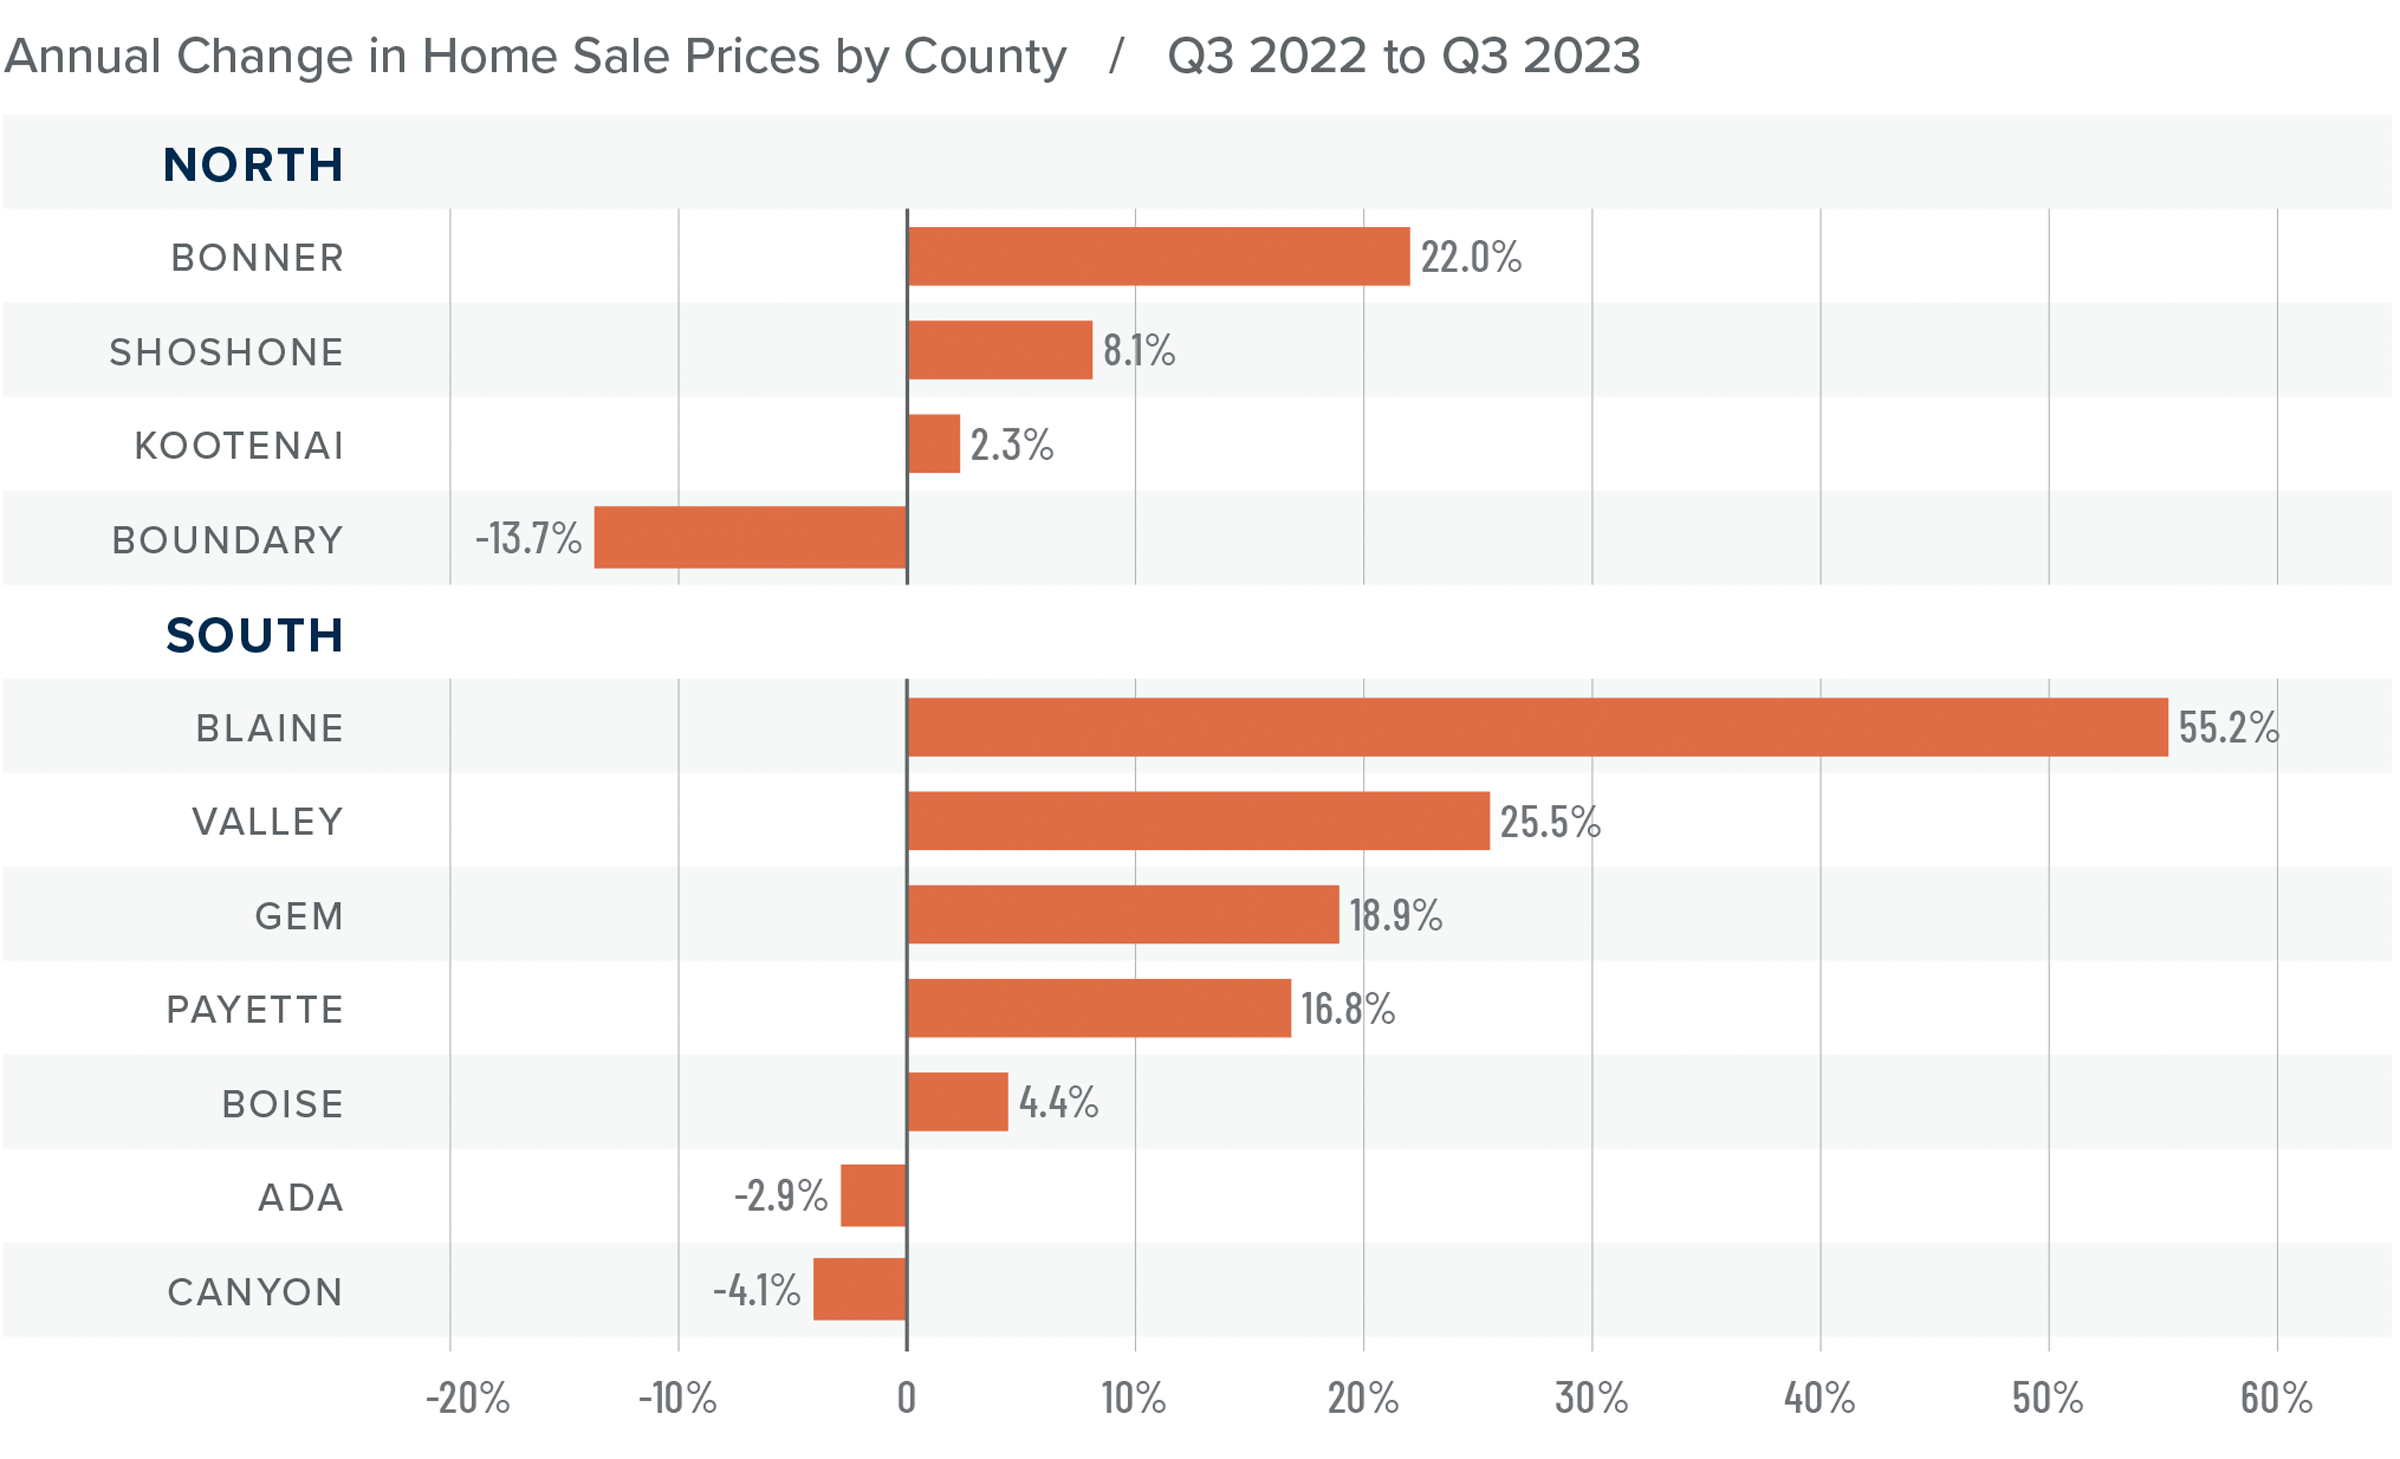
The average home price in the region rose 2.7% year over year to $636,148. Sale prices were 5.1% higher than in the second quarter of 2023.

Compared to the second quarter of 2023, prices rose an average of 5.9% in the northern market areas covered by this report. Sale prices were up 4.2% in the southern part of the state.

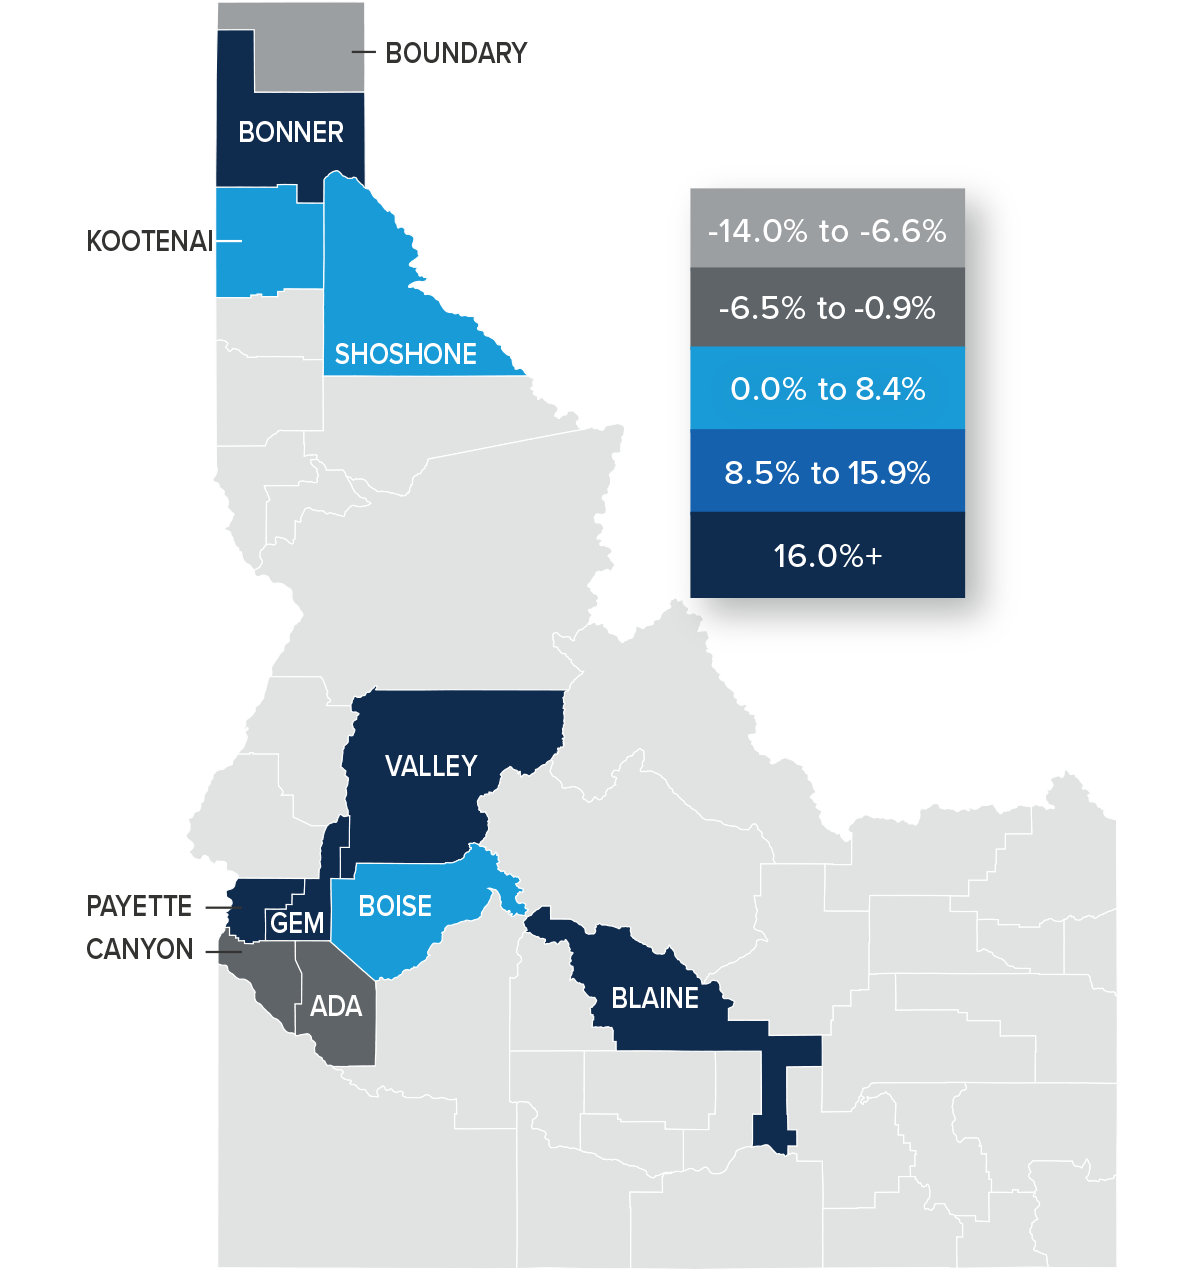
Only one county in the northern market areas and two in the southern markets saw prices fall year over year. Compared to the second quarter, prices rose in all markets other than Shoshone and Boundary counties in the northern market area.

Median list prices were up 9.5% from the second quarter. However, in the southern part of the state, every county except Payette and Blaine counties saw list prices fall. Only Boundary County in the northern markets saw list prices fall. This may suggest that sellers are starting to adjust their expectations given significant increases in financing costs.

A map showing the real estate home prices percentage changes for various counties in Idaho. Different colors correspond to different tiers of percentage change. Bonner, Valley, Gem, Payette, and Blaine had changes of more than 16% and are represented in the corresponding navy color. Kootenai, Shoshone, and Boise Counties were in the 0-8.8% range. Canyon and Ada were in the -0.9 to -6.5% range. Boundary County was in -6.6% to -14% range and is represented in the light grey color on the map.

A bar graph showing the annual change in home sale prices by county in North and South Idaho from Q3 2022 to Q3 2023. In the North, Kootenai had the least change at 2.3% while Bonner had the greatest increase of 22% and Boundary County had the greatest decrease at 13.7%. In the South, Ada County had the least change at -2.9%, just below is is Canyon with the greatest decrease at 4.1% while the rest of the counties saw increases with Blaine seeing the greatest change at 55.2%, the next greatest increase is Valley at 25.5%.

Mortgage Rates

Mortgage rates continued trending higher in the third quarter of 2023 and are now at levels we have not seen since the fall of 2000. Mortgage rates are tied to the interest rate (yield) on 10-year treasuries, and they move in the opposite direction of the economy. Unfortunately for mortgage rates, the economy remains relatively buoyant, and though inflation is down significantly from its high, it is still elevated. These major factors and many minor ones are pushing Treasury yields higher, which is pushing mortgage rates up. Given the current position of the Federal Reserve, which intends to keep rates “higher for longer,” it is unlikely that home buyers will get much reprieve when it comes to borrowing costs any time soon.

With such a persistently positive economy, I have had to revise my forecast yet again. I now believe rates will hold at current levels before starting to trend down in the spring of next year.

A bar graph showing the mortgage rates from Q3 2021 to the present, as well as Matthew Gardner's forecasted mortgage rates through Q3 2024. In Q3 2023 Mortgage Rates hit 7.04% and Matthew Gardner predicts rates will decrease steadily over the next 4 quarters.

Idaho Days on Market

The average time it took to sell a home in the region rose 16 days compared to the third quarter of 2022. It took an average of nine fewer days for a home to sell than in the second quarter of this year.

In both Northern and Southern Idaho, days on market rose in all counties compared to the same period of 2022. Compared to the second quarter of this year, market time rose in every county in the northern part of the state. In the southern areas, market time fell in all counties except Payette and Gem.

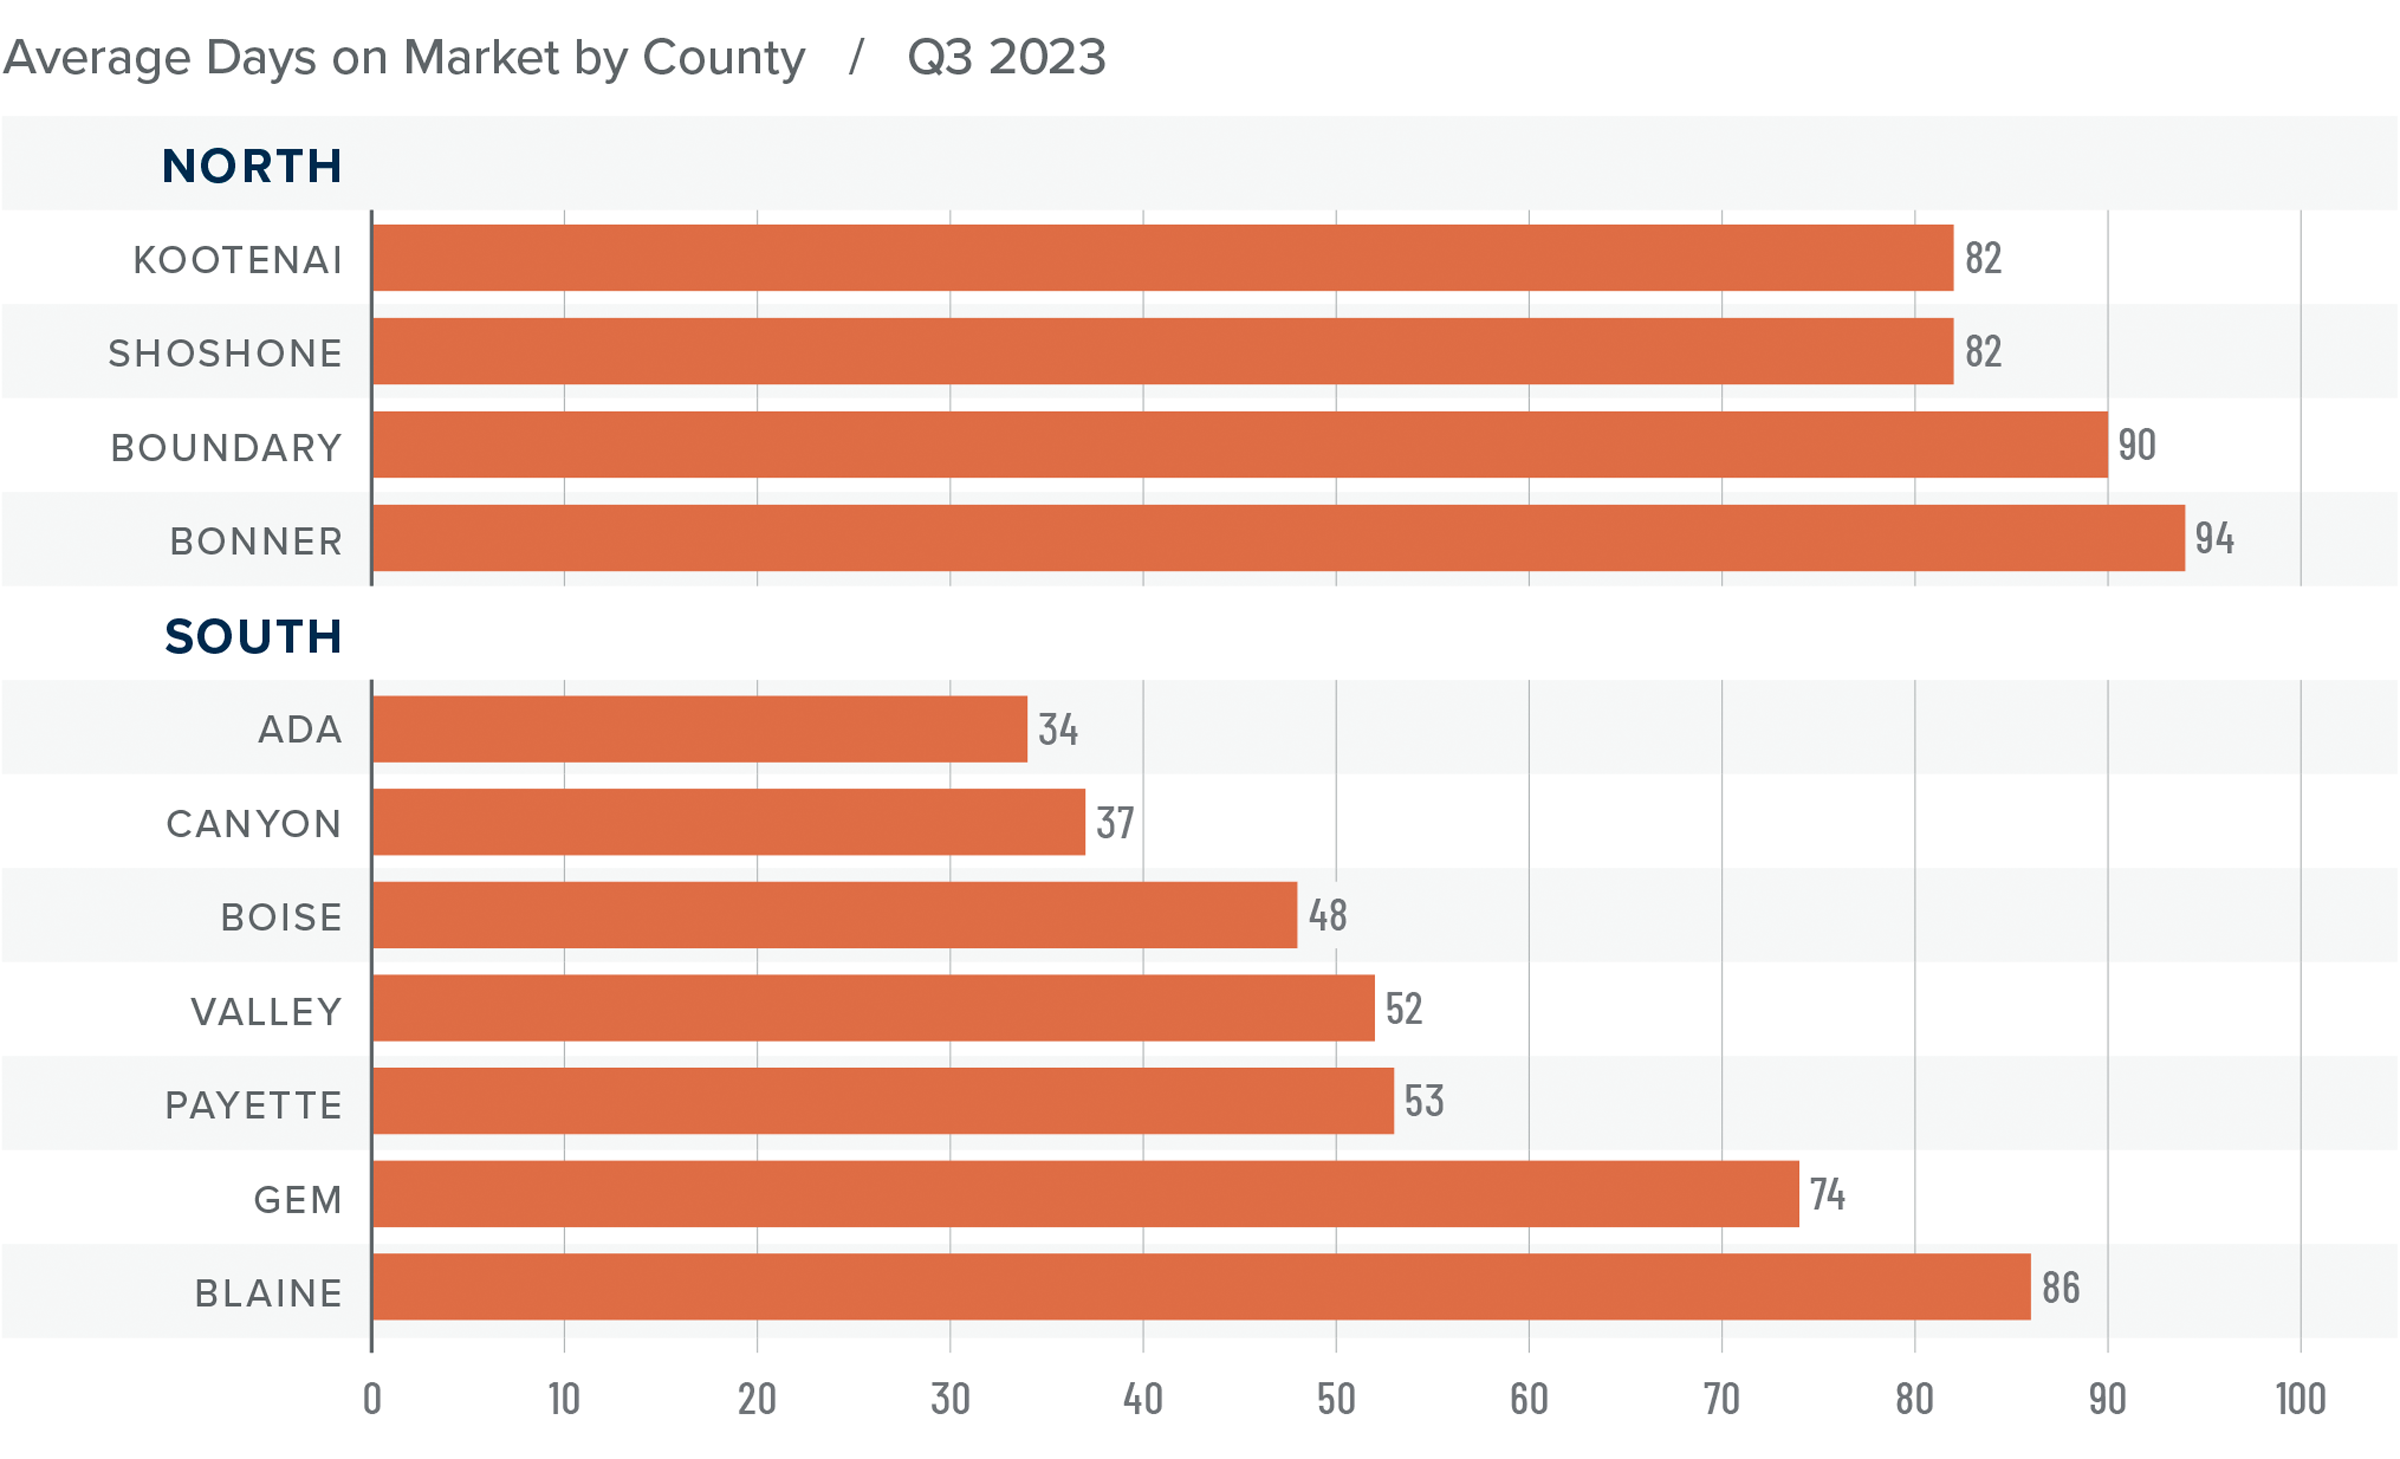
It took an average of 87 days to sell a home in Northern Idaho and 55 days in the southern counties covered by this report.

Homes sold the fastest in Ada County in the southern part of the state. In Northern Idaho, Shoshone and Kootenai counties had the shortest market time.

A bar graph showing the days on market by county for homes in North and South Idaho in Q3 2023. In the North, Kootenai and Shoshone had the least days on market at 82, and Bonner had the most with 94. In the South, Ada had the least of 34 and Blaine County had the most days on market with 86, Valley sits in the middle of the graph at 52.

Conclusions

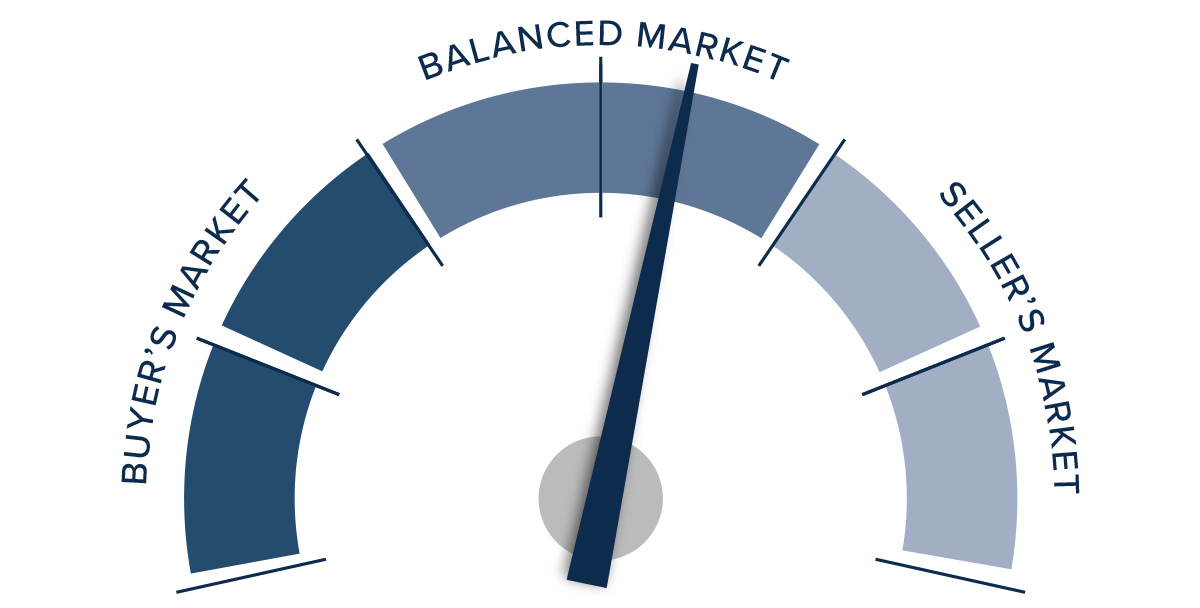
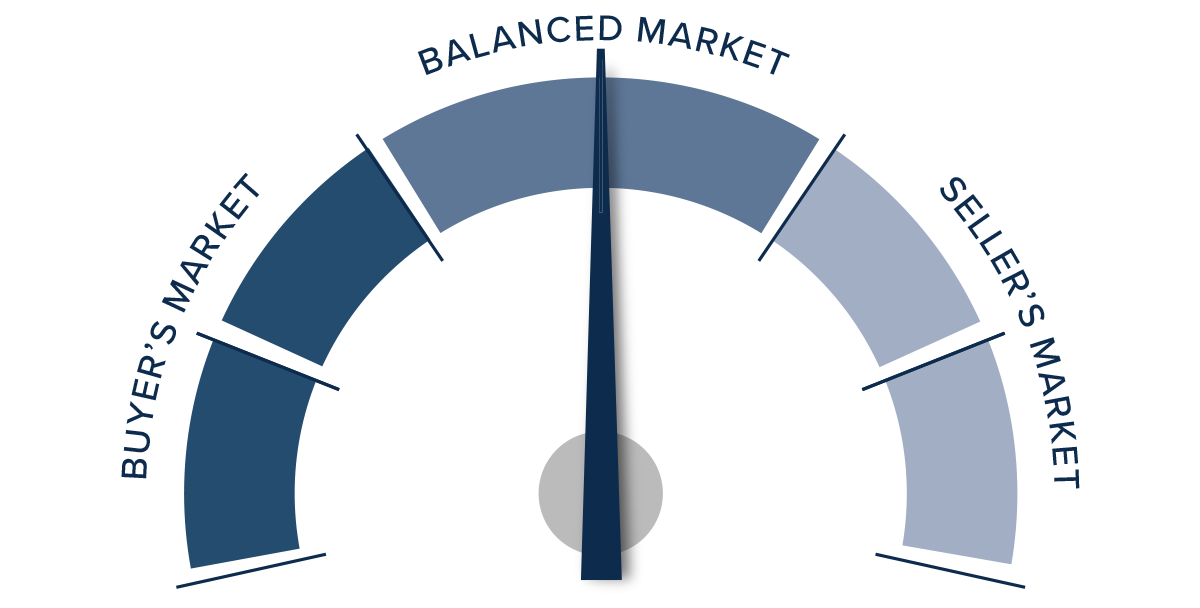
This speedometer reflects the state of the region’s real estate market using housing inventory, price gains, home sales, interest rates, and larger economic factors.

There appears to be a disconnect in the market right now. Pending and closed sales are down while listings are higher, which should favor home buyers. However, list and sale prices are higher, which typically favors sellers.

Given the rapid increases in home prices over the past two years, significantly higher mortgage rates will start impacting the market at some point. The question is when.

A speedometer graph indicating the market in Idaho for Q3 2023. The meter is directly in the middle in the “balanced market” portion in the center.

All things considered, the market favors neither buyers or sellers. As such, the needle stays in the balanced quadrant, with neither side having the upper hand.