
 Facebook
 X
X
 Pinterest
 Copy Link

The following analysis of select counties of the Southern California real estate market is provided by Windermere Real Estate Chief Economist Matthew Gardner. We hope that this information may assist you with making better-informed real estate decisions. For further information about the housing market in your area, please don’t hesitate to contact your Windermere Real Estate agent.
Regional Economic Overview
The counties covered by this report have now recovered 1.89 million of the 2.17 million jobs that were lost due to the pandemic. With only 279,000 jobs needed for a full recovery, it is likely that the region will break above the pre-pandemic employment level by sometime this summer. Of note is that both Riverside and San Bernardino counties have already seen a full job recovery, and current employment levels are now more than 33,000 above the pre-pandemic peak. The region’s unemployment rate in February was 4.8%, down from 9.8% a year ago. The lowest rates were in Orange (3.7%) and San Diego (4%) counties. The highest rate was again in Los Angeles County, where it was 5.4%. In all, the Southern California economy continues to recover, with the Inland Empire performing very well. Of course, the region’s performance is influenced by Los Angeles County given its size, which is still acting as a bit of a drag to the overall job recovery. Although I hope the pace of job growth here will pick up, it will be held back by a labor force that has fewer persons in it today than it did at the start of 2020.
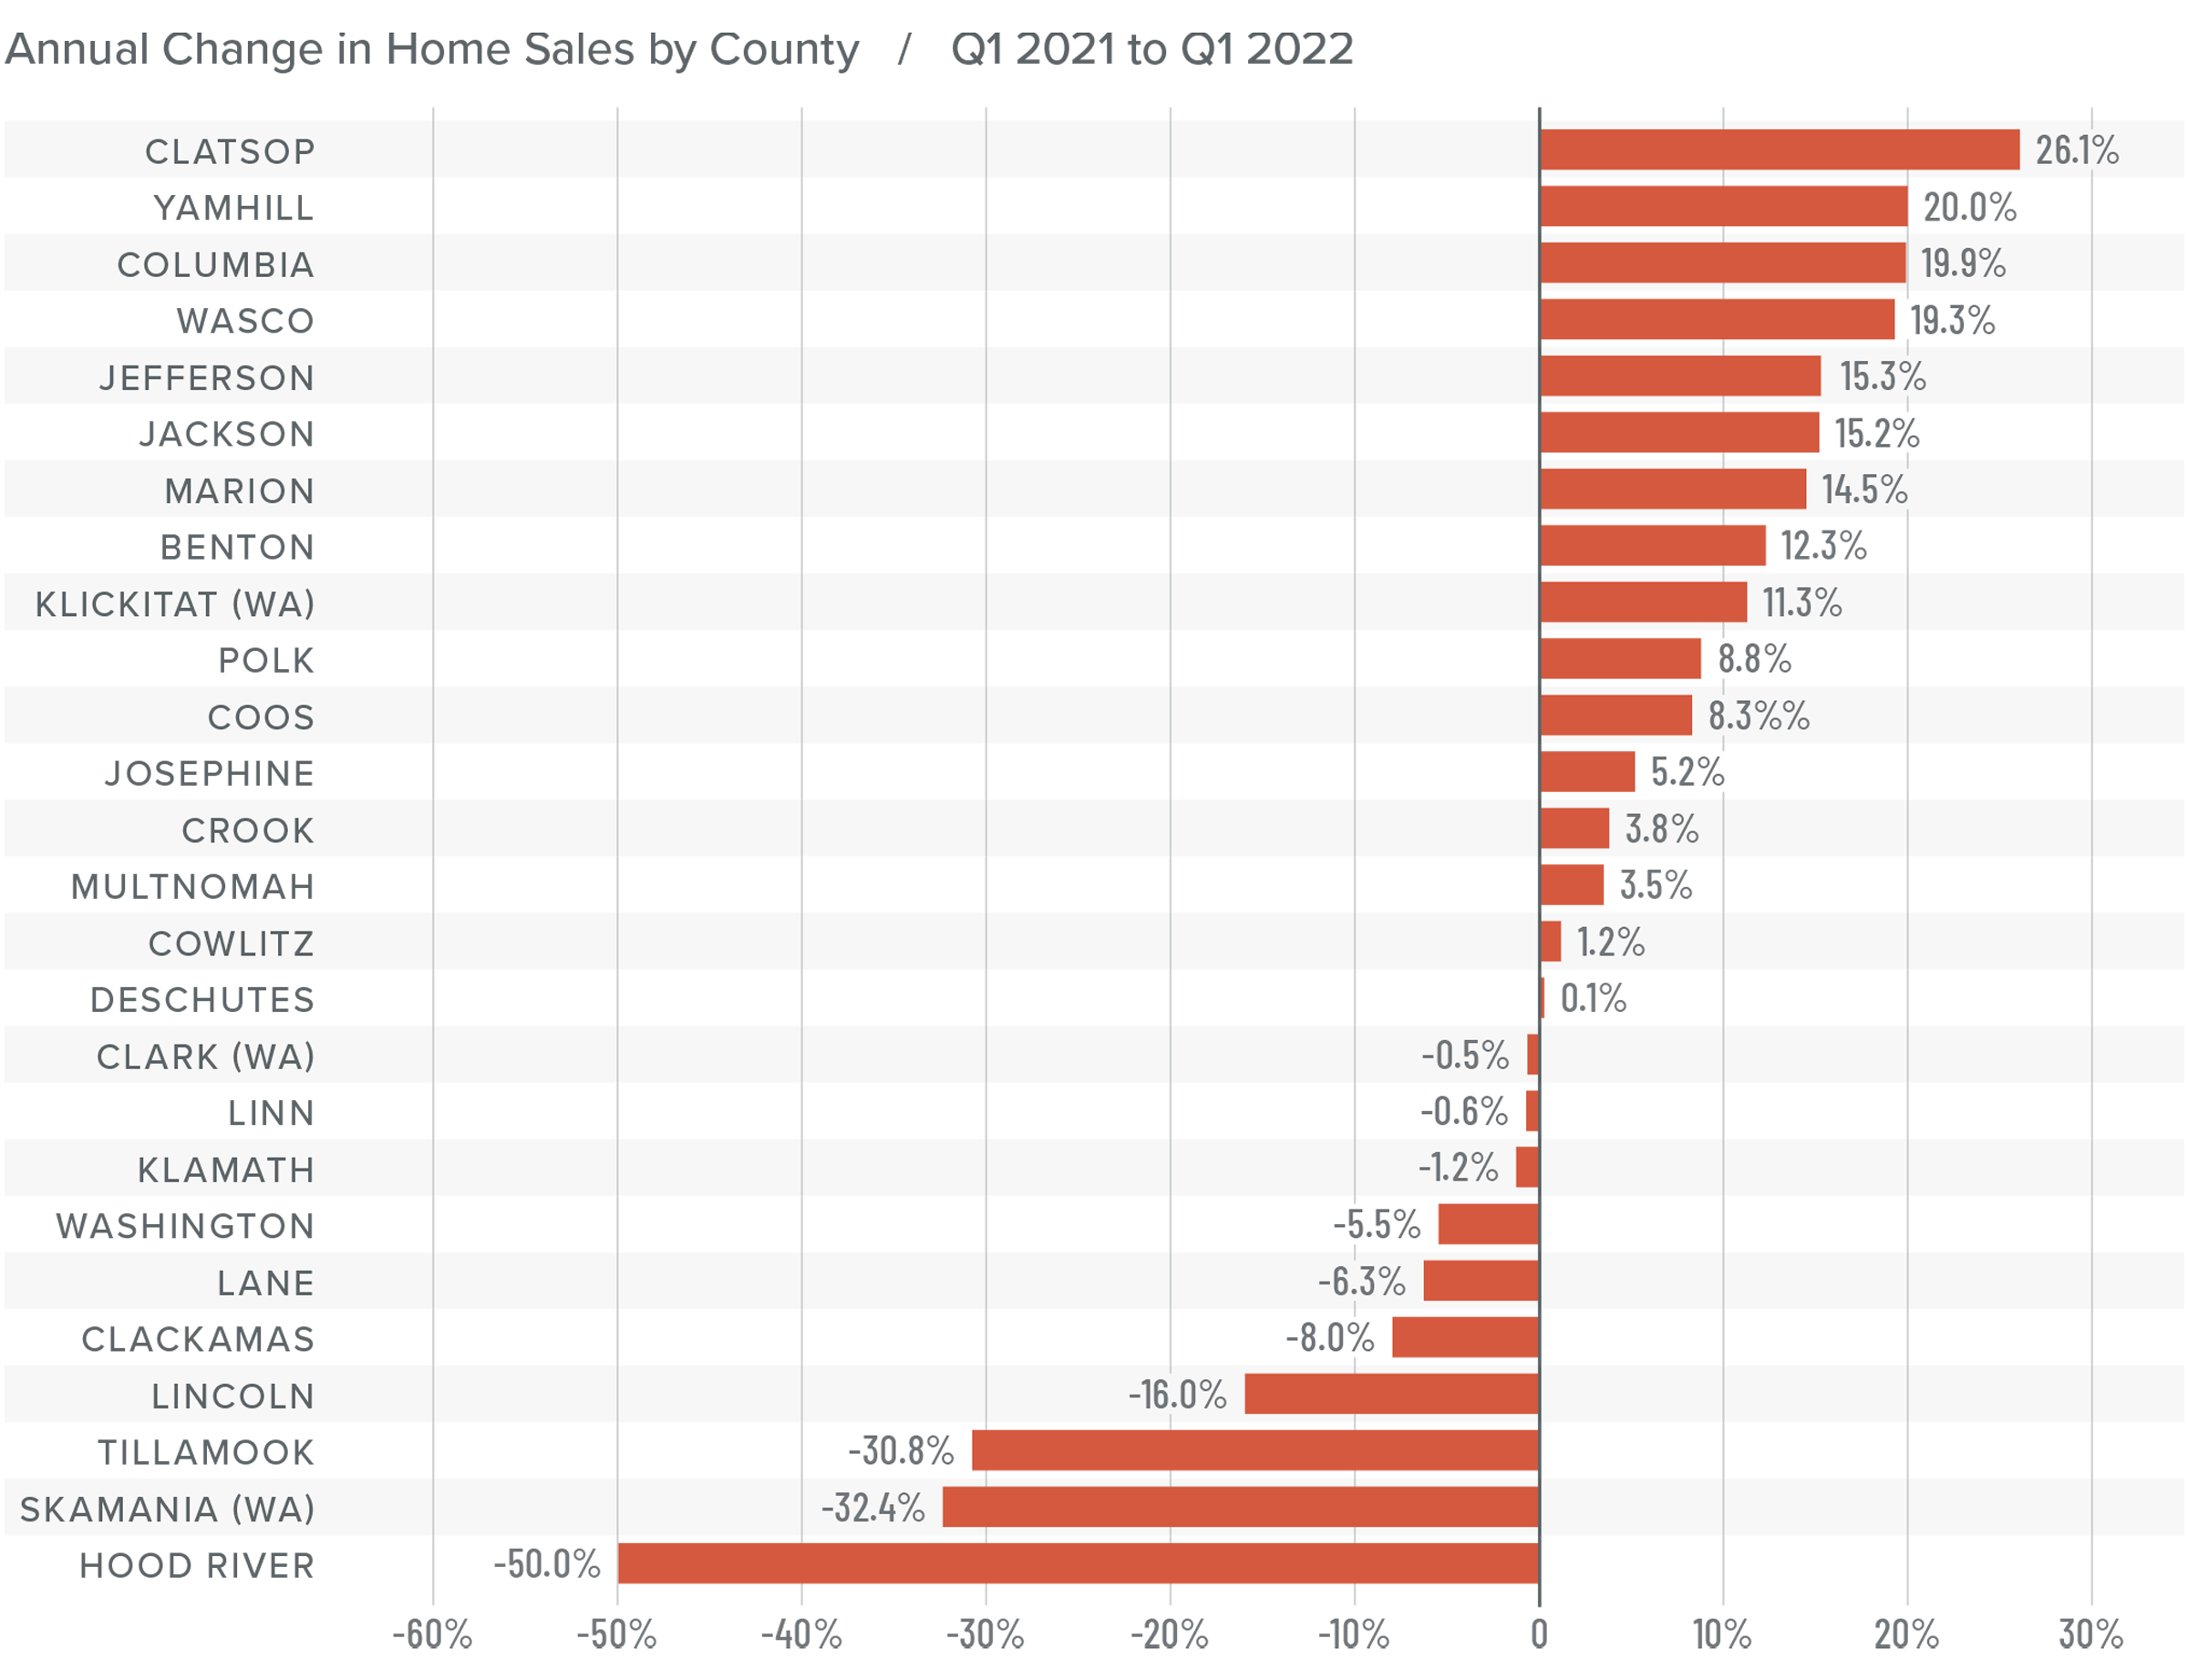
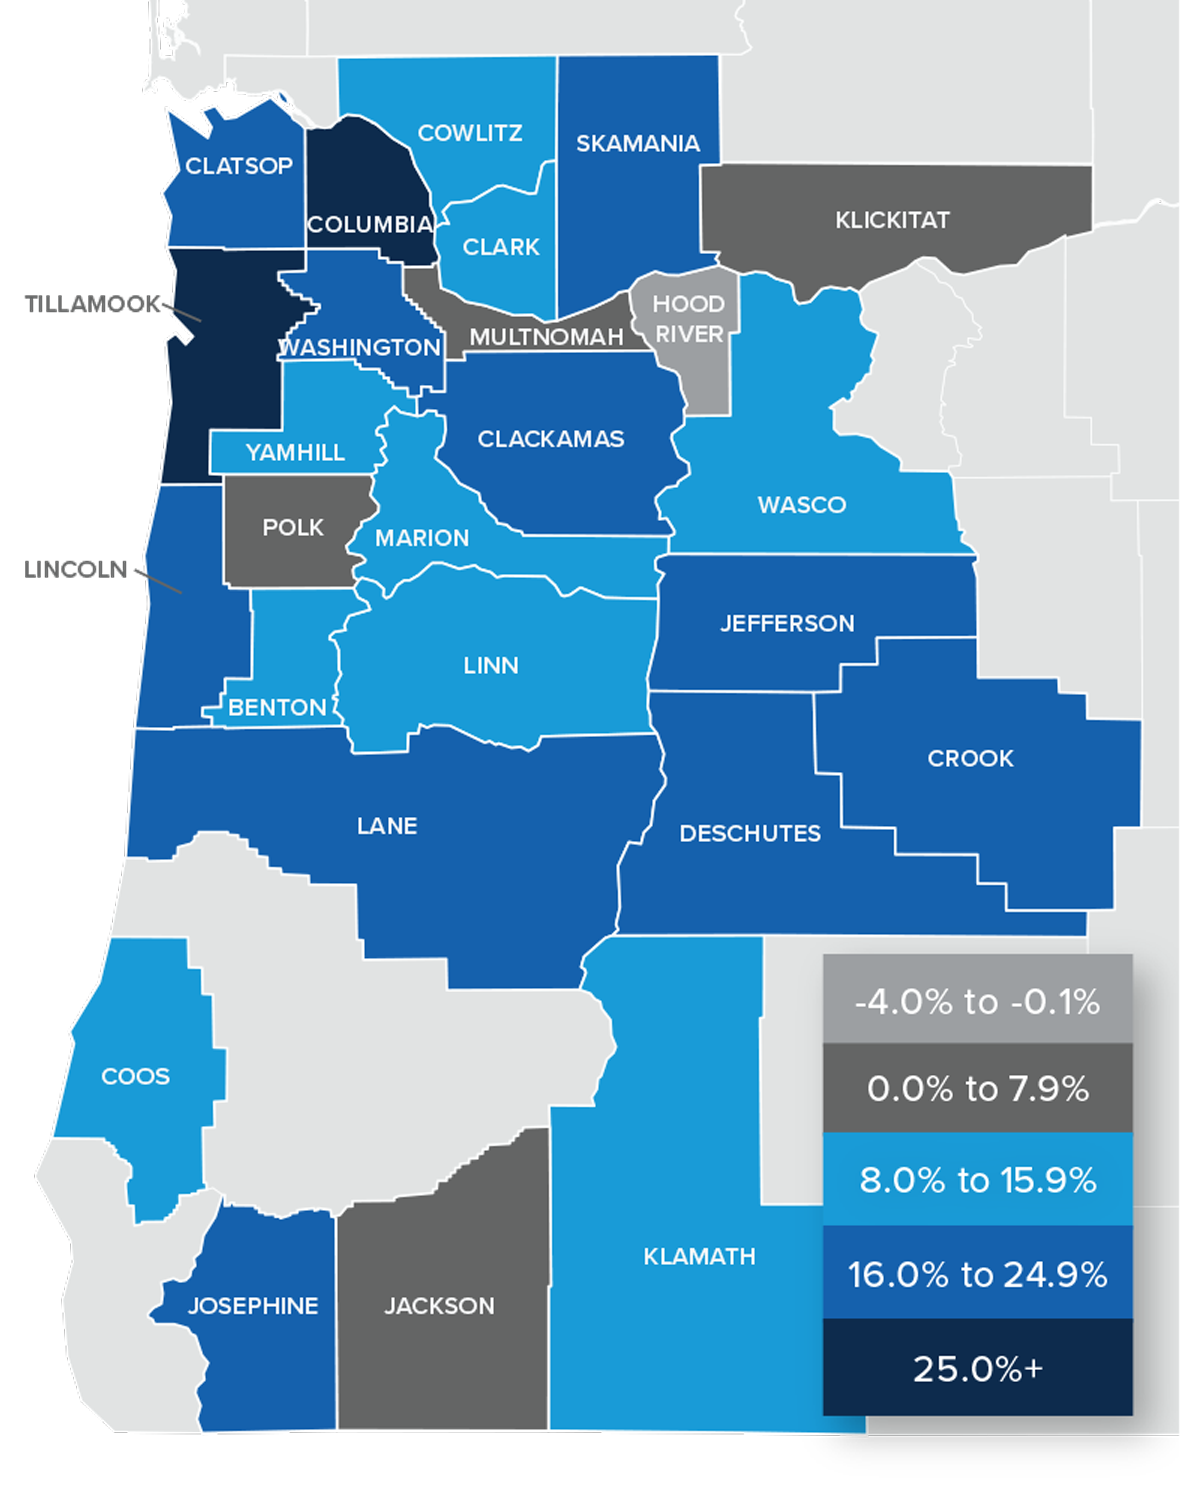
Southern California Home Sales
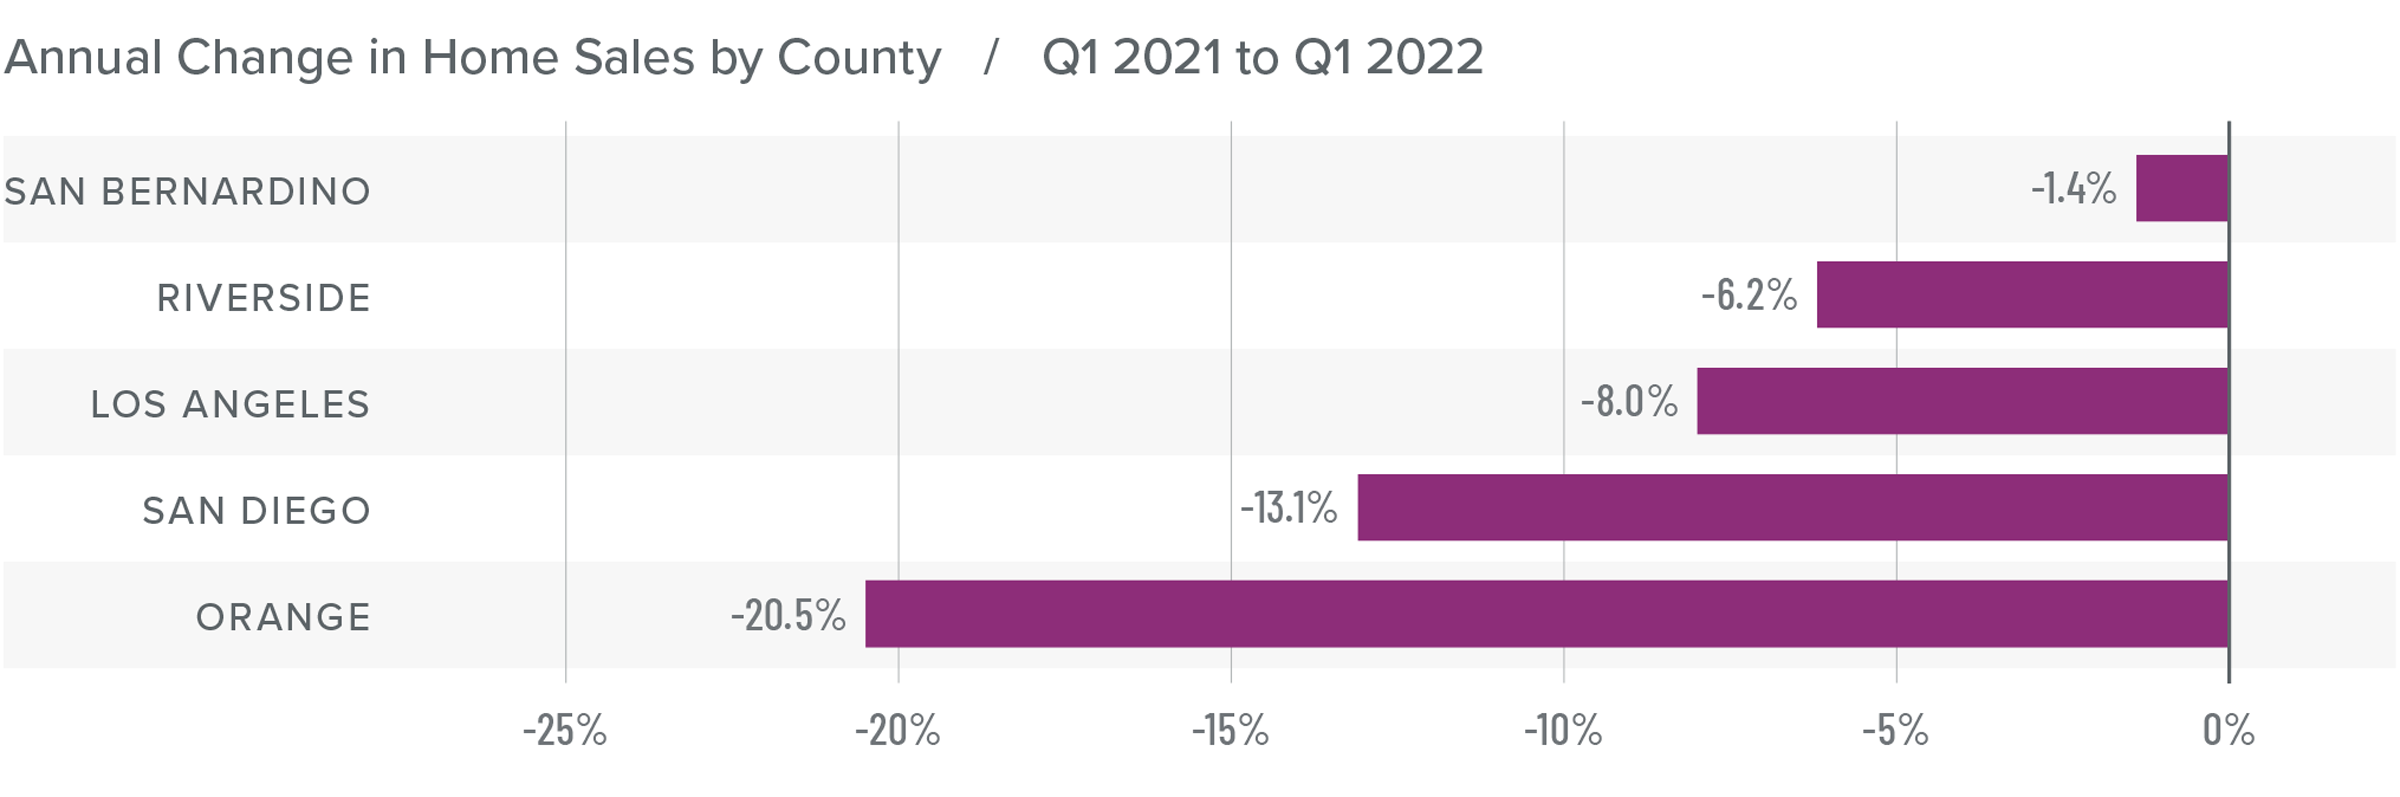
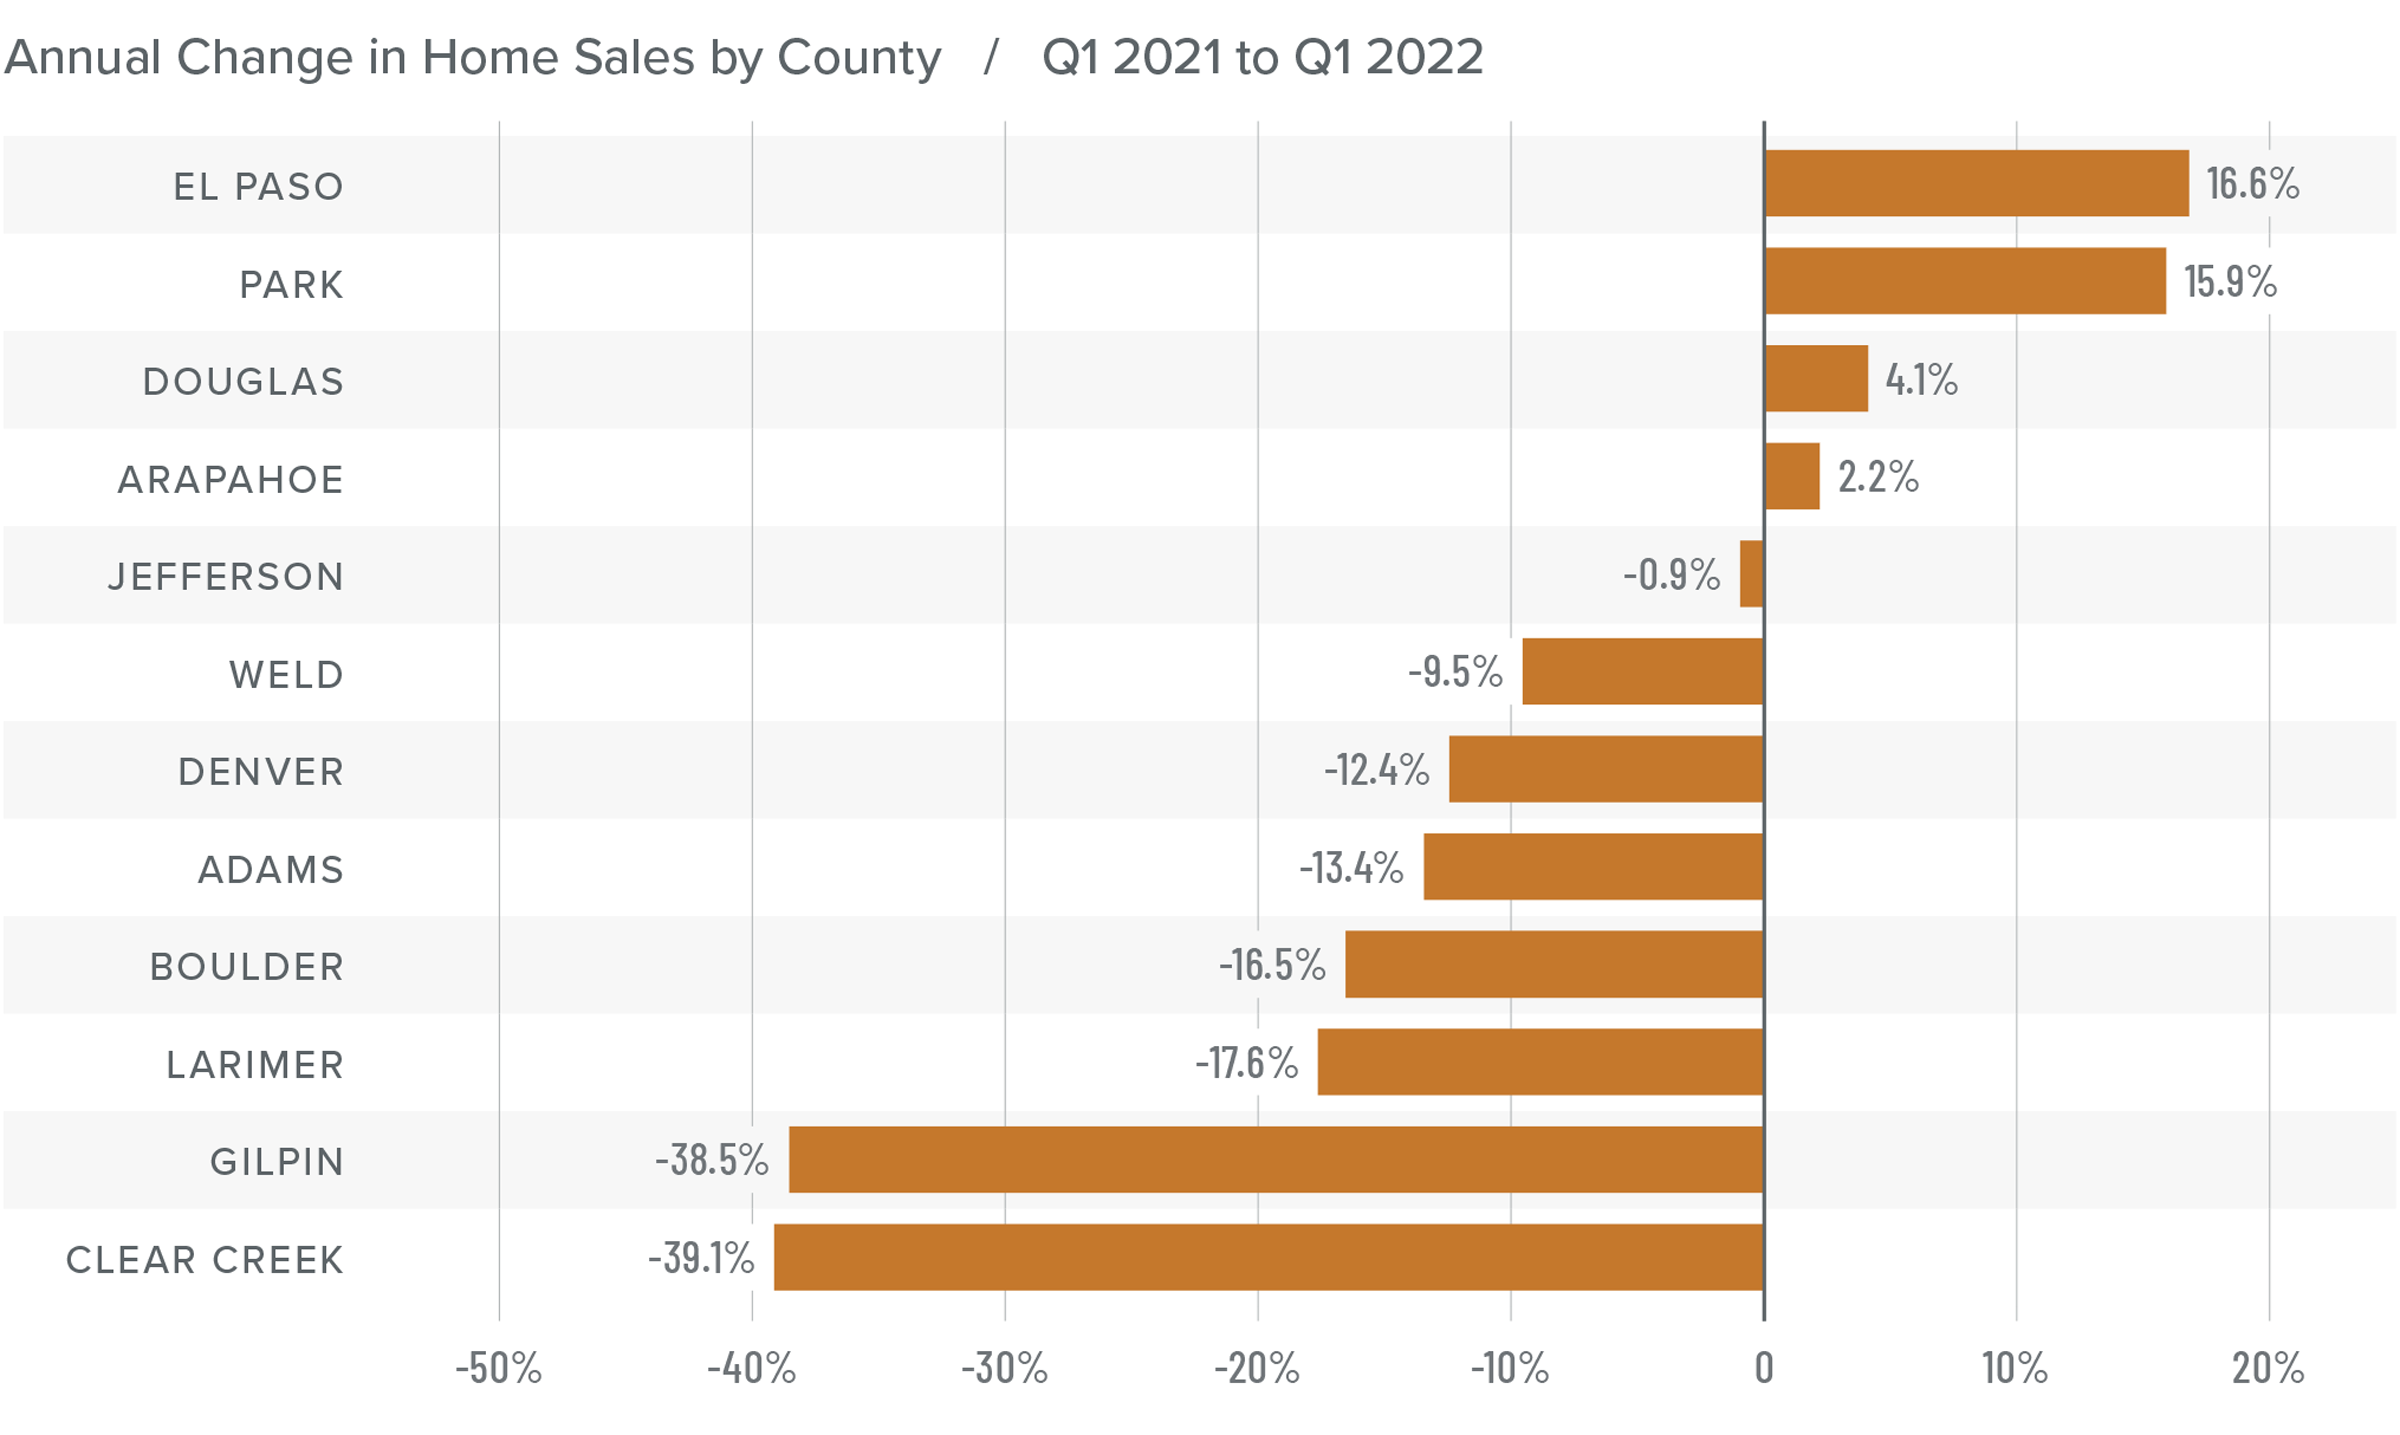
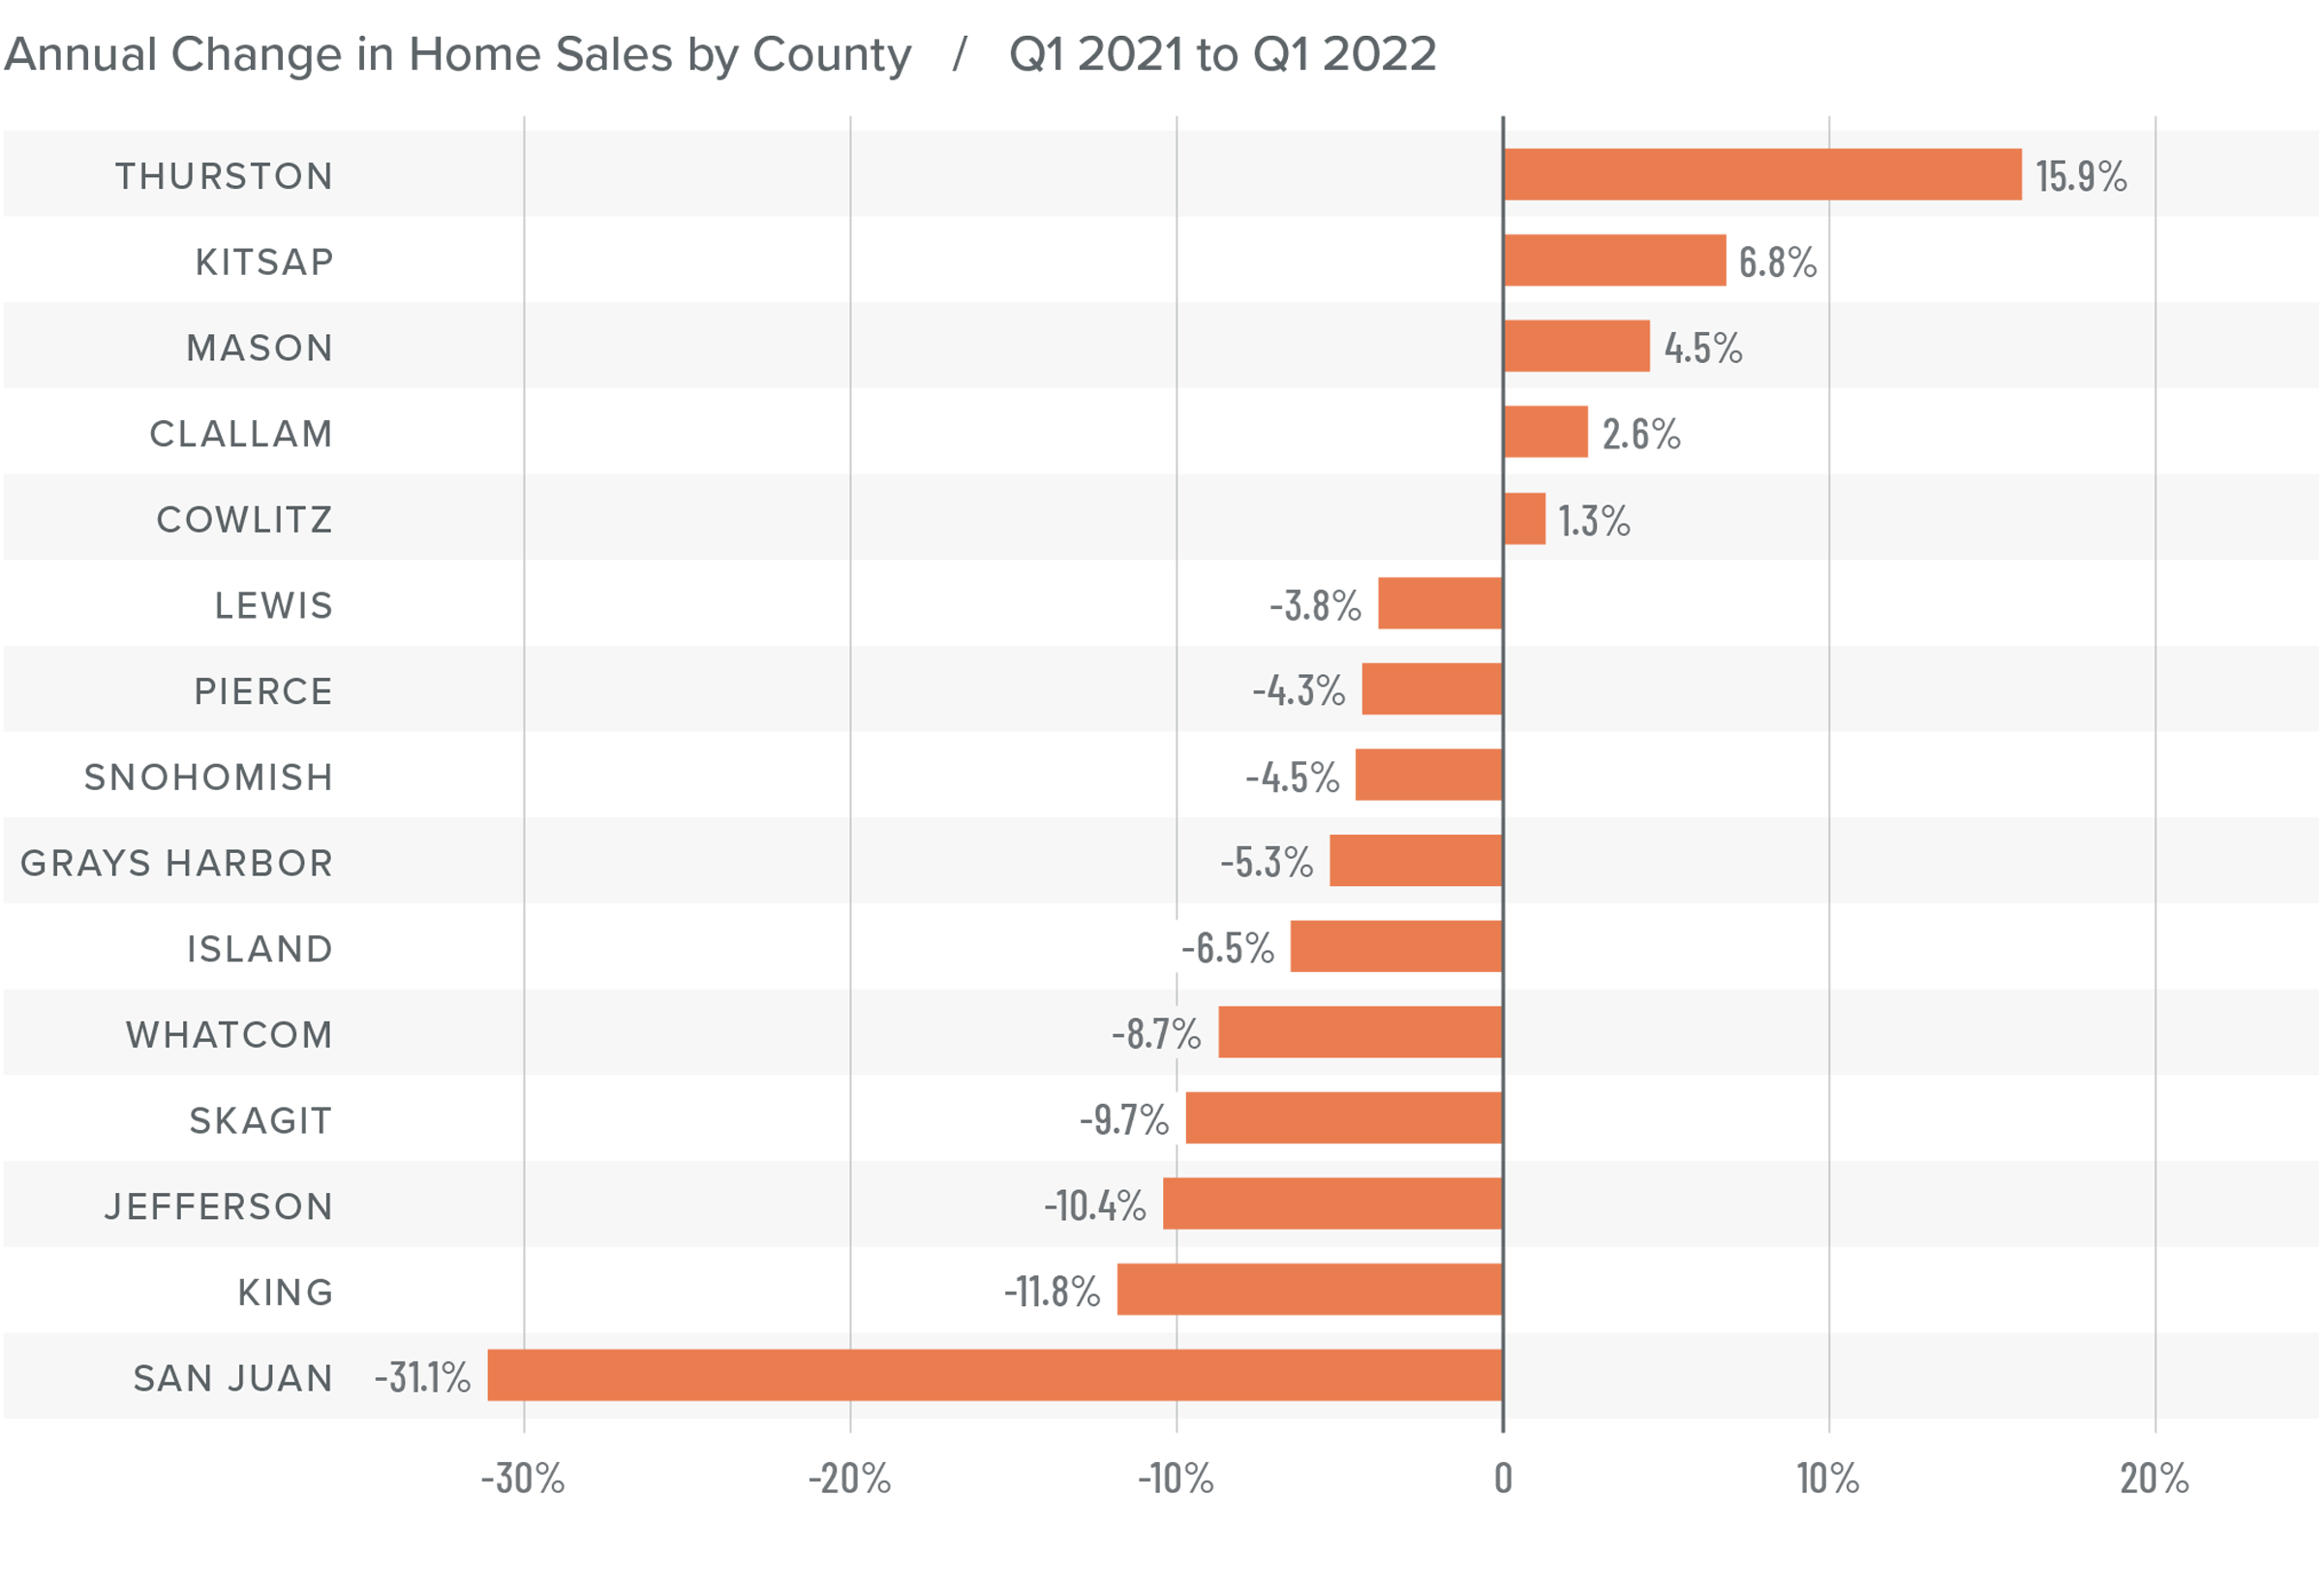
❱ In the first quarter of the year, 42,069 homes sold, which is down 9.7% from a year ago. There were 9.6% fewer sales than in the fourth quarter of 2021.
❱ Pending home sales—an indicator of future closings—rose more than 10% from the prior quarter, suggesting that sales activity in the spring may pick back up.
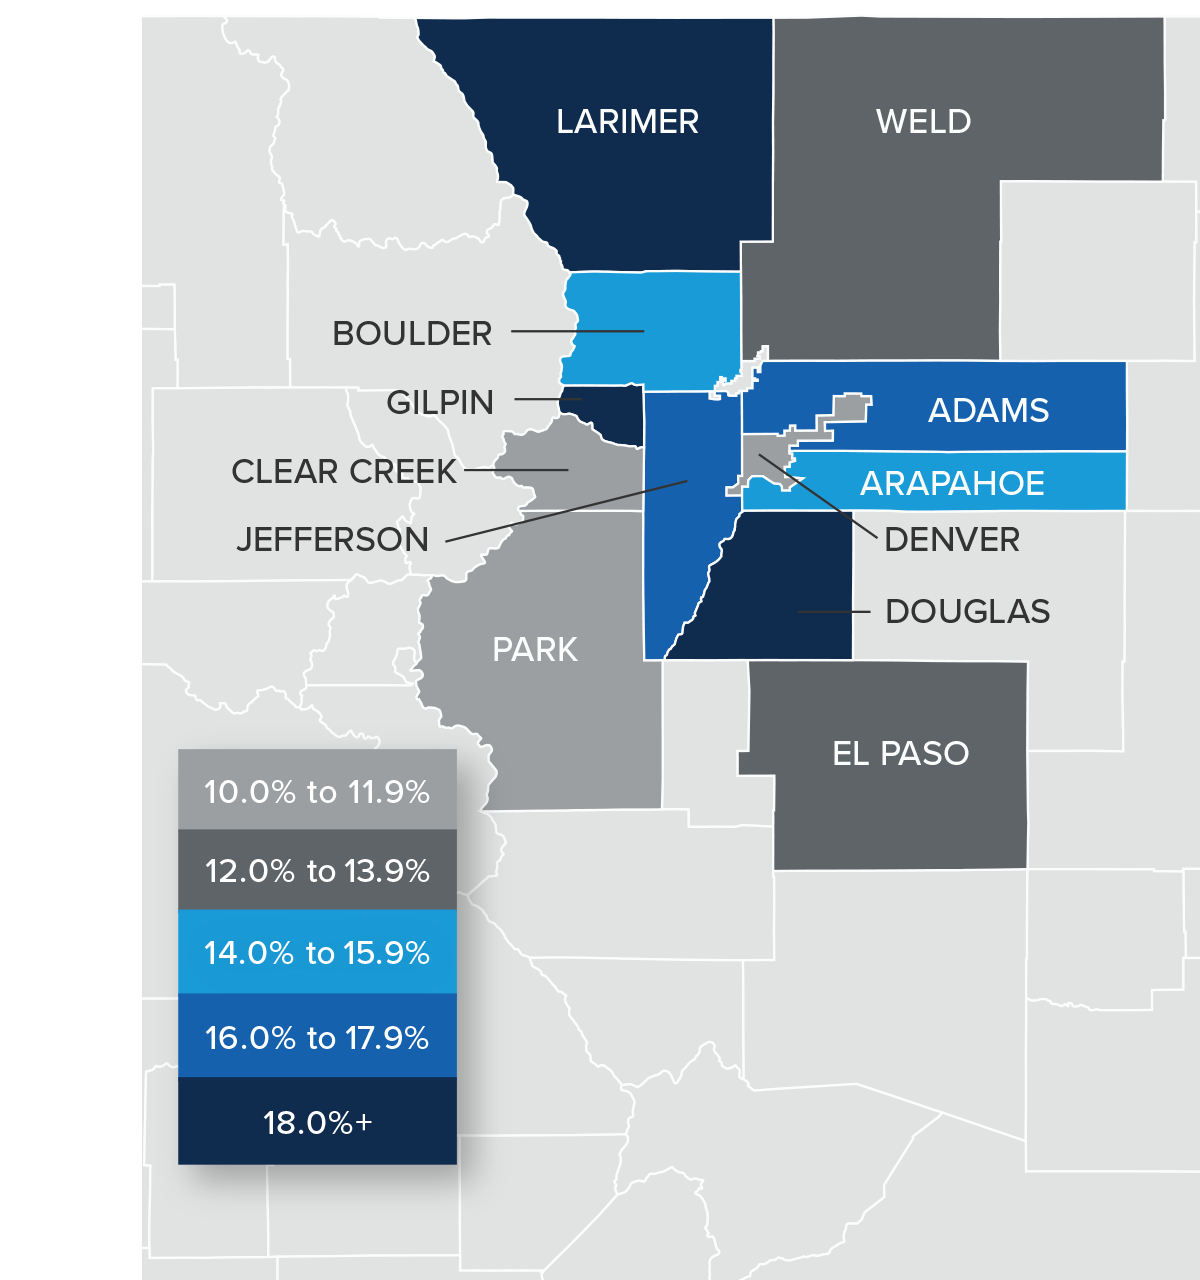
❱ The most significant decreases in sales were in Orange and San Diego counties, but all markets fell. Significant supply-side issues persist as listing activity was down more than 25% compared to the same period in 2021. There were 8.9% fewer homes for sale than in the fourth quarter of 2021.
❱ Buyers are looking, but choices are limited. Although listing activity has picked up in San Diego County, the other markets have not seen any growth. This will hopefully change as we move through the spring, but it’s not guaranteed, and buyers will likely remain frustrated.
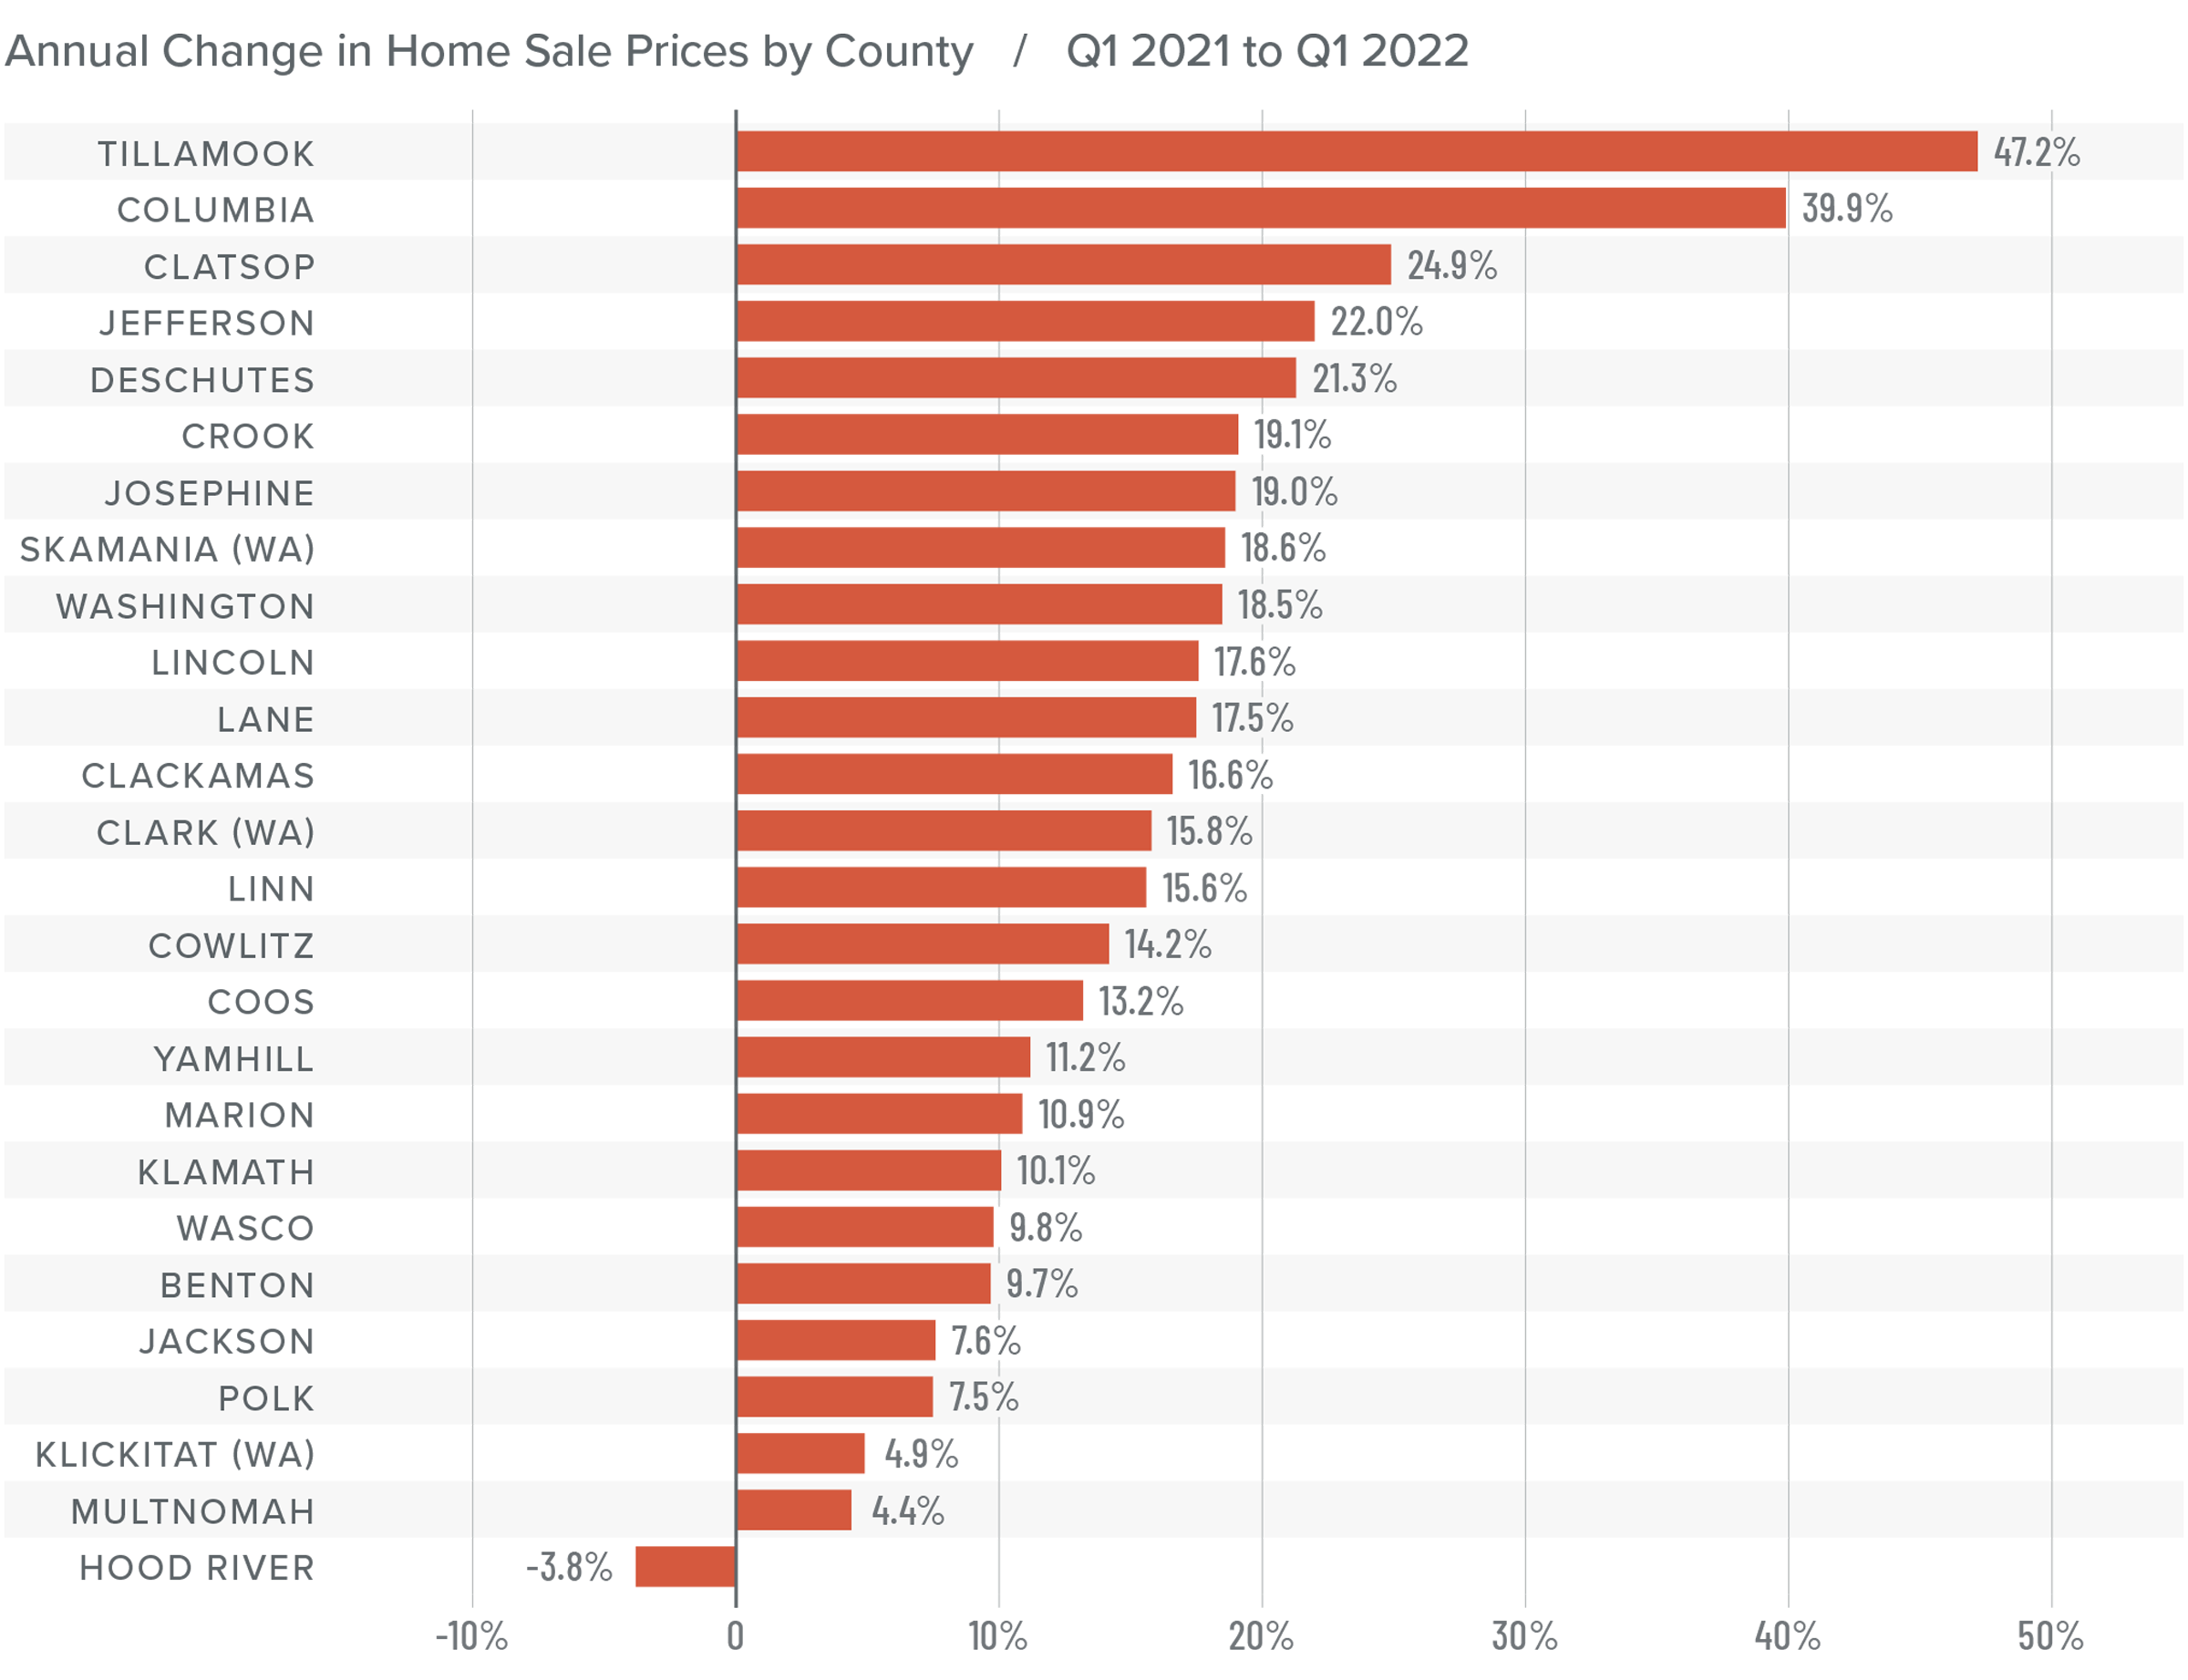
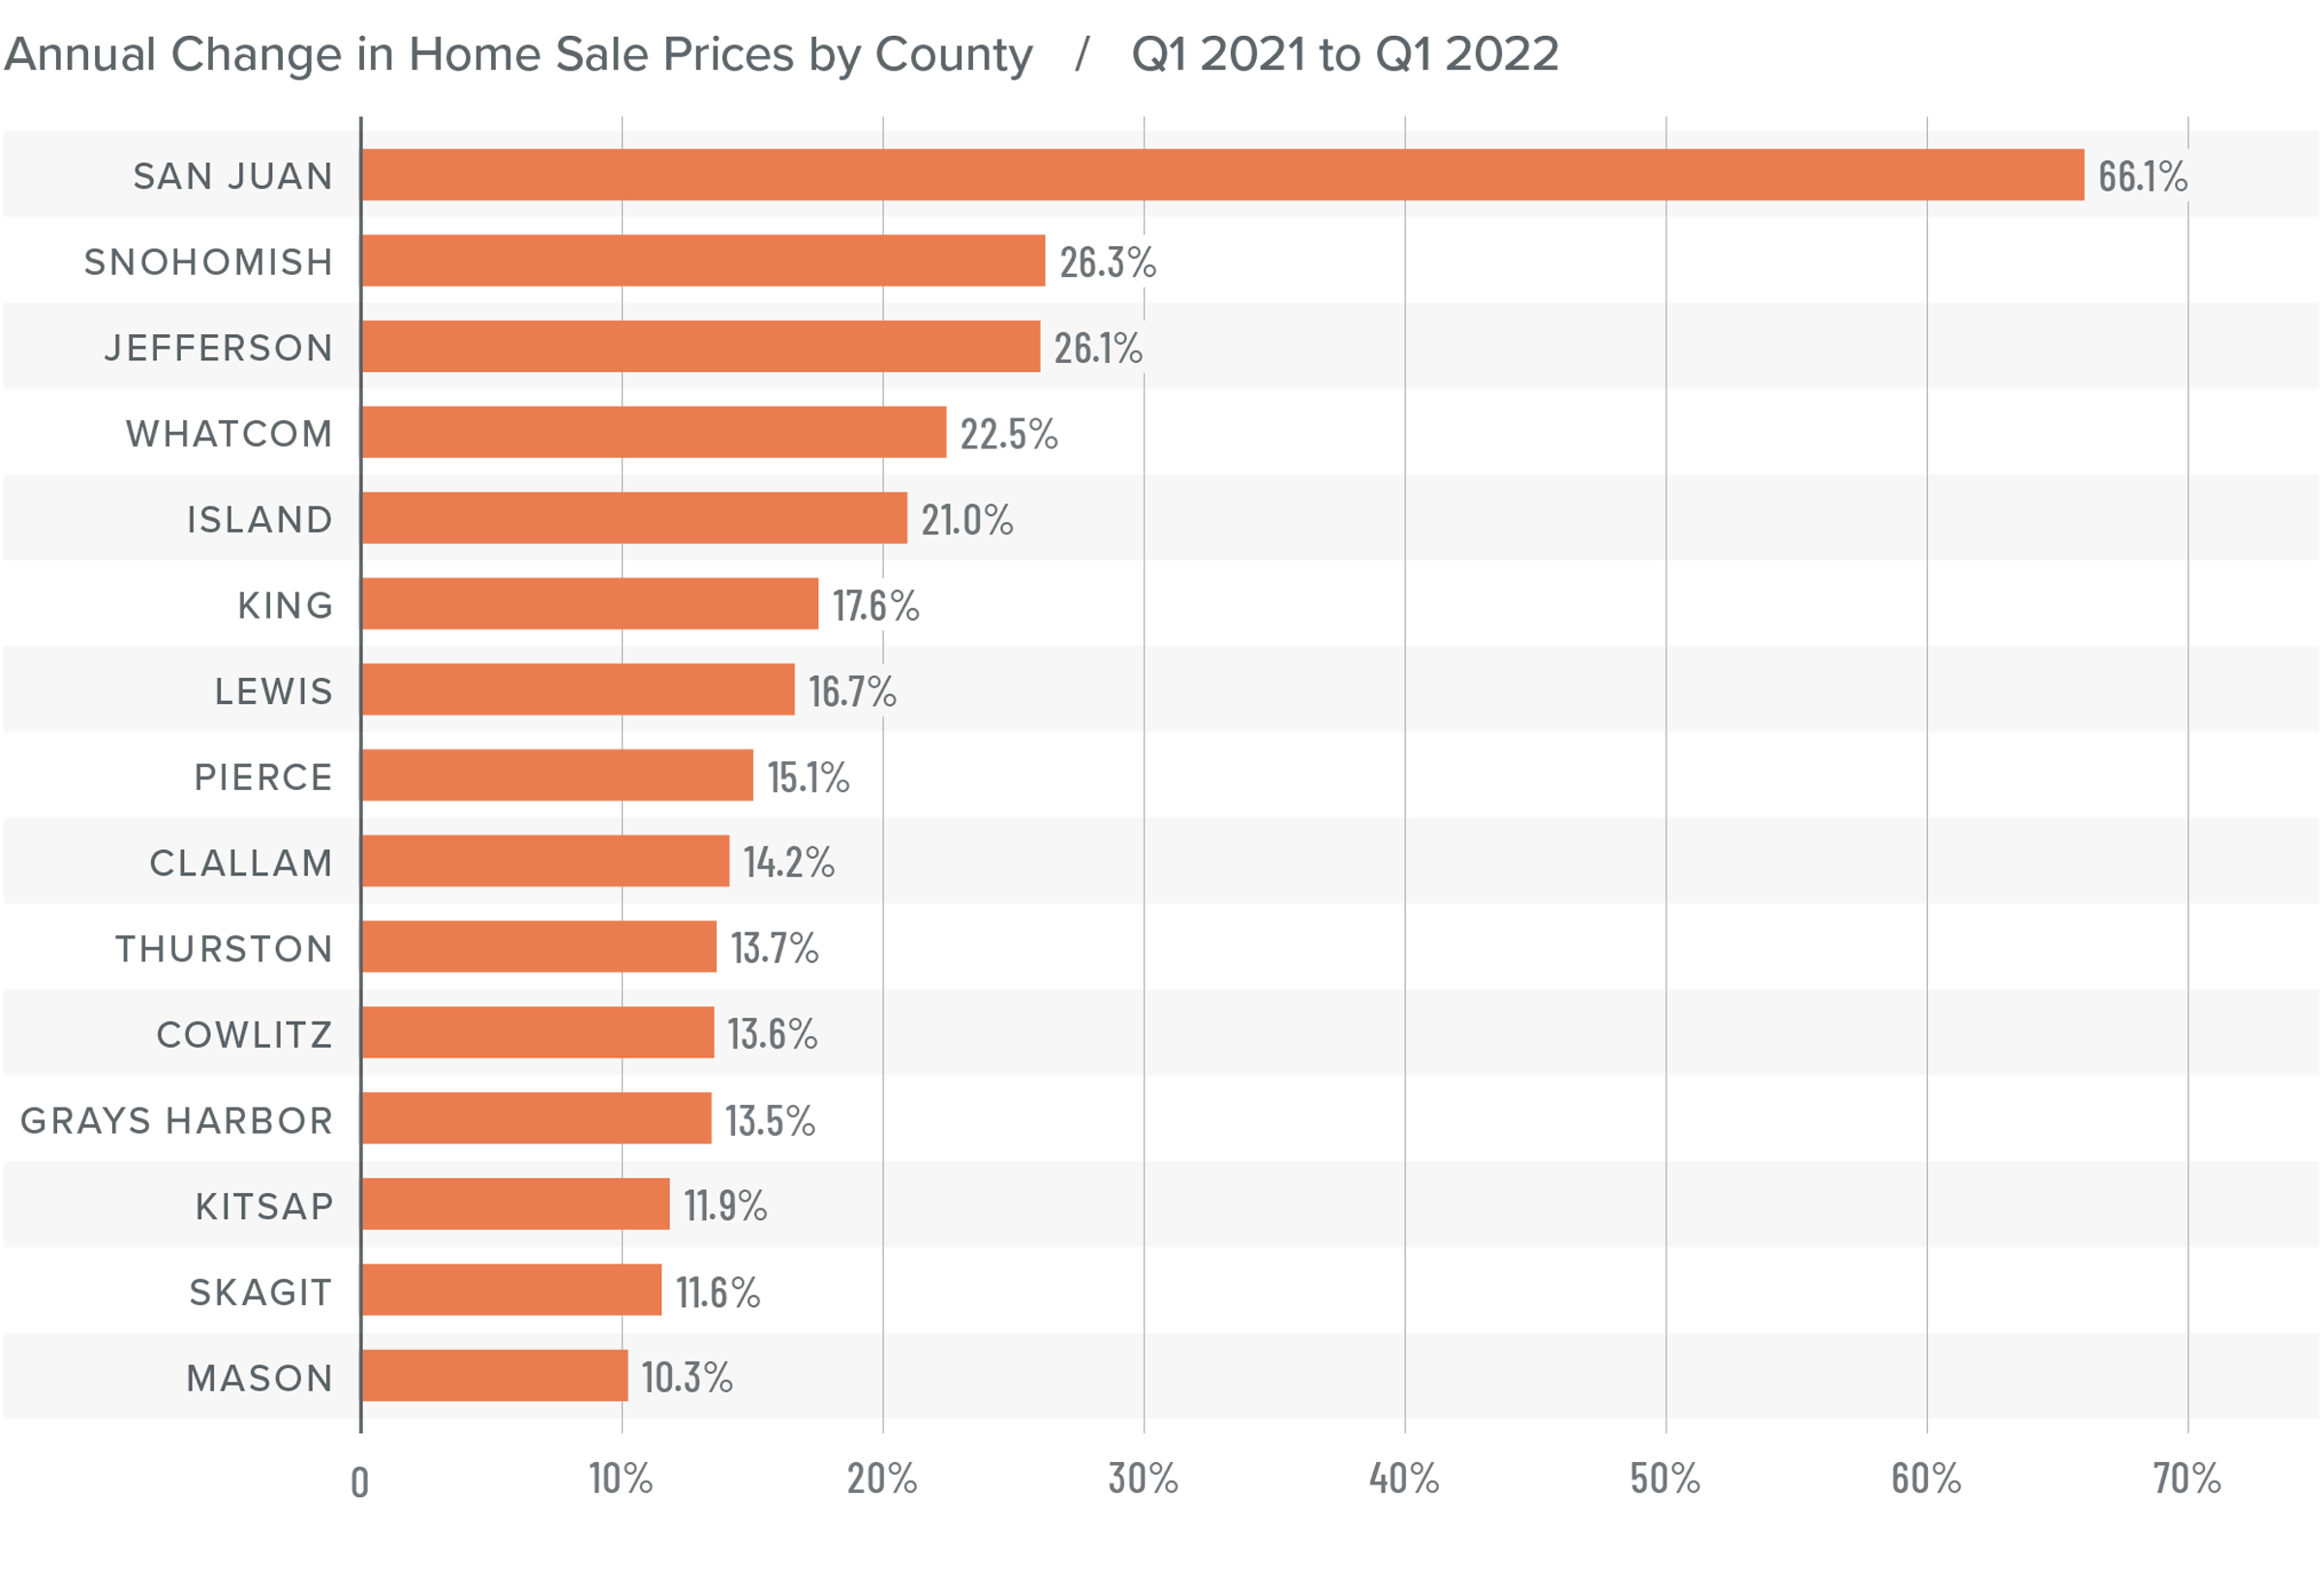
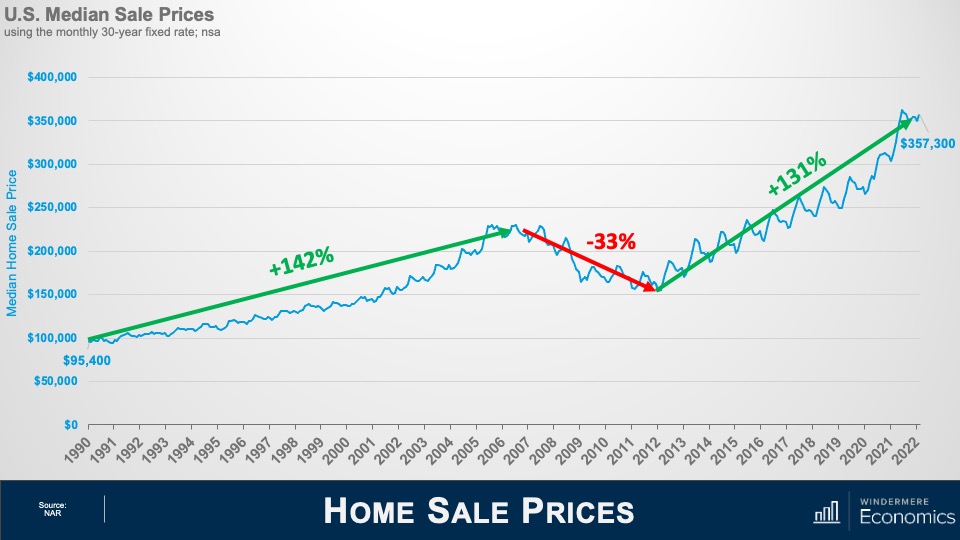
Southern California Home Prices
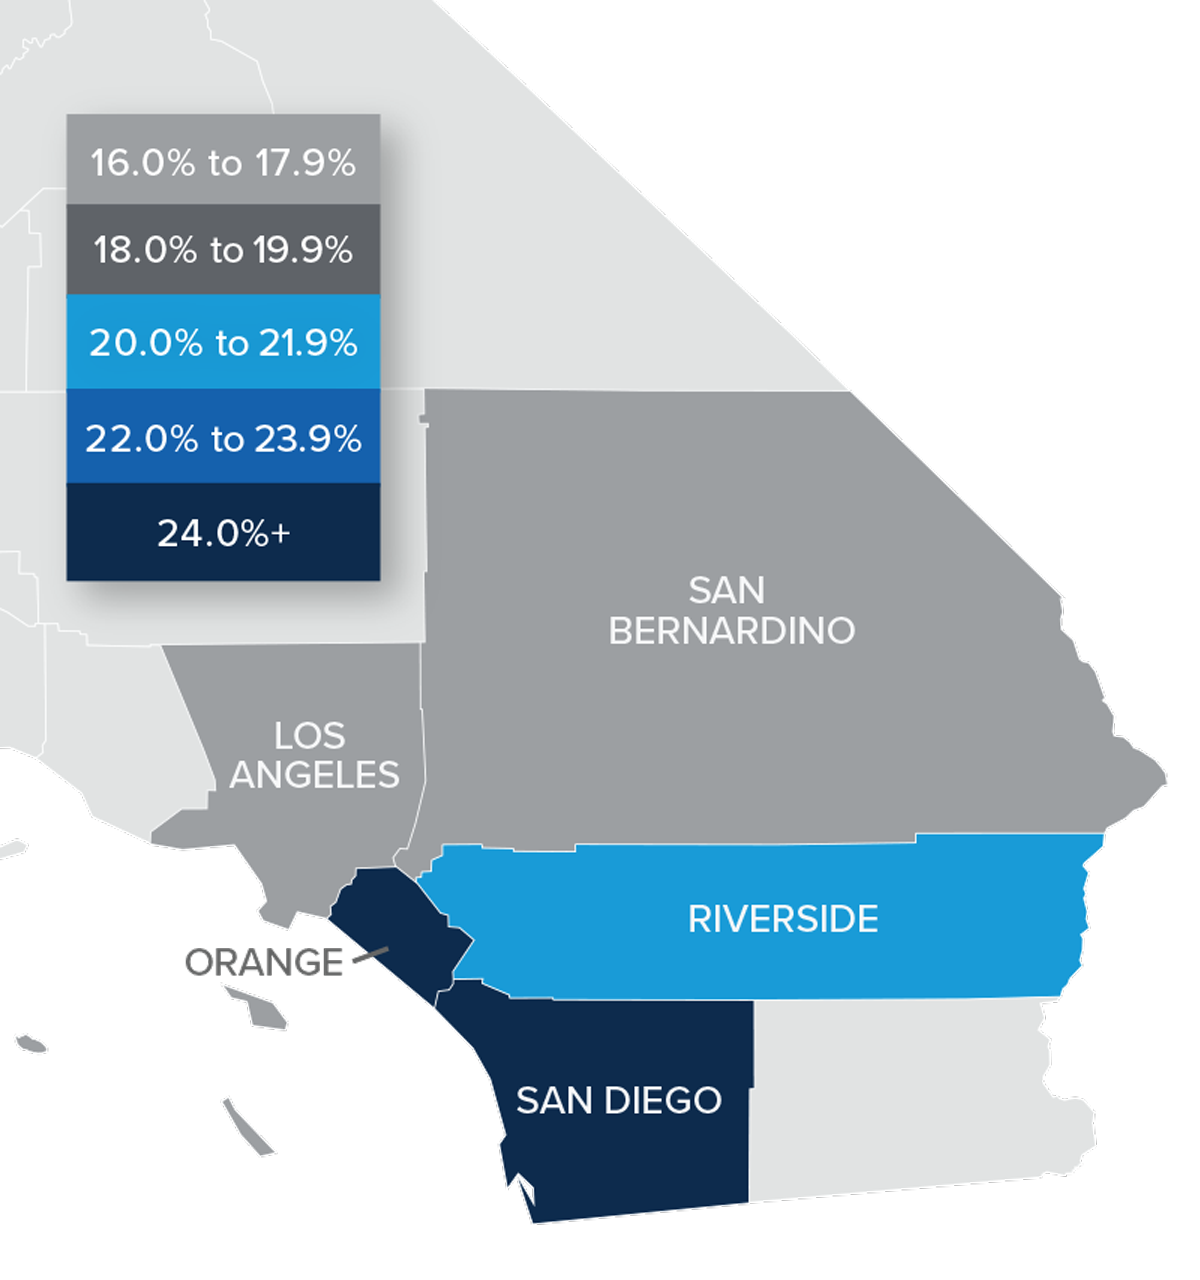
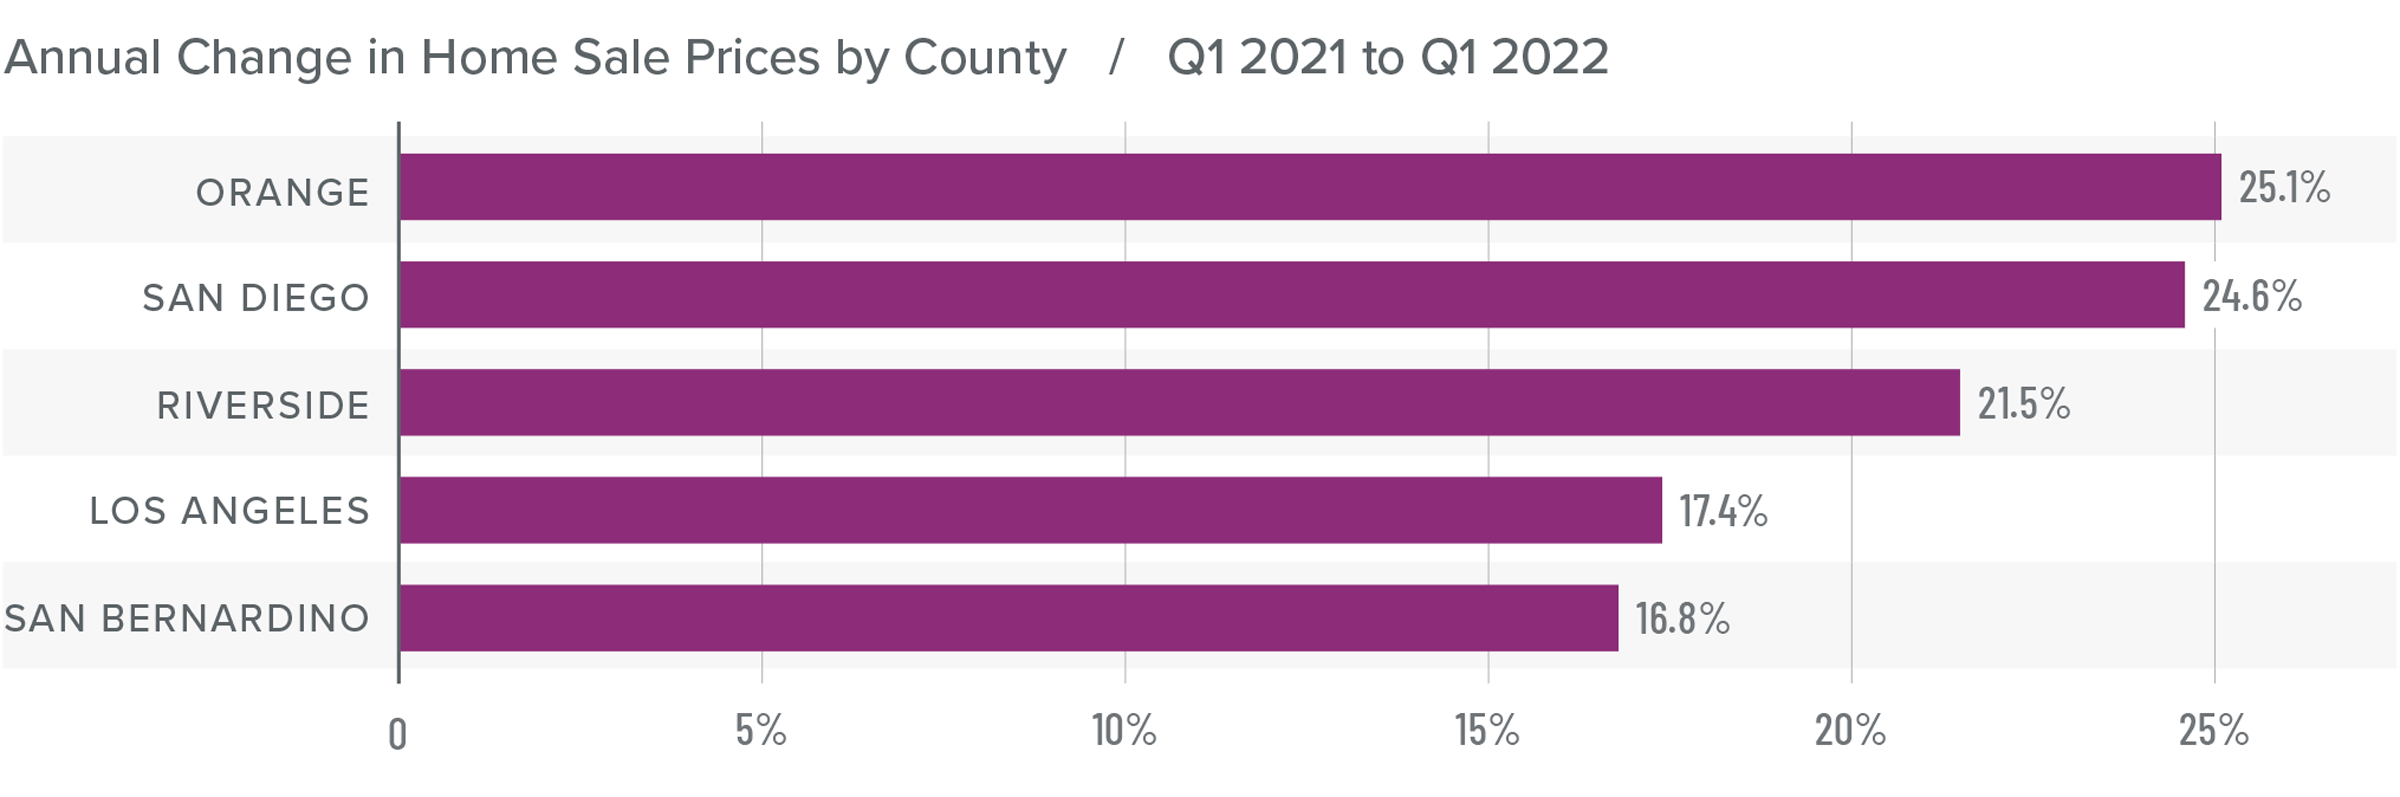
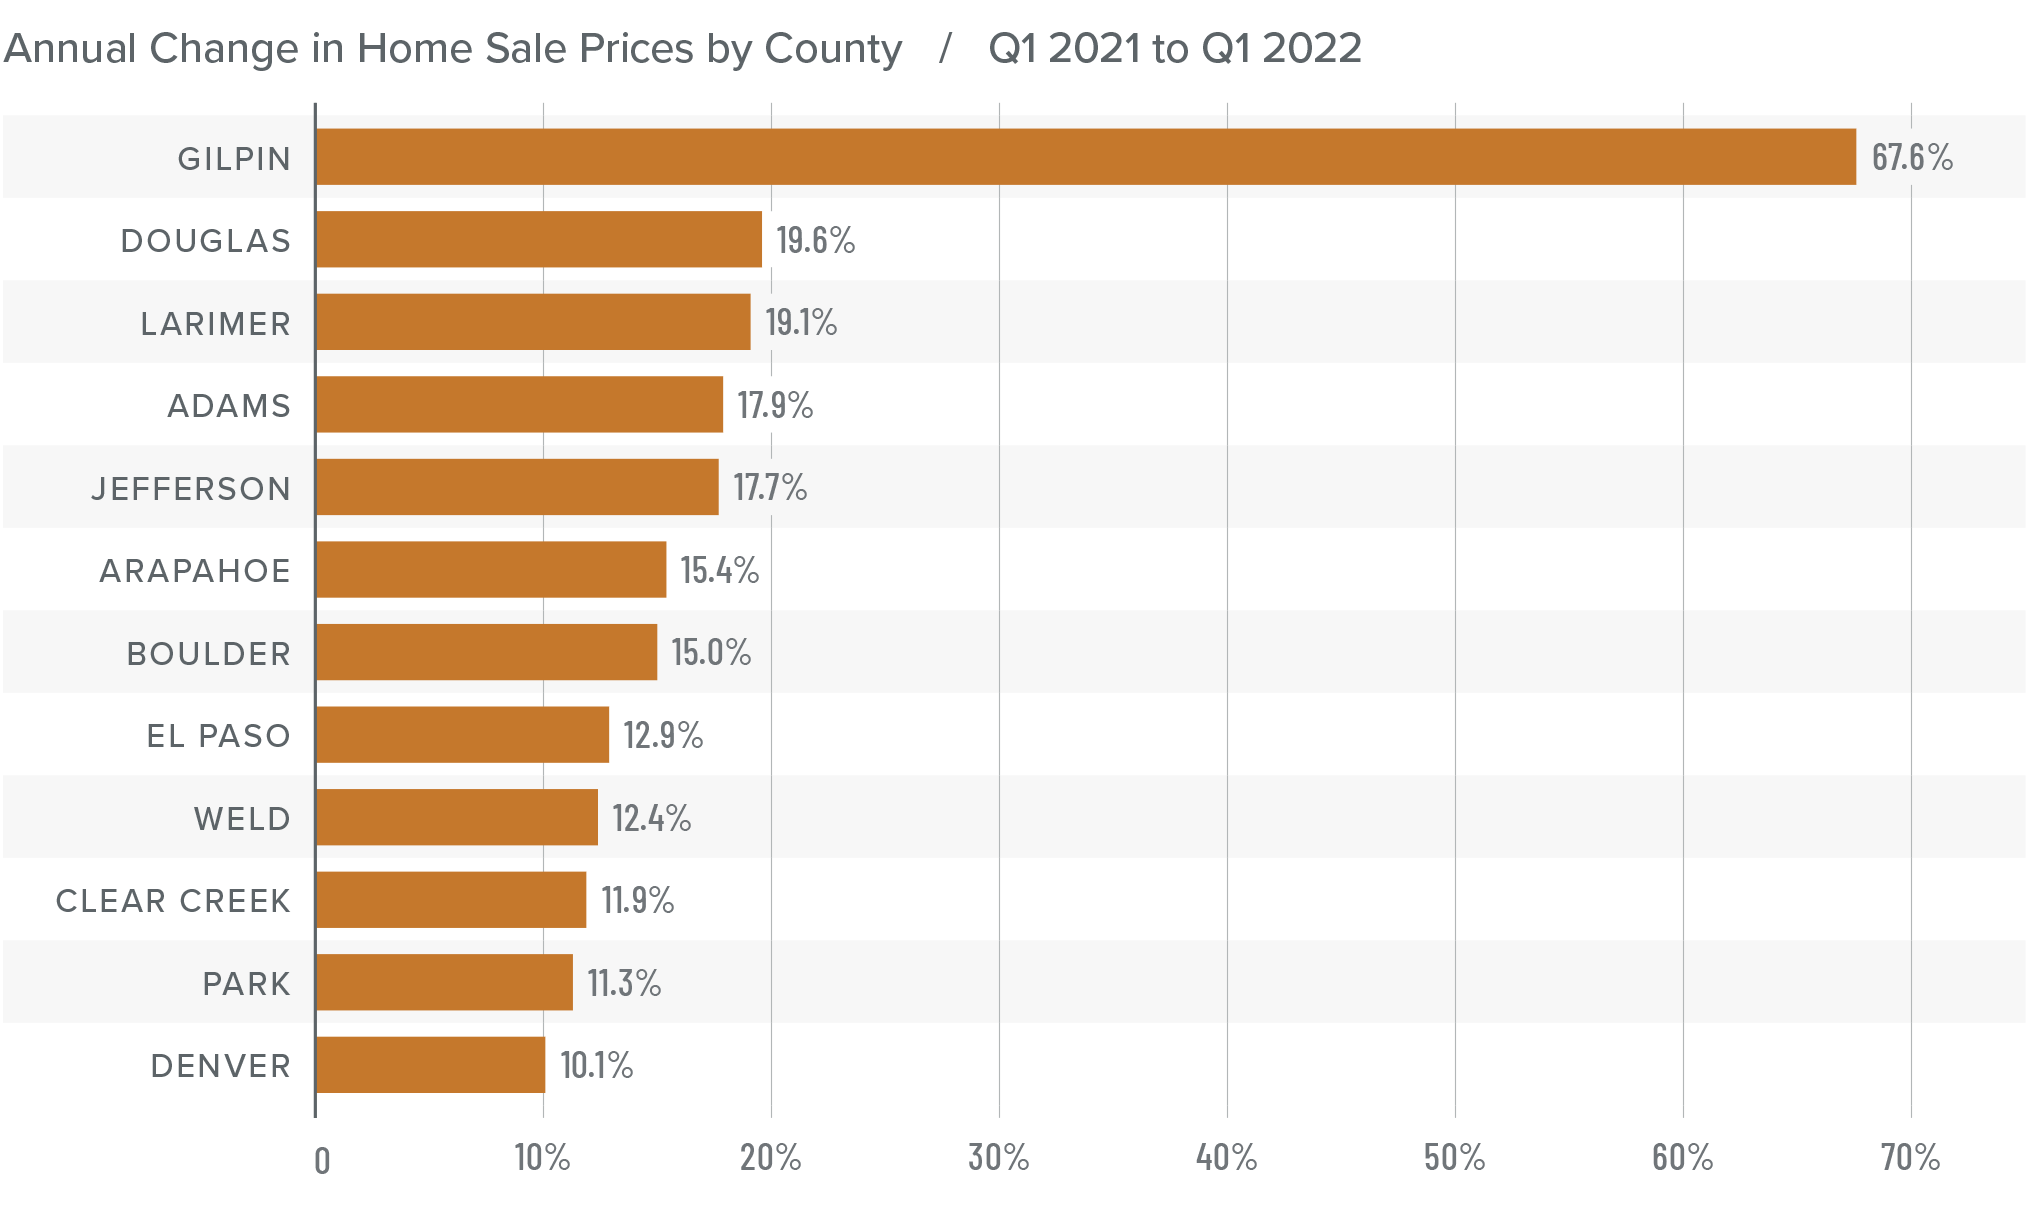
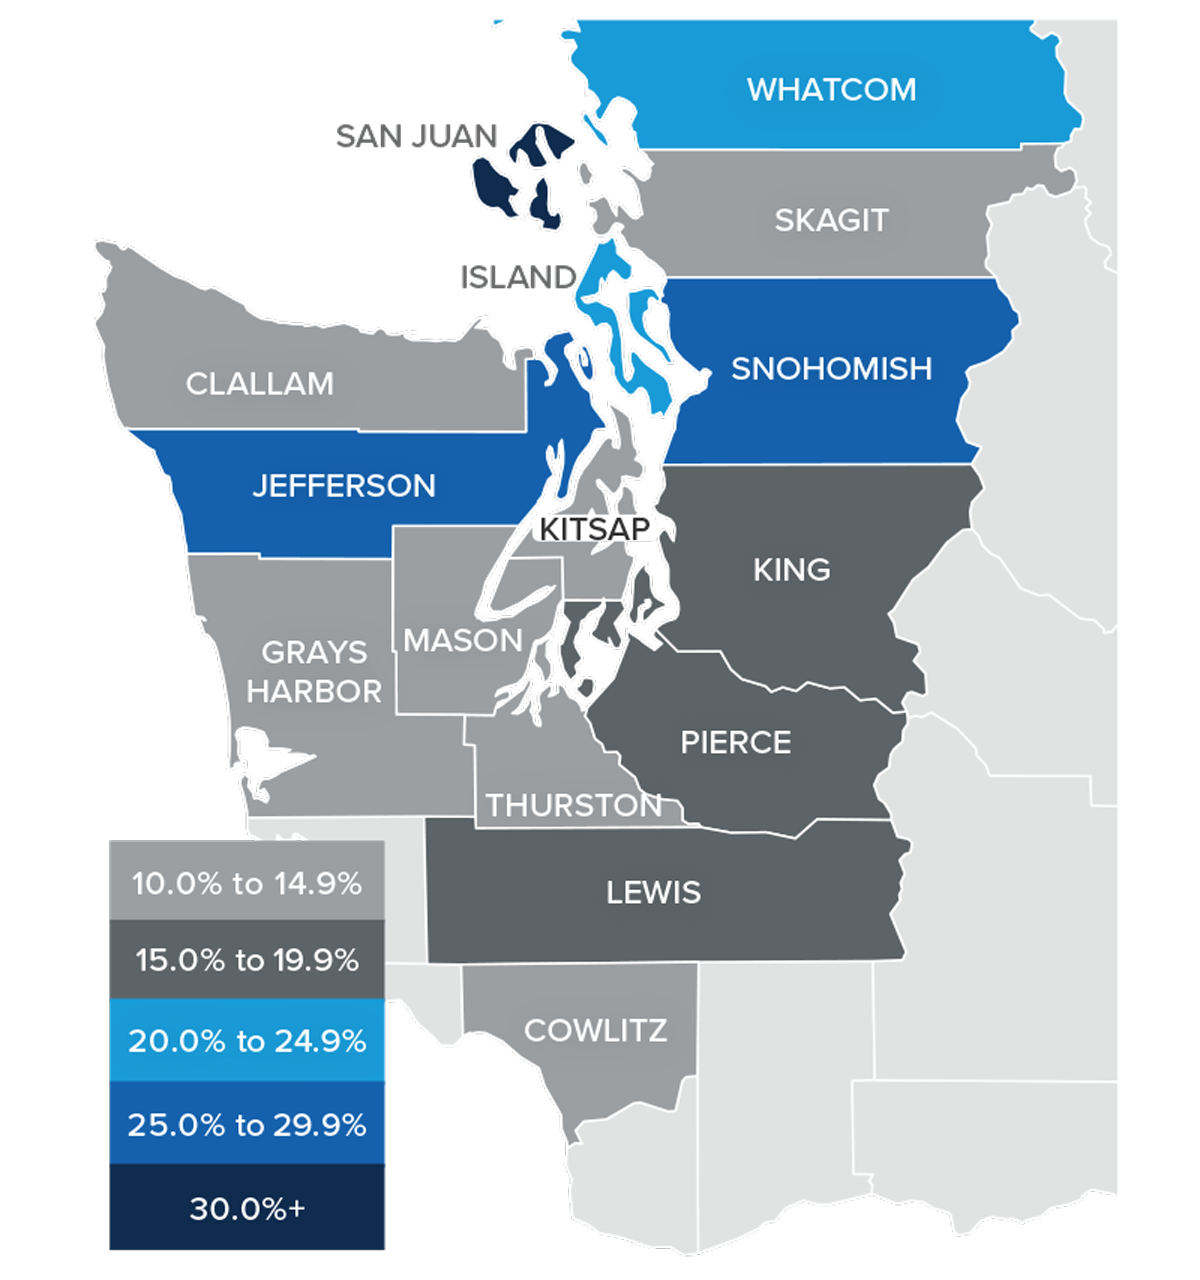
❱ Home prices in the first quarter rose 19.1% compared to a year ago and were 4.2% higher than in the fourth quarter of 2021.
❱ It appears as if the spike in mortgage rates during the first quarter has not dampened the market and, with more buyers than sellers, the market is still extremely hot.
❱ The region saw double-digit price growth across the board, with Orange County again leading the way. Of note is that home prices in Riverside County rose 10.7% compared to the prior quarter.
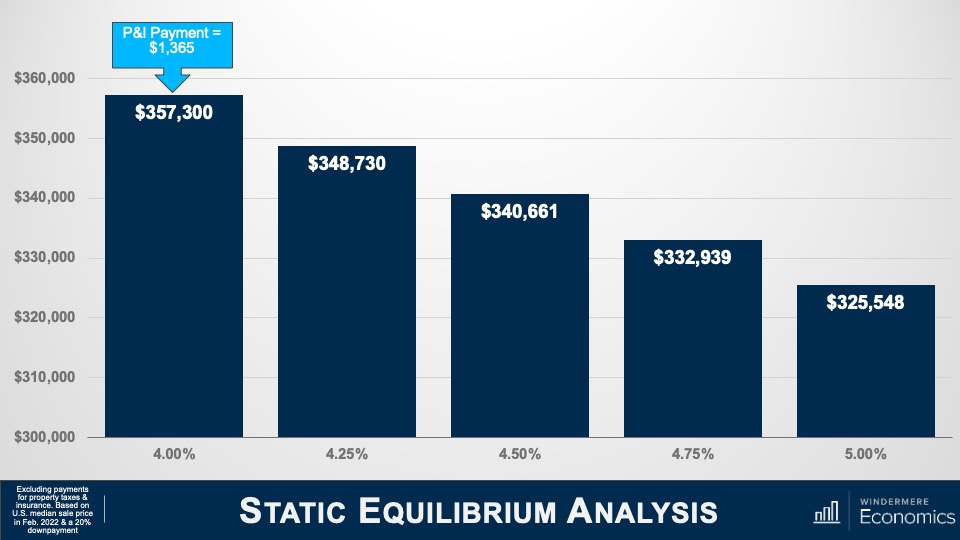
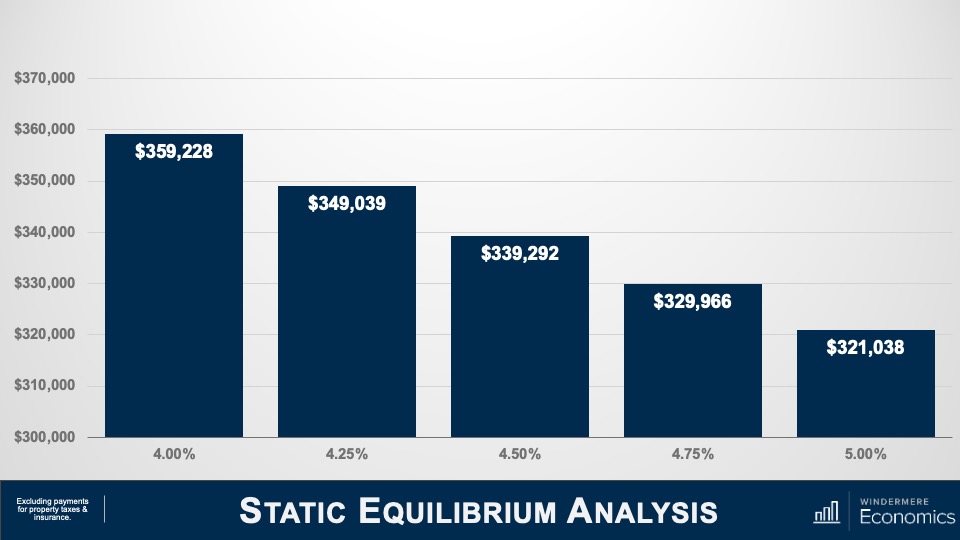
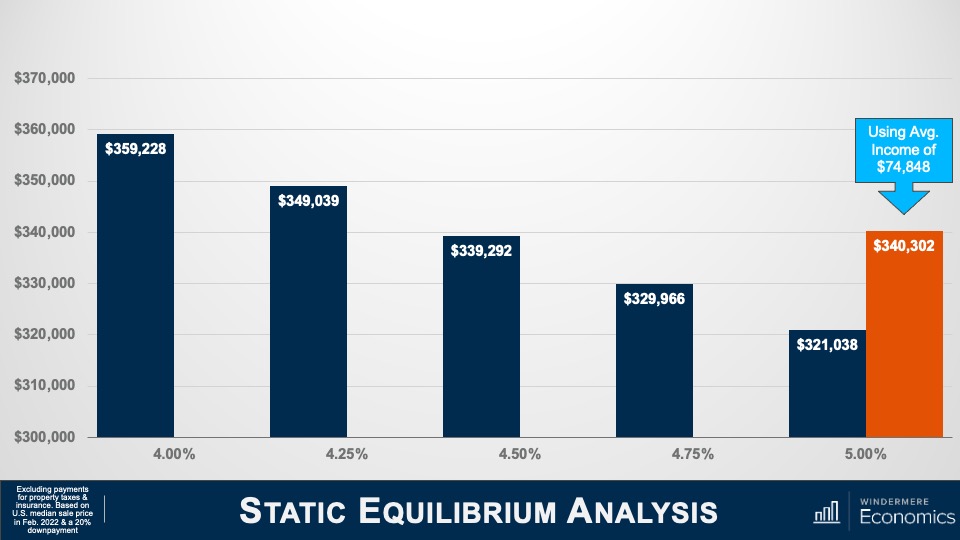
❱ Rising mortgage rates and prices are certain to push affordability down even further, which is concerning. The question remains whether rising financing costs will start to slow the market. For the time being, this does not appear to be the case.
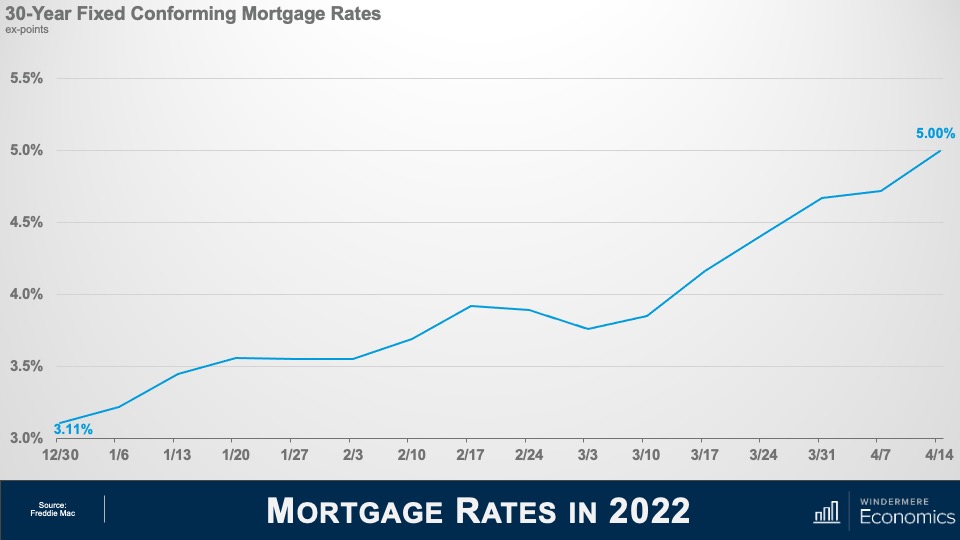
Mortgage Rates
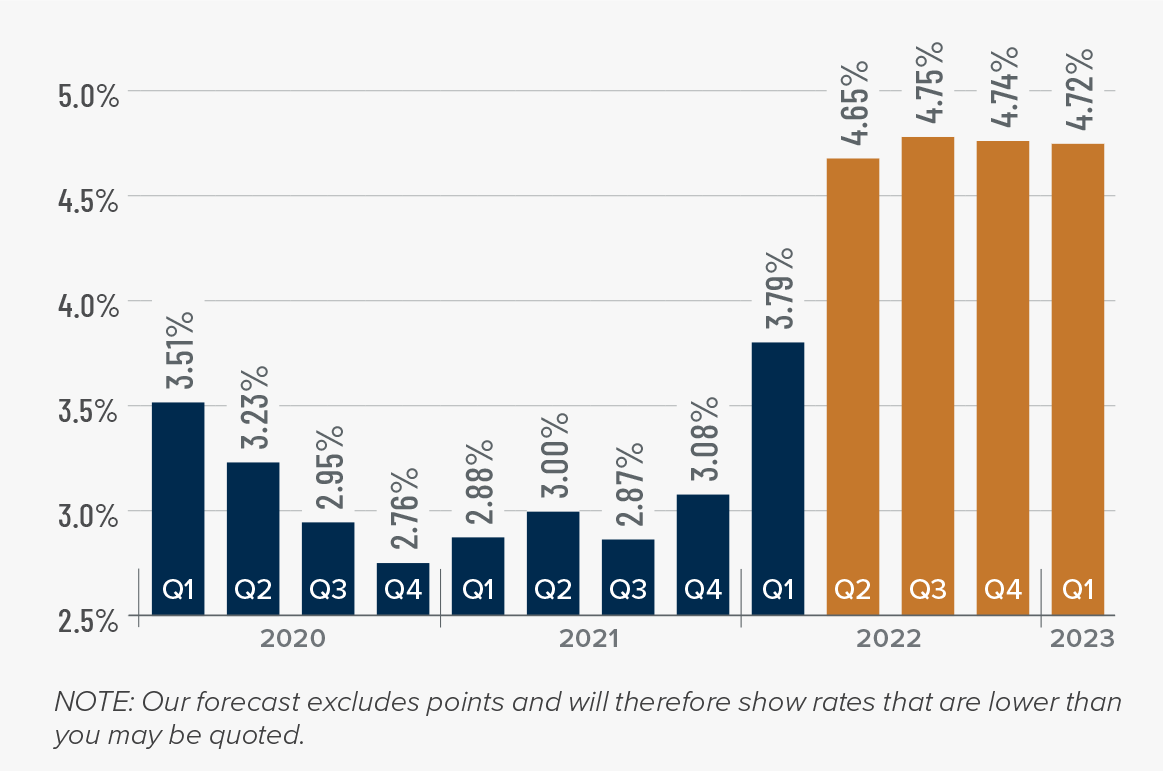
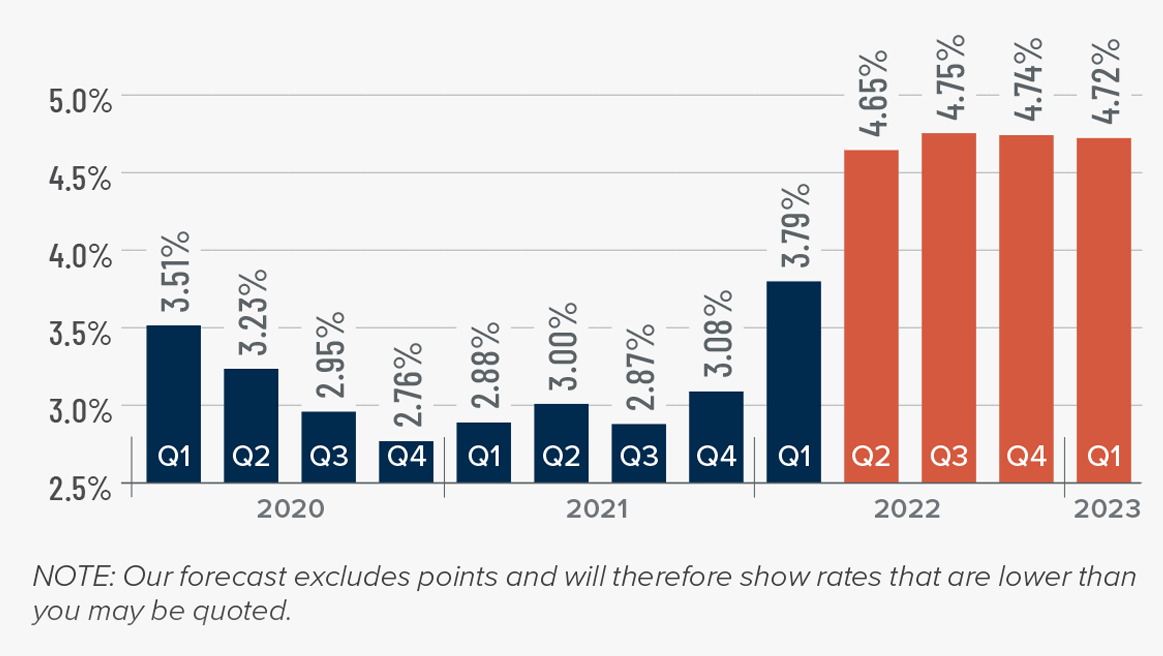
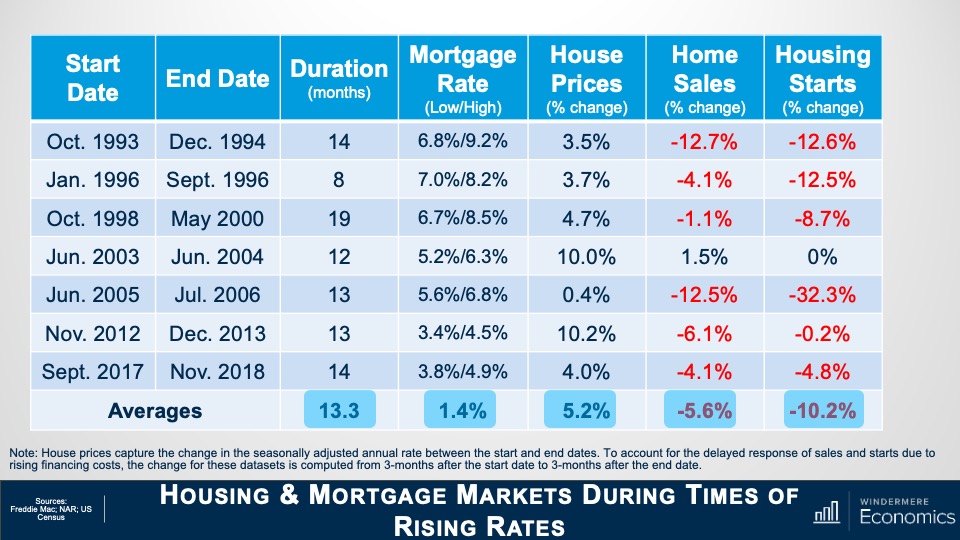
Average rates for a 30-year conforming mortgage were 3.11% at the end of 2021, but since then have jumped over 1.5%—the largest increase since 1987. The speed of the surge in rates is due to the market having quickly priced in the seven-to-eight rate increase that the Fed is expected to implement this year.
Because the mortgage market has priced this into the rates they are offering today, my forecast suggests that we are getting close to a ceiling in rates, and it is my belief that they will rise modestly in the second quarter before stabilizing for the balance of the year.

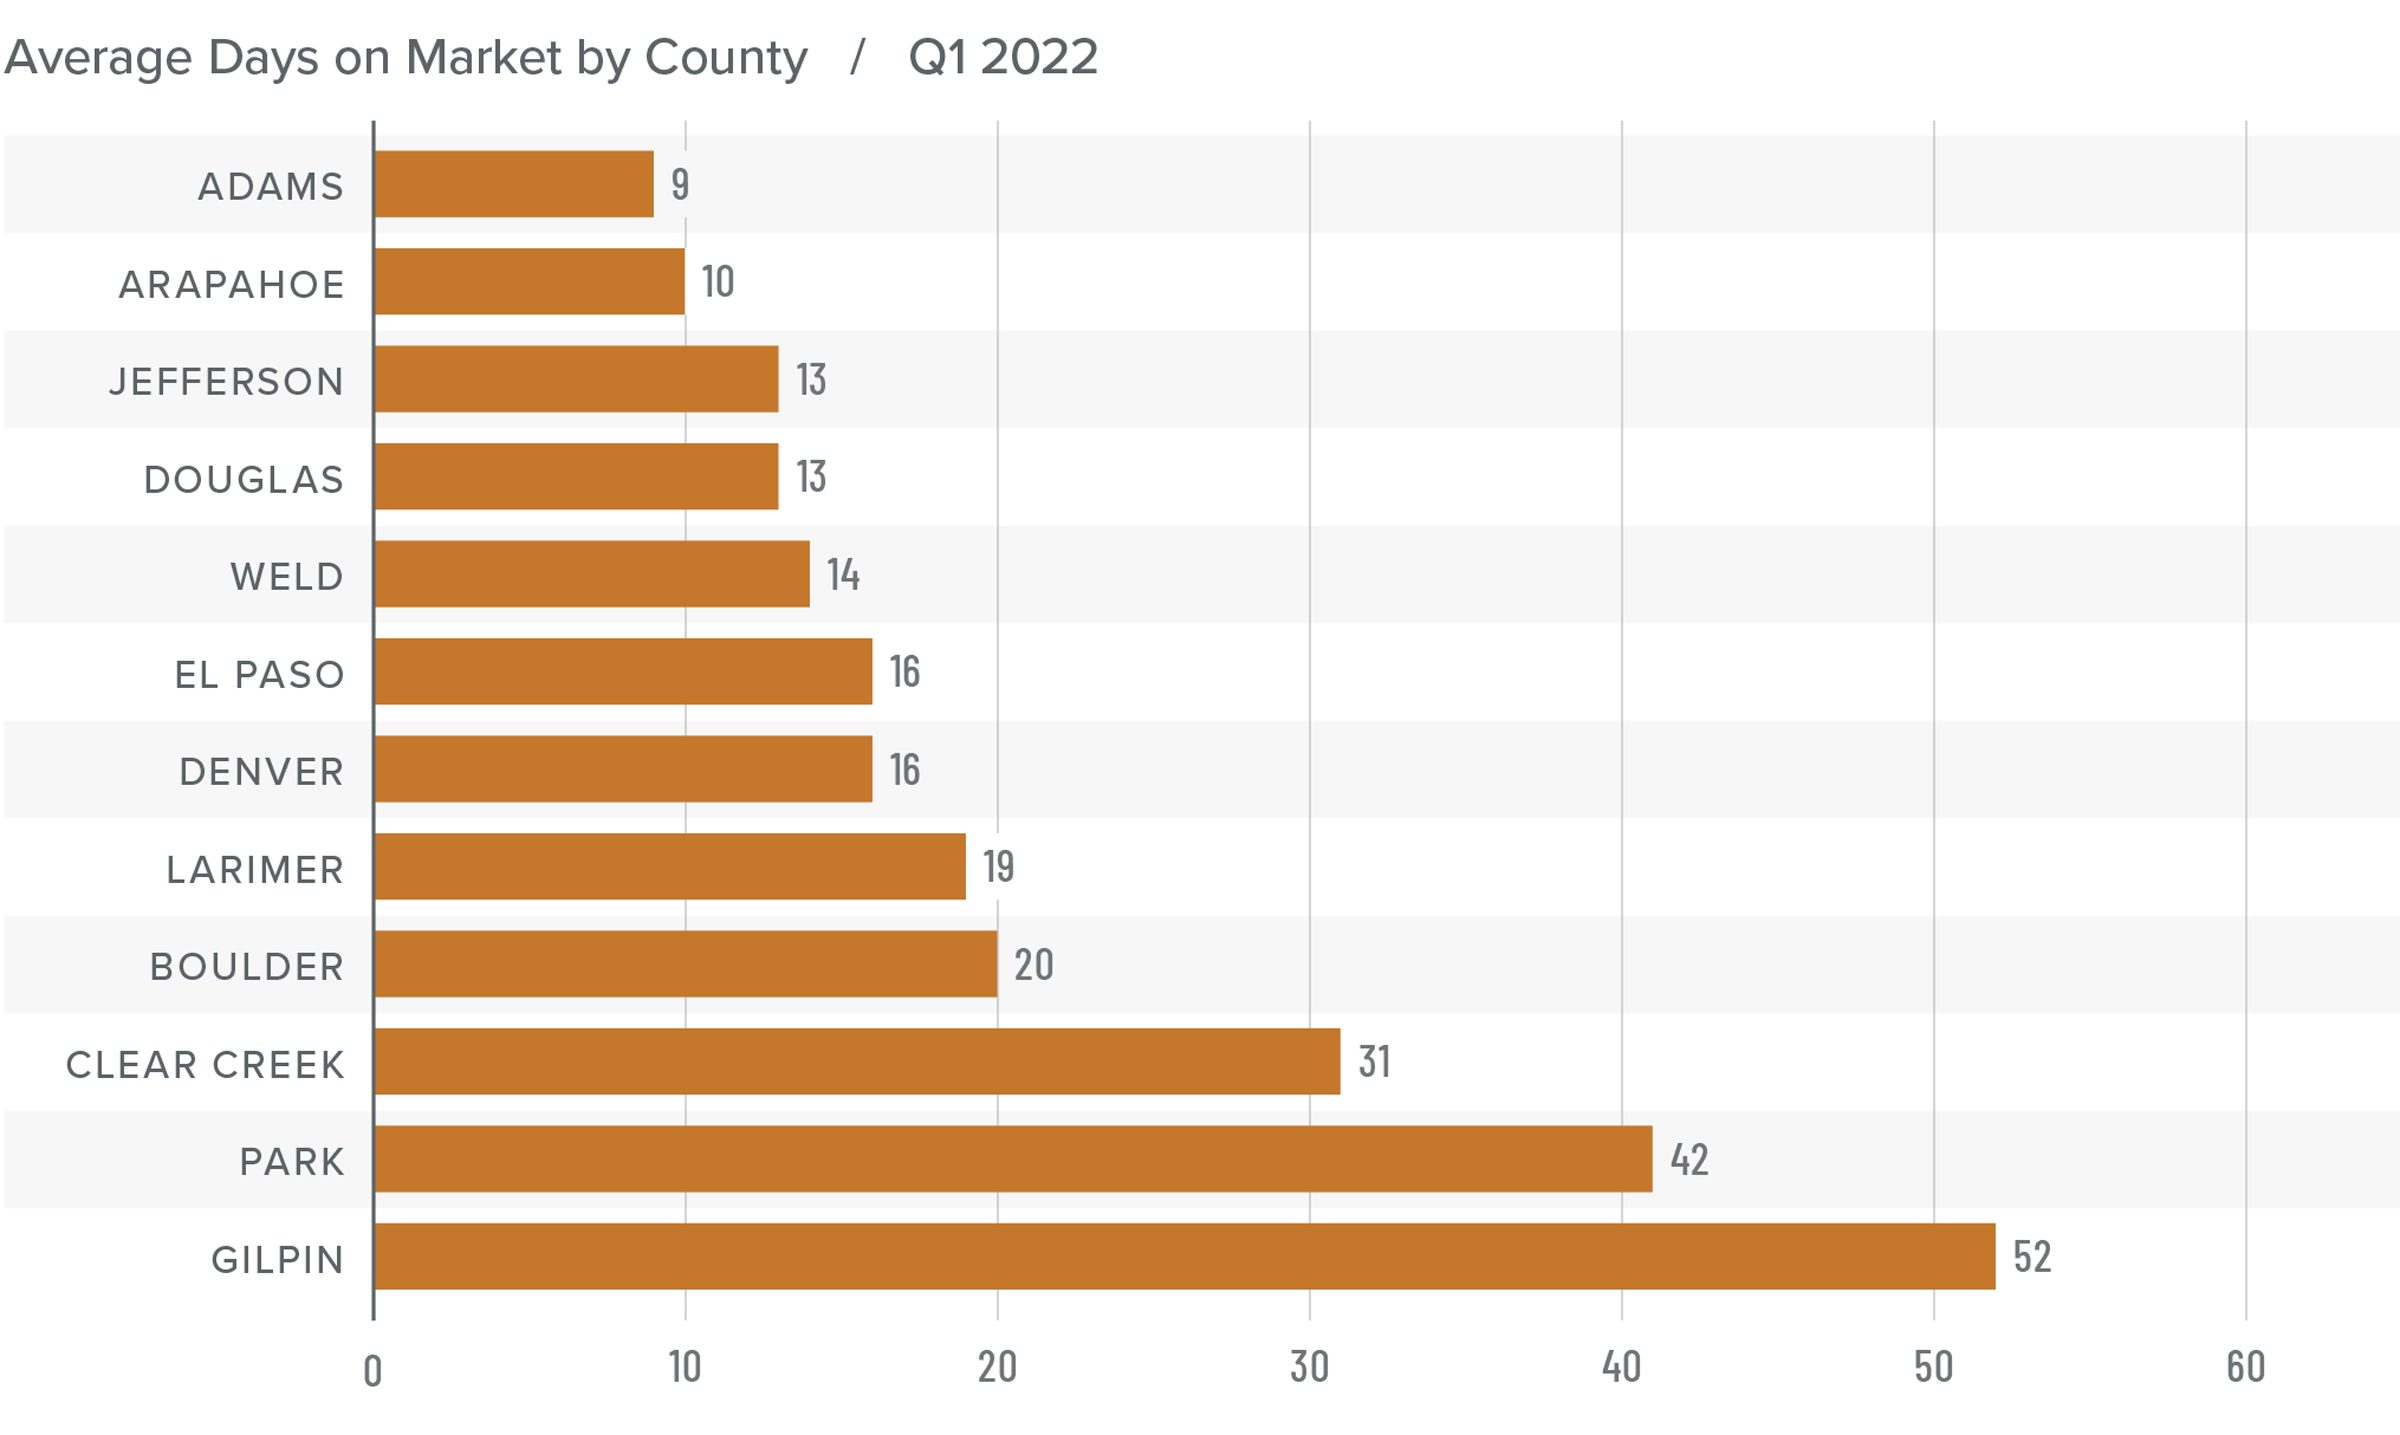
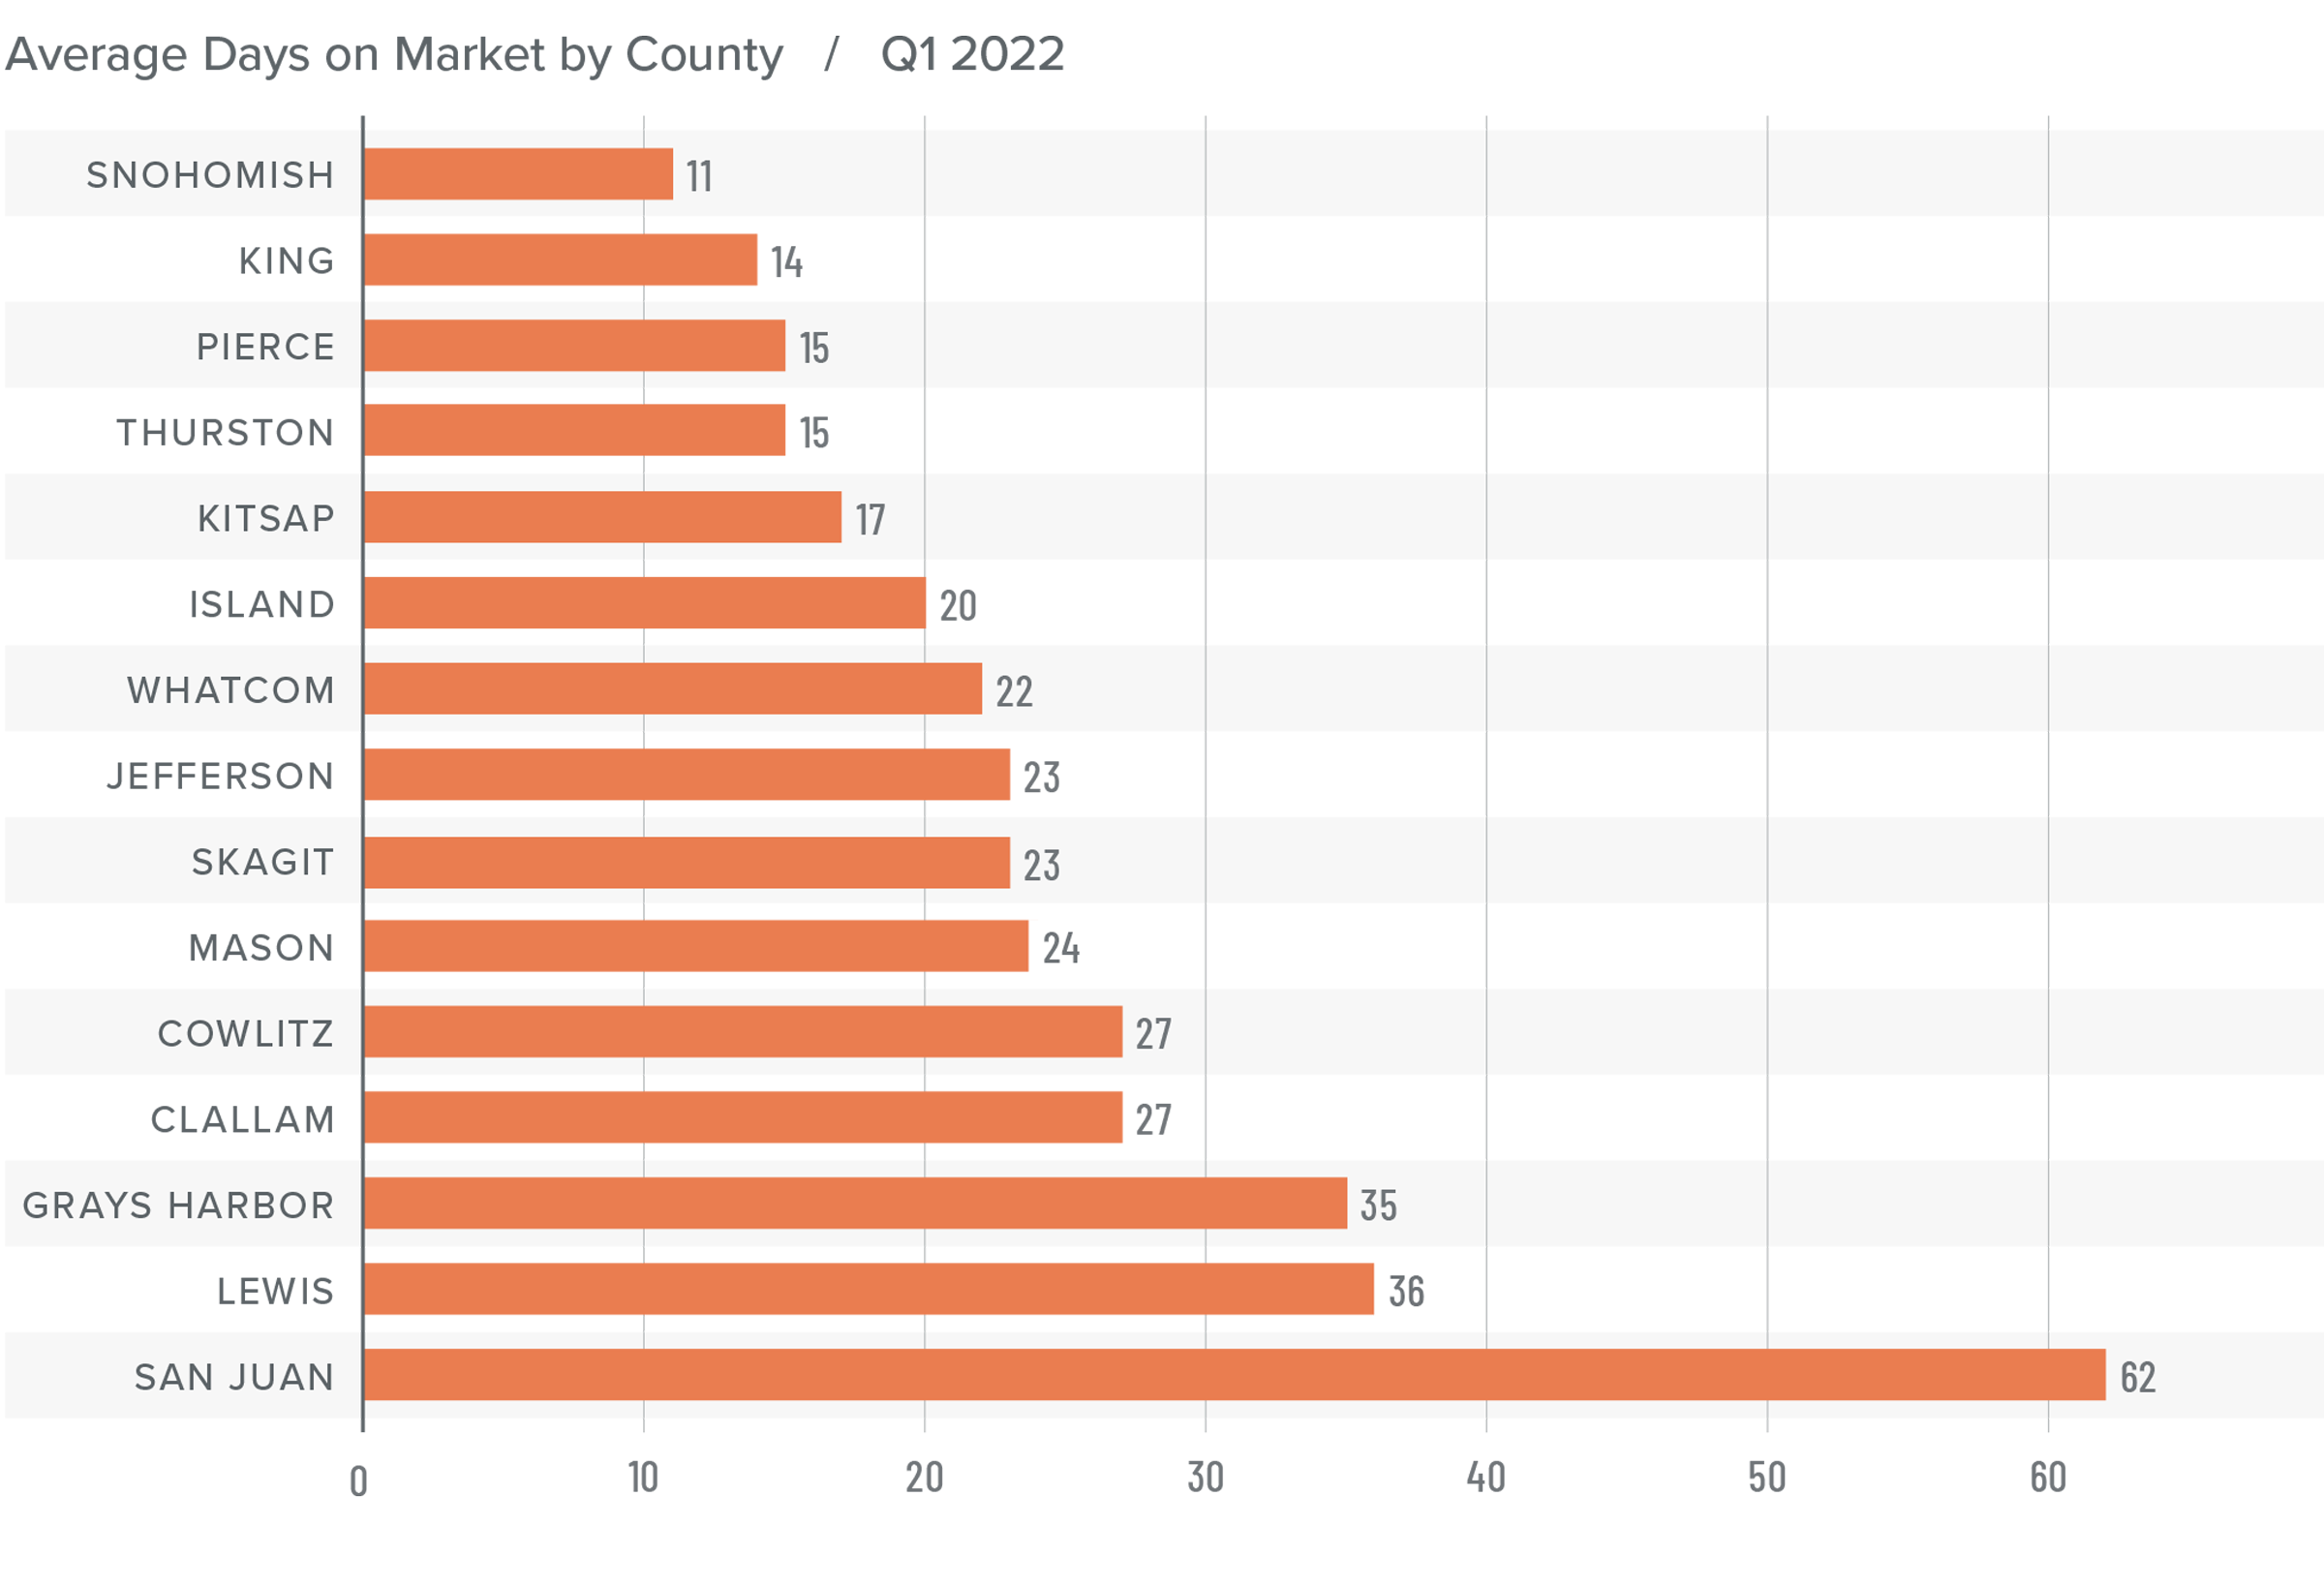
Southern California Days on Market
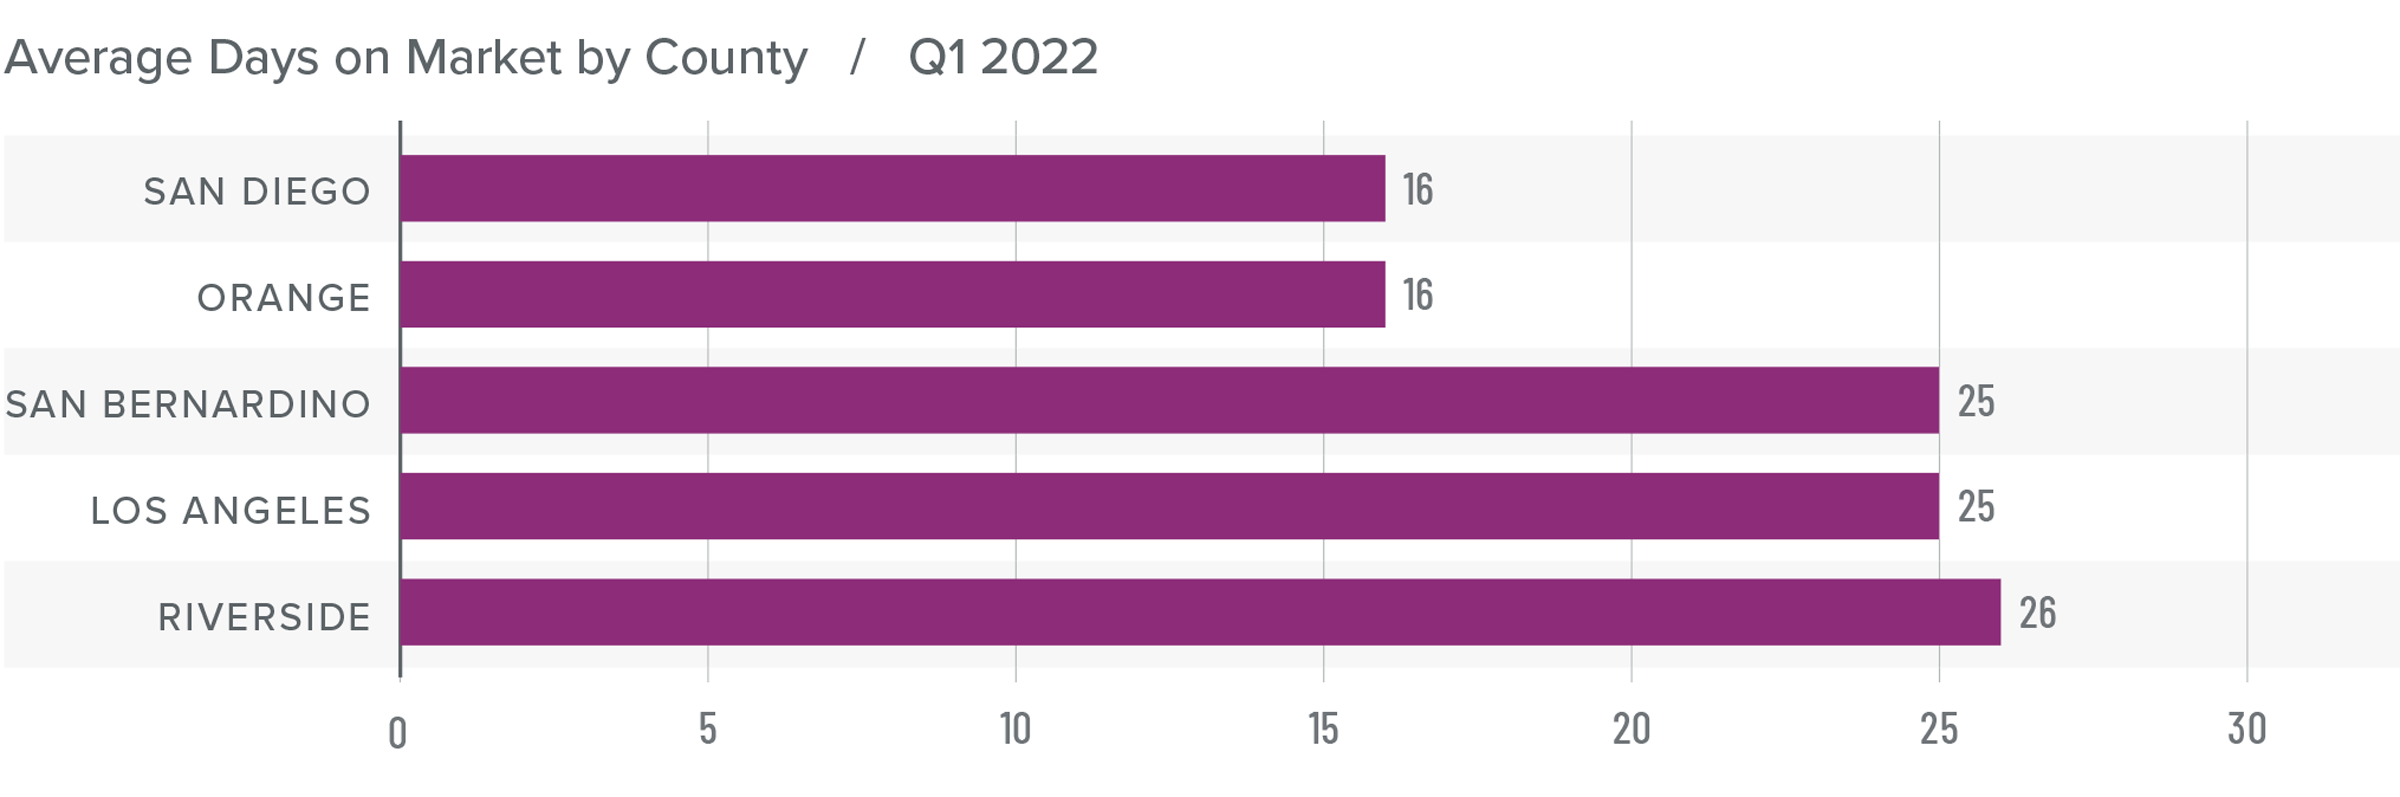
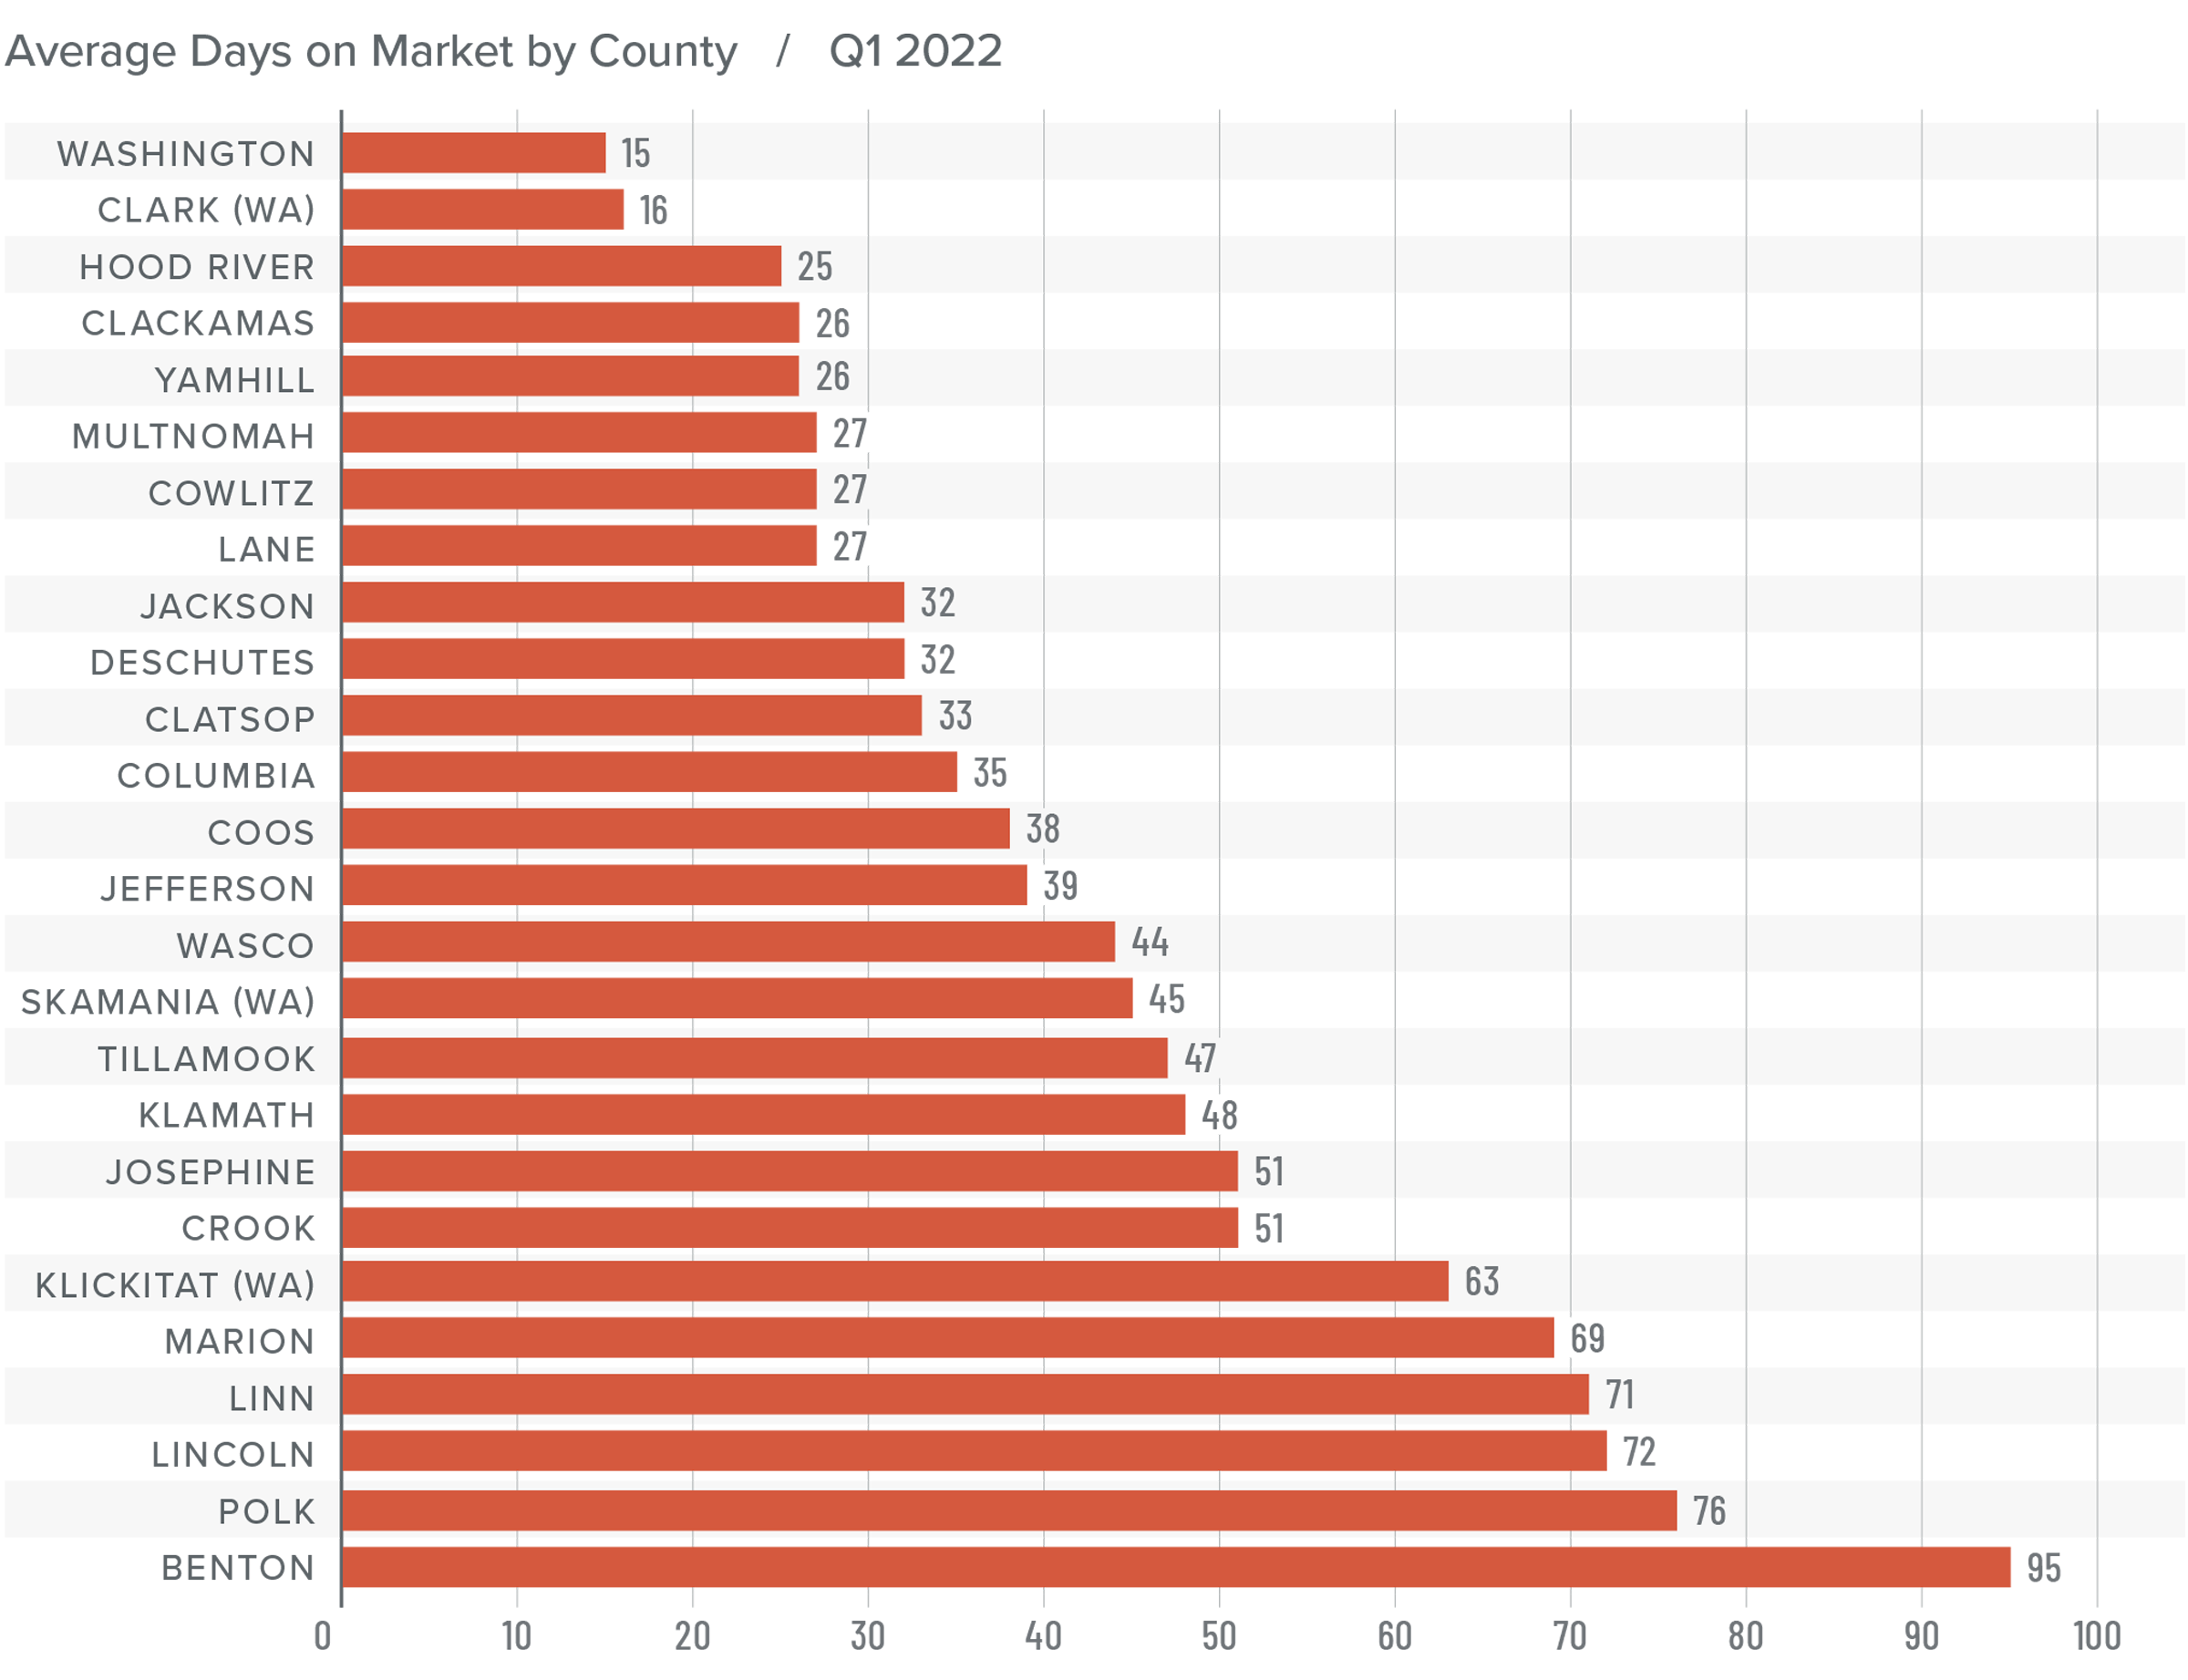
❱ In the first quarter of the year, the average time it took to sell a home in the region was 22 days, which was 6 fewer days than a year ago but 1 day longer than in the final quarter of 2021.
❱ Homes in San Diego County continue to sell at a faster rate than other markets in the region. In the fourth quarter, it took an average of 16 days to sell a home there—two fewer days than it took a year ago.
❱ The other four counties also saw the time it took to sell drop compared to a year ago, but market time rose very modestly in Riverside, Los Angeles, and San Bernardino counties compared to the fourth quarter of 2021.
❱ Limited inventory combined with growing buyer demand is creating a very tight market. Any increases we see in the number of homes for sale in the coming months is not likely to be enough to satisfy buyers.
Conclusions
This speedometer reflects the state of the region’s real estate market using housing inventory, price gains, home sales, interest rates, and larger economic factors.
Despite low inventory levels and rising mortgage rates, the housing market continues to perform very well in Southern California. The spike in mortgage rates has yet to have a significant impact on price growth or demand; however, it will be interesting to check back in the second quarter because if there is an impact, that’s when we would likely see it.

Sellers remain in the driver’s seat, but if higher financing costs start to affect the market, there may be a shift back towards more normal conditions. My instincts suggest that this will not be the case, but only time will tell. With all of this in mind, I have left the needle in the same position as last quarter.
About Matthew Gardner

As Chief Economist for Windermere Real Estate, Matthew Gardner is responsible for analyzing and interpreting economic data and its impact on the real estate market on both a local and national level. Matthew has over 30 years of professional experience both in the U.S. and U.K.
In addition to his day-to-day responsibilities, Matthew sits on the Washington State Governors Council of Economic Advisors; chairs the Board of Trustees at the Washington Center for Real Estate Research at the University of Washington; and is an Advisory Board Member at the Runstad Center for Real Estate Studies at the University of Washington where he also lectures in real estate economics.


")


