
 Facebook
 X
X
 Pinterest
 Copy Link
While many people look forward to the arrival of a jolly red-suited visitor one night this winter, for all of us the holidays are a gift and a danger. All of us want to stay safe from burglary, and there's nothing paranoid about taking a bit of extra time to stay safe. The holidays are a time for relaxation, peace of mind, and sharing love and affection. From old-school security tricks to new digital home monitoring tools, there are many options when it comes to keeping our homes safe and preserving that sensibility.
Security bars and gates:
Sometimes the simplest security is just deterring people from trying to get in. While security bars across windows are a great way to keep intruders out of your home, they can be a real eyesore. Luckily, there are now options for decorative security bars that simultaneously protect your home while enhancing its beauty.
Upgrade your locks:
A poorly installed deadbolt can make it easy for an intruder to kick in your door. Start by making sure that your door frames are in good condition and then look into getting a higher quality deadbolt. You’ll find everything from classic models with keys, or digital options that require passcodes or a fingerprint.
It’s also a good idea to check all the locks on your windows. Some older models are easy to jimmy open with a little wiggling. For ground floor windows, you may want to consider double locks. It goes without saying, leaving windows open during the summer is a bad idea – especially those that can be easily accessed.
Exterior and interior home lighting:
Having your exterior lights on timers or motion sensors is a good way to deter nighttime snoopers. Add sensor lights to key entry points on your home, including the front door, back door, and/or basement entries. If you have an unused side yard, consider lighting there too. Keeping your home lit makes unwanted visitors weary of being seen.
If you will be gone from your home for an extended period of time, consider using timed lighting options in your home to make it appear someone is around. You can select timers for bedrooms or living areas. Also, you can program a radio to turn on and off for sound.
Alarm systems:
If you are considering an alarm, you have an array of options that vary from self-install motion detection kits to full-service home security systems. If you choose to do-it-yourself, you will want to install motion detectors on doors and windows – especially those that can be easily accessed on the ground floor. In most cases, these kits also offer a 24-hour call service for an extra fee.
Full-service security systems can include everything from an alarm system and panic buttons to and integration with your smoke detectors/ fire prevention system. These services are expensive up front but usually have a reasonable monthly rate. And keep in mind, having a home security system installed can also reduce your insurance rates.
If installing an alarm system is cost-prohibitive or does not fit your lifestyle, consider purchasing stickers and a sign that state that your home is monitored by a trusted security system, and place them so they are visible at every entrance.
Security cameras:
Security cameras are readily available for home installation. You can install these in prominently viewed places to deter burglars. There are do-it-yourself install options and professional systems that come along with monitoring services. There are even options that will work with your smartphone. If the cost of security cameras is too steep for your budget, you can purchase fake cameras to act as a visible deterrent for intruders.
Build your community:
Programs like Neighborhood Watch are very successful in some communities, by creating an environment where everyone is looking out for each other. Building close-knit relationships with your neighbors can go a long way in making you feel safe at home. Whether this is through a formalized program, or a shared agreement with your community, developing relationships with your neighbors is a great way to keep your home safe.


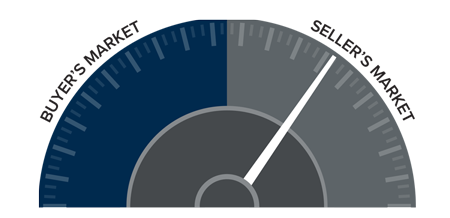
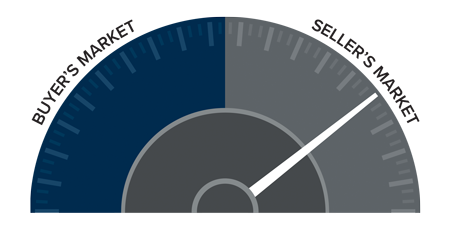
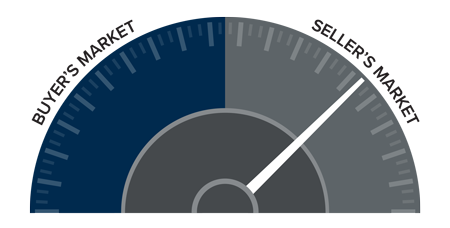
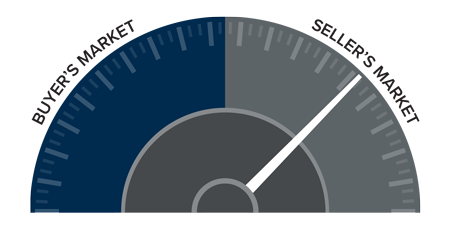 The speedometer reflects the state of the region’s housing market using housing inventory, price gains, home sales, interest rates, and larger economic factors.


")


