More September 9, 2019

Windermere Living Fall Issue

Dear Readers,

Welcome to the fall issue of Windermere Living! Are you a foodie who loves to travel? Inside this issue is an article about interesting destinations where you can enjoy edible, immersive experiences like making your own coffee on the Kona coast of Hawaii, or diving for clams in Cabo and cooking them with an executive chef.

If you’ve ever undergone a major home remodel, you know all too well how important it is to partner with the right architect. We explore that topic in this issue, along with some pro tips on how to match yourself up with the perfect architect for your project, a process that isn’t that different from dating.

Last but not least, there are more than 70 pages filled with homes for sale throughout the Western U.S. Whether you’re in the market for a country farmhouse or a high-rise condo, there’s a little something for everyone.

This is just a sampling of what you’ll find in this issue of Windermere Living; we hope you enjoy it!

Read the Fall Issue of Windermere Living. 

More August 28, 2019

A 25-Year Tradition of Golfing and Giving


Golfing and giving seems to be a tradition with Windermere Real Estate. Many of our offices hold golf tournaments to raise money for local non-profits via the Windermere Foundation. The longest-held Windermere golf tournament has been hosted by a group of Windermere offices in Snohomish County, Washington.


Snohomish County Windermere Foundation Golf Tournament

This year’s 25th Annual Snohomish County Windermere Foundation Golf Tournament was held on July 26 at Cedarcrest golf course in Marysville, Washington. It was a festive day of golfing, food, and fun as they celebrated 25 years of support for low-income housing. The event raised nearly $30,000 for the Windermere Foundation, which then sent a donation to support Housing Hope and their ChildHope programs. Each golfer received a commemorative Windermere Foundation 25th Annual Golf Tournament coin. Over the past 25 years, this tournament has raised over $400,000 in support of non-profits in Snohomish County.


About Housing Hope

Housing Hope’s mission is to promote and provide affordable housing and tailored services to reduce homelessness and poverty for residents of Snohomish County and Camano Island, Washington. In 2018, ChildHope programs served 747 people–358 parents and 389 children in 315 families. Tomorrow’s ChildHope Child Development Center serves children from four weeks to twelve years of age, providing assessments for each child to determine special needs and treatment plans to help those children who may be traumatized by poverty and homelessness.


Windermere Legends Golf Tournament

Another golf tournament of note is the Windermere Legends Golf Tournament–in honor of Windermere legends Dick Wood, Don Deasy, Don Riley, John Demco, Terry Haberbush, Vince Haugerud, and Walley Starkey. It is hosted by several Seattle-area Windermere offices. Established in 2007, the golf tournament benefits the Windermere Foundation and The Don Deasy Memorial Leadership 1000 Scholarship Fund. The tournament was originally called the Don Deasy Memorial Golf Tournament, in honor of Don Deasy, a Windermere icon and valued franchise owner. The scholarship fund provides grants to help fund the college education of a Quincy High School graduate (Don’s hometown) who plans to attend the University of Washington. In its first year, the tournament raised $75,000. Sixteen years later, this annual golf tournament has raised a total of over $671,300.


Thanks to events like these golf tournaments, the Windermere Foundation has been able to raise more than $38 million over the past 30 years in support of low-income and homeless families. To learn more about the Windermere Foundation, or to make a donation, please visit windermerefoundation.com.


Market News August 26, 2019

The Slow Down in Foreign Buyers

Design August 21, 2019

Prepare For and Prevent Damage This Wildfire Season Before It Happens

After last year’s wildfires, some of the largest and deadliest in recent memory, spread along the west coast, homeowners are on edge as to what this fire season will bring. The questions of whether their home will be burnt, or if they will be affected by poor air quality, hang in the air much like the smoke of a nearby fire. Accompanied by heatwaves hitting much of the U.S. these fears can turn into realities just as quick as a spark in brush. Luckily there are ways to prevent damage and to prepare for anything coming your way.


Be prepared with fire insurance

Are you currently protected in case of a fire? Make sure to talk with your insurance agent and work on a plan to insure your home.

Questions to ask them are:

  • What is covered should our home be destroyed in a fire?
  • What kinds of documentation do we need to do in order to get the full benefit of the insurance?
    • It’s usually a great idea to keep a log of what is in your home and how much it costs. Keep receipts and invoices if possible.
  • Who at the company should we contact in case of emergency? 


Be prepared with an emergency kit

Cal Fire has a comprehensive guide to all things wildfire preparedness. Here they suggest putting together an emergency kit that’s always ready in case of sudden evacuations. They recommend including:

  • Map marked with at least two evacuation routes
  • Non-perishable foods to last three days
  • Prescriptions and medications. Also, eyeglasses or contact lenses.
  • Change of clothes
  • Toiletries and sanitation supplies
  • And extra set of car keys, as well as credit cards, cash or traveler’s checks
  • First aid kit
  • Flashlight and batteries
  • Copies of important documents like birth certificates and passports
  • Food and water for your pet
  • Chargers for cell phones and other devices

Some other items you might consider having close by are easily carried valuables, sentimental items like family photos, and computers or hard drives. Keep a sturdy pair of shoes and a flashlight near your bed for any evacuations at night.


Prevent damage by fortifying the building

Fire-Safe Landscaping

You don’t have to re-do the entire garden to slow the fire down. Home Advisor recommends you create a balance of aesthetically pleasing flora and slow-burning plants that are less likely to ignite.

Additionally, keep your garden and property free of dry materials that are ideal for kindling either in your bonfire or for a wildfire. Not only does creating this barrier protect your home, it also gives firefighters a safe area to work from as they work to control the fire.

To see what plants to use and other ways to fireproof your property, visit HomeAdvisor.


Build or remodel with flame-resistant materials

Materials like brick, stucco, metal, or concrete are great exteriors that can prevent the fire from taking hold of your home, at least initially. If your home is already built with one of these materials, the weak points might lie in your extremities like your deck or porch. Consider re-building these with fire-proof materials or add a coating to protect them.

Additionally, protect the most vulnerable areas of your home, like your windows and any air vents. Add retractable fireproof panels to your windows or replace the glass with wire glass or fire-proof safety glass. Don’t forget your skylights or windows on your doors.

Market News August 19, 2019

Rent Control

Oregon’s statewide rent control legislation has stirred discussion at the Legislative level up and down the west coast. Windermere’s Chief Economist, Matthew Gardner, says Oregon’s law is really more a rental price stabilization tactic and weighs in on whether other states are likely to adopt similar regulation.

Market News August 14, 2019

Hawaii/Maui Real Estate Market Update


The following analysis of select Maui real estate markets is provided by Windermere Real Estate Chief Economist Matthew Gardner. We hope that this information may assist you with making better-informed real estate decisions. For further information about the housing market in your area, please don’t hesitate to contact your Windermere agent.


ECONOMIC OVERVIEW

The tepid pace of employment growth in Hawaii continues. Only 1,200 jobs were added over the past 12 months, representing an annual growth rate of 0.2%. In June, the state’s unemployment rate was 2.8% — a figure that has remained static for the past four months — but it is up from 2.4% a year ago.

On the island of Maui, employment continues to contract, with a 3% drop year-over-year. Employment growth has been negative for the past 18 months. The island’s unemployment rate was 3%, up from 2.8% a year ago.


HOME SALES

  • In the second quarter of 2019, 573 homes sold. This was a drop of 9.2% compared to the second quarter of 2018, but an increase of 16.9% compared to the first quarter of this year.
  • Just one market saw growth in sales compared to the second quarter of 2018. As for sales declines, the very small North Shore market experienced a significant drop, but the total contraction in sales was just 10 units.
  • The decline in sales came as inventory levels dropped 5.6%. Three market areas saw listing inventories rise: the Central area, North Shore, and Up Country. Lower inventory levels were experienced in South Maui and the West Side.
  • Pending home sales in the quarter were down 2.9% from the first quarter of 2019, suggesting that third quarter closings may also disappoint.


HOME PRICES

  • The average home price in the region rose 2.1% year-over-year to $883,805.
  • Affordability continues to be a significant issue. The noticeable drop in interest rates this year has failed to stimulate sales but has allowed average prices to continue to rise.
  • Price changes were a mixed bag, with growth in two market areas and declines in three. The North Shore market had a 66.9% drop in prices, but this is a very small area, making it prone to significant price swings.
  • Even given affordability constraints in many Maui market areas, I believe home prices will rise further in 2019, though at fairly modest rates.


DAYS ON MARKET

  • The average number of days it took to sell a home on Maui dropped 21 days compared to the second quarter of 2018.
  • The amount of time it took to sell a home dropped in all markets other than in Up Country.
  • In the second quarter, it took an average of 53 days to sell a home. Homes in the North Shore market sold at the fastest pace, while West Side homes took the longest time to sell.
  • Even as sales slowed, housing demand remained strong, as the drop in market time demonstrates. I continue to anticipate we will see modestly rising activity as we move through the balance of the year.


CONCLUSIONS

This speedometer reflects the state of the region’s real estate market using housing inventory, price gains, home sales, interest rates, and larger economic factors.

For the second quarter of 2019, I have moved the needle a little more in favor of home sellers. The market is showing some signs of trending back toward equilibrium, but we are not there yet. The lack of inventory favors sellers with continued price growth.


ABOUT MATTHEW GARDNER

As Chief Economist for Windermere Real Estate, Matthew Gardner is responsible for analyzing and interpreting economic data and its impact on the real estate market on both a local and national level. Matthew has over 30 years of professional experience both in the U.S. and U.K.

In addition to his day-to-day responsibilities, Matthew sits on the Washington State Governors Council of Economic Advisors; chairs the Board of Trustees at the Washington Center for Real Estate Research at the University of Washington; and is an Advisory Board Member at the Runstad Center for Real Estate Studies at the University of Washington where he also lectures in real estate economics.


Market News August 13, 2019

Big Island of Hawaii Real Estate Market Update


The following analysis of the Big Island real estate market is provided by Windermere Real Estate Chief Economist Matthew Gardner. We hope that this information may assist you with making better-informed real estate decisions. For further information about the housing market in your area, please don’t hesitate to contact your Windermere agent. 


ECONOMIC OVERVIEW

The tepid pace of employment growth in Hawaii continues. Only 1,200 jobs were added over the past 12 months, representing an annual growth rate of 0.2%. In June, the state’s unemployment rate was 2.8%—a figure that has remained static for the past four months—but it is up from 2.4% a year ago.

On the Big Island, total employment continues to contract, having lost 4,150 jobs over the past year. Annualized employment growth has been negative for the past nine months. The island’s unemployment rate was 4.1%, up from 3.7% a year ago.


HOME SALES

  • In the second quarter of 2019, 913 homes traded hands, an increase of 3.6% over the second quarter of 2018 and 30.8% higher than in the first quarter of 2019.
  • Sales were higher in five markets, static in two, and fell in two. There was significant growth in sales in Kau, but it is a very small market. Similarly, the contraction in sales in Hamakua can be attributed to the small size of the area.
  • The growth in sales came as inventory levels rose 16.6% from a year ago. However, the average number of homes for sale in the quarter was 4.9% lower than in the first quarter of this year. Listing activity remains lower than I would like to see, but the uptick in homes for sale (relative to a year ago) is encouraging.
  • Inventory levels rose in seven of the markets analyzed: Puna, South Hilo, Hamakua, North Kohala, North and South Kona, and Kau. This may give some relief to home buyers.


HOME PRICES

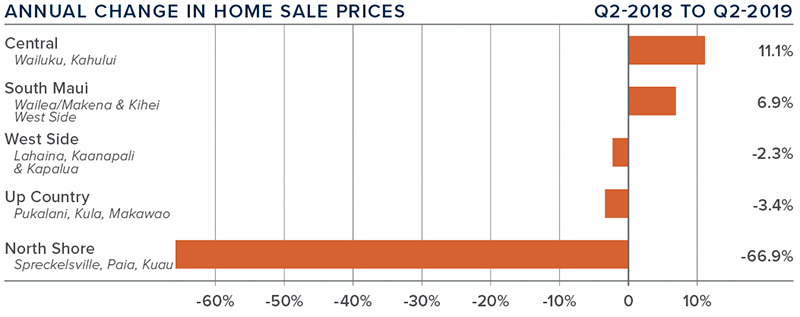
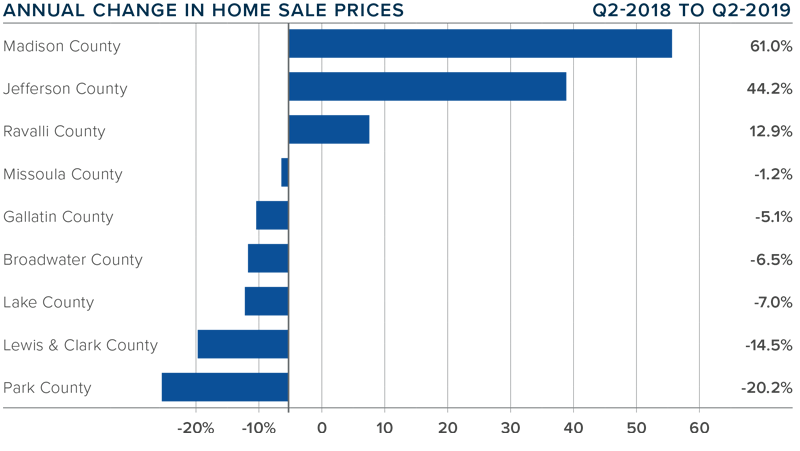
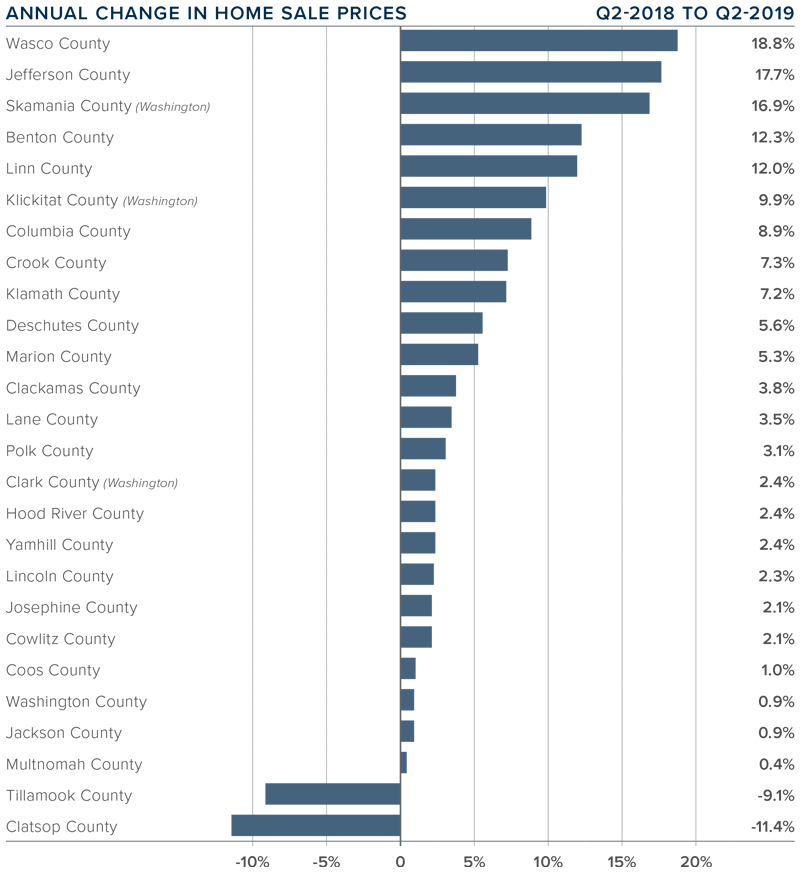
  • The average home price in the region dropped 5.7% year-over-year to $525,611. Prices also dropped between the first and second quarters by 2.9%.
  • Affordability remains an issue, but current low interest rates may stimulate buyers as we move through the balance of the year.
  • Prices rose in three markets but dropped in six. Appreciation was strongest in Kau, where prices rose 30.6% — again, a function of it being a very small area with limited sales.
  • Despite ongoing affordability issues in many Big Island market areas, I still expect home prices to rise modestly in 2019.


DAYS ON MARKET

  • The average time it took to sell a home on the Big Island rose three days compared to the second quarter of 2018.
  • The amount of time it took to sell a home dropped in four market areas and rose in five.
  • In the second quarter, it took an average of 108 days to sell a home. Homes sold fastest in South Hilo and slowest in Hamakua.
  • The recent drop in mortgage interest rates has the potential to stimulate demand as we move through the balance of 2019.


CONCLUSIONS

This speedometer reflects the state of the region’s real estate market using housing inventory, price gains, home sales, interest rates, and larger economic factors.

For the second quarter of this year, I have left the needle fairly close to the middle, suggesting that we are approaching a balanced market. I was pleased to see the number of homes for sale increase, and the drop in home prices may suggest that home price growth has hit a peak. With this shift in the market, buyers have more choices and are able to be more selective when choosing a new home.


ABOUT MATTHEW GARDNER

As Chief Economist for Windermere Real Estate, Matthew Gardner is responsible for analyzing and interpreting economic data and its impact on the real estate market on both a local and national level. Matthew has over 30 years of professional experience both in the U.S. and U.K.

In addition to his day-to-day responsibilities, Matthew sits on the Washington State Governors Council of Economic Advisors; chairs the Board of Trustees at the Washington Center for Real Estate Research at the University of Washington; and is an Advisory Board Member at the Runstad Center for Real Estate Studies at the University of Washington where he also lectures in real estate economics.


Market News August 12, 2019

Montana Real Estate Market Update


The following analysis of select Montana real estate markets is provided by Windermere Real Estate Chief Economist Matthew Gardner. We hope that this information may assist you with making better-informed real estate decisions. For further information about the housing market in your area, please don’t hesitate to contact your Windermere agent. 


ECONOMIC OVERVIEW

Montana added 5,700 new non-agricultural jobs over the past 12 months, representing an annual growth rate of 1.2%. Although Montana’s growth rate is still below the U.S. as a whole, it has picked up a little in recent months with the addition of 4,400 non-agricultural jobs in the second quarter of the year. I still believe that the state will grow employment by 1.2% in 2019. In June, the state unemployment rate was a healthy 3.5%, down from 3.7% a year ago.


HOME SALES

  • 1,371 homes sold during the second quarter of 2019 — a drop of 5.3% over the same period in 2018.
  • Total sales activity was a mixed bag, with increases in five counties and declines in four. The largest annual increase was in Park County, where sales were up more than 83%. The largest drop in sales was in the very small Broadwater County.
  • The number of homes for sale remains well below levels I would like to see. There was an average of 1,570 listings in the second quarter within the counties contained in this report.
  • Low inventory levels are holding sales back. I am still hopeful we will see modest increases in the number of homes for sale as we move through the balance of the year. Even so, growth in inventory will remain modest.


HOME PRICES 

  • The average home price in the region jumped by a remarkable 25.2% year-over-year to $413,812. The 1.8% increase over the first quarter of this year was more modest.
  • In addition to Madison County, Jefferson and Ravalli counties also saw double-digit price increases. Average prices dropped in the rest of the counties contained in this report, with the largest drop in the small Park County. This is a function of the size of the market and the relatively few transactions that occur there.
  • Price appreciation was strongest in Madison County, where home prices rose 61%, but I would add that this is a very small area where wild swings in prices are not uncommon.
  • The takeaway from this data is that, in aggregate, prices continue to rise but not all markets are created equal.


DAYS ON MARKET

  • The average number of days it took to sell a home dropped 15 days compared to the second quarter of 2018.
  • Homes sold fastest in Gallatin County and slowest in Madison County. Five counties — Missoula, Lake, Broadwater, Gallatin, and Park — saw days-on-market drop compared to the second quarter of 2018.
  • During the second quarter of 2019, it took an average of 110 days to sell a home in the region.
  • The takeaway here is that market time has improved compared to a year ago.


CONCLUSIONS

This speedometer reflects the state of the region’s real estate market using housing inventory, price gains, home sales, interest rates, and larger economic factors.

For the second quarter of 2019, I have held the needle in the same position as last quarter. Mortgage rates continue to be at very attractive levels, which is possibly getting more buyers off the fence. However, inventory limitations persist and that will put additional upward pressure on prices.


ABOUT MATTHEW GARDNER

As Chief Economist for Windermere Real Estate, Matthew Gardner is responsible for analyzing and interpreting economic data and its impact on the real estate market on both a local and national level. Matthew has over 30 years of professional experience both in the U.S. and U.K.

In addition to his day-to-day responsibilities, Matthew sits on the Washington State Governors Council of Economic Advisors; chairs the Board of Trustees at the Washington Center for Real Estate Research at the University of Washington; and is an Advisory Board Member at the Runstad Center for Real Estate Studies at the University of Washington where he also lectures in real estate economics.

Market News August 8, 2019

Oregon and Southwest Washington Real Estate Market Update


The following analysis of the Oregon and Southwest Washington real estate market is provided by Windermere Real Estate Chief Economist Matthew Gardner. We hope that this information may assist you with making better-informed real estate decisions. For further information about the housing market in your area, please don’t hesitate to contact your Windermere agent. 


ECONOMIC OVERVIEW

Oregon added 46,100 new jobs over the past 12 months, representing an annual growth rate of 2.4%. The current pace of job growth was a refreshing reversal from the slowing growth that had been in place since mid-2018.

The Southwest Washington market (Clark, Cowlitz, Skamania, and Klickitat counties) added 3,600 new jobs over the past 12 months, which represents an annual growth rate of 1.7%.

Oregon’s unemployment rate was 4.1% in June, up from 4% a year ago. In Southwest Washington, the unemployment rate was 5%, up from 4.8% a year ago.


HOME SALES

  • Second-quarter home sales dropped 4.2% compared to the same period last year, with a total of 16,791 transactions.
  • Sales rose fastest in Tillamook County, which saw a significant 15.5% increase over the second quarter of 2018. There were also solid increases in Yamhill and Josephine counties. Home sales fell most in the small Wasco, Linn, Coos, and Clatsop counties.
  • Year-over-year sales rose in 6 counties, remained static in 1, and dropped in the other 19 counties contained in this report.
  • Sales in the second quarter picked up from earlier in the year but are still lower than I would like to see. This is likely a function of limited inventory in concert with prices that continue to rise, suggesting that affordability may be slowing sales.


HOME PRICES

  • The average home price in the region rose 2.8% year-over-year to $401,175 and was 8.5% higher than in the first quarter of this year.
  • Wasco County led the market with the strongest annual price growth. Homes there sold for 18.8% more than they did a year ago. The greatest price declines were in the small counties of Clatsop and Tillamook. However, smaller markets can be prone to significant swings, so I’m not overly concerned at this time.
  • All but two of the counties contained in this report experienced price growth compared to the second quarter of 2018. Two had lower prices than in the same period a year ago.
  • The takeaway from this section is that price growth continues to moderate. Given very attractive mortgage rates, I expect prices to continue trending higher but at slower rates than the past several years.


DAYS ON MARKET

  • The average number of days it took to sell a home in the region rose by 2 days compared to the second quarter of 2018 but was down 20 days compared to the first quarter of 2018.
  • The average time it took to sell a home last quarter was 70 days.
  • Compared to a year ago, 10 counties saw the length of time it took to sell a home drop, 1 remained static, and 15 counties saw market time rise.
  • Homes again sold the fastest in Washington (22 days) and Multnomah (30 days) counties.


CONCLUSIONS

The speedometer reflects the state of the region’s real estate market using housing inventory, price gains, home sales, interest rates, and larger economic factors. Inventory levels, although rising, are still lower than I would like to see. With the region’s economic vitality and low mortgage rates, I expect to see more buyers starting their search for a new home. Because of these factors, I have moved the needle a little more in favor of home sellers.


ABOUT MATTHEW GARDNER

As Chief Economist for Windermere Real Estate, Matthew Gardner is responsible for analyzing and interpreting economic data and its impact on the real estate market on both a local and national level. Matthew has over 30 years of professional experience both in the U.S. and U.K.

Matthew also sits on the Washington State Governors Council of Economic Advisors; chairs the Board of Trustees at the Washington Center for Real Estate Research at the University of Washington; and is an Advisory Board Member at the Runstad Center for Real Estate Studies at the University of Washington.

Market News August 7, 2019

Idaho Real Estate Market Update


The following analysis of select counties of the Idaho real estate market is provided by Windermere Real Estate Chief Economist Matthew Gardner. We hope that this information may assist you with making better-informed real estate decisions. For further information about the housing market in your area, please don’t hesitate to contact your Windermere agent.


ECONOMIC OVERVIEW

Following a trend that started last fall, job growth in Idaho continues to moderate. The addition of 18,400 new jobs year-over-year represents an annual growth rate of 2.5%. This is to be expected at this point in the economic cycle, but it’s worth noting that the current rate of job growth remains well above the national average of 1.6%.

In May, the state unemployment rate was 2.8%, marginally lower than the 2.9% rate of a year ago. The state remains at full employment, though it is interesting to note that the employment rate remained below 3% even as the labor force rose 2%, suggesting that the economy remains very robust as there are still job openings to accommodate new workers.


HOME SALES

  • 6,936 homes were sold during the second quarter of 2019, representing a modest drop of 2.8% from the second quarter of 2018.
  • In Northern Idaho, Shoshone County was the only county to experience sales growth, with sales up by 21.3% over the second quarter of 2018. There was a modest decline in sales in the other two counties. In Southern Idaho, Canyon and Payette counties had modest sales growth, but the rest of the region experienced lower sales activity.
  • Year-over-year sales growth was positive in just one of the Northern Idaho counties. Sales rose in two Southern Idaho market areas relative to the same period a year ago.
  • Pending sales rose in the quarter, suggesting that closed sales next quarter are likely to be an improvement over current figures.


HOME PRICES

  • The average home price in the region rose 7.8% year-over-year to $358,406 and was 3.2% higher than the first quarter of this year.
  • In Northern Idaho, Bonner County led the market with the strongest annual price growth. Kootenai County also saw solid price growth. In Southern Idaho, small Boise County saw prices rise a very significant 21.1%, but this is an anomaly.
  • There were price increases in all but one county compared to the second quarter of 2018. The outlier was Blaine County, where prices dropped 12%. Blaine County is a very small market that can be prone to significant swings, so I am not too concerned at the present time. That said, it is the most expensive market, and this may be having an impact on values.
  • Inventory continues to be an issue, which is driving up home prices. I expected to see more homes come on the market in the late spring, but that wasn’t the case. Until there are more listings, price growth will continue at above-average levels.


DAYS ON MARKET

  • It took an average of 101 days to sell a home in Northern Idaho, and 66 days in the southern part of the state covered by this report.
  • The average number of days it took to sell a home in the region dropped 6 days compared to the second quarter of 2018 and was 24 days lower than in the first quarter of the year.
  • In Northern Idaho, days on market dropped in Bonner and Shoshone counties, but rose marginally in Kootenai. In Southern Idaho, market time dropped in all but Ada, Canyon, and Valley counties, but the change was very modest.
  • Homes sold fastest in Gem and Ada counties, where it took an average of 31 and 34 days, respectively.


CONCLUSIONS

The speedometer reflects the state of the region’s housing market using housing inventory, price gains, home sales, interest rates, and larger economic factors.

Job growth continues to slow from the frenetic pace of the past few years but is still very impressive. Economic vitality leads to demand for homeownership and this bodes well for the Idaho market. Home sales are being held back by the lack of inventory and this is leading to higher prices. As such, it remains a sellers’ market so I have moved the needle just a little more in their direction.


ABOUT MATTHEW GARDNER

As Chief Economist for Windermere Real Estate, Matthew Gardner is responsible for analyzing and interpreting economic data and its impact on the real estate market on both a local and national level. Matthew has over 30 years of professional experience both in the U.S. and U.K.

Matthew also sits on the Washington State Governors Council of Economic Advisors; chairs the Board of Trustees at the WA Center for Real Estate Research; and is an Advisory Board Member at the Runstad Center for Real Estate Studies at the University of Washington where he also lectures in real estate economics.