
 Facebook
 X
X
 Pinterest
 Copy Link

The following analysis of select counties of the Utah real estate market is provided by Windermere Real Estate Chief Economist Matthew Gardner. We hope that this information may assist you with making better-informed real estate decisions. For further information about the housing market in your area, please don’t hesitate to contact your Windermere Agent.
ECONOMIC OVERVIEW
Utah’s non-agricultural employment rose by 42,100 jobs over the past 12 months, representing a solid growth rate of 2.8%. For perspective, the U.S growth rate is 1.4%. Year to date, Utah has added an average of 3,350 jobs per month, which is down from 4,200 per month last year. I expect we will continue to see modest slowing in employment gains as we move forward given the maturity of the economic cycle. Although the trend is slowing, I anticipate the state will see job growth around 2.8% in 2019. My early forecast for 2020 suggests that Utah will see employment growth of 2.6%.
In August, the state unemployment rate was 2.8%, below the 3.1% level of a year ago.
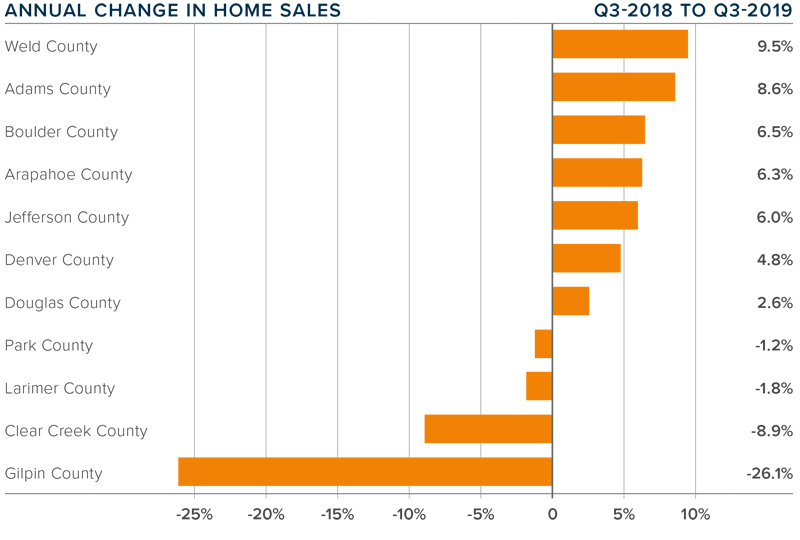
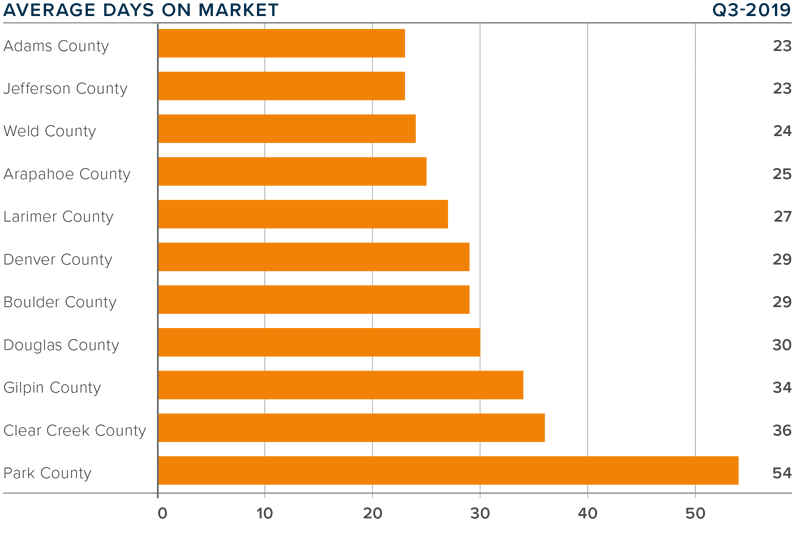
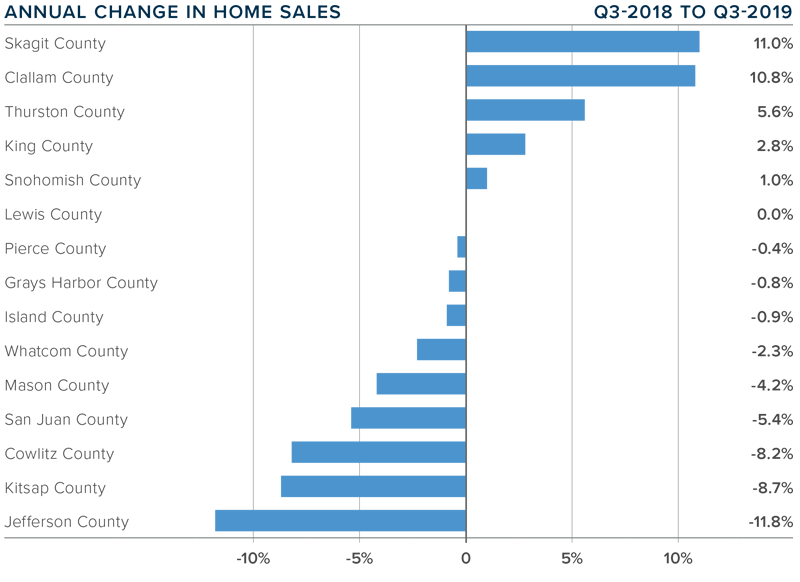
HOME SALES
- In the third quarter of 2019, 10,562 homes sold, representing a solid increase of 8.2% compared to the same period in 2018 and 4.3% higher than in the second quarter of this year.
- Total sales activity rose in all but the very small Morgan County. Year-over-year, sales rose by double digits in three counties, with impressive increases in Summit and Utah counties.
- The number of homes for sale in the third quarter was only 2.6% higher than in the same period a year ago but was 11% higher than the second quarter of this year. There continues to be significantly more choice in the market, which is good news for home buyers.
- Pending sales in the third quarter were up 13% compared to a year ago, but were 7% lower than in the second quarter, suggesting that closings in the final quarter of this year may drop from current levels.

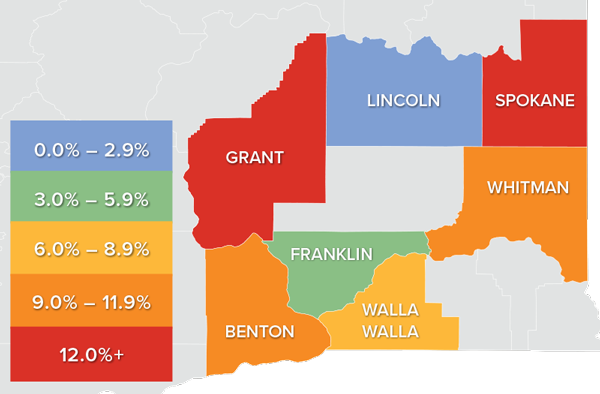
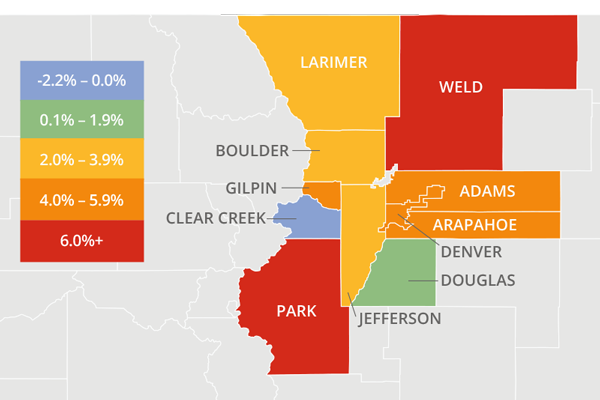
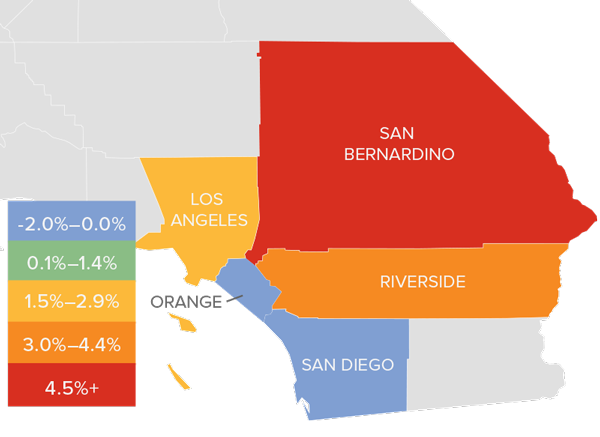
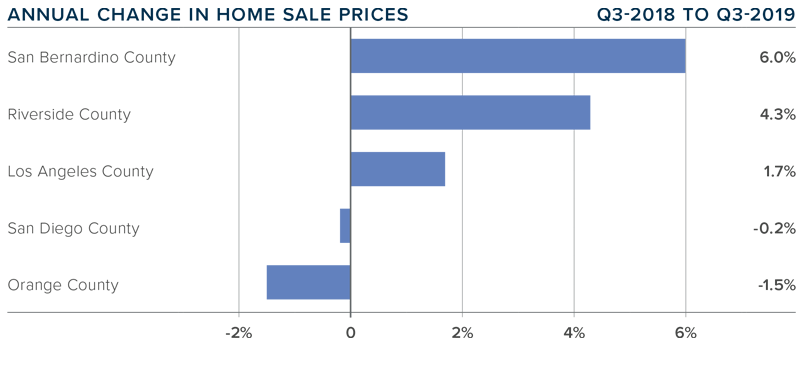
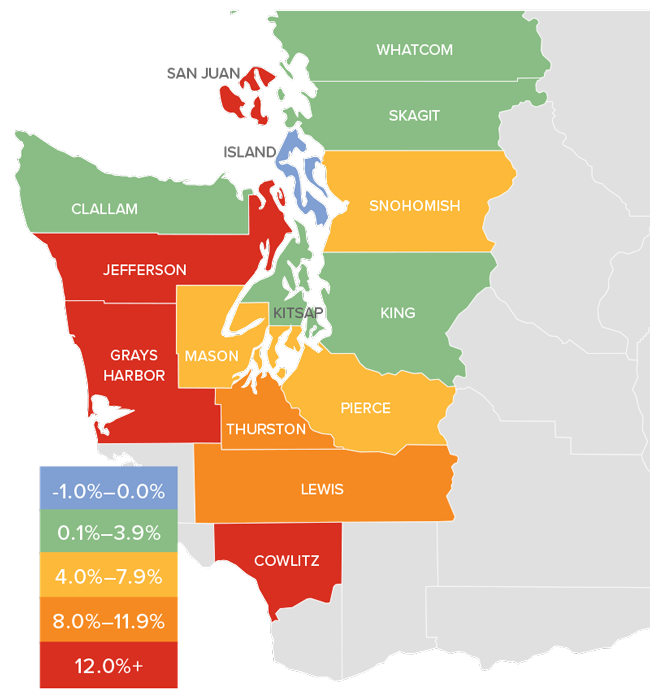
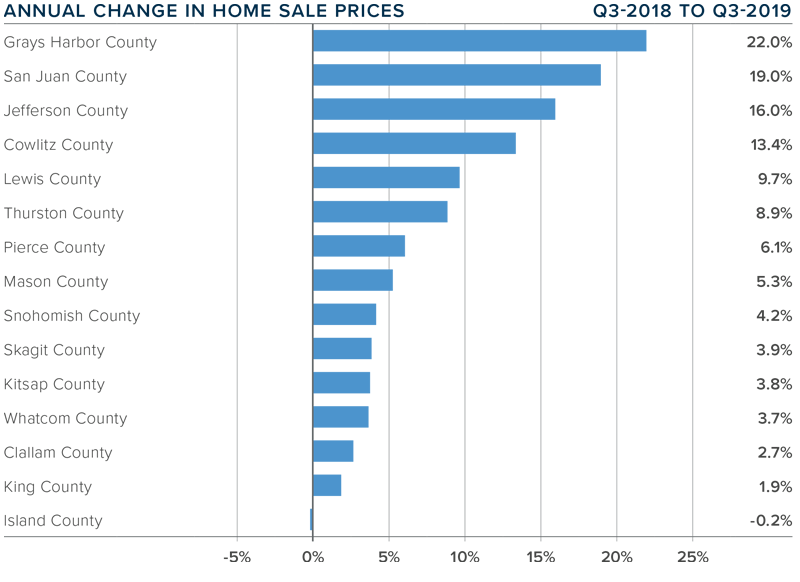
HOME PRICES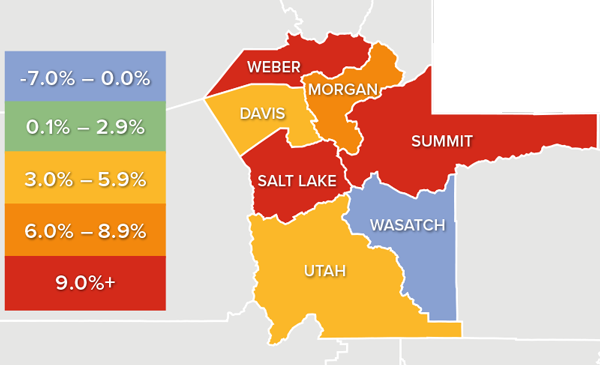
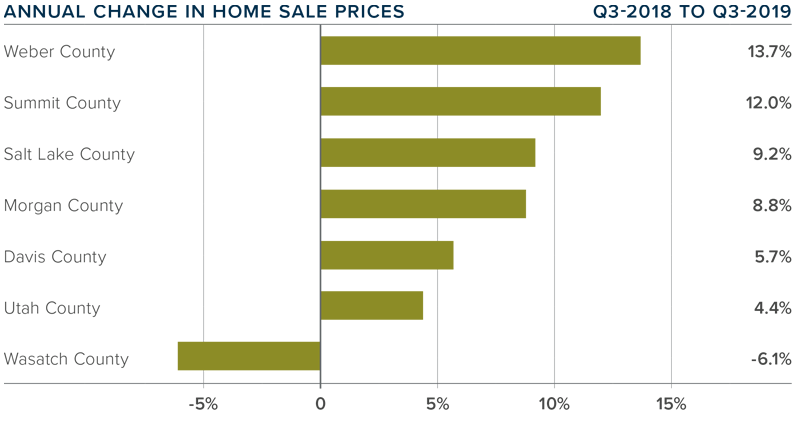
- The average home price in the region continued to rise in the third quarter, with a year-over-year increase of 9% to an average of $401,638. Sale prices were 2.5% higher than in the second quarter of this year.
- All but Wasatch County saw price increases compared to the same period a year ago. The contraction of price in Summit County was significant, but, because it is a small and very expensive area, I am not overly concerned this represents a pervasive trend.
- Appreciation was again strongest in Weber County, where sale prices were up by 13.7% to $298,333. As the most affordable market in the area, this is not surprising.
- The takeaway here is that home prices continue to appreciate at significant rates. I still expect to see some moderation in price growth as we move through the year and into 2020, but Utah will clearly continue to outperform the nation as a whole.
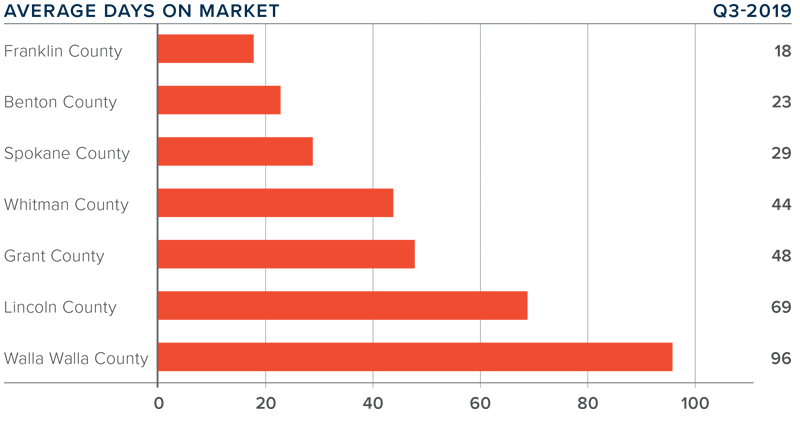
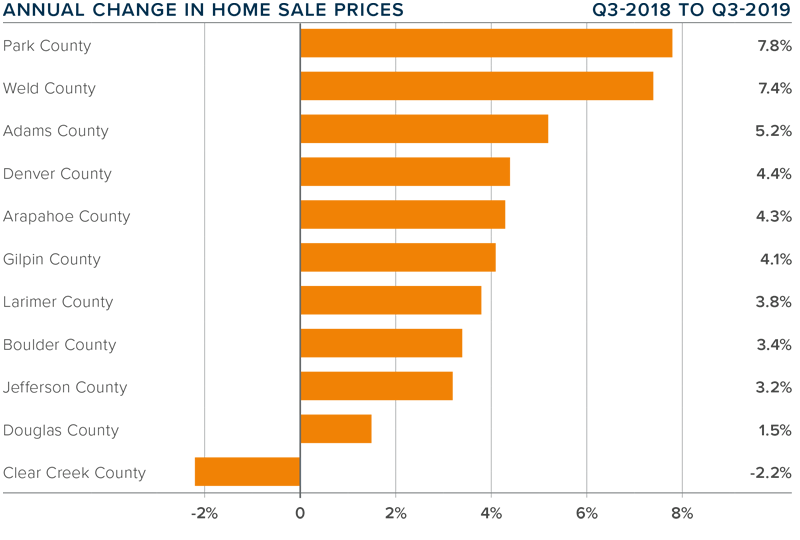
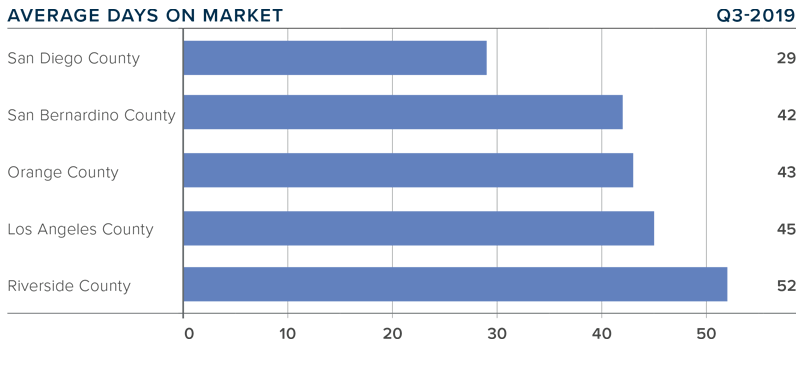
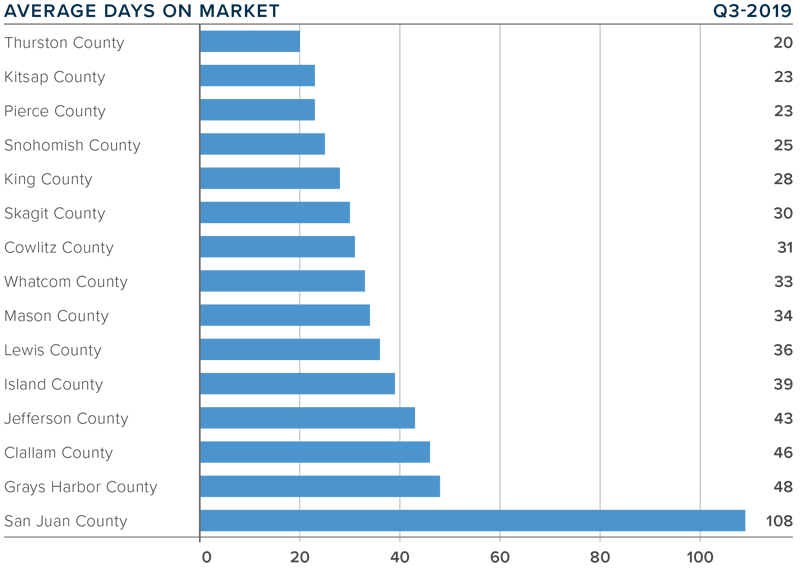
DAYS ON MARKET
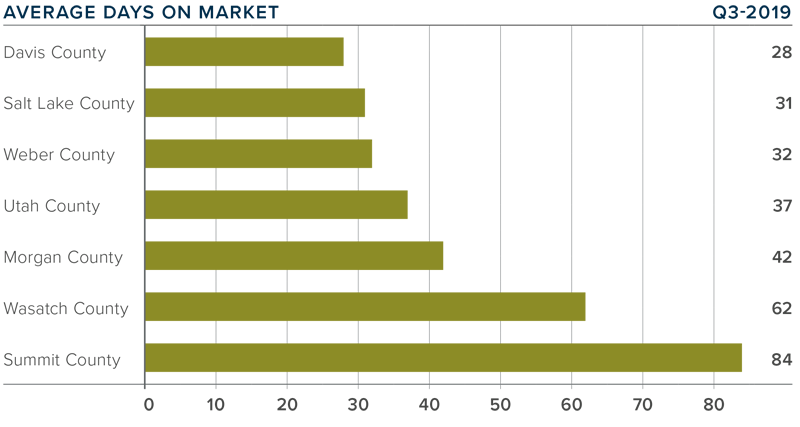
- The average number of days it took to sell a home in the counties covered by this report rose eight days compared to the third quarter of 2018.
- Homes sold fastest in Davis, Salt Lake, and Weber counties, and slowest in the expensive Summit County. All counties saw days-on-market rise compared to the third quarter of 2018.
- During the third quarter of this year, it took an average of 45 days to sell a home in the region, down from 53 days in the second quarter.
- The Utah economy is still outperforming almost all other states and this will continue to drive housing demand.
CONCLUSIONS
 This speedometer reflects the state of the region’s real estate market using housing inventory, price gains, home sales, interest rates, and larger economic factors.
For the third quarter of 2019, I have moved the needle a little more in favor of sellers. Although the area has seen a modest increase in the number of homes for sale and days-on-market, prices, pending sales, and closed sales are higher, which certainly favors sellers.
ABOUT MATTHEW GARDNER
 As Chief Economist for Windermere Real Estate, Matthew Gardner is responsible for analyzing and interpreting economic data and its impact on the real estate market on both a local and national level. Matthew has over 30 years of professional experience both in the U.S. and U.K.
In addition to his day-to-day responsibilities, Matthew sits on the Washington State Governors Council of Economic Advisors; chairs the Board of Trustees at the Washington Center for Real Estate Research at the University of Washington; and is an Advisory Board Member at the Runstad Center for Real Estate Studies at the University of Washington where he also lectures in real estate economics.

 Year-over-year, the average home price in Eastern Washington rose by a significant 12.1% to $303,658. Prices were also 3.4% higher than in the second quarter.
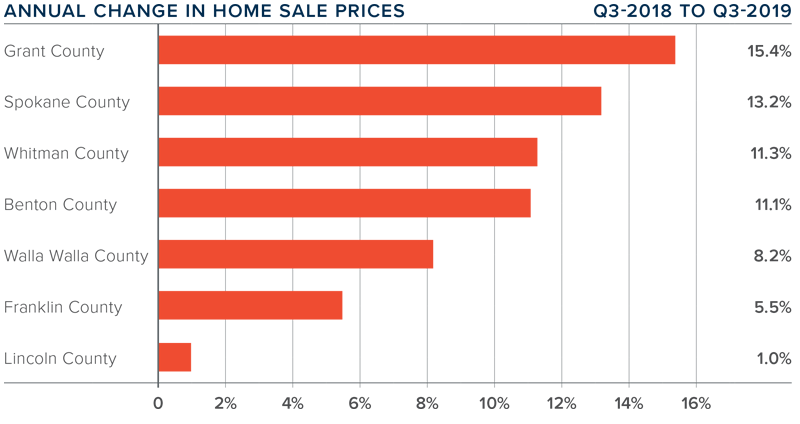
 This speedometer reflects the state of the region’s real estate market using housing inventory, price gains, home sales, interest rates, and larger economic factors.
 As Chief Economist for Windermere Real Estate, Matthew Gardner is responsible for analyzing and interpreting economic data and its impact on the real estate market on both a local and national level. Matthew has over 30 years of professional experience both in the U.S. and U.K.
 This speedometer reflects the state of the region’s real estate market using housing inventory, price gains, home sales, interest rates, and larger economic factors.
 The speedometer reflects the state of the region’s real estate market using housing inventory, price gains, home sales, interest rates, and larger economic factors.

 This speedometer reflects the state of the region’s real estate market using housing inventory, price gains, home sales, interest rates, and larger economic factors. I am leaving the needle in the same position as the first and second quarters, as demand appears to still be strong.


")


