

The following analysis of select neighborhoods in the Park City real estate market is provided by Windermere Real Estate Chief Economist Matthew Gardner. We hope that this information may assist you with making better-informed real estate decisions. For further information about the housing market in your area, please don’t hesitate to contact your Windermere Real Estate agent.
Regional Economic Overview
The summer months saw continued growth in Utah’s labor market, which had already recovered all of the jobs lost to COVID-19 earlier this spring. The latest data available (August 2021) showed non-agricultural employment 48,100 jobs higher than the pre-pandemic peak. With the healthy growth in jobs, the unemployment rate currently stands at 2.6%, a level that has not been seen since before the pandemic hit. As impressive as the current jobless rate is, it is also worth noting that unemployment continued to fall even as the labor force expanded to a point never seen in the state before. Utah’s economy is currently in great shape, and short of any unforeseeable events, I see no reason why anything would derail the impressive growth the area has experienced.
park city, utah Home Sales
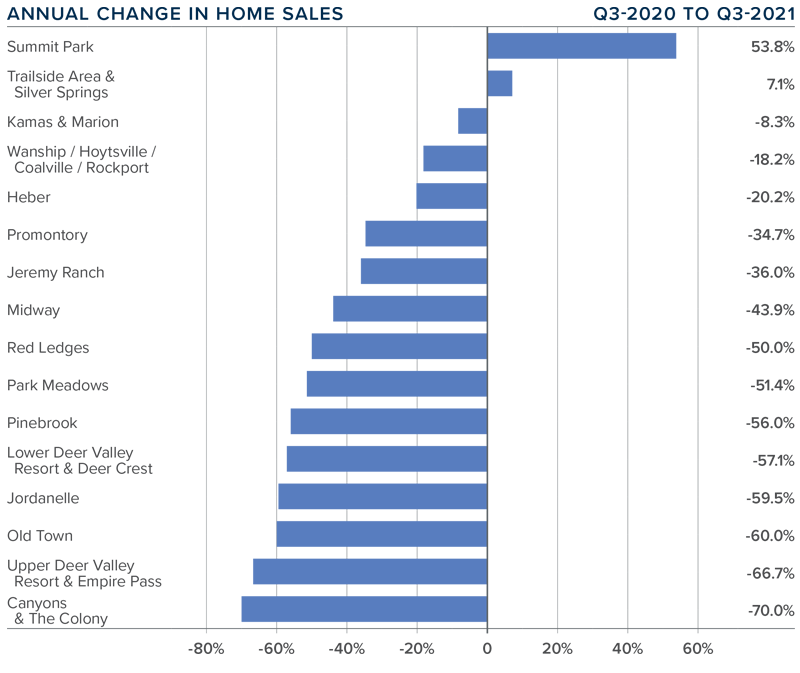
❱ In the third quarter of 2021, 73 homes sold, which is 47.9% lower than in the same quarter a year ago, and 3.9% lower than in the second quarter of this year.
❱ Year-over-year, sales rose in Summit Park and Trailside Area/Silver Springs but were lower in the balance of the neighborhoods contained in this report. Compared to the second quarter of 2021, sales were higher in six neighborhoods, static in one, and fell in the remaining eight.
❱ Lower home sales are primarily a function of the number of homes for sale. With 48% fewer homes on the market than a year ago and 3.9% fewer homes than in the second quarter of this year, it’s not surprising that sales slowed.
❱ Pending home sales were down 58.7% compared to last year and were 2.6% lower than in the second quarter of the year. This, combined with significant supply constraints, suggests that home sales in final quarter of the year may not be strong.
park city, utah Home Prices
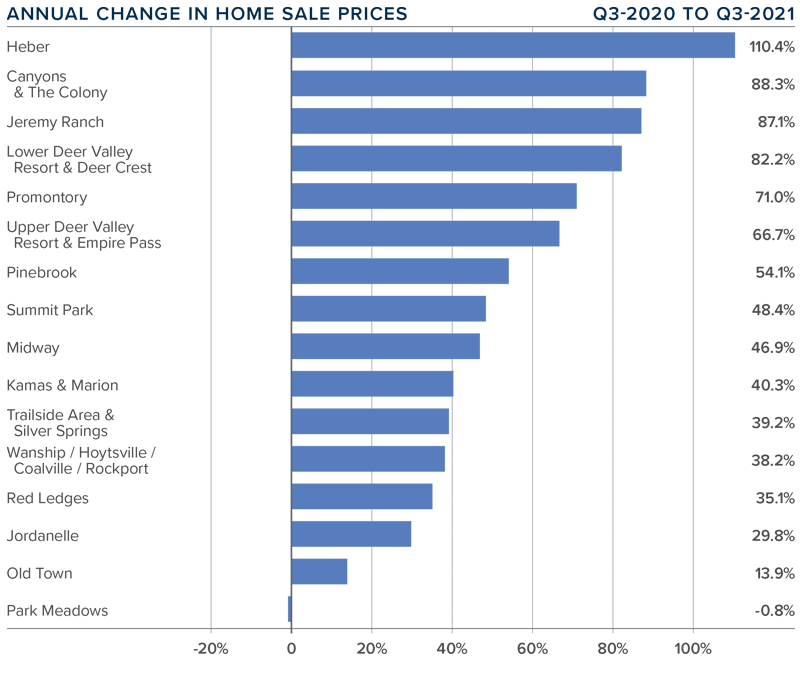
❱ The average home price in the Park City neighborhoods contained in this report rose 29.7% year over year to $2.26 million but was 3.6% lower than in the previous quarter.
❱ The Wanship, Hoytsville, Coalville, & Rockport market is the only one where prices were below $1 million in third quarter. The most expensive home sales were again in the Canyons/The Colony market, where the average price was $11.83 million.
❱ Prices rose in all neighborhoods other than Park Meadows, though the drop in prices there was marginal.
❱ Compared to the second quarter of the year, prices rose in all but four neighborhoods: Old Town, Park Meadows, Midway, and Wanship, Hoytsville, Coalville and Rockport.
Days on Market
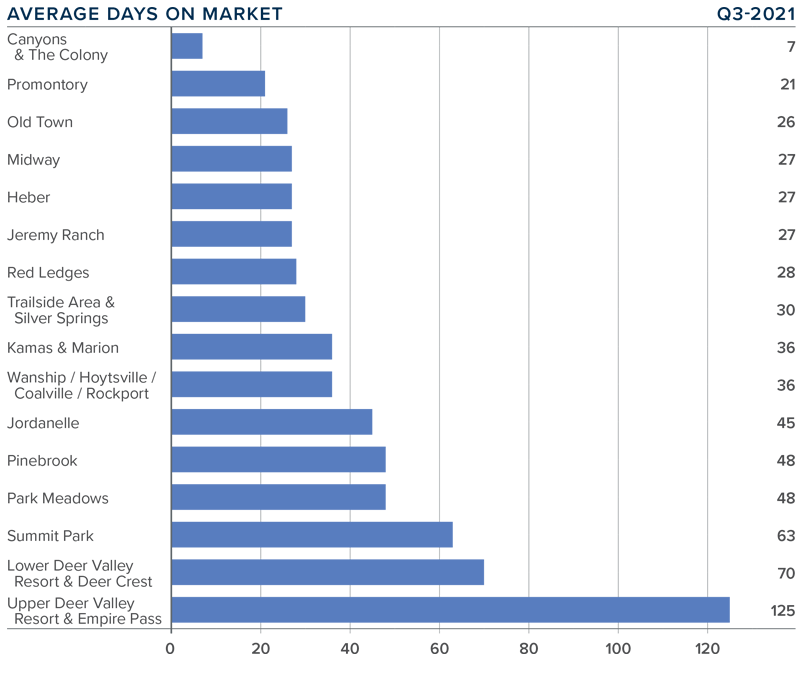
❱ The average time it took to sell a home in the Park City area fell 41 days compared to the same period a year ago.
❱ While days on market fell overall year-over-year, when you compare the third quarter to the second quarter, the amount of time it took to sell a home rose four days everywhere except Canyons/The Colony and Old Town.
❱ In the third quarter, it took an average of 41 days to sell a home, with homes selling fastest in the Canyons/The Colony neighborhood, and slowest in Upper Deer Valley Resort and Empire Pass.
❱ In small, expensive markets, such as those in Park City, it’s not surprising to see the speed at which homes sell swing wildly from one quarter to the next. There is clearly still buyer demand, but given high average prices, it’s taking a little longer for homes to sell.
Conclusions
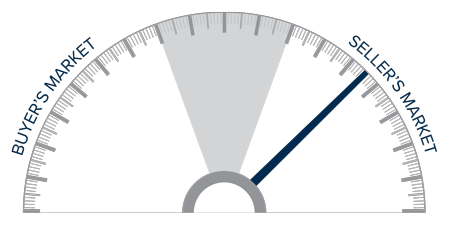
This speedometer reflects the state of the region’s real estate market using housing inventory, price gains, home sales, interest rates, and larger economic factors.
Utah’s economy stands on very solid ground, which, when placed alongside historically low mortgage rates, leads to increased home buying activity. While the number of days it takes to sell a home has risen modestly compared to second quarter, home sellers still have the upper hand. As such, I have moved the needle a little more in their favor.
About Matthew Gardner

As Chief Economist for Windermere Real Estate, Matthew Gardner is responsible for analyzing and interpreting economic data and its impact on the real estate market on both a local and national level. Matthew has over 30 years of professional experience both in the U.S. and U.K.
In addition to his day-to-day responsibilities, Matthew sits on the Washington State Governors Council of Economic Advisors; chairs the Board of Trustees at the Washington Center for Real Estate Research at the University of Washington; and is an Advisory Board Member at the Runstad Center for Real Estate Studies at the University of Washington where he also lectures in real estate economics.


")


