The following analysis of select counties of the Utah real estate market is provided by Windermere Real Estate Chief Economist Matthew Gardner. We hope that this information may assist you with making better-informed real estate decisions. For further information about the housing market in your area, please don’t hesitate to contact your Windermere Real Estate agent.
Regional Economic Overview
Utah closed 2021 strongly with solid employment gains and an annual growth rate of 4.7%. It has been almost a year since the state recovered all the jobs lost due to the pandemic—a remarkable statistic. Even more impressive is that the employment level is now more than 61,000 jobs higher than before COVID-19 hit. The counties covered by this report have added almost 50,000 new jobs over the past year, representing a growth rate of 3.8%. Such robust growth has driven the unemployment rate down to just 2.1%, a level not seen since the Labor Department started keeping records back in 1976. Utah’s economic growth continues to impress. I believe it could be even better if the number of people in the workforce was rising significantly, which isn’t the case. But all in all, the employment picture is extremely positive.
utah Home Sales
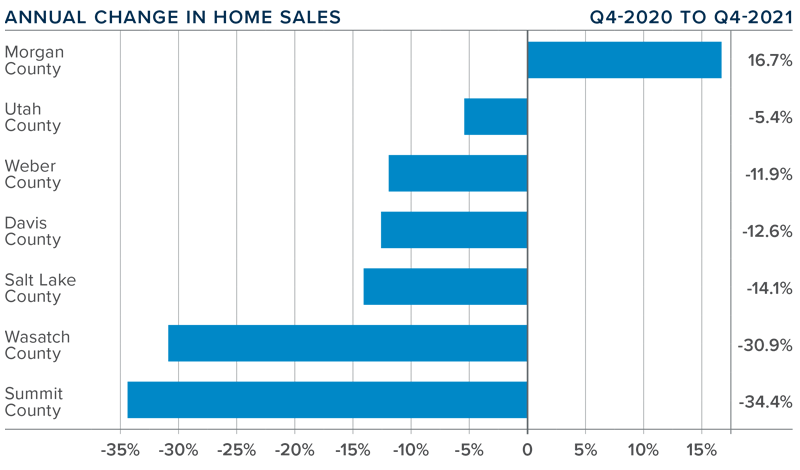
❱ In the final quarter of 2021, 9,158 homes sold, representing a 13.2% drop from a year ago and 11.6% lower than in the third quarter.
❱ Year-over-year, sales dropped in all areas except for Morgan County. Sales slowed in all counties other than Weber compared to the third quarter of 2021.
❱ The drop in sales between the third and fourth quarters doesn’t concern me and can be attributed to seasonal factors. Lower sales compared to a year ago may be due to the number of homes for sale, which was 11.2% lower than in the same quarter of 2020.
❱ Pending sales, which are an indicator of future closings, were down 4% relative to the third quarter, suggesting that sales in the first quarter of 2022 may not rise significantly.
utah Home Prices
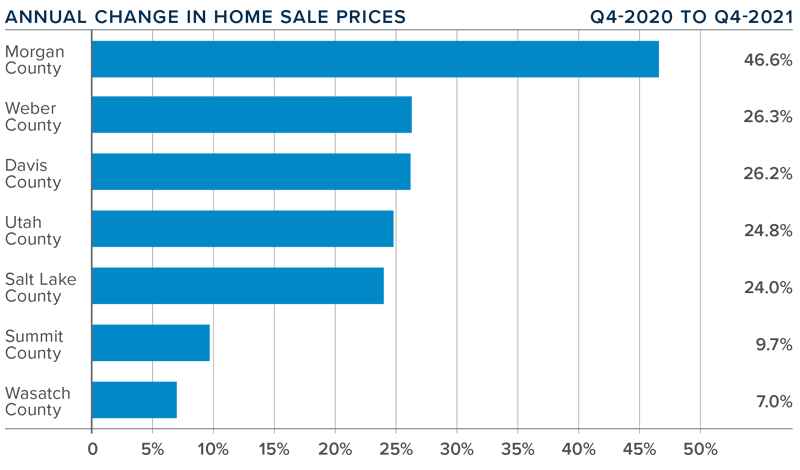
❱ Given Utah’s strong economy, it’s not surprising that home prices continue to rise significantly. Year over year, prices rose 17.3% to an average of $602,369. Prices were also .3% higher than in the third quarter of 2021.
❱ Compared to the third quarter, prices rose in Salt Lake, Utah, and Summit counties, but were down in the balance of the market areas.
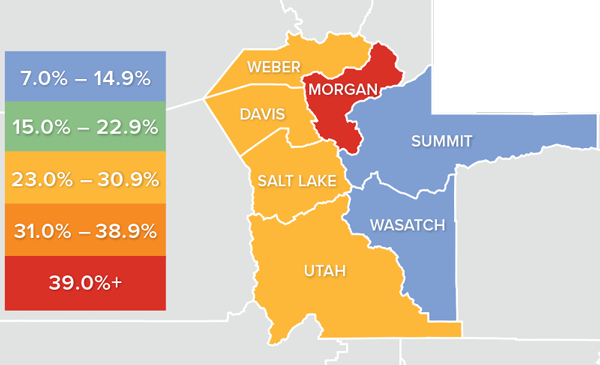
❱ All areas contained in the report except for Summit and Wasatch counties saw prices rise by double digits. Morgan County’s rise was particularly impressive.
❱ The pace of price growth has slowed, but only very modestly. Whether this was a function of mortgage rates, which started rising in the quarter, is unclear. I expect rates to continue rising as we move through the year, which may have a compressing effect on price growth.
Days on Market
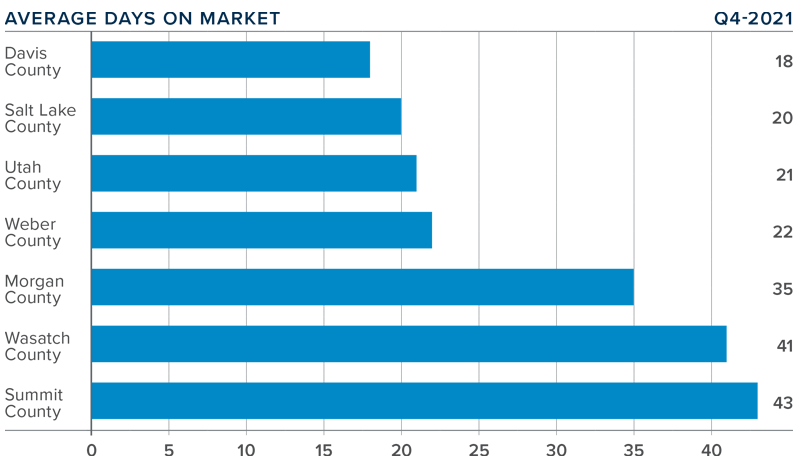
❱ The average amount of time it took to sell a home in the counties covered by this report dropped five days compared to the final quarter of 2020.
❱ Homes sold fastest in Davis County, with all but two counties seeing average time on market drop. Relative to a year ago, the greatest decline in market time was in Summit County, where it took 29 fewer days to sell a home.
❱ During the quarter, it took an average of 28 days to sell a home in the region. Although this is lower than a year ago, it was up 6 days compared to the third quarter of the year.
❱ The modest increase in market time is not very surprising given the frenetic market in 2020. The question is whether the pace of sales will increase as we move into the spring selling season.
Conclusions
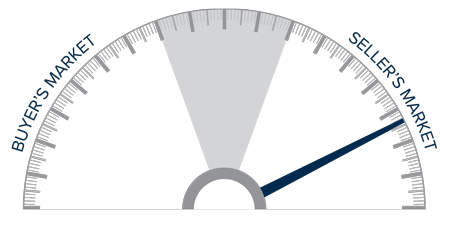
This speedometer reflects the state of the region’s real estate market using housing inventory, price gains, home sales, interest rates, and larger economic factors.
Utah’s rock-solid economy has been a major boost to the housing market. Prices continue to increase at a very impressive pace, but we will have to wait and see if this is sustainable given that mortgage rates are expected to continue rising in the coming months.
My current 2022 forecast suggests that, despite a very modest decrease in the pace of price growth compared to 2021, prices will rise by more than 10% in all the counties in this report. A few may even rise by close to 20%.
To say that it is a seller’s market in Utah would be an understatement. In the coming year, I don’t expect the housing supply to satisfy demand, which will cause prices to rise higher even in the face of rising mortgage rates. As such, I have moved the needle a little more toward sellers.
About Matthew Gardner

As Chief Economist for Windermere Real Estate, Matthew Gardner is responsible for analyzing and interpreting economic data and its impact on the real estate market on both a local and national level. Matthew has over 30 years of professional experience both in the U.S. and U.K.
In addition to his day-to-day responsibilities, Matthew sits on the Washington State Governors Council of Economic Advisors; chairs the Board of Trustees at the Washington Center for Real Estate Research at the University of Washington; and is an Advisory Board Member at the Runstad Center for Real Estate Studies at the University of Washington where he also lectures in real estate economics.
 Facebook
 X
X
 Pinterest
 Copy Link


