

The following analysis of select counties of the Colorado real estate market is provided by Windermere Real Estate. We hope that this information may assist you with making better-informed real estate decisions. For further information about the housing market in your area, please don’t hesitate to contact your Windermere Real Estate agent.
Regional Economic Overview
The pace of job gains in Colorado picked up in the third quarter. The state added 42,700 new jobs over the past year, representing a growth rate of 1.5%. That said, growth has certainly slowed from what we saw over the past two years. The Denver and Colorado Springs metro areas saw jobs rise by only .1%; the Boulder metro area saw jobs rise .2%; Greeley rose .6%; and the Fort Collins metro area grew 1.7%.
The state unemployment rate in August was 3.1%, up from 2.6% in the third quarter of 2022. By metro area, jobless rates ranged from a low of 3.2% in Boulder to a high of 3.8% in the Colorado Springs metropolitan area.
Colorado Home Sales
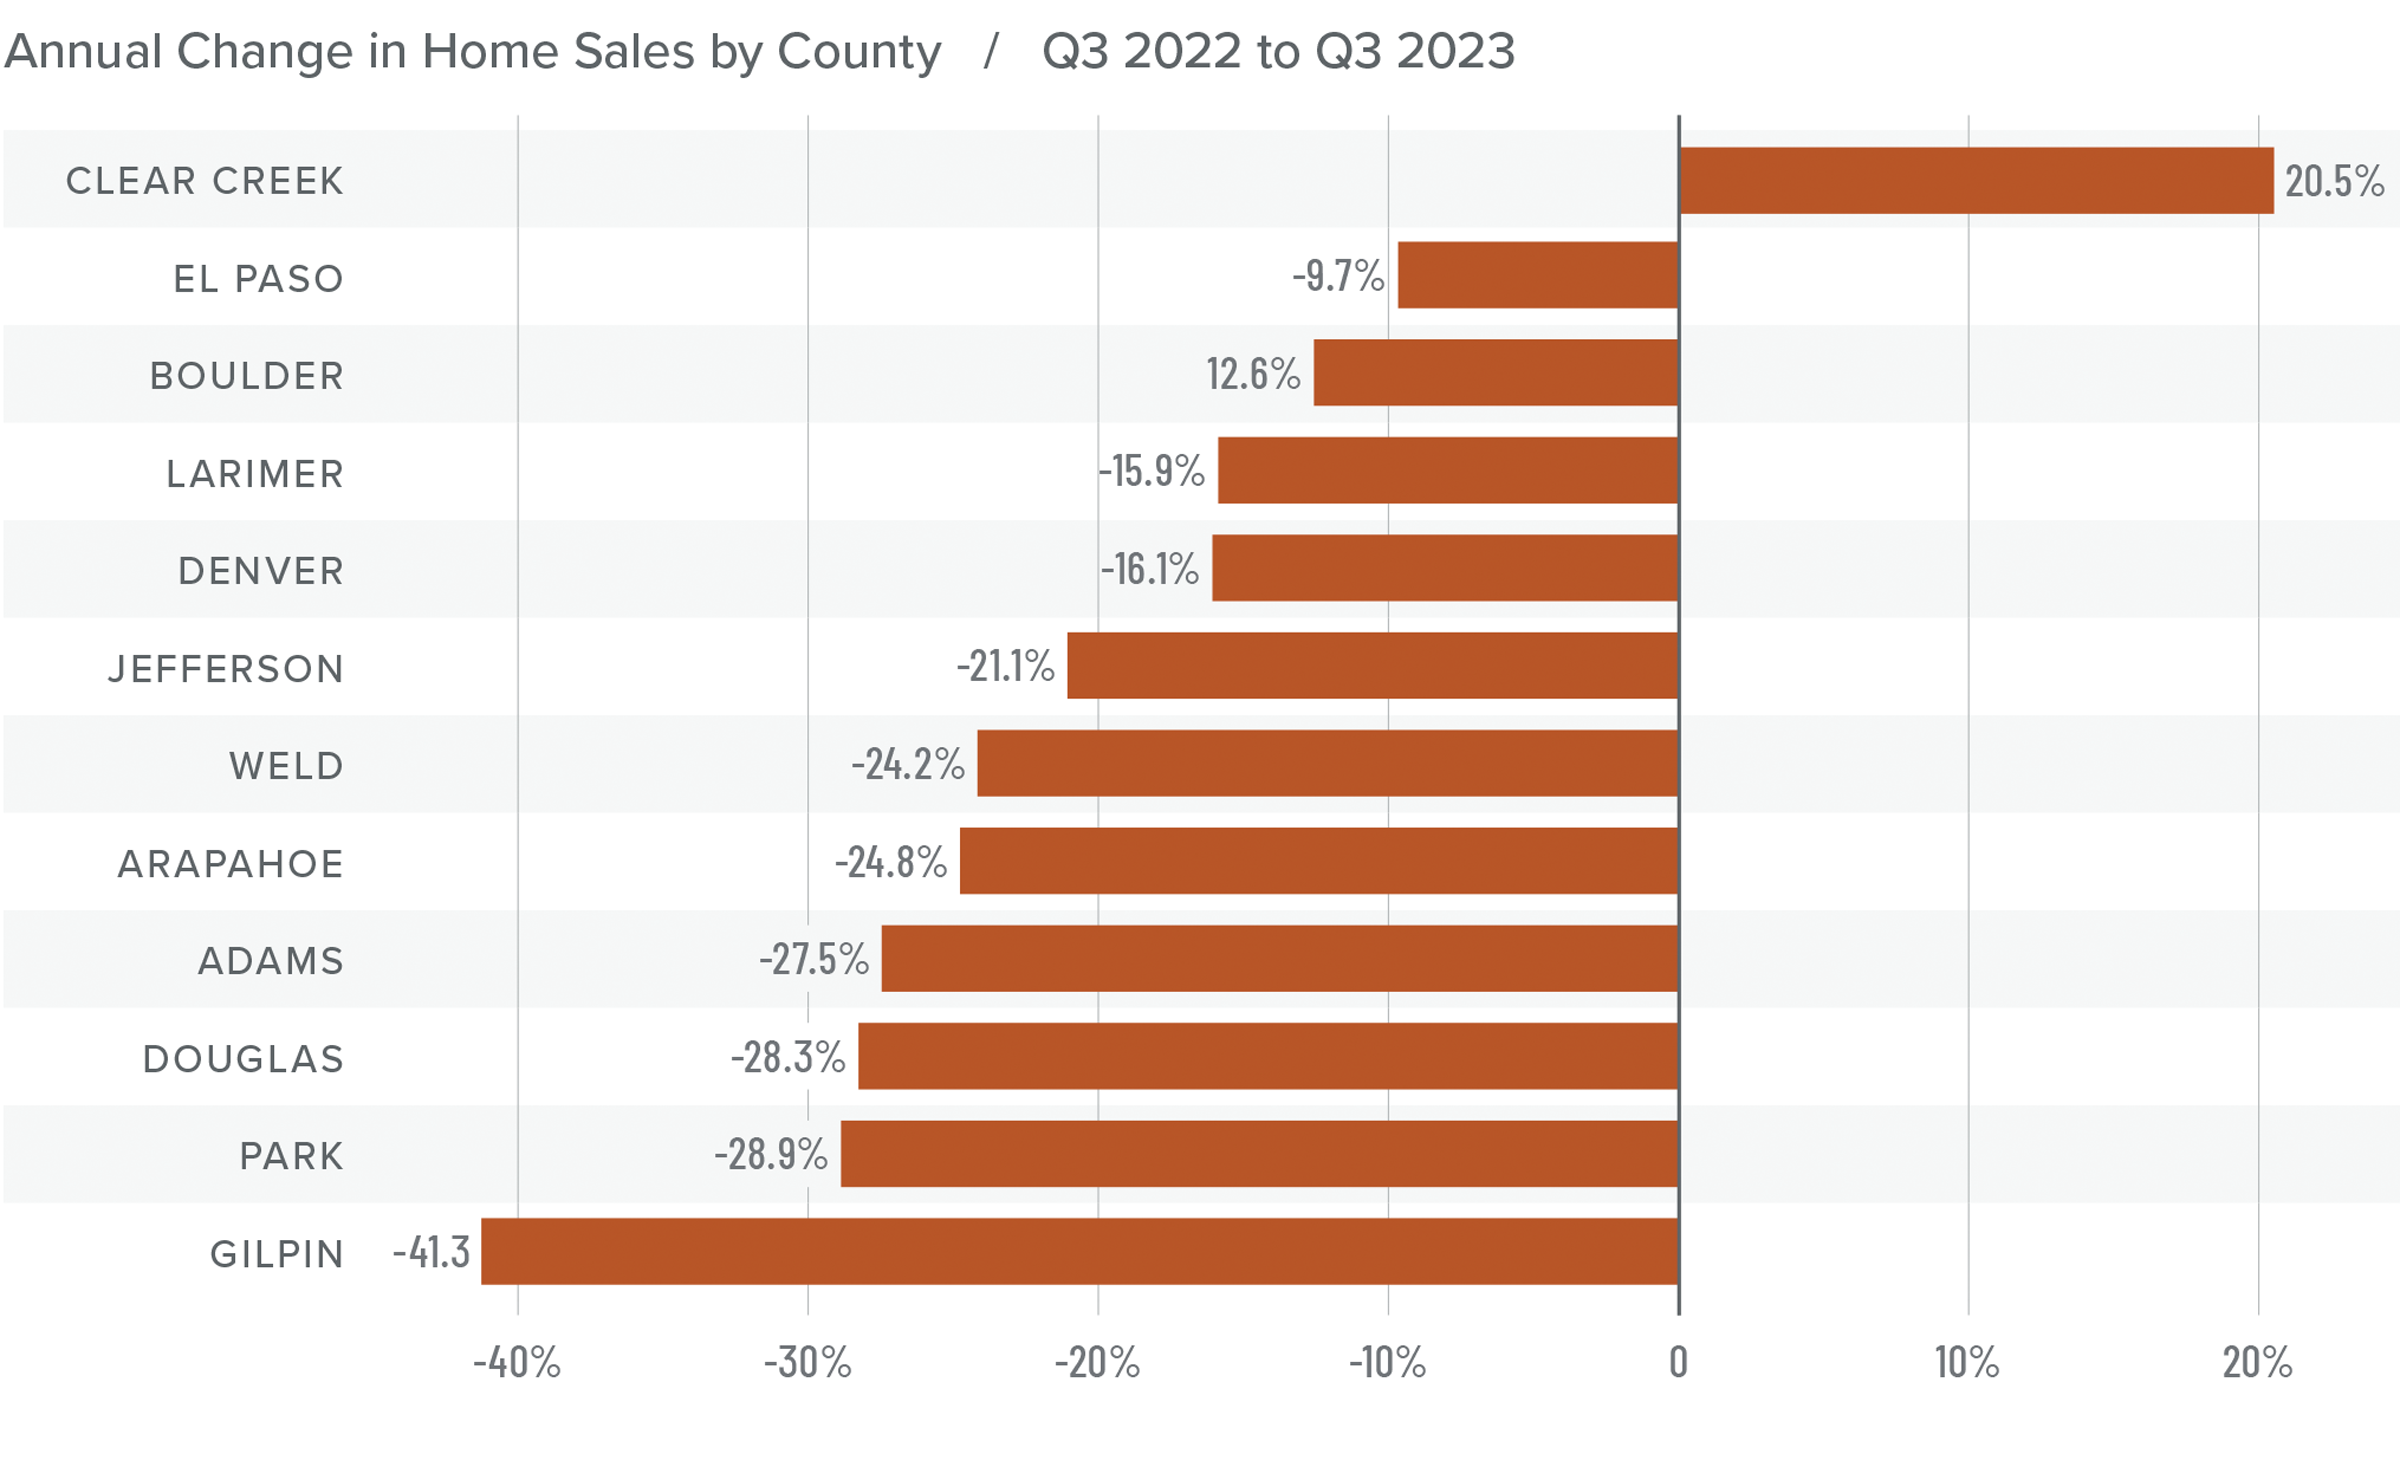
❱ In the third quarter of 2023, 8,597 homes sold, representing a drop of 20.9% from the same period in 2022. Sales were down 11.2% from the second quarter of this year.
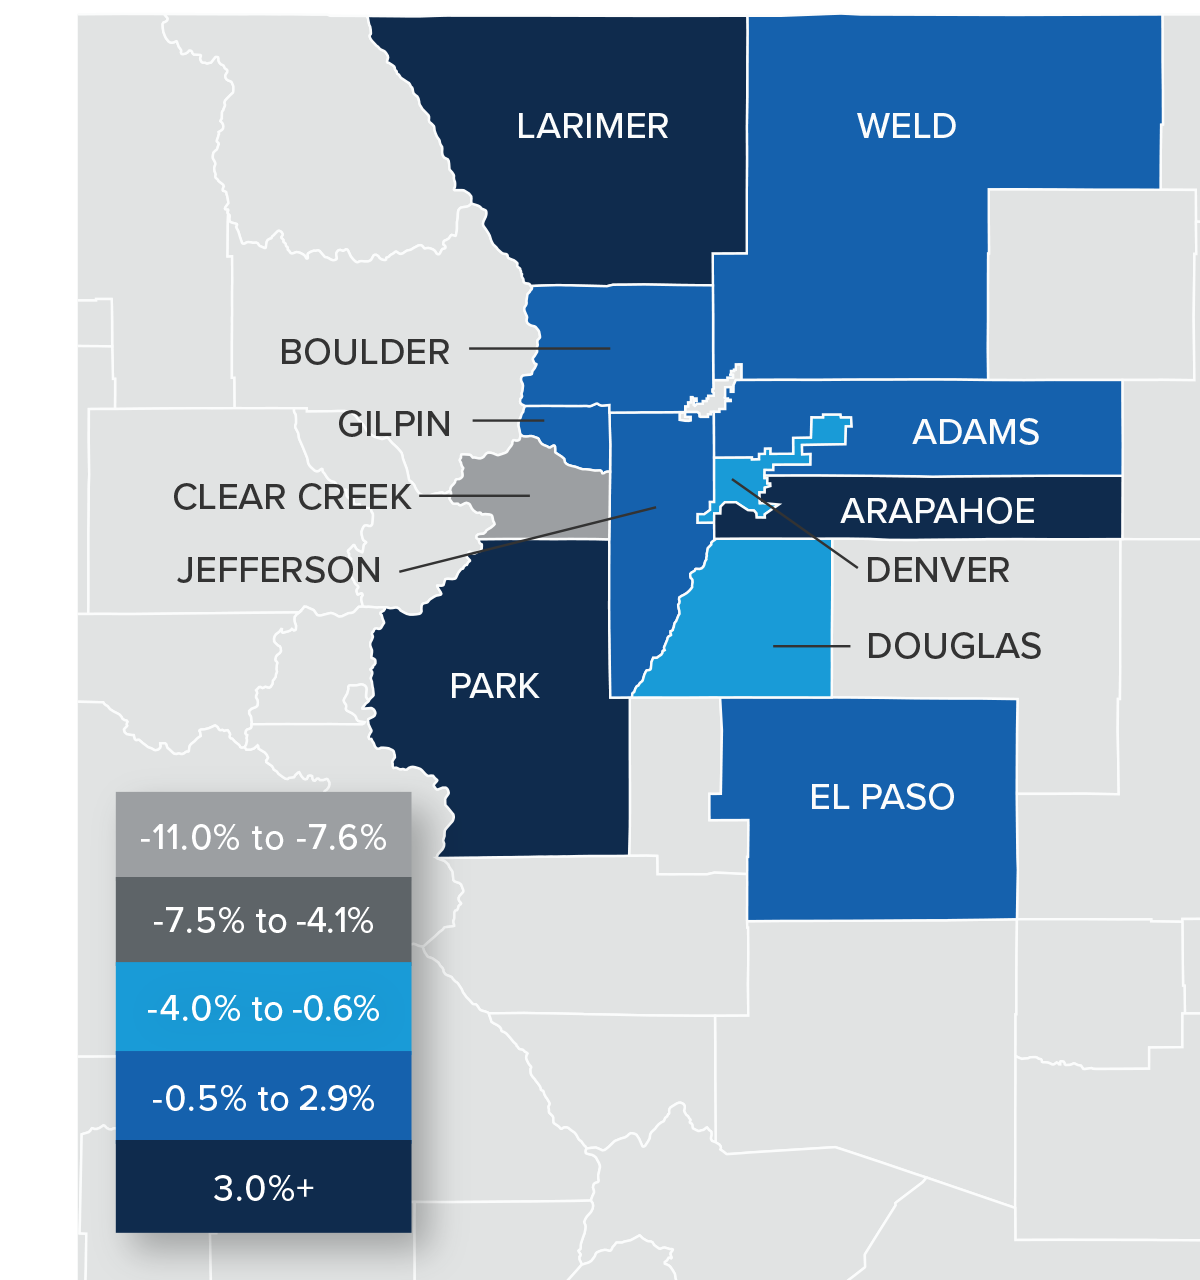
❱ Year over year, sales fell across all the markets covered by this report except for Clear Creek County. Compared to the second quarter of this year, sales fell in every county except Clear Creek and Gilpin.
❱ The year-over-year drop in sales is not a surprise given that mortgage rates are significantly higher today and inventory is lower. What is of some concern is that inventory was up more than 36% from the second quarter, yet sales still fell. It appears that higher mortgage rates are now having an impact on the market.
❱ Pending sales, which are an indicator of future closings, fell 14.3% from the second quarter, suggesting that sales may be lackluster in the final quarter of the year.
Colorado Home Prices
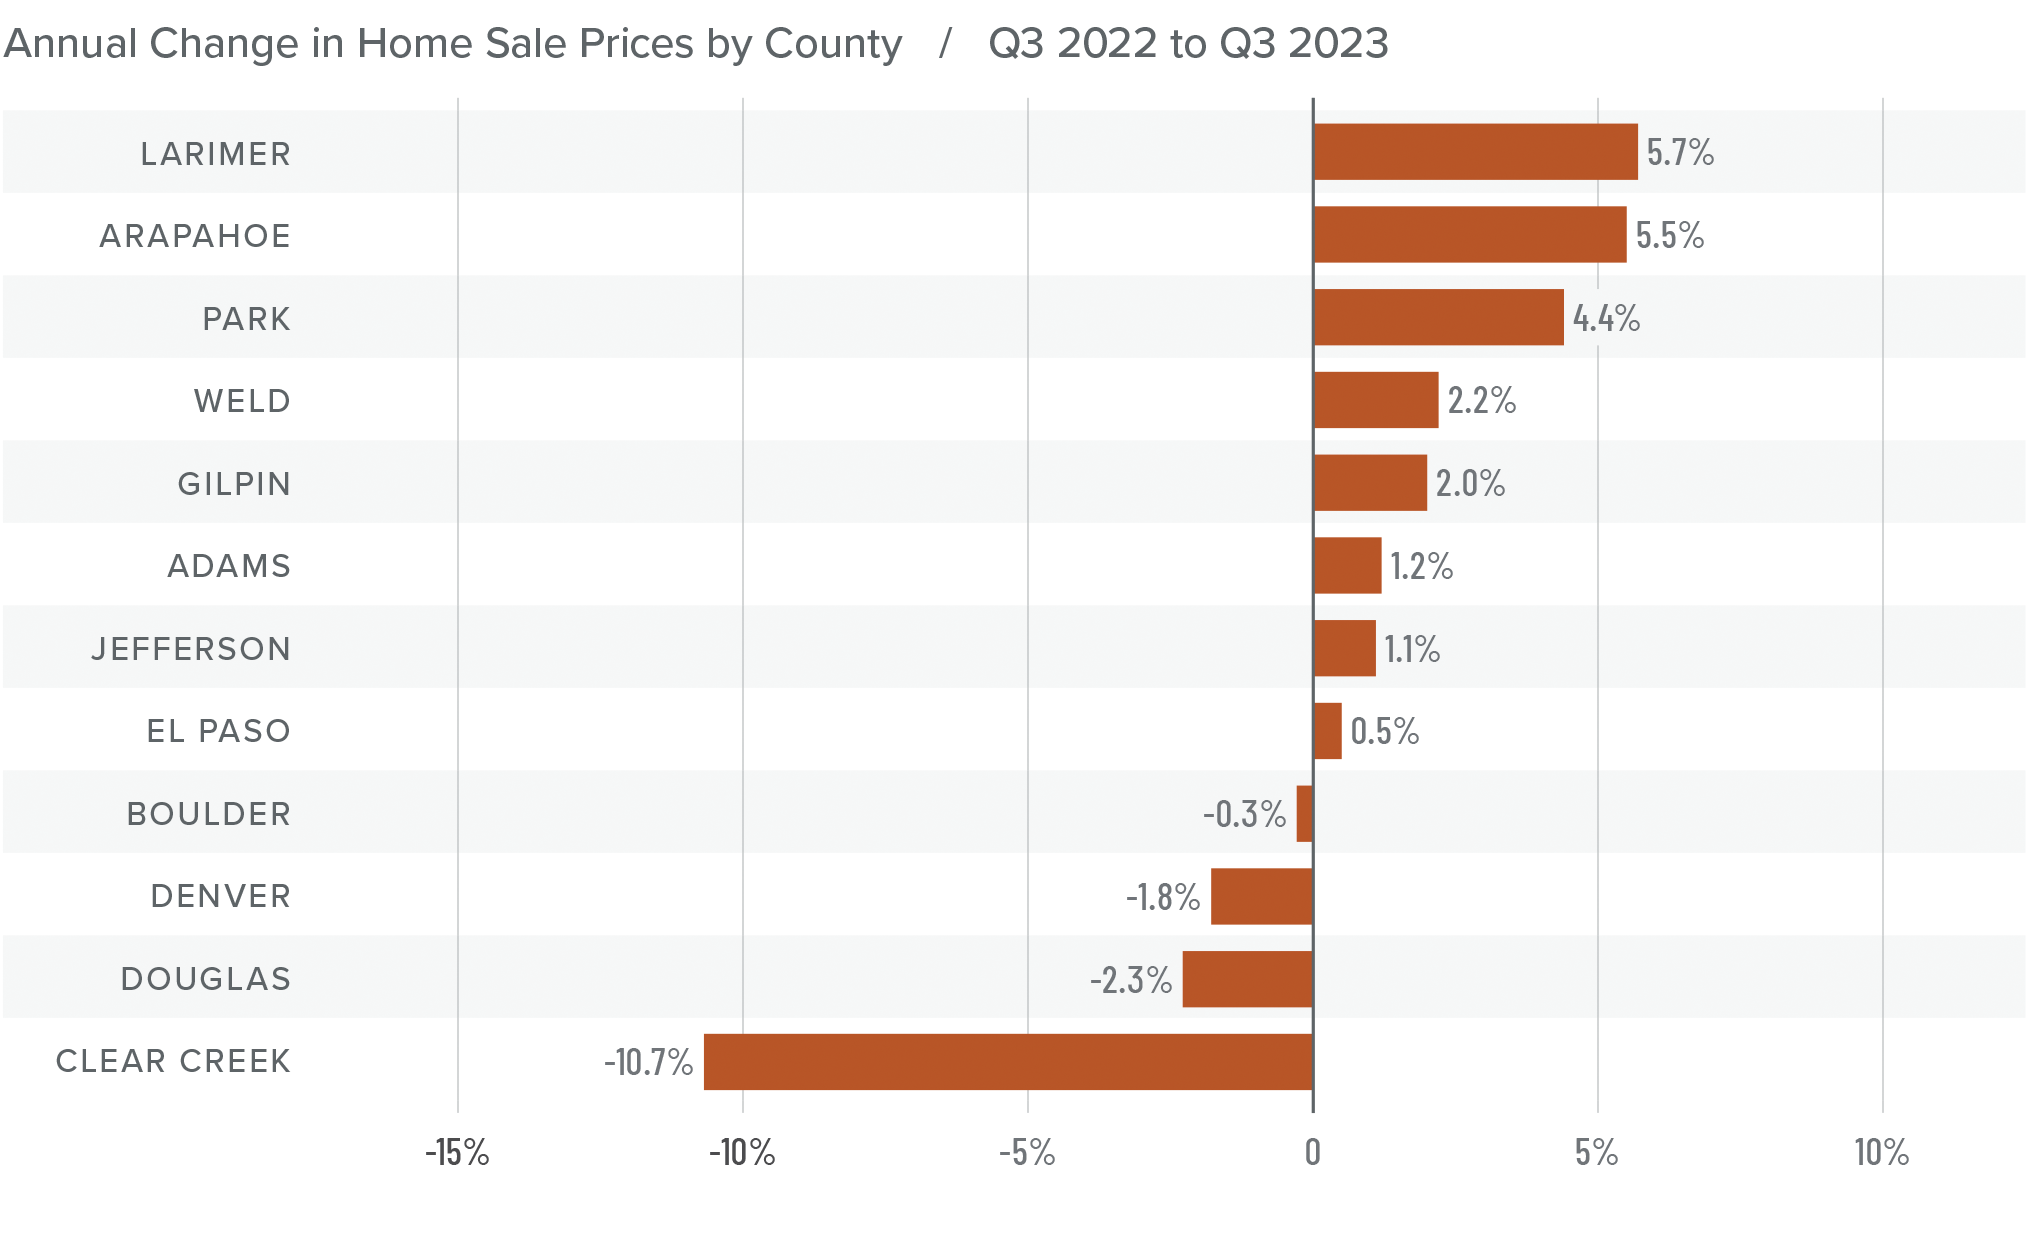
❱ The average home sale price rose 1.7% from the same period in 2022 to $665,725. Prices were 1.1% lower than in the second quarter of this year.
❱ Compared to the second quarter, prices rose in Adams, Larimer, Gilpin, and El Paso counties but fell in the balance of the market areas.
❱ Year over year, prices rose in eight counties and fell in four. Clear Creek County saw a significant drop but since very few home sales happen there, it’s not uncommon for prices to experience significant swings.
❱ List prices are a leading indicator that I follow closely, and given that they were lower in all markets except Weld County compared to the second quarter of this year, it appears that sellers have started reacting to higher mortgage rates. This will likely lead home prices to fall a little further as we move toward the end of the year.
Mortgage Rates
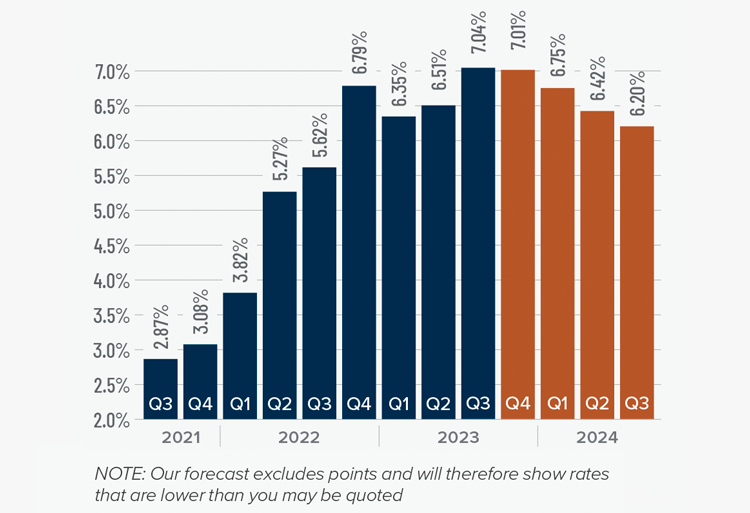
Mortgage rates continued trending higher in the third quarter of 2023 and are now at levels we have not seen since the fall of 2000. Mortgage rates are tied to the interest rate (yield) on 10-year treasuries, and they move in the opposite direction of the economy. Unfortunately for mortgage rates, the economy remains relatively buoyant, and though inflation is down significantly from its high, it is still elevated. These major factors and many minor ones are pushing Treasury yields higher, which is pushing mortgage rates up. Given the current position of the Federal Reserve, which intends to keep rates “higher for longer,” it is unlikely that home buyers will get much reprieve when it comes to borrowing costs any time soon.
With such a persistently positive economy, I have had to revise my forecast yet again. I now believe rates will hold at current levels before starting to trend down in the spring of next year.
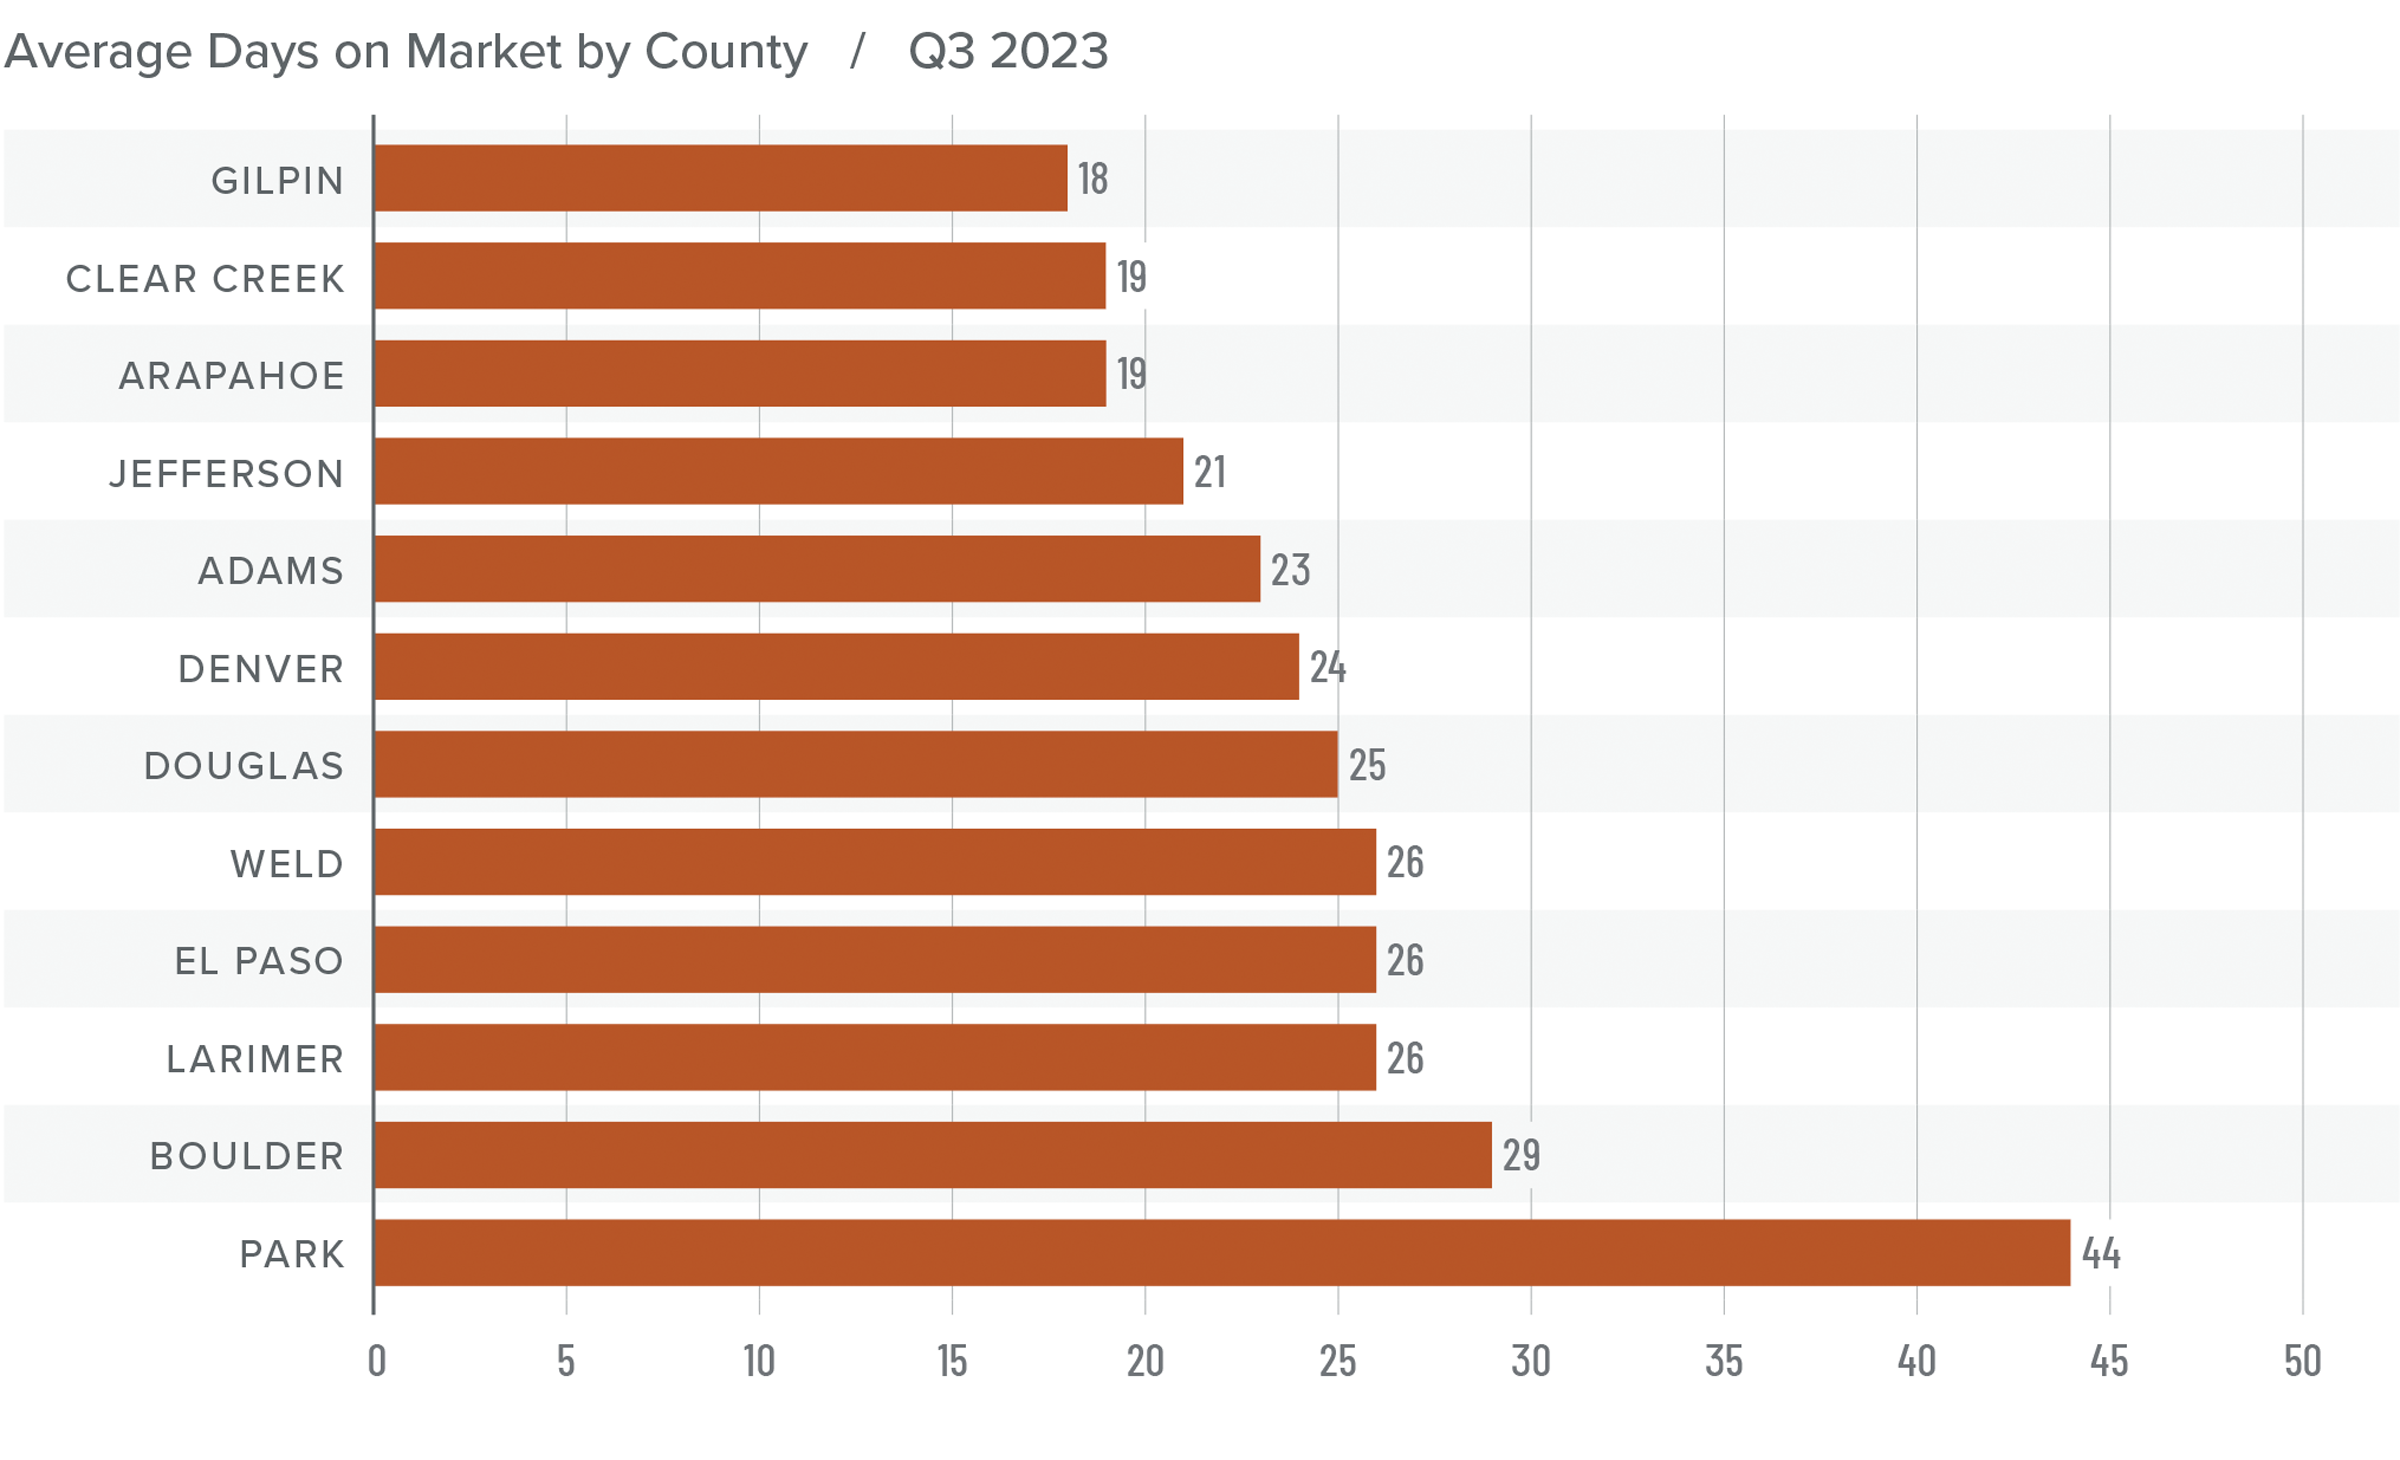
Colorado Days on Market
❱ The average time it took to sell a home in the markets contained in this report rose four days compared to the same period in 2022.
❱ The length of time it took to sell a home compared to the second quarter of this year fell in Boulder, Clear Creek, Gilpin, and Park counties, but rose across the rest of the market areas.
❱ It took an average of 25 days to sell a home in the region, which is five fewer days than in the second quarter of 2023.
❱ Despite having more choice in the market, buyers picked up the pace a little in the quarter. It remains to be seen whether this will continue given stubbornly high financing costs.
Conclusions
This speedometer reflects the state of the region’s real estate market using housing inventory, price gains, home sales, interest rates, and larger economic factors.
Job growth is still significantly slower than it has been over the past two years. A slowing economy and decades-high mortgage rates are a recipe for a sluggish housing market, but Colorado appears to be rather resilient.
That said, with rising inventories, slowing sales, and lower list prices, it can hardly be described as a traditional seller’s market. In last quarter’s market update it was said that sellers appeared to have the edge over buyers, but it’s now clear that the market is starting to respond to higher mortgage rates.

Although the market conditions described above favor home buyers, they’re not totally in the driver’s seat. As such, the needle moved into the balanced quadrant. As we move through the winter and into the spring of 2024, we hope that we will have more clarity on the direction of the housing market.


")


