Market News August 1, 2018

Eastern Washington Real Estate Market Update


The following analysis of the Eastern Washington real estate market is provided by Windermere Real Estate Chief Economist Matthew Gardner. We hope that this information may assist you with making better-informed real estate decisions. For further information about the housing market in your area, please don’t hesitate to contact your Windermere agent.


ECONOMIC OVERVIEW

The Washington State economy added 83,900 new jobs over the past 12 months, representing an annual growth rate of 2.5%. This is a slowdown from last quarter, but employment growth remains well above the national rate of 1.6%. Employment gains continue to be robust in the private sector, which was up by 2.8%. The public sector (government) grew by a more modest 1.1%. 

The Eastern Washington region added 7,077 new jobs over the past 12 months, representing an annual growth rate of 1.6%. The unemployment rate for the counties covered by this report was 5%, down marginally from 5.1% a year ago. 
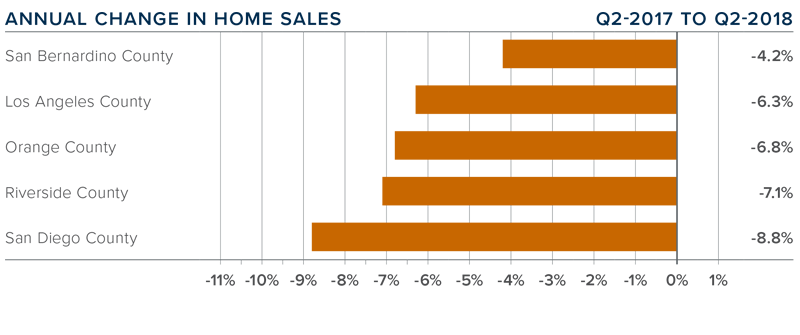
 

HOME SALES ACTIVITY

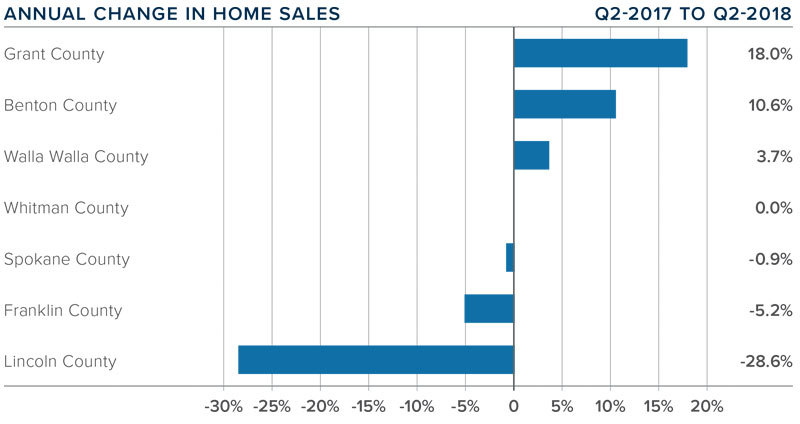
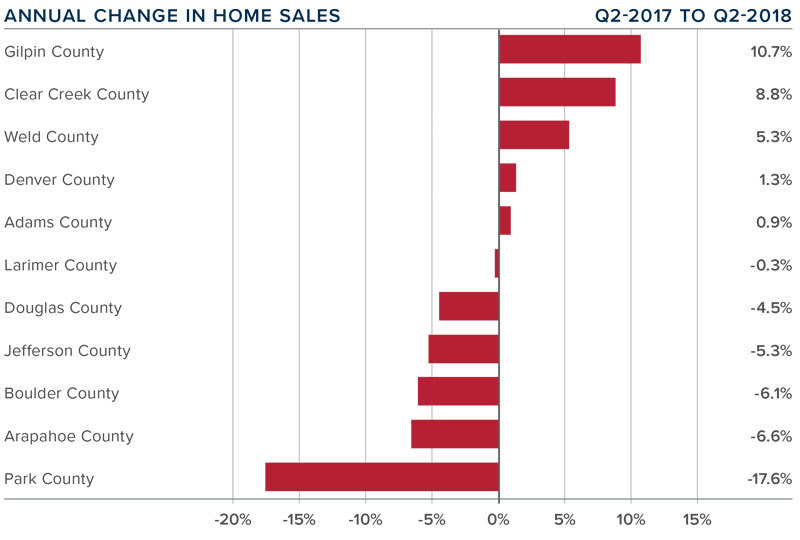
  • Home sales throughout Eastern Washington continue to outperform the long-term average, but an increase in listings in a couple of counties has taken the “froth” off the market. Total sales rose by 2.1% over the same quarter in 2017 to 3,878 units. 
     
  • Sales rose fastest in Grant County, which increased 18% versus a year ago. Lincoln County saw a significant drop in sales, but, because it is a very small market, I am not troubled. 
     
  • Year-over-year, home sales rose in three counties, and three counties saw a drop. Whitman County saw exactly the same number of sales as a year ago. 
     
  • The number of homes for sale was down 16.1% from the second quarter of 2017 but we saw solid gains in listings in Franklin and Benton Counties. Low inventory remains an issue.
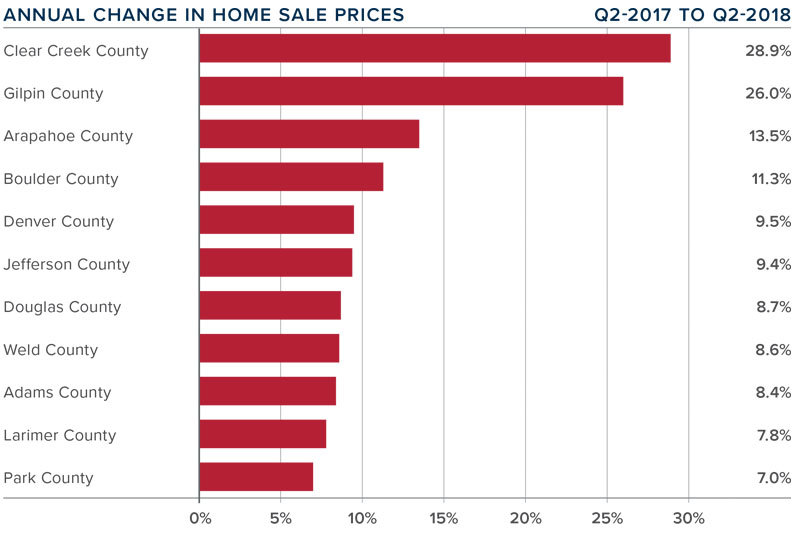
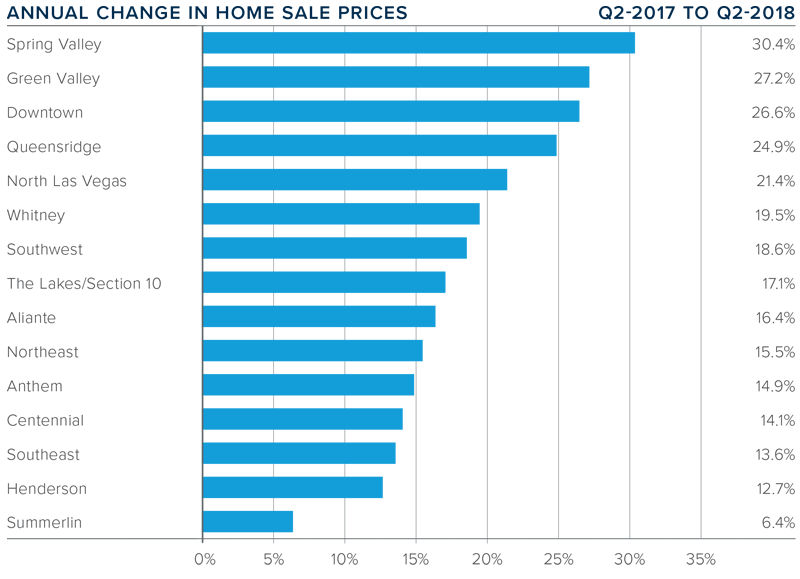


HOME PRICES

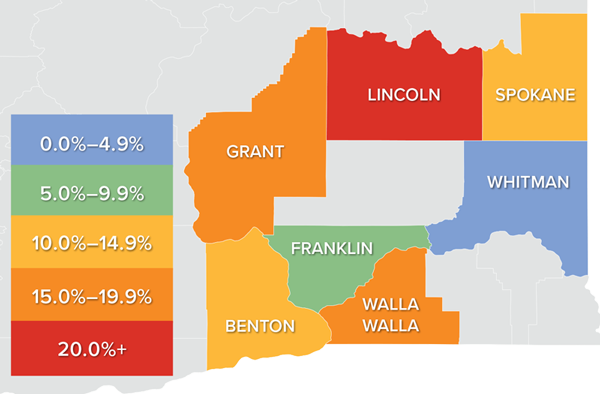
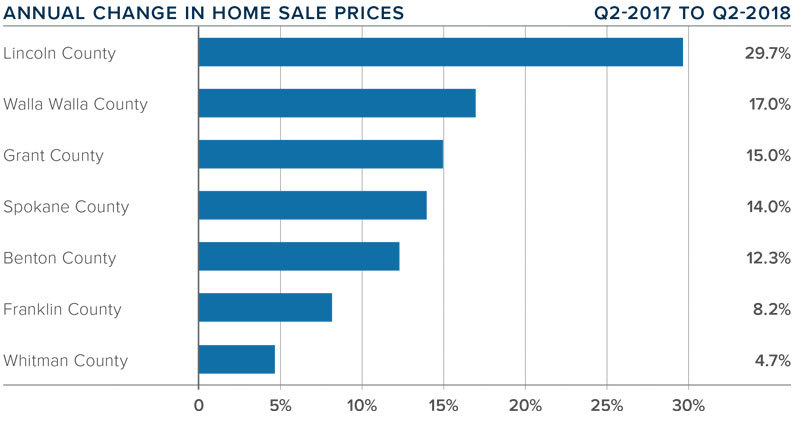
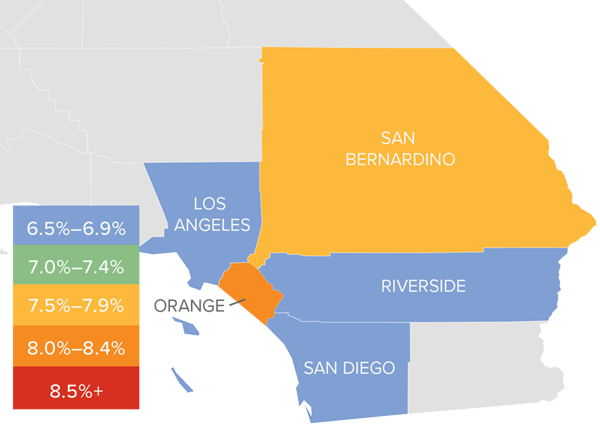
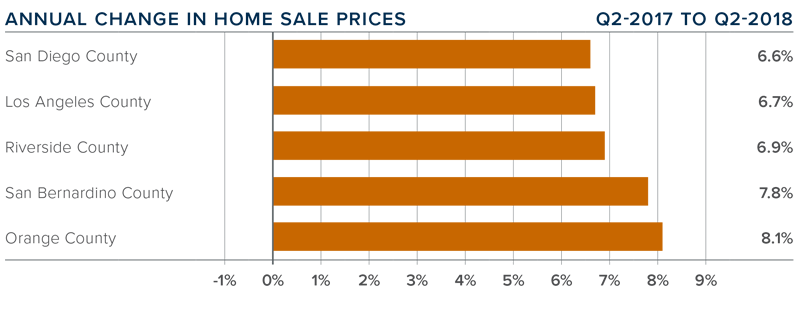
  • Year-over-year, the average home price in Eastern Washington rose 13.3% to $271,752. Price growth has been moderating, but most counties are still seeing double-digit growth in sale prices. 
     
  • Although Franklin and Benton Counties saw an increase in listings last quarter, low inventory throughout the region continues to drive prices higher. This is unlikely to change as we move into the normally busy summer market. 
     
  • All the counties in this report saw prices rise compared to the second quarter of 2017. Lincoln County led the way with an increase of 29.7%. 
     
  • The takeaway here is that home-price growth continues at above-average rates, even with rising mortgage rates. 
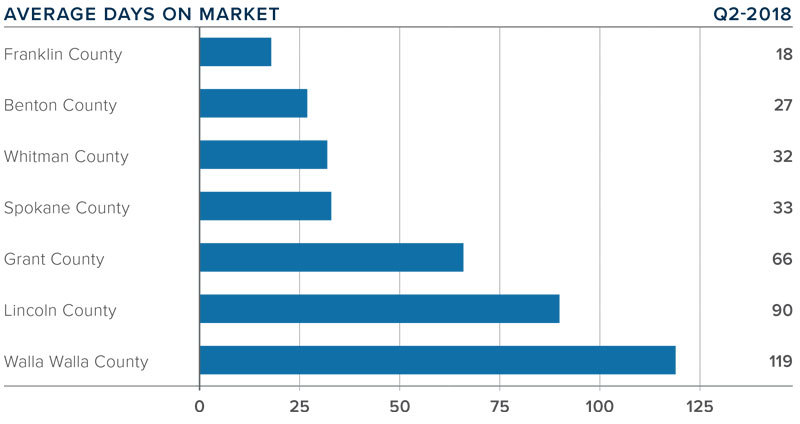
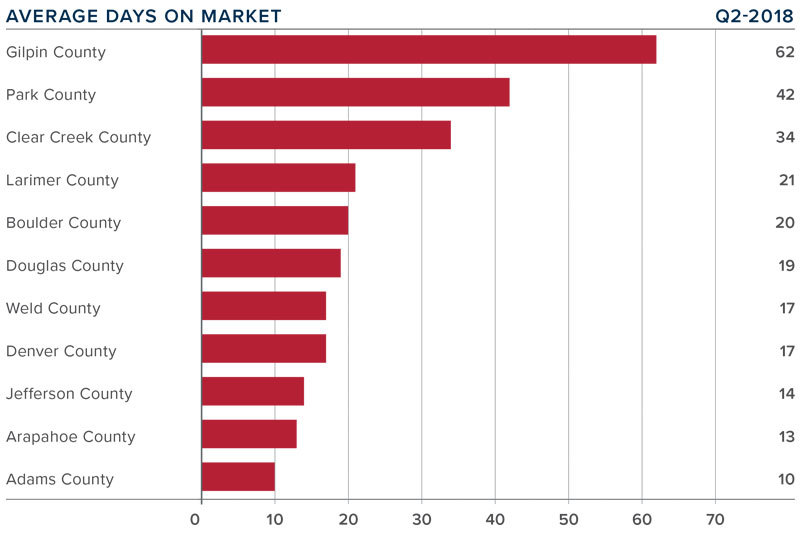
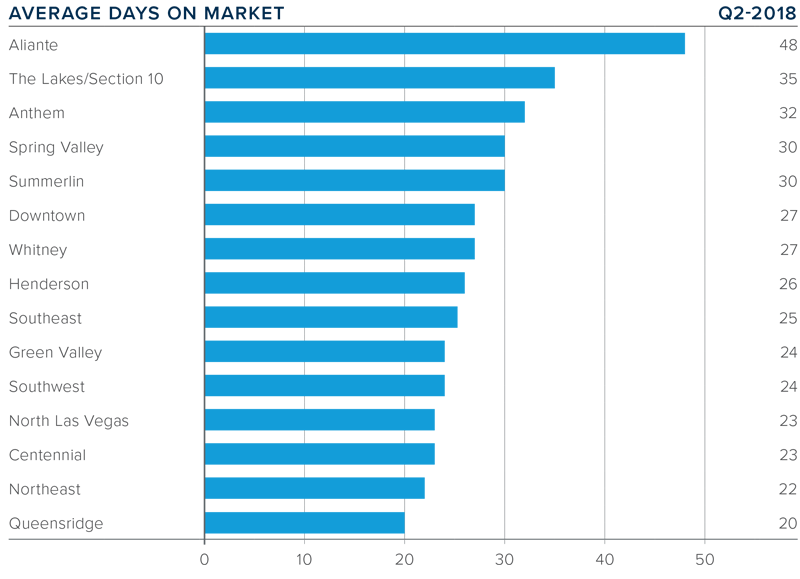


DAYS ON MARKET

  • The average number of days it took to sell a home dropped by 12 days when compared to the second quarter of 2017. 
     
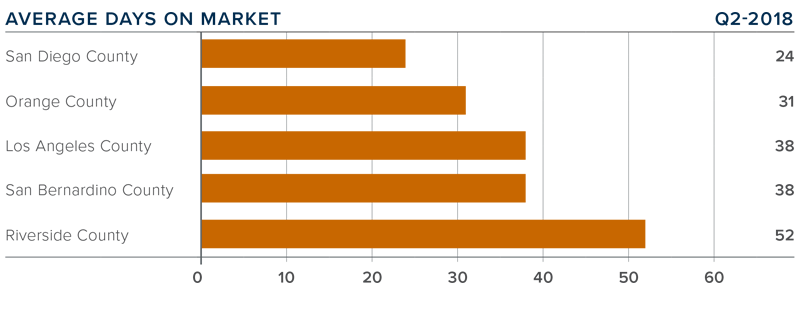
  • The average time it took to sell a home in Eastern Washington last quarter was 55 days. 
     
  • Every county saw the time it took to sell a home either remain static or drop compared to the same quarter in 2017. 
     
  • Whitman County had the biggest drop in days on market. The time it took to sell a home there fell by 29 days compared to the second quarter of 2017. 


CONCLUSIONS

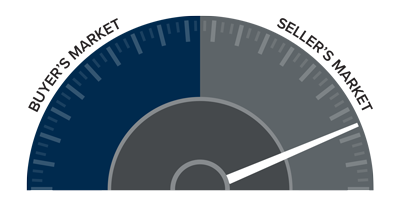
This speedometer reflects the state of the regions real estate market using housing inventory, price gains, home sales, interest rates, and larger economic factors. 

As mentioned previously, listing activity continues to rise in Franklin and Benton Counties, which is positive news for buyers in those areas. That said, the overall trend in Eastern Washington remains in favor of home sellers, so I moved the needle a little more in their direction. 


Matthew Gardner is the Chief Economist for Windermere Real Estate, specializing in residential market analysis, commercial/industrial market analysis, financial analysis, and land use and regional economics. He is the former Principal of Gardner Economics and has more than 30 years of professional experience both in the U.S. and U.K.

Market News July 31, 2018

Colorado Real Estate Market Update


The following analysis of the Metro Denver & Northern Colorado real estate market (which now includes Clear Creek, Gilpin, and Park Counties) is provided by Windermere Real Estate Chief Economist Matthew Gardner. We hope that this information may assist you with making better-informed real estate decisions. For further information about the housing market in your area, please don’t hesitate to contact your Windermere agent.


ECONOMIC OVERVIEW

Colorado continues to see very strong job growth, adding 72,800 non-agricultural jobs over the past 12 months—an impressive increase of 2.7%. Through the first five months of 2018, the state added an average of 7,300 new jobs per month. I expect this growth to continue through the remainder of the year, resulting in about 80,000 new jobs in 2018.

In May, the state unemployment rate was 2.8%. This is slightly above the 2.6% we saw a year ago but still represents a remarkably low level. Unemployment remains either stable or is dropping in all the markets contained in this report, with the lowest reported rates in Fort Collins and Boulder, where just 2.2% of the labor force was actively looking for work. The highest unemployment rate was in Grand Junction, which came in at 3.1%.


HOME SALES ACTIVITY

  • In the second quarter of 2018, 17,769 homes sold—a drop of 2.4% compared to the second quarter of 2017.
  • Sales rose in 5 of the 11 counties contained in this report, with Gilpin County sales rising by an impressive 10.7% compared to second quarter of last year. There were also noticeable increases in Clear Creek and Weld Counties. Sales fell the most in Park County but, as this is a relatively small area, I see no great cause for concern at this time.
  • Slowing sales activity is to be expected given the low levels of available homes for sale in many of the counties contained in this report. That said, we did see some significant increases in listing activity in Denver and Larimer Counties. This should translate into increasing sales through the summer months.
  • The takeaway here is that sales growth is being hobbled by a general lack of homes for sale, and due to a drop in housing demand.


HOME PRICES

  • With strong economic growth and a persistent lack of inventory, prices continue to trend higher. The average home price in the region rose
    9.8% year-over-year to $479,943.
  • The smallest price gains in the region were in Park County, though the increase there was still a respectable 7%.
  • Appreciation was strongest in Clear Creek and Gilpin Counties, where prices rose by 28.9% and 26%, respectively. All other counties in this report saw gains above the long-term average.
  • Although there was some growth in listings, the ongoing imbalance between supply and demand persists, driving home prices higher.


DAYS ON MARKET

  • The average number of days it took to sell a home remained at the same level as a year ago.
  • The length of time it took to sell a home dropped in most markets contained in this report. Gilpin County saw a very significant jump in days on market, but this can be attributed to the fact that it is a very small area which makes it prone to severe swings.
  • In the second quarter of 2018, it took an average of 24 days to sell a home. Of note is Adams County, where it took an average of only 10 days to sell a home.
  • Housing demand remains very strong and all the markets in this report continue to be in dire need of additional inventory to satisfy demand.


CONCLUSIONS

This speedometer reflects the state of the region’s real estate market using housing inventory, price gains, home sales, interest rates, and larger economic factors.

For the second quarter of 2018, I have moved the needle very slightly towards buyers as a few counties actually saw inventories rise. However, while I expect to see listings increase in the coming months, for now, the housing market continues to heavily favor sellers.


Matthew Gardner is the Chief Economist for Windermere Real Estate, specializing in residential market analysis, commercial/industrial market analysis, financial analysis, and land use and regional economics. He is the former Principal of Gardner Economics, and has more than 30 years of professional experience both in the U.S. and U.K.

Market News July 30, 2018

Nevada Real Estate Market Update


The following analysis of the greater Las Vegas, Nevada real estate market is provided by Windermere Real Estate Chief Economist Matthew Gardner. We hope that this information may assist you with making better-informed real estate decisions. For further information about the housing market in your area, please don’t hesitate to contact your Windermere agent. 


ECONOMIC OVERVIEW

Employers in the Las Vegas metropolitan area continue to add jobs. A total of 27,800 new positions were added over the past 12 months, representing an annual growth rate of a healthy 2.9%. Interestingly, Las Vegas employment broke the million mark for the very first time in May of this year. 

Thanks to ongoing job growth, the unemployment rate continues to drop. The seasonally adjusted rate was down to 4.6%—a level not seen since before the last recession. 


HOME SALES ACTIVITY

  • A total of 9,775 homes were sold in the second quarter of 2018—a drop of 5.7% over the same period a year ago. We can attribute the fall in sales to a lack of homes for sale. Inventory was down 12.7% from the same period in 2017.

  • Pending sales rose by a very marginal 0.7% in second quarter, suggesting that closings in third quarter may fall well short of expectations.

  • Sales rose in only two sub-markets compared to a year ago, with the Spring Valley and Southeast Las Vegas markets each rising by a little over 2%. All other markets saw sales decline, the most substantial of which was in the Downtown sub-market. 

  • The data in this report suggests that housing demand, although strong, is being stifled by the lack of homes for sale. 


HOME PRICES

  • Home prices in the area rose by 15.9% compared to the second quarter of 2017 to an average of $302,507. 
     
  • Notably, only one neighborhood saw annual price growth of less than 10%, with Summerlin coming in at a still healthy 6.4%. 
     
  • Prices in all of the sub-markets except one rose by double-digits when compared to the same quarter last year. The strongest growth was in the Spring Valley sub-market, where prices were up 30.4%, but there was substantial price growth in almost every sub-market. 
     
  • I believe above-average price growth in the Las Vegas market will continue through the balance of this year and into 2019, even in the face of rising mortgage rates. 


DAYS ON MARKET

  • The average time it took to sell a home in the region dropped 10 days compared to the second quarter of 2017. 

  • Region-wide it took an average of only 28 days to sell a home in the second quarter of this year. 

  • Days on market fell in all but one of the sub-markets compared to a year ago. The exception was Spring Valley, where it took three days longer to sell a home than it did a year ago. 

  • The greatest drop in days on market was in Aliante, which fell by 38 days when compared to the same quarter in 2017. 


CONCLUSIONS                                                                                               

The speedometer reflects the state of the region’s real estate market using housing inventory, price gains, home sales, interest rates, and larger economic factors. 

Employment growth in Clark County continues to be very robust. This, when combined with low inventory levels, will continue to push home prices higher. Given these factors, I have moved the speedometer a little farther in favor of sellers. 


Mr. Gardner is the Chief Economist for Windermere Real Estate, specializing in residential market analysis, commercial/industrial market analysis, financial analysis, and land use and regional economics. He is the former Principal of Gardner Economics, and has more than 30 years of professional experience both in the U.S. and U.K. 

Market News July 26, 2018

Southern California Real Estate Market Update


The following analysis of the Southern California real estate market is provided by Windermere Real Estate Chief Economist Matthew Gardner. We hope that this information may assist you with making better-informed real estate decisions. For further information about the housing market in your area, please don’t hesitate to contact your Windermere agent. 


ECONOMIC OVERVIEW

The counties covered by this report—Los Angeles, San Diego, San Bernardino, Orange, and Riverside—added 110,200 new jobs between May 2017 and May 2018. As a result, the unemployment rate dropped from 4.2% to 3.6%. Employment growth in Southern California continues to outperform the nation as a whole, and I am confident this will continue as we move through the balance of the year.  


HOME SALES ACTIVITY

  • There were 51,320 home sales in the second quarter of 2018. This was 6.8% lower than the same period in 2017 but 32.6% higher than the first quarter of this year.

  • Pending home sales (an indicator of future closings) were 3.2% lower than during the same period a year ago, which suggests that third quarter closings may not show much improvement.

  • Home sales dropped across the board. The most noticeable decline was in San Diego County, which fell 8.8%. I continue to believe that the decline in sales is directly related to the very low levels of inventory.

  • There was an average of 35,238 active listings in the second quarter—well below what is needed to get to a balanced market.


HOME PRICES

  • Year-over-year, average prices in the region rose by 7% and were 5.6% higher than in the first quarter of 2018.
  • Affordability continues to be an issue, which, in concert with limited inventory, is pushing home prices higher. New construction activity is not meeting the needs of new households, which puts further pressure on home prices.
  • Price increases across the region were fairly level, with Orange County showing the greatest annual appreciation in values (+8.1%). The slowest appreciation was in San Diego County, which still saw a respectable 6.6% increase.
  • Based on the data in this report, I believe it is highly likely that prices will continue rising at above-average rates for at least the balance of 2018.


DAYS ON MARKET

  • The average time it took to sell a home in the region was 37 days. This is a drop of four days compared to the second quarter of 2017, and seven fewer days than in the first quarter of this year.

  • The biggest drop in days on market was in San Bernardino County, where it took six fewer days to sell a home compared to the same period last year.

  • Homes in San Diego County continue to sell at a faster rate than other markets in the region. In the second quarter, it took an average of only 24 days to sell a home, which is one day less than it took a year ago.

  • All five counties saw a drop in the amount of time it took to sell a home compared to the second quarter of 2017


CONCLUSIONS                                                                                               

The speedometer reflects the state of the region’s real estate market using housing inventory,
price gains, home sales, interest rates, and larger economic factors.

The Southern California economy continues to add jobs at a very healthy rate, which increases demand for all housing types. Mortgage rates—although rising— are still very favorable when compared to historic averages, and low inventory continues to drive prices higher. The number of homes for sale in the region remains well below the levels needed for a balanced market. Given all of these factors, I have moved the needle a little more in favor of sellers.


Mr. Gardner is the Chief Economist for Windermere Real Estate, specializing in residential market analysis, commercial/industrial market analysis, financial analysis, and land use and regional economics. He is the former Principal of Gardner Economics, and has more than 30 years of professional experience both in the U.S. and U.K. 

Market News July 25, 2018

Western Washington Real Estate Market Update


The following analysis of the Western Washington real estate market is provided by Windermere Real Estate Chief Economist Matthew Gardner. We hope that this information may assist you with making better-informed real estate decisions. For further information about the housing market in your area, please don’t hesitate to contact your Windermere Agent. 


ECONOMIC OVERVIEW

The Washington State economy added 83,900 new jobs over the past 12 months, representing an annual growth rate of 2.5%. This is a slowdown from the last quarter, but employment growth remains well above the national rate of 1.6%. Employment gains continue to be robust in the private sector, which was up by 2.8%. The public sector (government) grew by a more modest 1.1%.

The strongest growth sectors were Retail Trade and Construction, which both rose by 4.8%. Significant growth was also seen in the Education & Health Services and Information sectors, which rose by 3.9% and 3.4%, respectively.

The State’s unemployment rate was 4.7%, down from 4.8% a year ago. Washington State will continue adding jobs for the balance of the year and I anticipate total job growth for 2018 will be around 80,000, representing a total employment growth rate of 2.4%.


HOME SALES ACTIVITY

  • There were 23,209 home sales during the second quarter of 2018. This is a drop of 2.3% compared to the same period a year ago.
  • Clallam County saw sales rise the fastest relative to the same period a year ago, with an increase of 12.6%. Jefferson County also saw significant gains in sales at 11.1%.
  • The number of homes for sale last quarter was down by a nominal 0.3% when compared to the second quarter of 2017, but up by 66% when compared to the first quarter of this year. Much has been mentioned regarding the growth in listings, but it was not region-wide. King County saw a massive 31.7% increase in inventory, though all but three of the other counties covered in this report saw the number of listings drop compared to a year ago.
  • The takeaway from this data is that while some counties are seeing growth in listings — which will translate into sales down the road — the market is still out of balance.


HOME PRICES

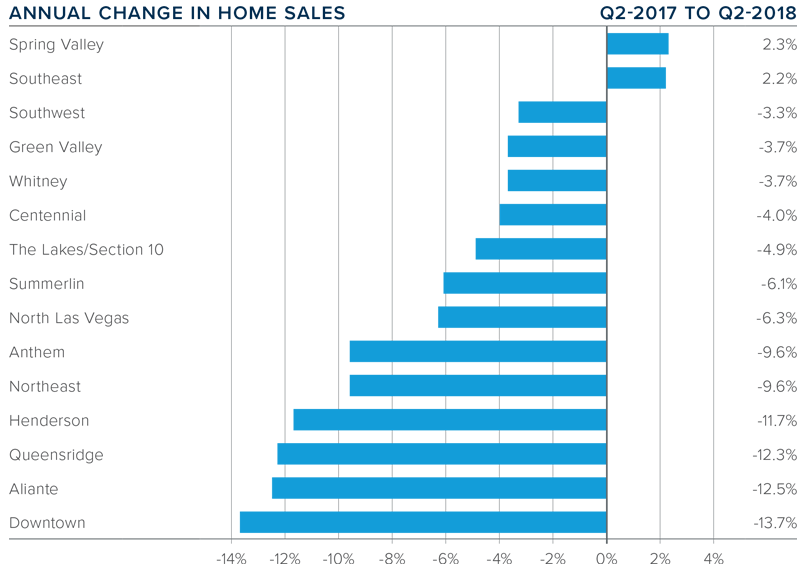
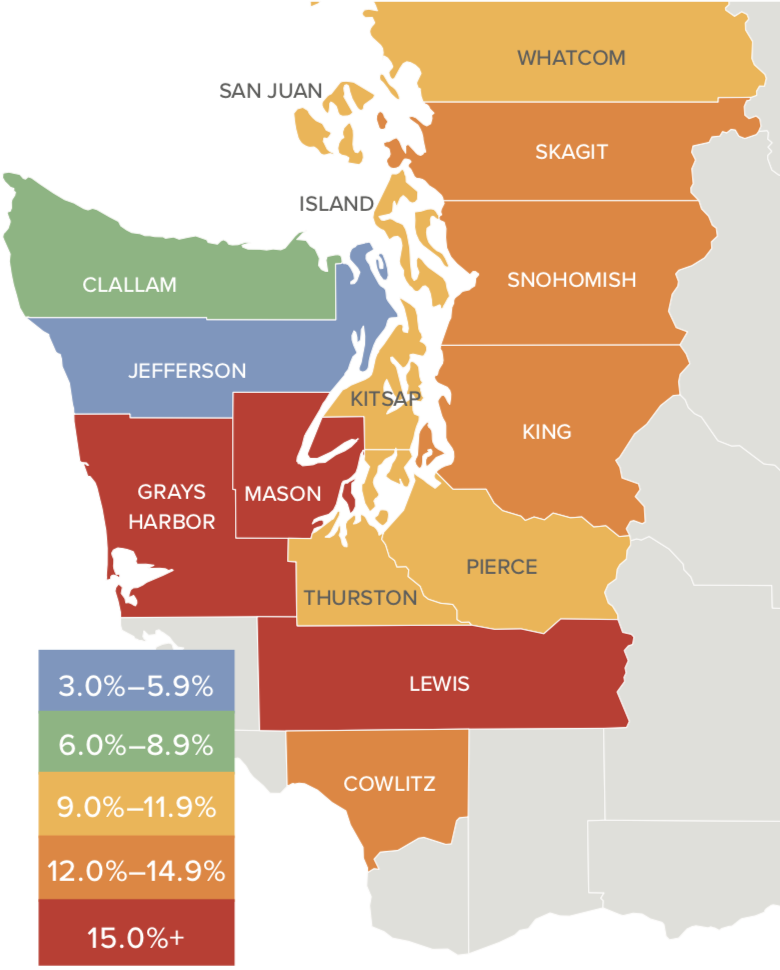
  • As inventory is still fairly scarce, growth in home prices continues to trend well above the long-term average. Prices in Western Washington rose 12.2% over last year to $526,398.
  • Home prices continue to trend higher across Western Washington, but the pace of growth has started to slow. This should please would-be buyers. The spring market came late but inventory growth in the expensive King County market will give buyers more choices and likely lead to a slowing down of price growth as bidding wars continue to taper.
  • When compared to the same period a year ago, price growth was strongest in Mason County, which was up 17.4%. Eleven other counties experienced double-digit price growth.
  • Mortgage rates, which had been rising significantly since the start of the year, have leveled off over the past month. I believe rising rates are likely the reason that inventory levels are rising, as would-be sellers believe that this could be the right time to cash out. That said, the slowing in rate increases has led buyers to believe that rates will not jump soon, which gives them a little more breathing room. I do not expect to see any possible slowdown in demand until mortgage rates breach the 5% mark.


DAYS ON MARKET

  • The average number of days it took to sell a home dropped by seven days compared to the same quarter of 2017.

  • King County continues to be the tightest market in Western Washington, with homes taking an average of only 13 days to sell. Every county in the region other than Clallam saw the length of time it took to sell a home drop when compared to the same period a year ago.

  • Across the entire region, it took an average of 41 days to sell a home in the second quarter of this year. This is down from 48 days in the second quarter of 2017 and down by 20 days when compared to the first quarter of 2018.

  • Although we did see some inventory increases when compared to the first quarter of the year, we are essentially at the same level of homes on the market as a year ago. The market has yet to reach equilibrium and I certainly do not expect to reach that point until sometime in 2019.


CONCLUSIONS

This speedometer reflects the state of the region’s real estate market using housing inventory, price gains, home sales, interest rates, and larger economic factors. For the second quarter of 2018, I have moved the needle very slightly towards buyers, but it remains firmly a seller’s market. This shift is a function of price growth tapering very slightly, as well as the expectation that we should see more homes come on the market as we move through the balance of the year.


Mr. Gardner is the Chief Economist for Windermere Real Estate, specializing in residential market analysis, commercial/industrial market analysis, financial analysis, and land use and regional economics. He is the former Principal of Gardner Economics, and has more than 30 years of professional experience both in the U.S. and U.K. 


More July 23, 2018

Windermere Foundation Donates Nearly $1 Million During First Half of 2018

Thanks to the generosity of Windermere agents, staff, franchise owners, and the community, the Windermere Foundation has proudly donated a total of $920,351 so far this year to non-profit organizations that provide services to low-income and homeless families. This brings the total amount of money that the Windermere Foundation has raised since 1989 to over $36 million.


Each Windermere office has its own Windermere Foundation fund account that they use to make donations to organizations in their local communities. One such organization in Boise, Idaho is CATCH (Charitable Assistance to Community’s Homeless), whose vision is to end homelessness for families by providing programs that work with local resources to provide stable housing, inspire financial independence, and build on a family’s strength and resilience.


The Windermere Caldwell and Boise Valley offices have worked with CATCH for over six years, with funding support from the Windermere Foundation. These donations help pay for programs that provide hope and support to many families in Idaho’s Treasure Valley…families like Andrea’s. *


Before CATCH, Andrea had come out of an abusive relationship, leaving her to raise her three young children on her own. When they became homeless, they spent six months living out of her car, waiting until a more stable living situation became available. Finally, the call came from Andrea’s case manager that they had been accepted into the CATCH program. Through the program, Andrea had access to resources to help her find housing. After about a month, she was able to find the perfect home for her family.


During her few months in the CATCH program, Andrea said she not only gained housing, but also so much more. “I’ve gained a bigger support system, more love, and knowledge. I’ve gained more strength and responsibility. I learned how to budget, worked at bettering my career, and I didn’t feel alone anymore. But most of all, CATCH has allowed me to put my pride away at times I didn’t need it and accept what I do need, and that is LOVE. I thank the CATCH program for helping me and my family grow stronger.”


Generous donations to the Windermere Foundation over the years have enabled Windermere offices to continue to support local non-profits like CATCH. If you’d like to help support programs in your community, please click on the Donate button.


To learn more about the Windermere Foundation, visit WindermereFoundation.com.


*Name has been changed for client confidentiality.

Market News July 18, 2018

How Will the Real Estate Market Respond to Rising Interest Rates?

Design July 16, 2018

4 Ways to Make Smart Tech Upgrades to Your Garage

When it comes to upgrading your home with the latest technology, your garage is likely to be the last thing on your radar. But as electric vehicles and even self-driving cars are hitting the road across the country, real estate listings are touting smart garages in high-tech cities like Palo Alto, California and Austin, Texas. Not to mention the simple fact that garage tech can boost security and convenience for your home, no matter what kind of car you drive. Here, we outline four of the simplest things you can do to make your garage smarter.

1. Learn about internet-connected devices you can install in your garage.

There are all kinds of benefits to installing internet-connected systems in and around your garage — from opening and closing your garage door remotely, to using cameras to monitor your garage, to checking up on your car from anywhere in the world. How's that for convenience?

These internet-connected devices don't have to be complicated, either. In fact, they're designed for your ease of use. You can find smart add-ons for your existing garage door opener, or if you want to go all out (and potentially obtain additional security and other features), you can purchase a brand new, high-tech garage door system with all the bells and whistles. 

2. Install motion-sensor lights and security cameras near your garage and other entryways.

Since most thieves like to do their dirty work in the dark, motion-sensor lights can be an effective deterrent to a garage break-in. And if you have security cameras installed too, the police may be able to better identify the perps — if anything ever does happen.

Plus, these easy upgrades can add major market value to your home if you're looking to put it on the market in the future.

3. Think about the future.

You may still be driving a gas-powered car, but plug-in electric and hybrid vehicles are becoming increasingly attractive and affordable to modern car-buyers — especially as states like Texas are offering rebate programs for vehicle replacements to EVs. If you think there’s a chance that you could make the switch in the near future, it’s a good idea to get your garage ready by installing an appropriate outlet or 240-volt battery charger. Many cities and states (including Texas) also offer assistance to help drivers purchase and install a charging station at home. You could also enjoy reduced utility charges, depending on where you live.

Keep in mind that driverless cars will be a common sight in American garages too, as lawmakers are clearing the way for the new technology in Austin and Arlington. Experts have suggested that this shift will transform the real estate market, including the size and functionality of garages.

4. Make sure your homeowners' insurance is up to snuff.

It's pretty obvious that your garage door is one of the more exposed areas of your home —when it comes to potential intruders, but also when it comes to bad weather. If a covered incident like a windstorm, fire, break-in, or vandalism occurs, standard homeowners insurance has your back. 

Just be sure to purchase enough insurance coverage to completely rebuild your home from the ground up in case catastrophe happens, since your policy will only pay out the maximum limits you choose. The last thing you want after a disaster strikes is extra bills to pay just to get your home back in working order.

Return on Investment

Going all out with brand new, high-tech garage devices is admittedly an investment up front. But when it comes to peace of mind knowing your home and your family are safe, a smart garage could be worth every dime — not to mention the fact that it could boost your resale value in an increasingly connected world. 

Haden Kirkpatrick is the director of marketing strategy and innovation at Esurance, where he is responsible for initiatives related to product and service innovation. He is constantly thinking about technology changes impacting the insurance industry, and following innovation taking place in high-tech hot spots such as Palo Alto, California and Austin, Texas.

Buying July 11, 2018

When Buying a Short Sale Home is the Right Fit


Purchasing a home can feel overwhelming at times, but a short sale home offers a unique opportunity for a prospective buyer. A short sale occurs when a homeowner owes a lender more than their home is worth, and the lender agrees to let the owner sell the home and accept less than what is owed. Lenders may agree to a short sale because they believe it will net them more money than going forward with a lengthy and costly foreclosure process.

Short sales do differ in a number of ways from conventional home sales. Here are a few things to consider if you're thinking about buying a short sale property.

  • Short sale homes sell for less, but not significantly less than market value.
  •  

Buyers hoping to snap up a home for half the market value will be disappointed. The selling price for short sales averages about 10 percent less than for non-distressed properties. The bank is looking to recover as much of the value of the home as possible, so they will not accept offers that are significantly under market value. That said, with savings that can equal tens of thousands of dollars, a short sale is a great way to get more house for your money.

  • Short sale properties are sold "as is".
  •  

The lender will not be making repairs to the home. Any improvements that need to be made are most likely going to be the responsibility of the buyer. A savvy buyer's agent/broker will get contractor bids for any necessary repairs and use those to help negotiate a lower sales price with the bank.

  • A short sale will take longer than a conventional home sale.
  •  

Once you and the seller have mutual acceptance on an offer, you need to allow 60 to 90 days for the lender approval process. There are often long stretches when the offer is slowly winding its way through the bank's system, so buyers need to be patient.

  • If you have to sell your home first, a short sale is probably not the best fit.
  •  

Lenders generally will not take contingent offers on a short sale.

  • A short sale is one real estate transaction that you shouldn't attempt on your own. 
  •  

Short sales are complicated transactions that involve a different process and significantly more paperwork than a standard real estate sale. An agent/broker that is unfamiliar with short sales can write an offer in such a way that they inadvertently cause their buyers to lose the deal. An experienced short sale agent/broker will protect your interest and help the process move forward smoothly.


The bottom line: As long as you can be patient, and are working with an agent/broker who understands the process, buying a short sale is a great way to purchase the house you want at a price you'll love.

Selling July 9, 2018

How Staging Your Home Well Impacts Its Value


For more than 20 years, the benefits of staging a home have been well documented. Numerous studies show that staging helps sell a home faster and for a higher price. According to the National Association of REALTORS®, 88 percent of homebuyers start their search online, forming impressions within three seconds of viewing a listing. When a home is well staged, it photographs well and makes the kind of first impression that encourages buyers to take the next step.

Studies also indicate that buyers decide if they’re interested within the first 30 seconds of entering a home. Not only does home staging help to remove potential red flags that can turn buyers off, it helps them begin to imagine living there. Homes that are professionally staged look more “move-in ready” and that makes them far more appealing to potential buyers.

According to the Village Voice, staged homes sell in one-third less time than non-staged homes. Staged homes can also command higher prices than non-staged homes. Data compiled by the U.S. Department of Housing and Urban Development indicate that staged homes sell for approximately 17 percent more than non-staged homes.

A measurable difference in time and money

In a study conducted by the Real Estate Staging Association in 2007, a group of vacant homes that had remained unsold for an average of 131 days were taken off the market, staged, and relisted. The newly staged properties sold, on average, in just 42 days, – which is approximately 68 percent less time on the market.

The study was repeated in 2011, in a more challenging market, and the numbers were even more dramatic. Vacant homes that were previously on the market for an average of 156 days as unstaged properties, when listed again as staged properties, sold after an average of 42 days—an average of 73 percent less time on the market.

Small investments, big potential returns

Staging is a powerful advantage when selling your home, but that’s not the only reason to do it. Staging uncovers problems that need to be addressed, repairs that need to be made, and upgrades that should be undertaken. For a relatively small investment of time and money, you can reap big returns. Staged properties are more inviting, and that inspires the kind of peace-of-mind that gets buyers to sign on the dotted line. In the age of social media, a well-staged home is a home that stands out, gets shared, and sticks in people's minds.

What’s more, the investment in staging can bring a higher price. According to the National Association of REALTORS, the average staging investment is between one percent and three percent of the home’s asking price, and typically generates a return of eight to ten percent.

In short, less time on the market and higher selling prices make the small cost of staging your home a wise investment.

Interested in learning more? Contact your real estate agent for information about the value of staging and referrals for professional home stagers.