
 Facebook
 X
X
 Pinterest
 Copy Link

The following analysis of select counties of the Utah real estate market is provided by Windermere Real Estate Chief Economist Matthew Gardner. We hope that this information may assist you with making better-informed real estate decisions. For further information about the housing market in your area, please don’t hesitate to contact your Windermere agent.
ECONOMIC OVERVIEW
Utah’s economy continues to outperform the country with the addition of 43,700 non-agricultural jobs over the past 12 months, representing a growth rate of 3.1% that is very solid compared to the U.S. rate of 1.7%. However, growth has started to slow — albeit modestly — and this is likely to continue given the maturity of the economic cycle. That said, I anticipate the state will continue to see job growth north of 3% in 2019.
In February, the state unemployment rate was 3%, marginally below the 3.1% level a year ago.
HOME SALES
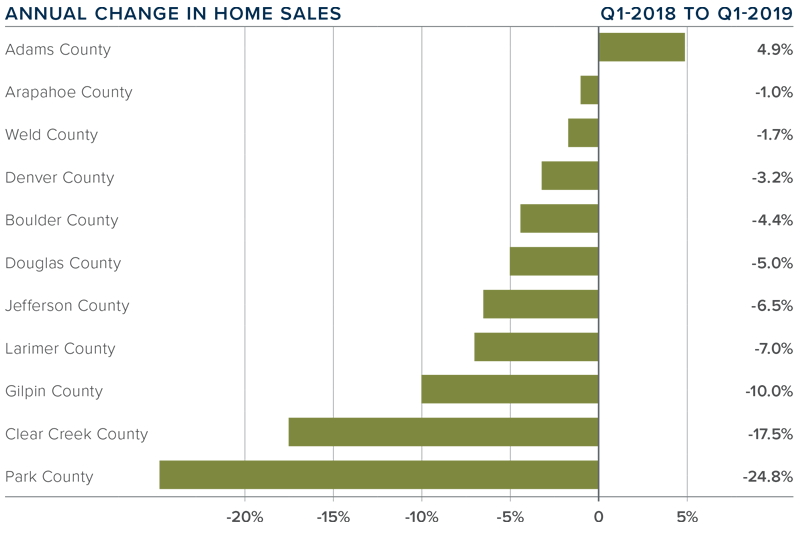
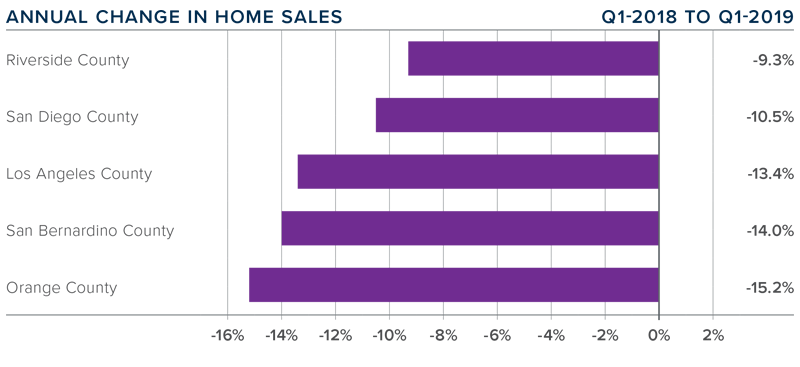
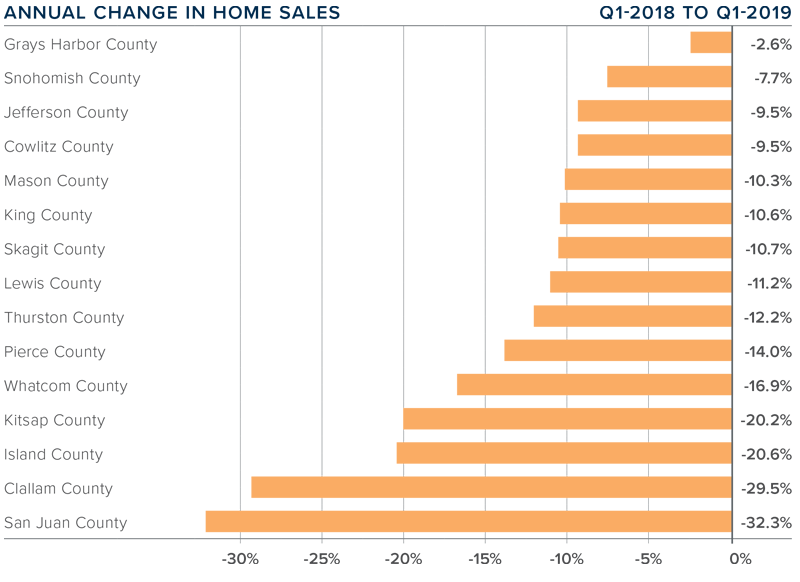
- 6,492 homes sold in the first quarter of 2019, representing a drop of 10.1% from the same period in 2018, and down 18.7% from the final quarter of 2018.
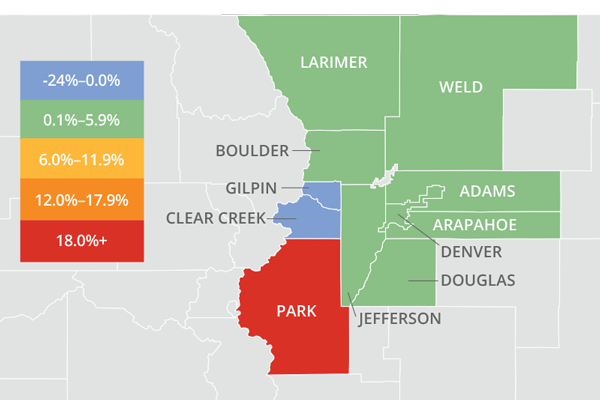
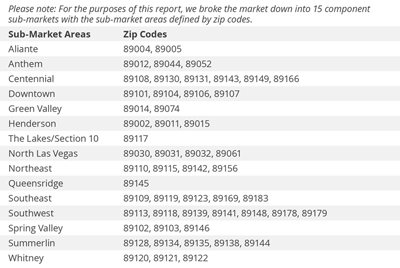
- Total sales activity dropped in all counties contained in this report except for Summit County, which saw sales rise by a modest 3.8%.
- The number of homes for sale in first quarter rose by a very significant 37.3% compared to the same period a year ago, but was 18% lower than the fourth quarter of 2018. There is significantly more choice in the market today than we’ve seen in many years, and this should bring relief to many home buyers.
- Pending sales in the first quarter were a mixed bag. Improvements were seen in Utah, Summit, Morgan, and Davis counties, but there were drops in Weber, Salt Lake, and Wasatch. This suggests that closings in the second quarter will be an improvement over current numbers.

HOME PRICES
![]() The average home price in the region continued to rise in the first quarter, with a year-over-year increase of 4.7% to $366,509.
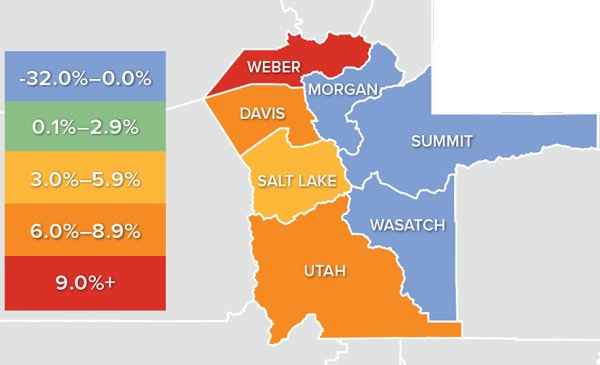
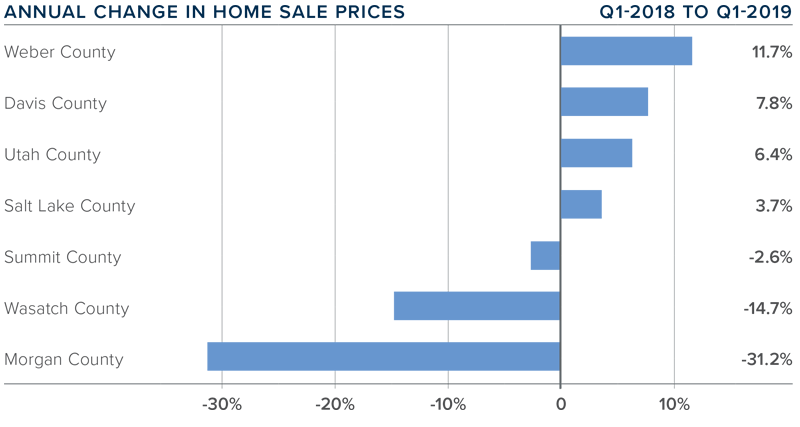
The average home price in the region continued to rise in the first quarter, with a year-over-year increase of 4.7% to $366,509.- Weber and three other counties saw decent price increases compared to a year ago. Home prices dropped the most in Morgan County, but it’s important to remember that small counties such as Morgan, Wasatch, and Summit are subject to significant swings in value.
- Appreciation was strongest in Weber County, where prices rose by 11.7% to $266,333. As the most affordable market in the area, this is not very surprising.
- The takeaway here is that home prices continue to appreciate, but the rate of growth is starting to taper. This trend is likely to continue as we move through the balance of 2019.
 The average home price in the region continued to rise in the first quarter, with a year-over-year increase of 4.7% to $366,509.
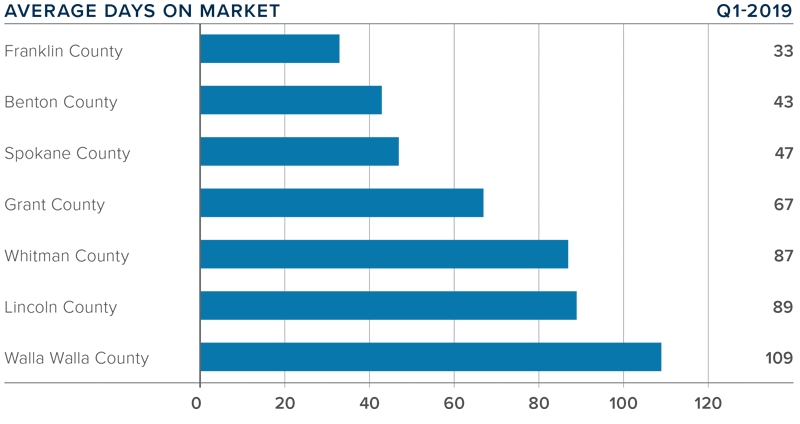
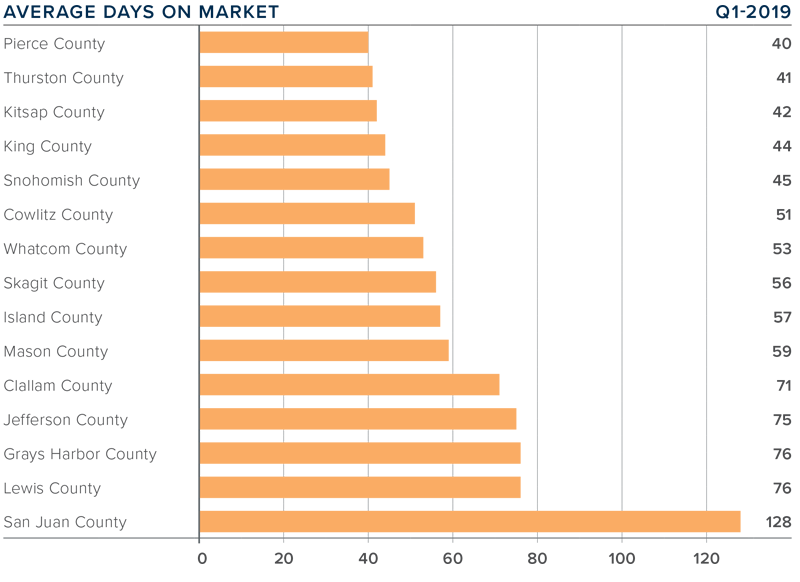
DAYS ON MARKET
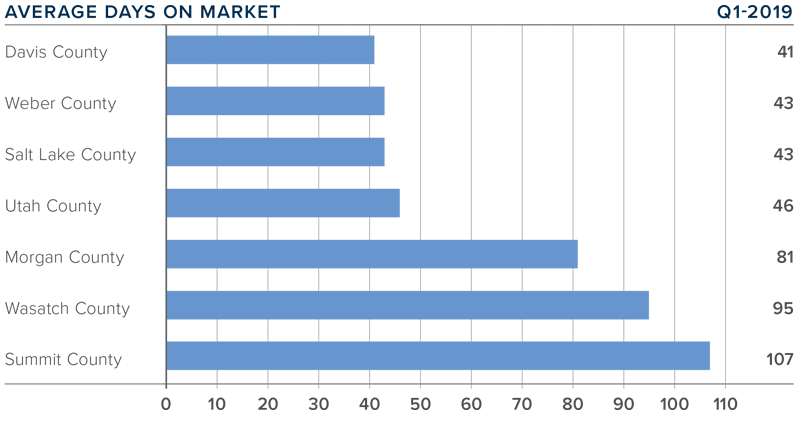
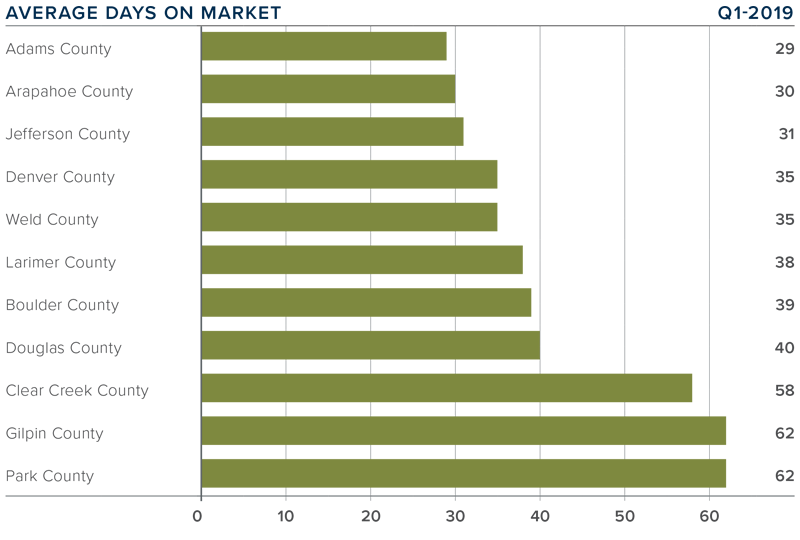
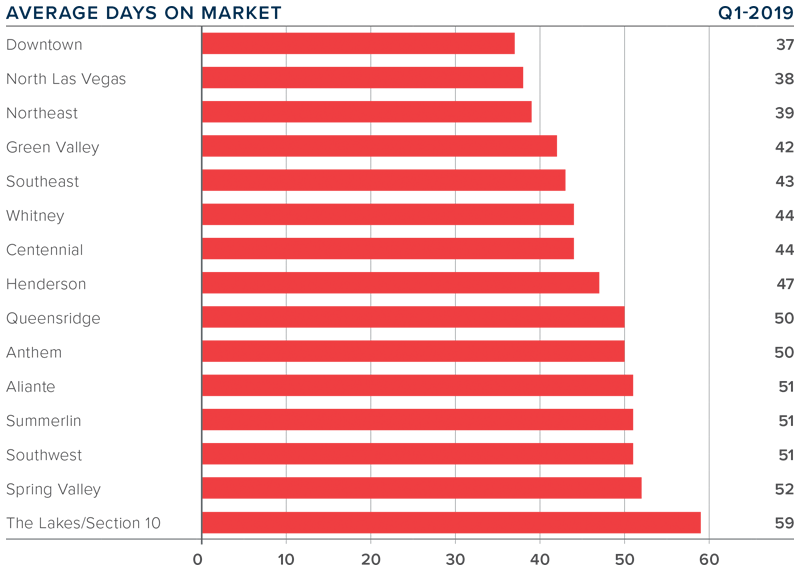
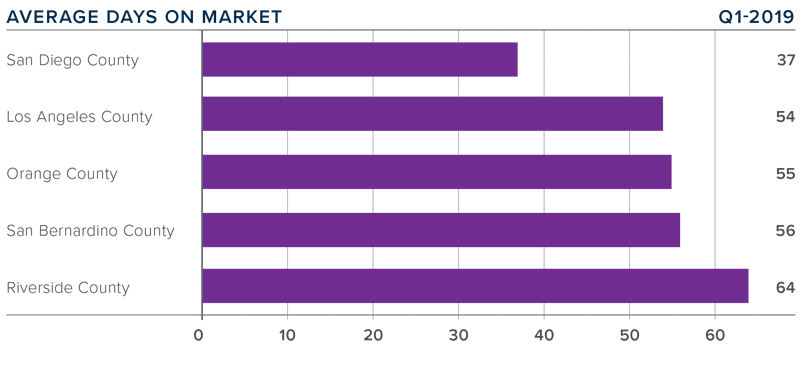
- The average number of days it took to sell a home in the counties covered by this report rose 16 days compared to the first quarter of 2018.
- Homes sold fastest in Davis, Weber, and Salt Lake counties and slowest in Summit County. All counties saw days-on-market rise when compared to the first quarter of 2018.
- During the first quarter of this year, it took an average of 65 days to sell a home in the region.
- The regional economy is still performing very well, and this will continue to drive housing demand. That said, inventory levels are on the rise and this gives buyers more choice and less urgency, which will lead to an increase in days on market.
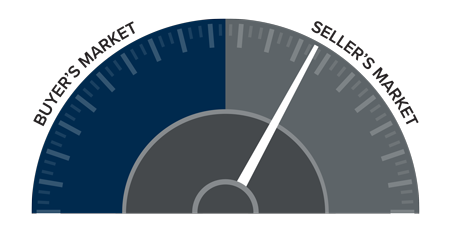
CONCLUSIONS
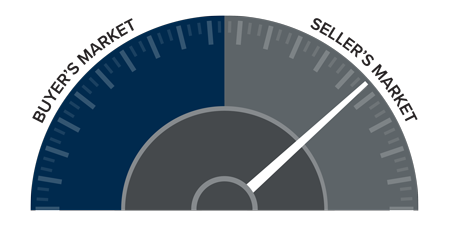
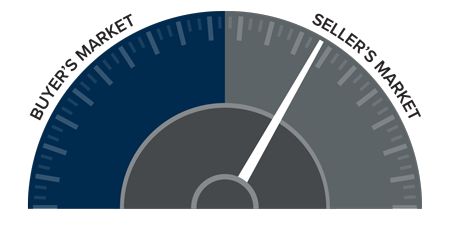
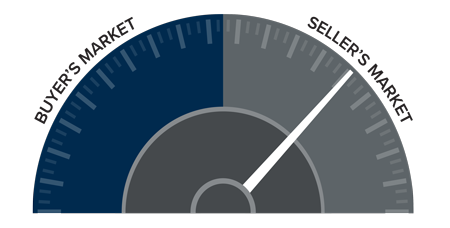 This speedometer reflects the state of the region’s real estate market using housing inventory, price gains, home sales, interest rates, and larger economic factors.
For the first quarter of 2019, I have moved the needle very slightly toward buyers, though it clearly remains a sellers’ market. 2019 is very likely to be another good year for home sellers, but I expect home-price growth to continue to moderate.
 As Chief Economist for Windermere Real Estate, Matthew Gardner is responsible for analyzing and interpreting economic data and its impact on the real estate market on both a local and national level. Matthew has over 30 years of professional experience both in the U.S. and U.K.
In addition to his day-to-day responsibilities, Matthew sits on the Washington State Governors Council of Economic Advisors; chairs the Board of Trustees at the Washington Center for Real Estate Research at the University of Washington; and is an Advisory Board Member at the Runstad Center for Real Estate Studies at the University of Washington where he also lectures in real estate economics.

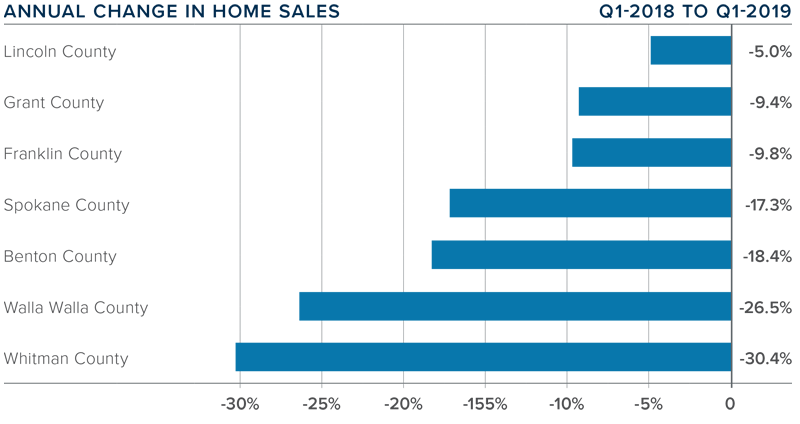
 Year-over-year, the average home price in Eastern Washington rose by a significant 8.5% to $271,427. Price growth started to slow in the third quarter but remains remarkably robust.
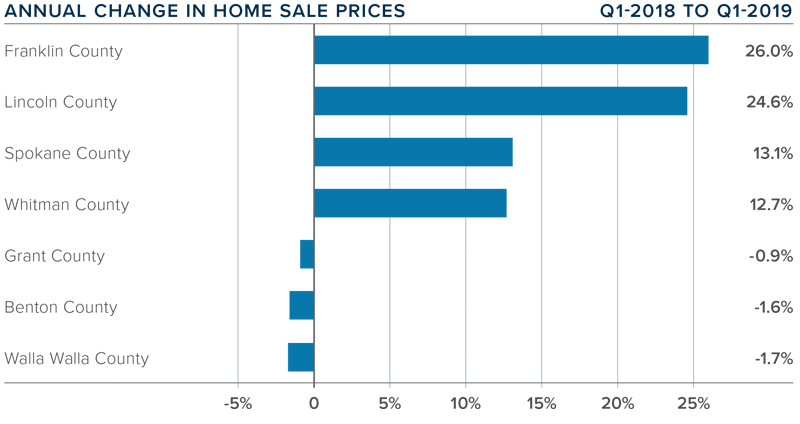
 This speedometer reflects the state of the region’s real estate market using housing inventory, price gains, home sales, interest rates, and larger economic factors.
 Home prices continue to trend higher, but the rate of growth is tapering. The average home price in the region rose just 2.1% year-over-year to $456,243. Home prices were .3% higher than in the fourth quarter of 2018.
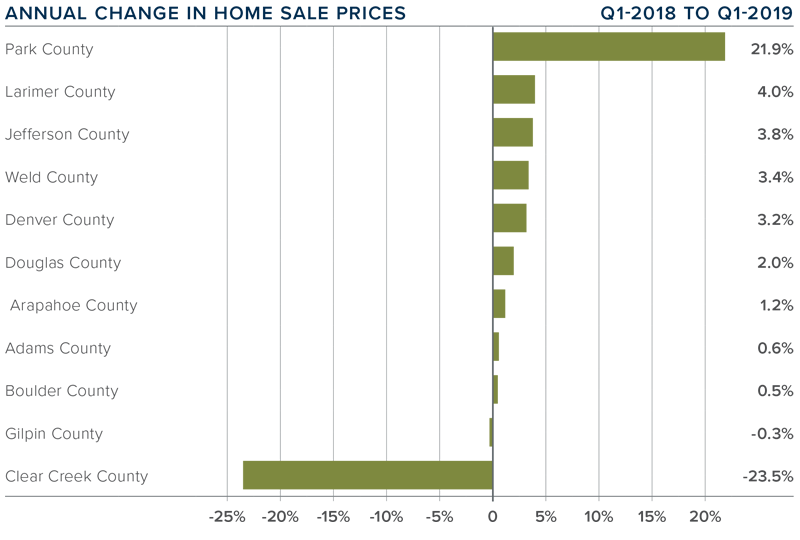
 This speedometer reflects the state of the region’s real estate market using housing inventory, price gains, home sales, interest rates, and larger economic factors.
 As Chief Economist for Windermere Real Estate, Matthew Gardner is responsible for analyzing and interpreting economic data and its impact on the real estate market on both a local and national level. Matthew has over 30 years of professional experience both in the U.S. and U.K.


 ECONOMIC OVERVIEW
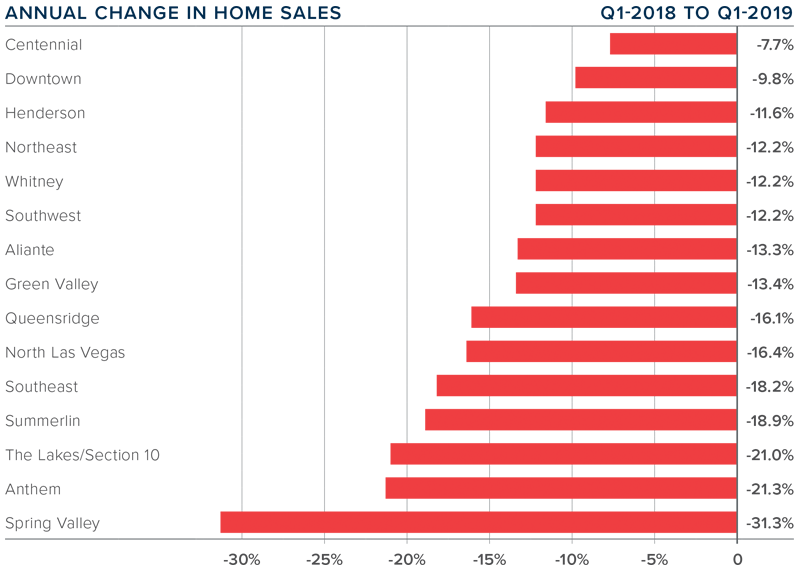

 The speedometer reflects the state of the region’s real estate market using housing inventory, price gains, home sales, interest rates, and larger economic factors.


 Year-over-year, average prices in the region rose a very modest .3% and were 2.4% lower than in the fourth quarter of 2018.
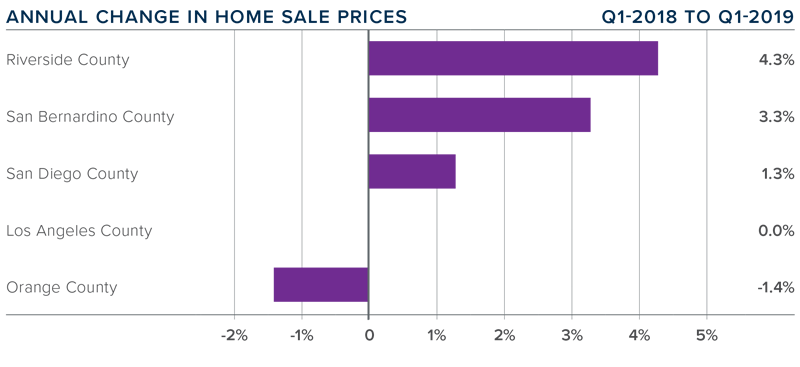
 The speedometer reflects the state of the region’s real estate market using housing inventory, price gains, home sales, interest rates, and larger economic factors.
 In combination with the factors discussed earlier, the 40% increase in listings has caused home price growth to taper to a year-over-year increase of 3.3%.
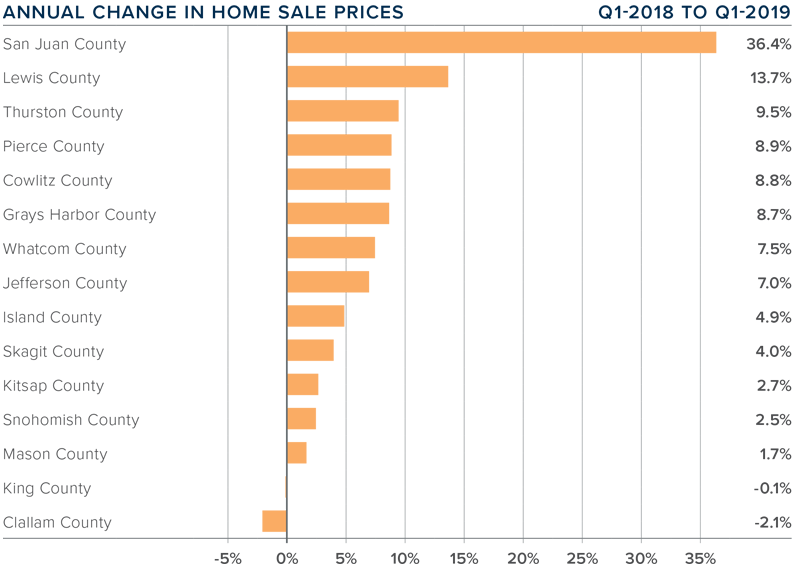
 This speedometer reflects the state of the region’s real estate market using housing inventory, price gains, home sales, interest rates, and larger economic factors. I am again moving the needle toward buyers as price growth moderates and listing inventory continues to rise.
 Windermere Hillsboro

")


