Nothing beats the feeling of buying a new home. You’ve worked hard with your agent to find the right home for you, you’ve worked with the seller to finalize the deal, and you’ve signed all the paperwork to transfer ownership. Congratulations! Everything has led to securing your new home, so now that you’re officially moving, what do you do next? Here’s a quick guide to the move-in process to help you get settled into your new home.
Moving Day
The day you move, you’ll be juggling all kinds of timelines at once. You’re coordinating with movers, arranging for trucks to be picked up and dropped off, and making sure that nothing gets damaged in the process. The best thing you can do on this chaotic but exciting day is to be available. Being on hand at your new home to answer the mover’s questions will help speed up the process.
It helps to have a checklist of your important items to make sure nothing has gotten lost during the moving process. Check these items off one by one as the movers bring them in. Next, you’ll want to confirm that the utilities have been turned on and are ready for use. Check all lights, smoke detectors, appliances, CO2 alarms, your home security system, fire extinguishers, etc. Finally, install new locks and make sure your keys work properly.
Clean and Unpack: Before you start emptying your boxes, it’s a good idea to wipe down the surfaces to keep your items from getting dirty. A full deep cleaning of your home may not be in the cards just yet since there’s still plenty of moving to be done, which inevitably brings more dust and dirt in the house.
Childproof and Pet-Safe Home: If you’ve got little ones and/or pets, this is the time to set up their accommodations. Learn more about how to properly childproof your home so your kids can feel like it’s home sweet home from day one. When preparing to house your pets, keep in mind that some cleaning methods are more pet-friendly than others.
Setup and Organize: Now it’s time to get everything in its right place. Organize room by room, storing items in logical places where you won’t forget them as soon as they’re stowed away. The first rooms you’ll want to tackle are the bedrooms, bathrooms, and kitchen. These are the rooms you’ll need the most during the first few days in your new home, so having them put together will better position you to tackle the rest of the house. Getting your closets, bathroom cabinets, and kitchen drawers organized from the start will make for a more enjoyable moving process.
Update Your Information: You’ll also want to update your address everywhere it’s applicable as soon as possible, consider setting up mail forwarding to ensure you don’t miss any important mail in the meantime.
For more information on the moving process, visit our comprehensive Moving Checklist, available as a interactive webpage and downloadable PDF here:
Your home’s interior can offer you peace of mind, but there’s nothing like the connection between your patio and the great outdoors. With a little privacy, you can relax and unwind at home like never before. Here are five creative tips to add privacy to your patio or balcony and turn into your own personal retreat.
5 Ways to Add Privacy to Your Patio or Balcony
1. Vertical Gardening
Incorporating nature into your outdoor space will not only help you make it more private, but it will also help bring the space to life with an organic touch. Vertical gardens will liven up your patio while making it more secluded. Choose plants that thrive in your local climate and complement your home décor style.
2. Install a Pergola or Canopy
Looking to make your backyard a bit more exclusive while providing some shade? A pergola or canopy will do the trick. This versatile choice is also fitting for any homeowners who like to entertain and want to extend their parties to the outdoors. To set up, pick a central space on your patio for your pergola that won’t interrupt the flow of foot traffic. These furnishings may be the missing piece for your backyard retreat; they will protect you from the elements year-round while maintaining that open-air feeling you’re looking for.
Your patio privacy project will lead you toward some creative decorative opportunities. Privacy screens work like a fence for your home, in that they help to enclose your property from your neighbors. However, unlike a fence, they are easy to move around and come in various styles and materials to match your taste in outdoor décor. Typically made of vinyl, metal, wood (bamboo is a popular choice), and artificial greenery, these products may be just what you’re looking for to frame your private patio area.
4. Planters
You can create a barrier and refresh your backyard or balcony patio aesthetics at the same time with planters filled with tall plants. If you’re willing to wait, trees and vining plants can grow into lush fences over time. If you’re hoping for a quicker solution, consider lifted planters with mature bushes or hang planters with plants that cascade down. How to Create a Balcony Garden
Image Source: Getty Images – Image Credit: vm
5. Outdoor Curtains and Art
Finding the right items to hang will help create the backyard oasis you’re dreaming of. For those with a vertical structure in the backyard like a pergola or gazebo, or a balcony that can hold a tension rod, consider adding outdoor curtains for some elegance and privacy. For a more personalize approach, a gallery wall can also help keep the creative juices flowing outdoors while connecting the space to the inside of the house. Search for weather-resistant frames that will hold up as the seasons change and hang them on sturdy strings or repurpose a room divider. How to Create a Gallery Wall at Home
With a dash of décor, some elements of nature, and your own personal design touch, you’ll create the outdoor space you’ve always wanted. No matter how much we love our interior, it’s nice to get outside and breathe some fresh air while still feeling like you’re at home. Get more tips on how to transform your home here:
Whether you’ve listed multiple homes or you’re a first-time home seller, you’ve likely come across the word “contingent” before. Contingent home sales, though very common, aren’t as simple as a real estate transaction without them. With contingencies, there are additional factors at play and added criteria that need to be met for the deal to go through. As a seller, being aware of these offers will help to inform your discussions with your agent once you know it’s time to sell your home.
What is a contingent offer?
Contingent offers in real estate give the buyer or seller the right to back out of the contract if the conditions aren’t met. There are different types of contingencies that determine what must happen for the deal to go through, which means buyers have options. Depending on their situation, whether they are selling their current home while making an offer on yours, unsure whether they can secure the right financing, or want to wait for the results of the home inspection before finalizing their offer, they’ll explore contingencies with their real estate agent as they build their offer.
This may feel a bit like buyers want to have their cake and eat it too, but every homeowner can understand the desire to protect their investment before fully diving in. In a seller’s market, there are fewer homes available, which means buyers will do whatever they can to make their offer stand out. Because sellers have the leverage in these market conditions, you’ll often see buyers waiving their contingencies. Talk to your agent for more information about the local market conditions in which you’re selling.
Should I accept a contingent offer on my house?
Each home sale is different, and each seller has a unique story. What you’re looking for in an offer may be different from what someone else in your neighborhood is looking for when selling their home. It all depends on your circumstances, your timeline, your next steps, and your local market conditions. The extra stipulations in a contingent offer require the attention of an experienced real estate agent who can interpret what they mean for you as you head into negotiations.
Contingent offers can fall through more often than non-contingent ones, but there’s no general rule of thumb. Whether a sellers and buyer are able to agree on the terms of a deal is a case-by-case situation. Different contingencies may carry different weight among certain sellers, and local market conditions usually play a significant role. For up-to-date information about your local market, visit the Market News category of our blog.
Pros: Accepting a contingent offer means you don’t have to take your home off the market quite yet, since the conditions of the deal haven’t been met. If the buyer backs out of the deal, you can sell without having to re-list. In certain cases, some buyers may be willing to pay extra to have their contingent offer met.
Cons: Home sales with contingent offers are usually slower than those without. It takes time to satisfy a buyer’s contingencies and additional time to communicate that they have been met. And of course, there’s always the risk that the deal could fall through.
As always, trust your agent for guidance when facing contingent offers. Connect with a local Windermere Real Estate agent today:
Windermere Chief Economist Matthew Gardner gives an updated look at U.S. home prices and housing affordability in 2023 by examining two key second-quarter reports from ATTOM Data Solutions and the National Association of Home Builders (NAHB).
This video is the latest in our Monday with Matthew series with Windermere Chief Economist Matthew Gardner. Each month, he analyzes the most up-to-date U.S. housing data to keep you well-informed about what’s going on in the real estate market.
U.S. Home Prices 2023
Hello there, I’m Windermere Real Estate’s Chief Economist Matthew Gardner and welcome to this month’s episode of Monday with Matthew. Today we are going to look at home prices and housing affordability. To do this I will be looking at the second quarter sales price data from ATTOM Data Solutions and we will also look at the just released National Association of Home Builders Housing Opportunity Index for the second quarter.
Are home prices dropping?
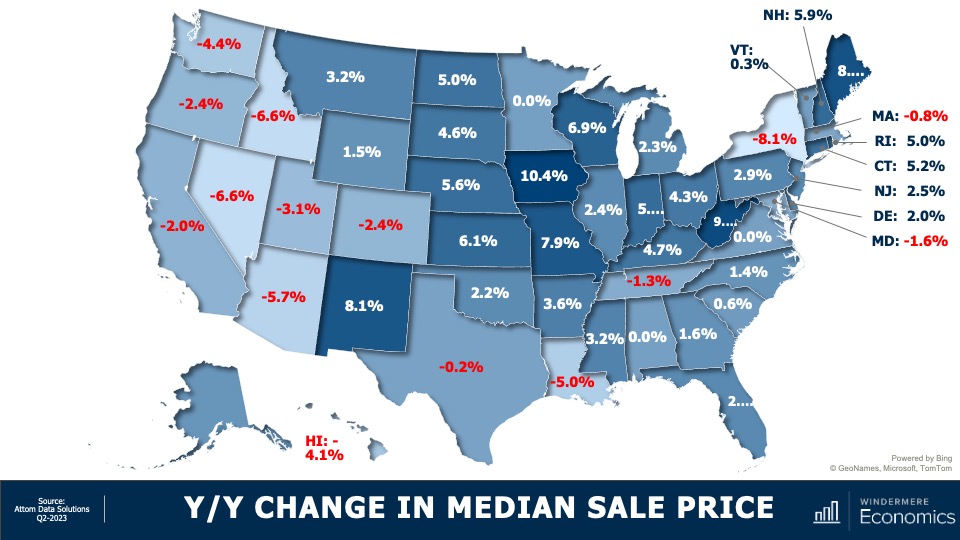
Starting with the year-over-year change in sale prices at the state level, there aren’t any great surprises. For the past several months I’ve been saying that as the Western U.S. saw the greatest price growth during the pandemic, so it’s not surprising to see most states sale prices in the quarter below the level seen a year ago. But it was pleasing to see that sale prices in 36 states either matched the level seen a year ago or were higher, and in some instances quite significantly so.
U.S. Home Sale Prices 2023 By State
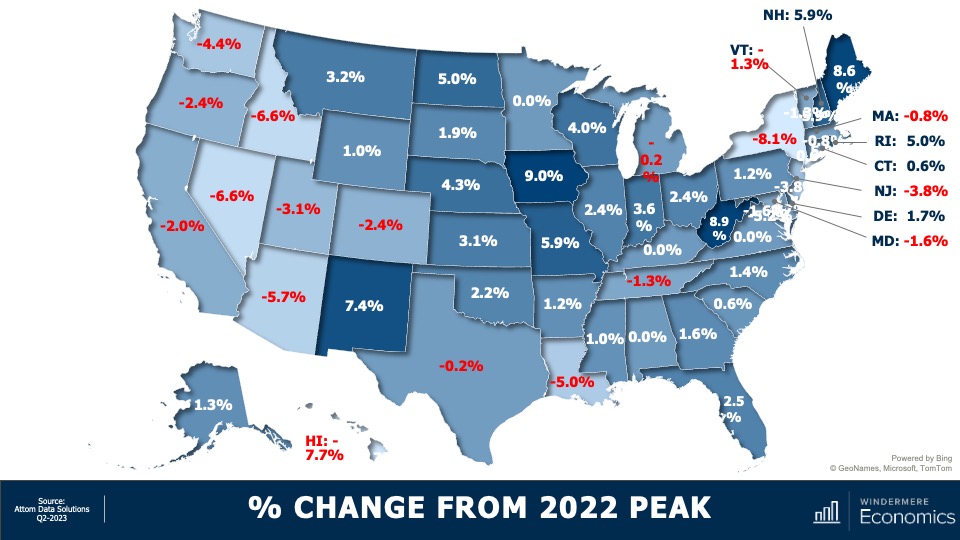
And when we compare second quarter sale prices to their 2022 peaks, 33 states are at or above the highs seen last year, but most of the Western States have yet to fully recover. In the South, Louisiana is still lagging by a good amount, as is New York State on the East Coast.
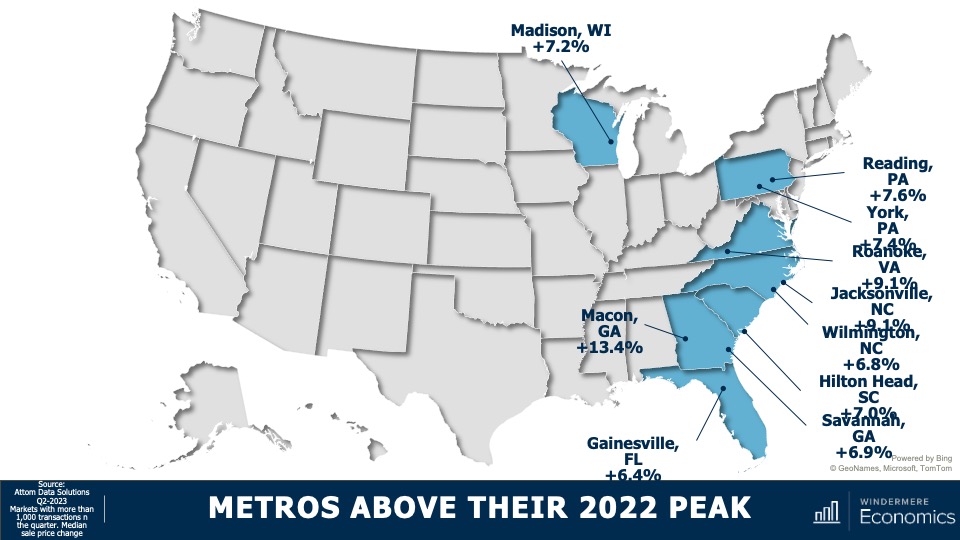
But as you are all very aware, all markets are different. I thought it would be interesting to dig a little deeper into the data to see which metro markets have seen significant gains over the past 12 months. It’s going to be interesting specifically because of the fact that mortgage rates have risen so much.
Metro Areas: Home Sale Prices 2023
These are markets where sale prices are far above their 2022 peak sale prices. Now I must add that I only looked at markets where more than 1,000 transactions occurred in the last quarter, which takes out some of the volatility. Notably, even though the state of Virginia’s home prices in the quarter were flat when compared to their 2022 peak, the Roanoke market was up by over 9%. And in Pennsylvania, where state prices were only 1.2% above their 2022 peak, Reading is up by 7.6% and York by 7.4%. And in Georgia, where state sale prices were up a modest 1.6%, homes in Macon have leapt by over 13% and prices are up by 6.9% in Savannah.
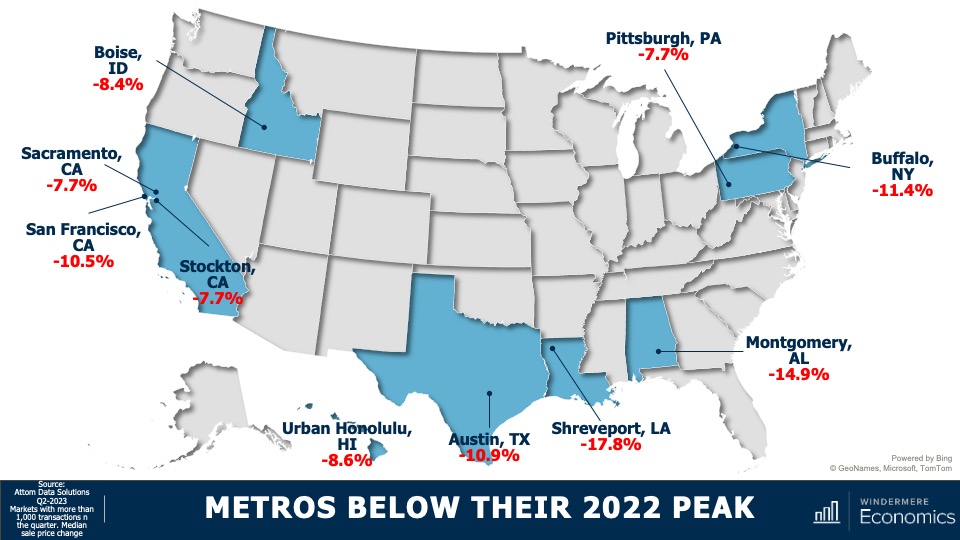
But, on the other end of the spectrum, there are markets which are underperforming their respective states and, unsurprisingly, California tops the list with three of their metros seeing prices significantly below that of the state as a whole. In other parts of the country, several metro areas which were relatively affordable before the pandemic saw an influx of remote workers and this led prices to skyrocket, and these will take some time to recover. This is particularly true in the Austin and Boise market areas.
I would add that, of the counties across the country where there were more than 1,000 transactions in the second quarter, half have met or exceeded their prior peak and—of the half where sale prices were still lower—the average shortfall is only around 4% and there are just seven counties in the country where sale prices are down by more than 10% from their 2022 peaks.
Now, what I see in the data is that the U.S. housing market, although certainly not fully healed, is headed in the right direction even when faced with mortgage rates that remain remarkably high. So, with sale prices recovering and still faced with stubbornly high financing costs, what does affordability look like?
U.S. Housing Affordability 2023
Well, according to the National Association of Homebuilders (NAHB), of the 241 metros that they track, just 40.5% of sales in the second quarter were affordable to households making the area’s median income—that’s the second lowest share of sales seen since they started generating this dataset a decade ago. Now, their data does go back to 2004, but the interest rate series that they used to use was discontinued, so it’s not accurate to compare their data today with anything before 2012.
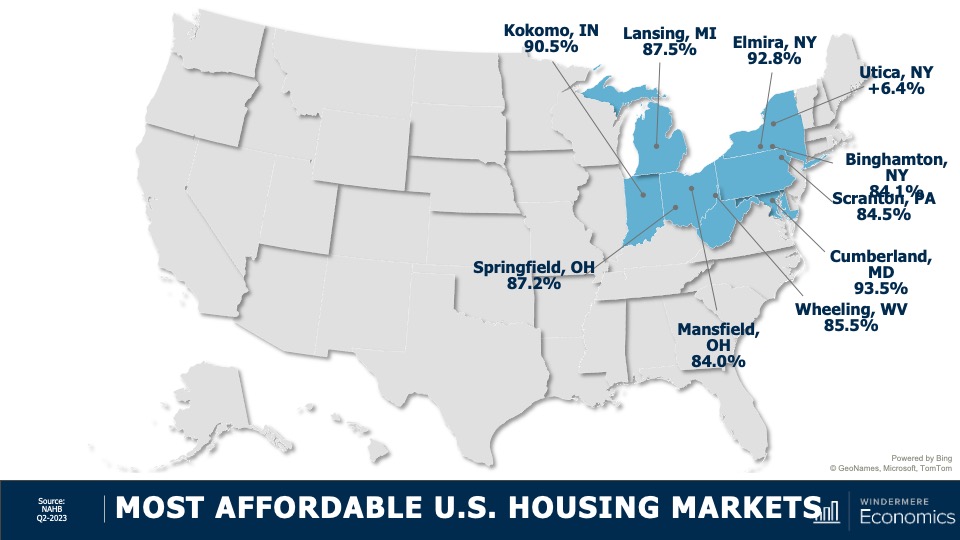
Most Affordable U.S. Housing Markets
These were the most affordable markets in the second quarter and their locations should not be of any great surprise. Average sale prices in these markets were measured around $203,000—that’s just marginally above 50% of the national sale price in the quarter, which was $402,600.
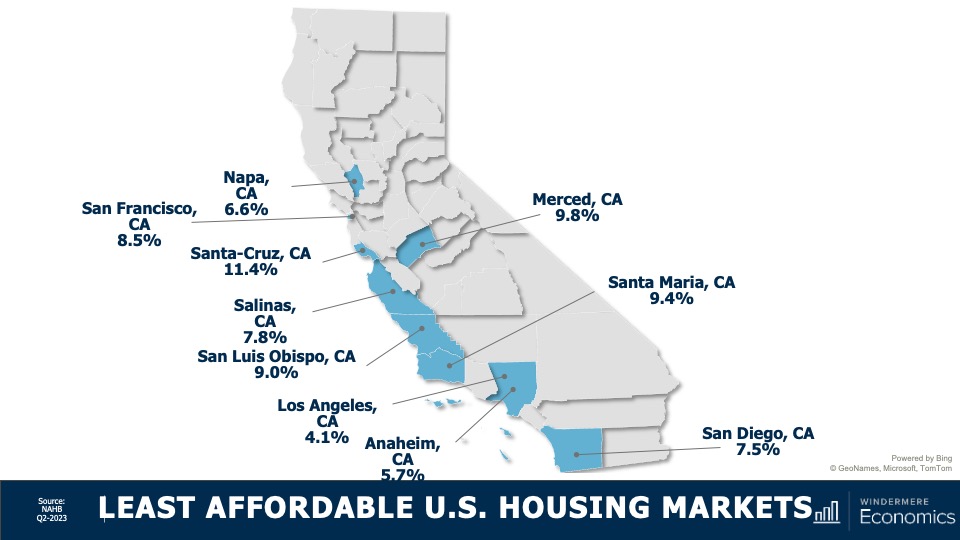
Least Affordable U.S. Housing Markets
And unfortunately this should not surprise you either. On the other end of the spectrum, the top-10 least affordable housing markets were all in California, but it gets worse than that. The top 15 least affordable markets again, all in California, and 19 out of the top 25 were in the Golden State!
As far as I can see, the ownership housing market is still showing remarkable resiliency, especially given that mortgage rates have more than doubled from their lows and they’ve risen from 4.8% at the start of the second quarter of last year to 7% at the end of the second quarter of 2023.
Now, I still expect to see rates starting to slowly move lower as we go through the second half of the year. This will help with prices and, to a degree, affordability, but until we see a significant increase in the number of homes listed for sale, the market is going to remain unbalanced.
As always, I’d love to hear your thoughts on this subject so feel free to leave your comments below. Until next month, stay safe out there and I’ll see you soon. Bye now.
To see the latest real estate market data for your area, visit our quarterly Market Updates page.
About Matthew Gardner
As Chief Economist for Windermere Real Estate, Matthew Gardner is responsible for analyzing and interpreting economic data and its impact on the real estate market on both a local and national level. Matthew has over 30 years of professional experience both in the U.S. and U.K.
In addition to his day-to-day responsibilities, Matthew sits on the Washington State Governors Council of Economic Advisors; chairs the Board of Trustees at the Washington Center for Real Estate Research at the University of Washington; and is an Advisory Board Member at the Runstad Center for Real Estate Studies at the University of Washington where he also lectures in real estate economics.
Buying a home is one of the most significant financial and emotional purchases of a person’s life. That’s why it is so important to find an agent that can not only help you navigate the home search process while answering your questions and addressing your needs from start to finish. Most importantly, your agent should care about your happiness and ensuring that you find the right home for you. Here are some important qualities to consider when selecting a real estate agent.
10 Qualities to Look for in Your Real Estate Agent
1. Likable: More than likely, you will be spending significant time with your agent. You’ll be side by side throughout the ups and downs of the buying process, so it’s worth it to spend time looking for someone that you enjoy interacting with. Working with a Buyer’s Agent
2. Trustworthy: One of the best ways to find an agent who you feel you can trust is to ask friends and family for a referral. You can also interview different agents and ask for client references. When vetting agents, prioritize their trustworthiness along with their business acumen and ask questions that will help you narrow your search. If you’re having trouble knowing where to begin. Here are a few common questions you can ask to get the conversation started:
How do you help buyers to make their offer stand out?
How many clients are you working with currently?
What is the best way to contact you?
How long have you been an agent in the local market?
Do you represent both buyers and sellers?
Do you have recommendations for mortgage brokers, home inspectors, etc.?
3. Effective Listener: While your agent can’t read your mind, they should be able to make educated recommendations and offer advice by listening closely to your needs. Make sure you talk to your agent about your priorities, what types of features appeal to you, as well as any factors that could be deal breakers. This will equip your agent with everything they need to help find you the perfect home as they explore the Multiple Listing Service (MLS) for available listings.
4. Qualified and Experienced: Make sure your agent has the qualifications and experience to meet your specific needs. For example, some agents have more experience with short sales, while others might be experts on certain neighborhoods or types of housing. Find someone who is good at what you’re looking for. Ask specific questions when you interview them so you can get a better idea of what they’re great at, and if they’ll be a good fit for your search. For a comprehensive list of real estate agent certifications, visit our blog:
5. Knowledgeable: A great agent is someone who is out in the neighborhoods, exploring communities, visiting listings, staying up to date with market and industry news, and collecting all the information that you need to make an informed, confident decision about your real estate needs. For up-to-date information about your local market, visit the Market News category of our blog.
6. Honest: Your agent should be upfront and honest with you about every aspect of your home search process—even if it involves delivering bad news. The best real estate agents are more concerned about finding the right home for their clients, not just the home that brings in the fastest commission check.
7. Local: Every community is different, and all real estate is local, so it’s important to find someone who really knows the local market and can provide you with the information you need to familiarize yourself with a particular area. This will narrow your home search and help you find listings you can afford.
8. Connected: A well-connected agent will have relationships with lenders, inspectors, appraisers, contractors, and any other service provider you might need during your home search. Though your agent will be your greatest asset in the home buying process, it takes several people to successfully purchase a home.
9. Straightforward: You want an agent who will work hard to help you find the best home, but you also want someone who will be straightforward with you about the process and how to set realistic expectations given the market conditions in which you’ll be buying.
10. Committed: Your agent should be in it for the long haul, meaning that they’re looking out for your best interests every step of the way, no matter how long the process takes. Connect with a local, experienced Windermere Real Estate Agent today:
The truth is, the average size of apartments in the U.S. is shrinking, and studio and one-bedroom apartments are becoming more prevalent (rentcafe.com). This means knowing how to design for small spaces has never been more important. Whether you’re not quite ready to purchase a home or you’re looking to downsize, the creative possibilities are endless for maximizing square footage at home without sacrificing comfort or style. Let’s dive into some of the ways you can transform your home by making the most of your space.
Small Space Design Ideas
Multifunctional Furniture
All your essential items have to go somewhere, but how do you find a right place for everything without taking away from the rest of your home? Multifunctional furniture can be a lifeline for finding storage space without cluttering your home. Explore ottomans that have compartments to stow blankets, magazines, and other living room items. Folding desks can also ease the burden of storage without getting messy. Thanks to items like these, you can avoid investing in an outside storage unit just because you have limited square footage at home.
Fortunately, there’s more space available to you than the floor surface area of your home. Storage can be arranged vertically with items like hanging shelves and drawers. This can be especially helpful in the kitchen, where getting items up and away from the more cluttered areas within reach will clear counter space and make the space feel more open and inviting. Wall-mounted magnetic strips for knives and hanging racks for pots and pans can clear significant space.
When you move into a smaller space, you’ll be faced with a question: what do I really need? With only so much room available, this is the perfect opportunity for an exercise in minimalism. Paring down your possessions will reduce clutter and make the smaller spaces in your home feel roomier. Consider purchasing a bed with built-in storage drawers, which can eliminate the need for a bulky dresser in the bedroom. Get creative with floating shelves to lessen the need for large bookshelves and credenzas. Though these are common furnishings, they take up space and tend to dominate smaller rooms.
Image Source: Getty Images – Image Credit: Aleksandra Zlatkovic
With a touch of creativity, you can transform your home’s interior while maximizing your square footage, and most importantly, making your home feel more like you. For more tips on remodeling and more, visit the Living category of our blog:
The selling process is an emotional one. Fortunately, you’ll have an agent by your side from list to closing to help you take things one step at a time. A real estate agent’s expertise ranges far and wide, but as you prepare to sell your home, it helps to know that you can trust your agent to get the timing of the sale right. Let’s explore some of the ways that your agent will help you make the decision to sell your home.
We’ve all heard the adage “location, location, location” as it applies to buying a home, but it also factors into selling a home. Your location will determine your local market conditions, which, in turn, will form your approach to selling your home. Real estate agents have their finger on the pulse of market trends and property values, which gives them in-depth insight into the housing environment around you. They’ll use their access to the Multiple Listing Service (MLS) to perform a thorough Comparative Market Analysis (CMA) of your home to make sure you get the best price while factoring in your local market conditions.
Economic changes also play a role in the timing of your home sale. Mortgage rates, inflation, etc. are often in flux, and these changes can affect how buyers are approaching the market. Your agent will be able to offer insight into how the current economic conditions are influencing the housing market. For more information on this intersection between the economy and the housing market, plus up-to-date analyses of local market conditions in your area, visit the Market News section of our blog.
Best Time to Sell Your Home
Another tool in a listing agent’s toolkit is their knowledge of seasonality. Seasonal fluctuations in the housing market can influence your selling strategy, and your agent knows how these changes throughout the year affect your local housing market. For example, buying activity may dip locally in the winter. In this case, you could spend the winter getting your home ready to sell by spring by investing in high ROI home renovations and landscaping projects to improve curb appeal.
Real Estate Agent Networking
Your agent’s ability to access and analyze information will be a huge help in determining when to hit the market, but their relationships are equally important in getting your home sold to the right buyer. Real estate agents have strong connections to all the important people in the home selling process. Their network will help to facilitate the sale of your home once you’ve decided it’s the right time to sell. It takes a village to cross the finish line, and your real estate agent will help you connect with all the role players it will take to get there.
To learn more about selling your home, connect with a local Windermere Real Estate agent:
Prepping for parenthood? There are so many exciting changes on the horizon, but one change you’ll need to make at home is making sure you have a nursery all set up for your little one. As a renter, you may not have a ton of extra space to work with and you may also be limited by how many aesthetic changes you can make, but with the right guidance and a little creativity, your DIY nursery décor efforts can soar.
Nursery Preparation
Before you get into the design details, you need to choose a location for your nursery. Ideally, it will be close enough to your bedroom that you can quickly give your newborn the attention they need. To properly childproof your home, remove all unnecessary items from the nursery. Properly decluttering the area will help you prioritize safety. For more tips on childproofing your home, visit the U.S. Consumer Product Safety Commission online: Childproofing Tips – CPSC
DIY Nursery Décor
1. Creative Storage Ideas
As a renter, you’ve likely gotten practice maximizing space at home. Storage in the nursery will help to keep everything tidy while making sure that the things you and your child needs are never too far away. Floating shelves and wall-mounted organizers are two popular choices for making the most of vertical space. Be sure to check your lease and talk to your landlord before drilling into the walls to prevent permanent damage. Keep all toys, diapers, and baby-related accessories in easily reachable baskets, stored either underneath the bed or in the closet.
2. Nursery Color Palette
Let your imagination run wild with color design ideas for painting and decorating. Add splashes of colors in the window curtains, pillows, bedding, carpeting, and other accessory items throughout the room. You can also consider removable wallpaper to refresh the room. If you are decide to re-paint, use an indoor paint calculator to determine how much paint you’ll need and to cut down on wasted material.
3. Light and Dark
Finding the right lighting for your home is a room-by-room journey. The kitchen, for example, has different lighting needs than your cozy reading nook. Your nursery is a unique area when it comes to proper lighting. To create a calm atmosphere, choose soft, warm-temperature lamps with dimmers. This allows you to adjust the lighting levels to fit the time of day (or night). Less harsh light is easier on a newborn’s eyes and can make for less of a headache when you’re waking up multiple times a night. Babies also need lots of rest, so it’s important to install heavy curtains that block out sunlight and allow your little one to drift into deep sleep.
4. Bring Nature Indoors
Incorporating nature at home has aesthetic benefits, of course, but it’s also good for your health. Using organic materials, house plants, and earthy accessories can help you breathe easier and lower your stress levels at home. Consider adding small potted plants along the windowsill, installing a mobile with a touch of nature, or even incorporating a small water feature in the room to encourage serenity. A nature-infused nursery will help you relax your mind so you can take each at-home parenting step in stride. To further align your nursery’s design with the rest of your home, learn about which house plants match with different interior design styles.
5. Create a Gallery Wall
You’ll create many memories in your nursery. Who knows? It could be the room where your child takes their first steps or utters their first word. Use wall space creatively by creating a gallery wall with adhesive strips to minimize damage to the walls. You can add personal photos and keep track of special memories made with your family at home. Consider a corkboard or magnetic whiteboard to pin up new memories in sight as well.
For more info on home décor, remodeling tips and more, visit the Design category of our blog:
The following analysis of select counties of the Arizona real estate market is provided by Windermere Real Estate Chief Economist Matthew Gardner. We hope that this information may assist you with making better-informed real estate decisions. For further information about the housing market in your area, please don’t hesitate to contact your Windermere Real Estate agent.
Regional Economic Overview
Job growth in Arizona continues to slow. Though the state added 56,800 new jobs over the past 12 months, the annual growth rate of 1.8% is the lowest pace of growth since the pandemic ended. That said, the state’s unemployment rate in May was 3.4%, which was lower than the 3.7% rate we saw at the same time in 2022. Comparing the markets contained in this report to the second quarter of 2022, the Phoenix metro area saw its job base rise 1.9%, or 43,800 positions. The Prescott metro area saw employment rise 1.5%, with the addition of 1,000 new jobs. Unemployment rates suggested that both markets were at full employment. The jobless rate was 3.1% in the Phoenix area and 3.3% in the Prescott area. Both markets saw unemployment fall relative to the same period in 2022.
Arizona Home Sales
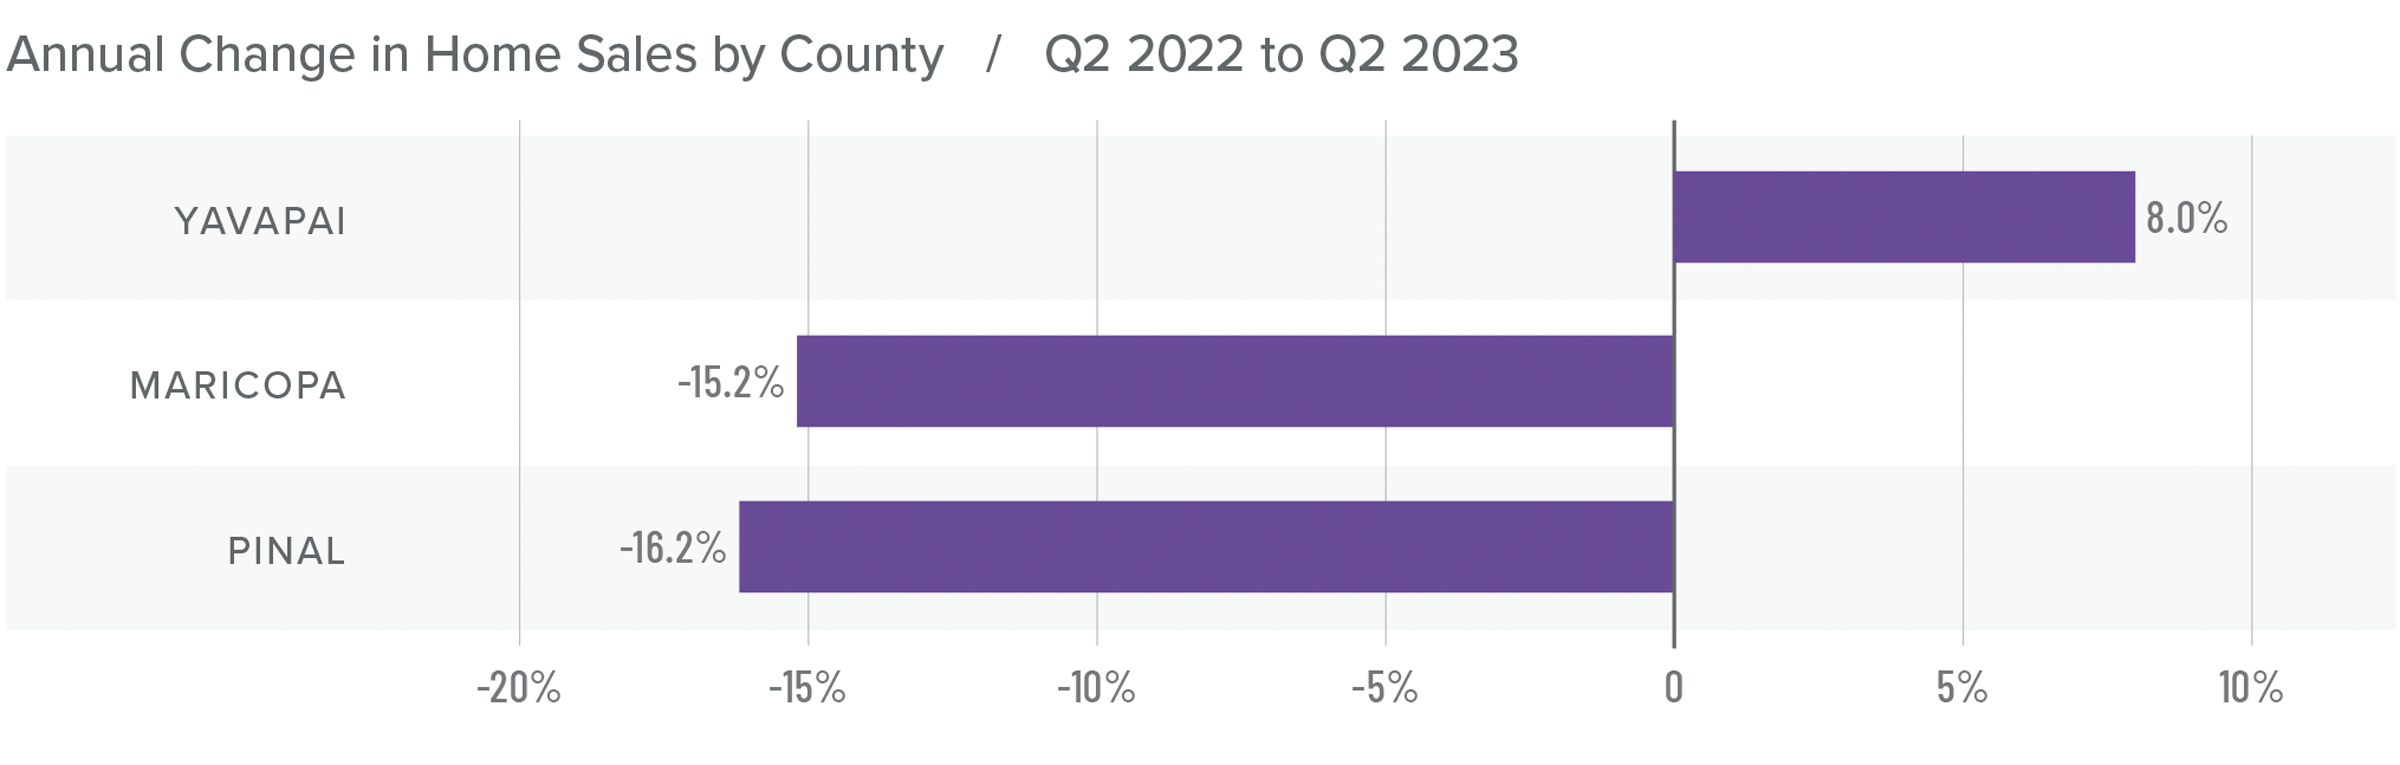
❱ In the second quarter of 2023, 18,658 homes sold. This was down 15.1% from the second quarter of 2022, but up a very impressive 24.6% compared to the first quarter of this year.
❱ The growth in quarter-over-quarter sales was more impressive given that average inventory levels in the quarter fell 23.4%.
❱ Sales fell in Maricopa and Pinal counties year over year. However, sales managed to rise 8% in the Prescott market. Compared to the first quarter of this year, sales rose substantially in all three counties. Pinal County led the charge as sales rose 37.1%.
❱ Pending sales rose in Pinal and Yavapai counties but fell in the larger Maricopa County market. This suggests that it might be a challenge to maintain this level of growth into the third quarter of the year.
Arizona Home Prices
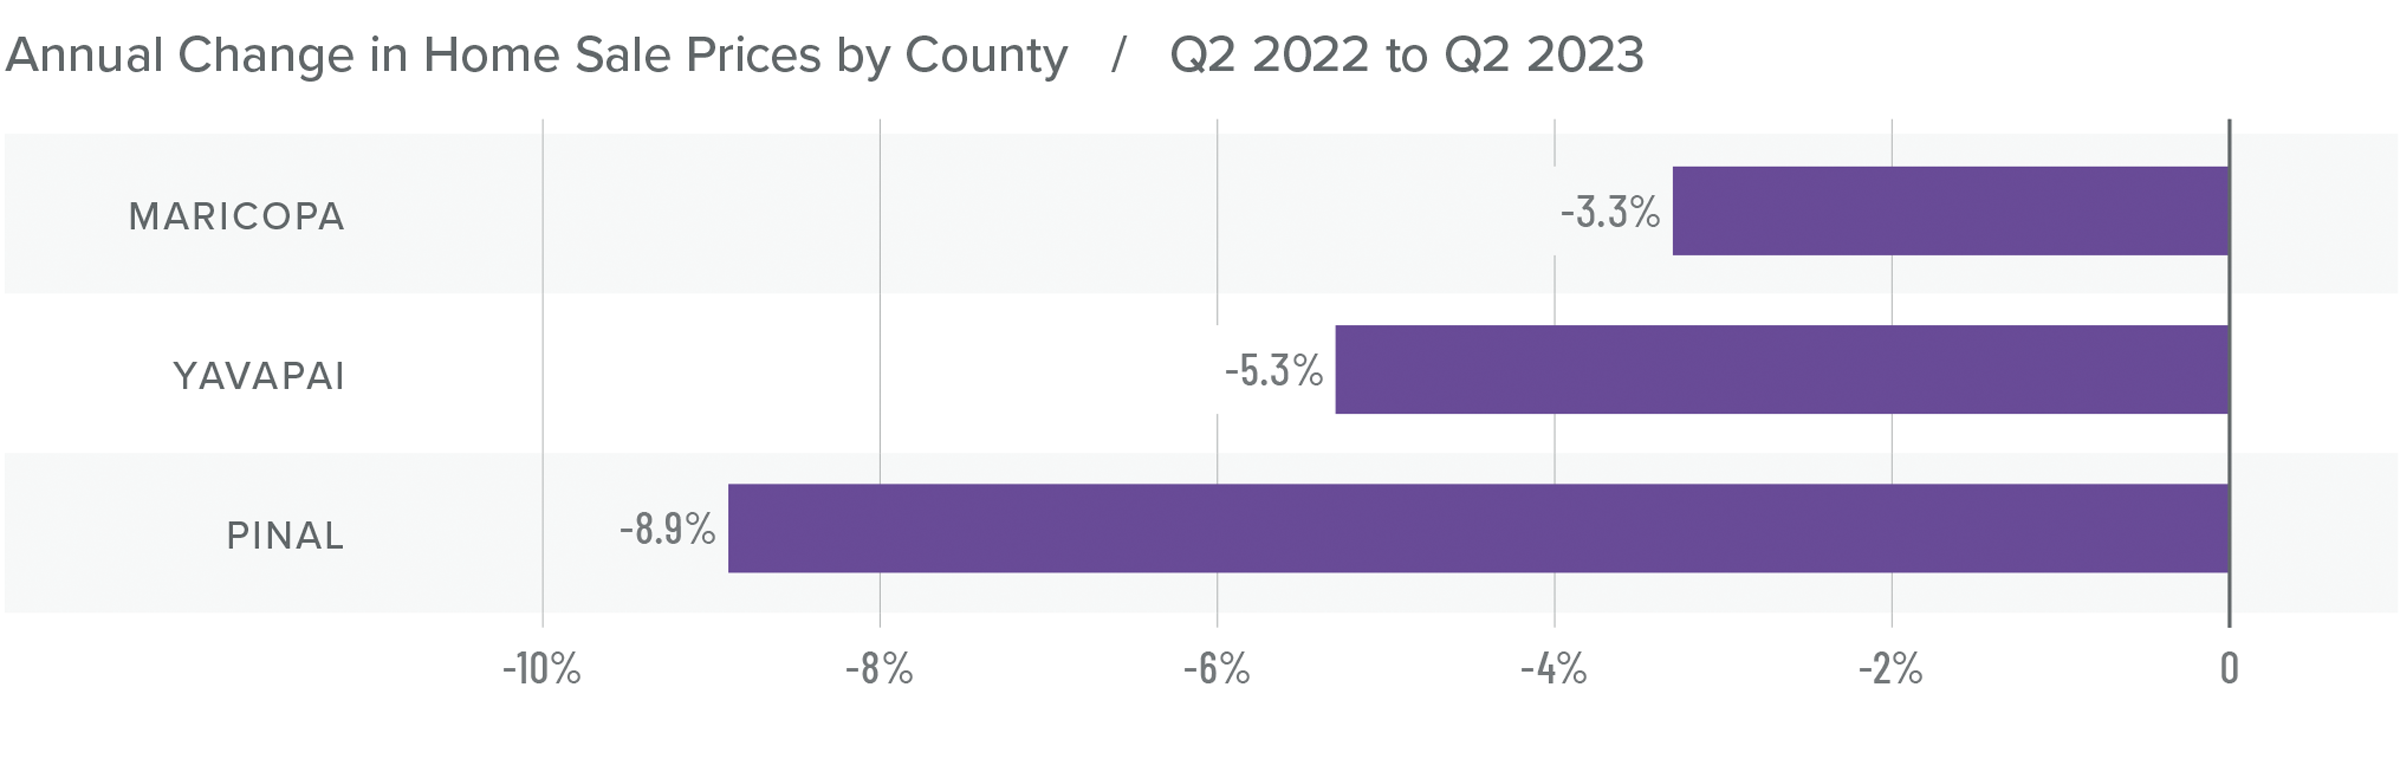
❱ Sale prices fell an average of 3.8% compared to the second quarter of 2022 but were 7.8% higher than in the first quarter of 2023. The average home sale price was $609,602.
❱ Compared to the first quarter of this year, prices were higher in all counties. Maricopa County saw particularly strong gains, with prices rising an average of 8.6%.
❱ The year-over-year drop in prices was not surprising given that the market was peaking in the second quarter of 2022 due to rapidly rising mortgage rates.
❱ It was interesting to see list prices rise in all markets compared to the first quarter of the year. Tight inventory levels have sellers feeling confident even in the face of significantly higher mortgage rates.
Mortgage Rates
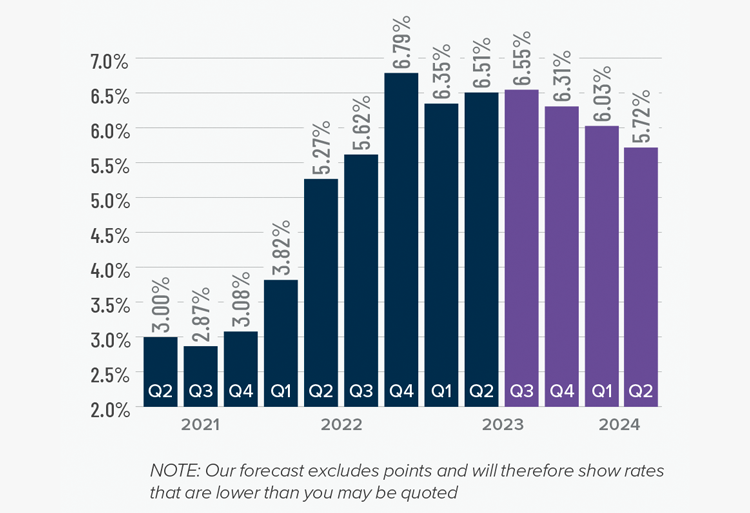
Although they were less erratic than the first quarter, mortgage rates unfortunately trended higher and ended the quarter above 7%. This was due to the short debt ceiling impasse, as well as several economic datasets that suggested the U.S. economy was not slowing at the speed required by the Federal Reserve.
While the June employment report showed fewer jobs created than earlier in the year, as well as downward revisions to prior gains, inflation has not sufficiently slowed. Until it does, rates cannot start to trend consistently lower. With the economy not slowing as fast as expected, I have adjusted my forecast: Rates will hold at current levels in third quarter and then start to trend lower through the fall. Although there are sure to be occasional spikes, my model now shows the 30-year fixed rate breaking below 6% next spring.
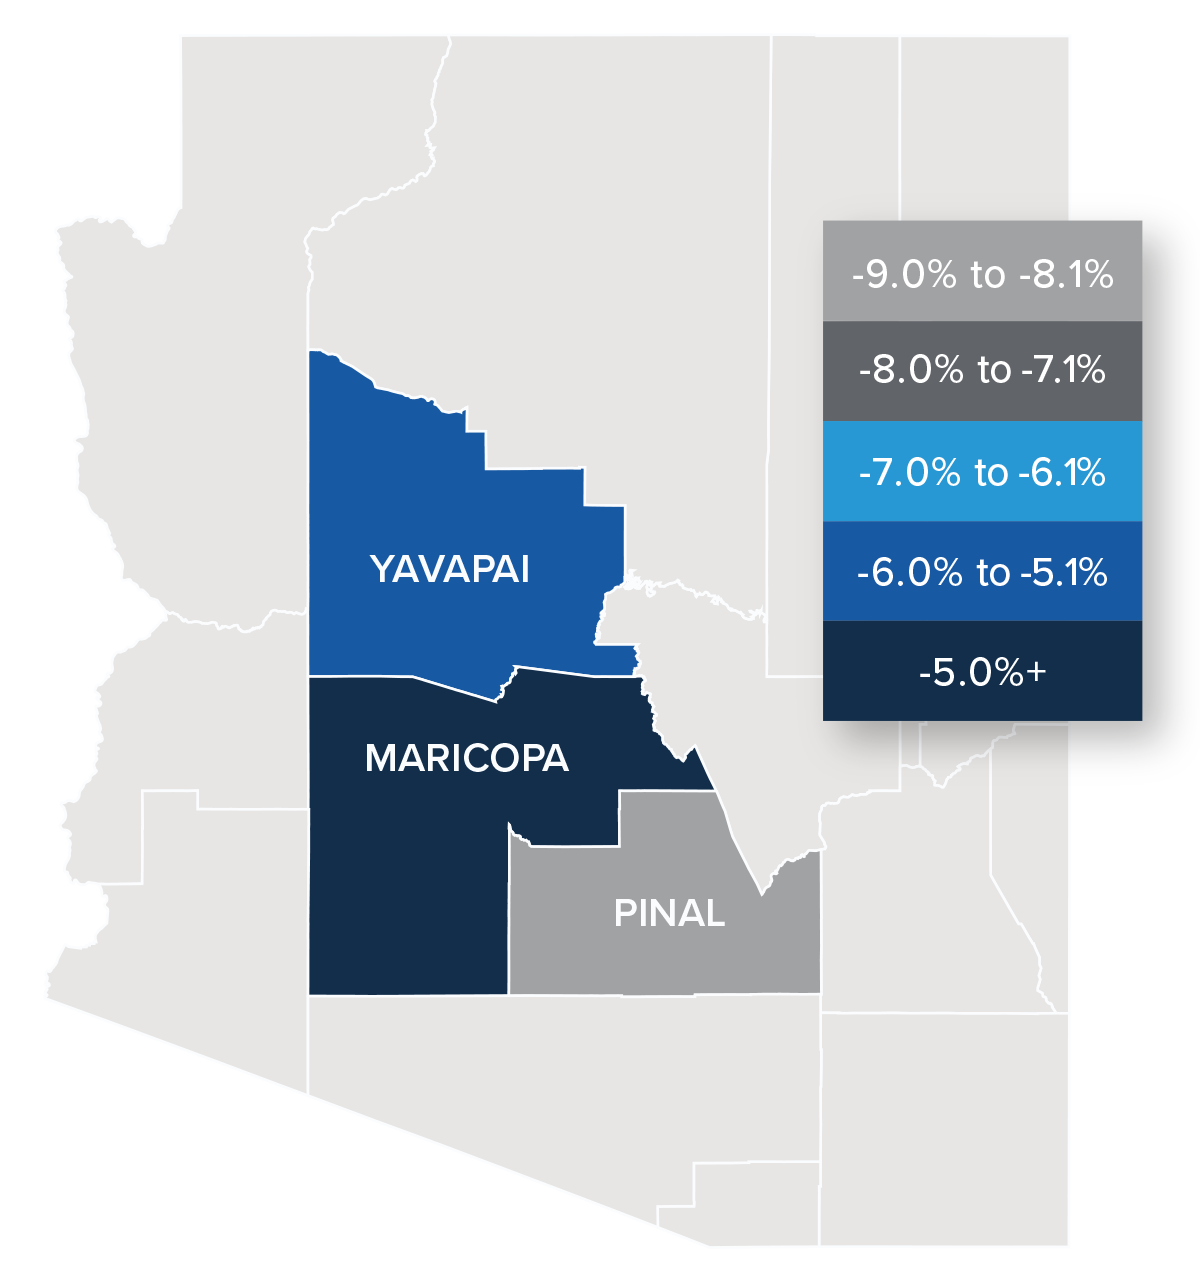
Arizona Days on Market
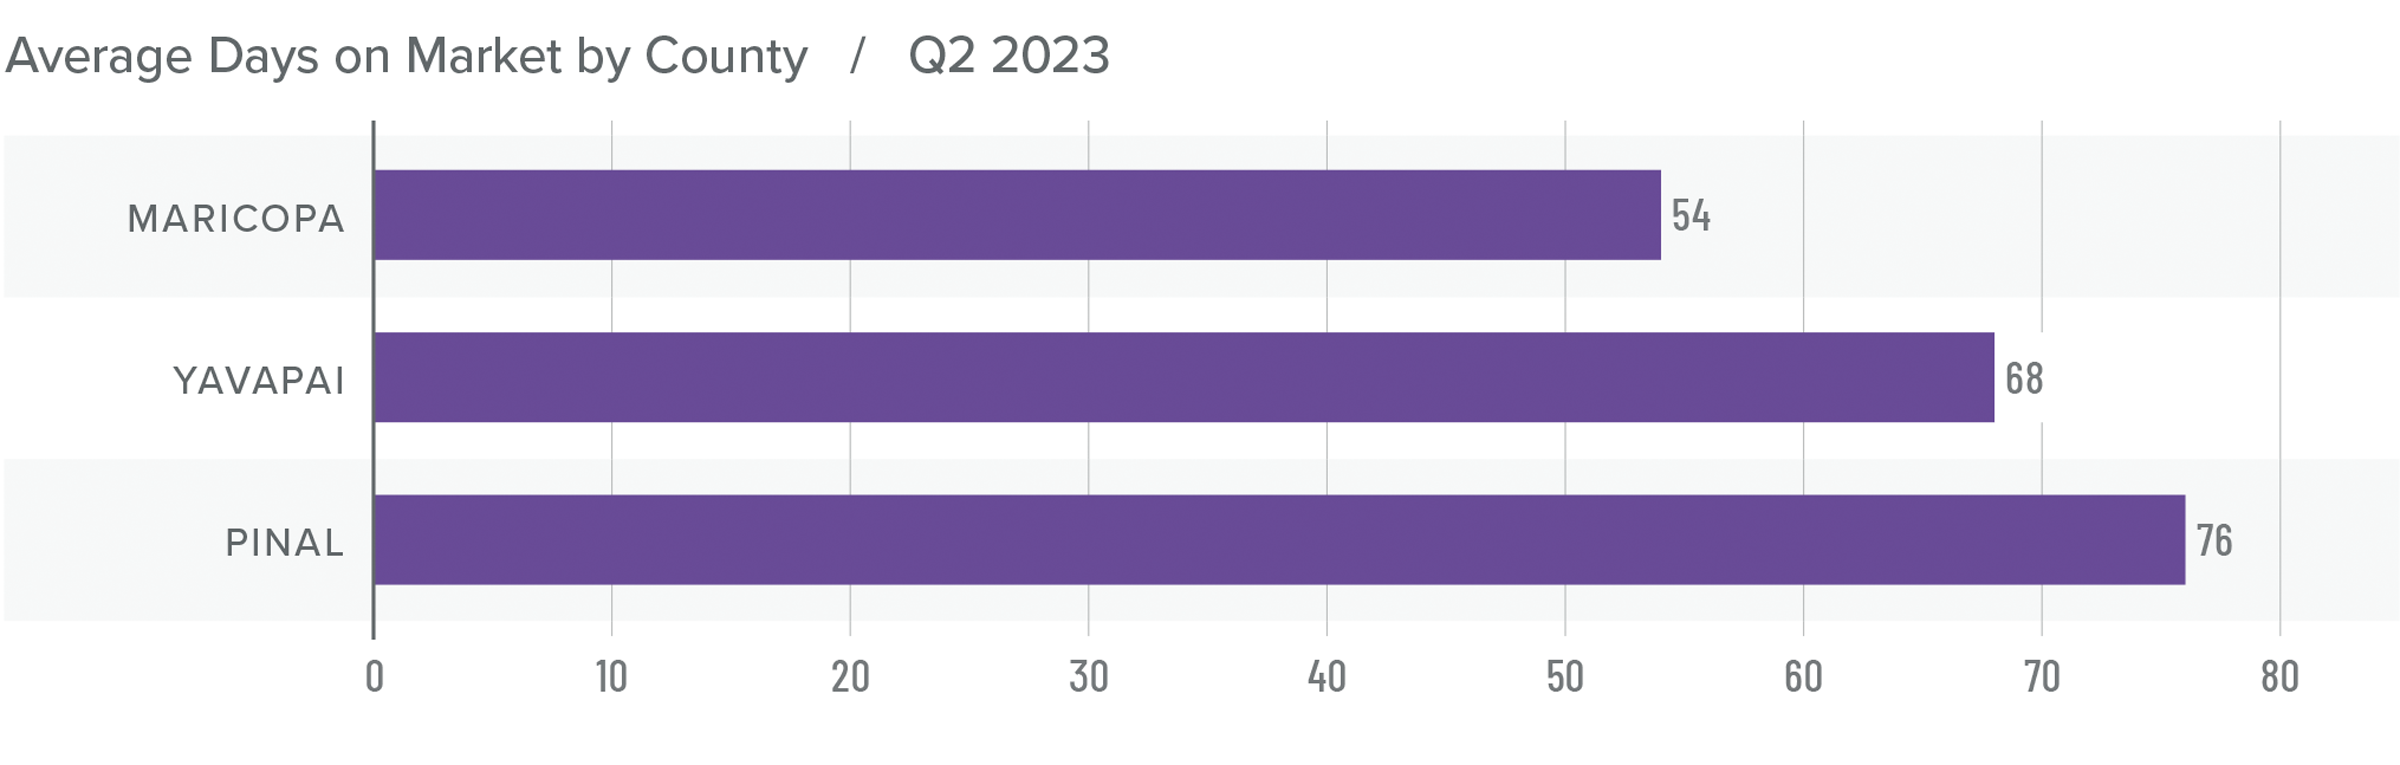
❱ It took an average of 66 days for a home to sell in the second quarter. This was 40 more days than in the same quarter of 2022, but 5 fewer days than in the first quarter of this year.
❱ Maricopa County was the tightest market in the region, with homes taking an average of 54 days to sell. Homes in Pinal County took the longest time to sell, at 76 days.
❱ All counties contained in this report saw average days on market rise from the same period in 2022. Compared to the first quarter of 2023, market time fell in Maricopa and Pinal counties and rose by two days in Yavapai County.
❱ The greatest fall in market time compared to the first quarter was in Maricopa County, where days on market fell 13 days.
Conclusions
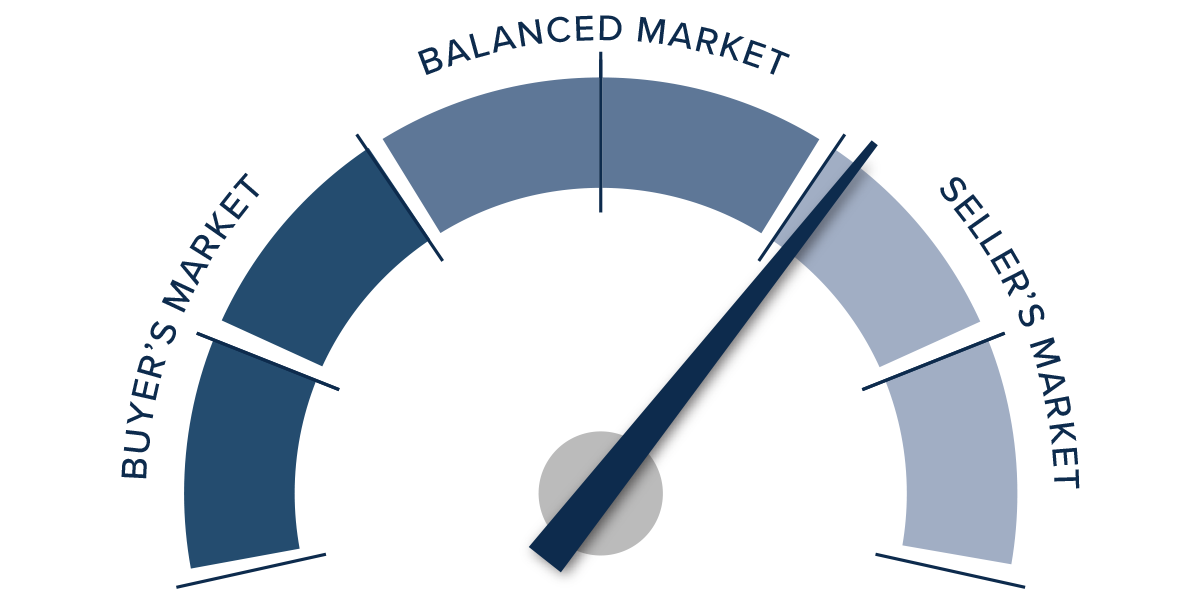
This speedometer reflects the state of the region’s real estate market using housing inventory, price gains, home sales, interest rates, and larger economic factors.
Even with mortgage rates well above levels we’ve seen over the past few years, demand for homes still exceeds supply. Given that almost 84% of homeowners with mortgages have an interest rate below 5% and almost a quarter have rates at or below 3%, there is little incentive for them to sell if they don’t have to. This suggests that supply levels are unlikely to improve to a level that meets demand until rates drop significantly. With this supply-demand imbalance, it’s not surprising that home prices are rising again following the decline in the second half of 2022. I expect this trend to continue through the second half of the year.
For the time being, rising list and sale prices, shorter time-on-market, and higher pending and closed sales appear to be offsetting higher mortgage rates. Given these factors, I have moved the needle in favor of sellers. However, it will be interesting to see what the market looks like after the summer lull.
About Matthew Gardner
As Chief Economist for Windermere Real Estate, Matthew Gardner is responsible for analyzing and interpreting economic data and its impact on the real estate market on both a local and national level. Matthew has over 30 years of professional experience both in the U.S. and U.K.
In addition to his day-to-day responsibilities, Matthew sits on the Washington State Governors Council of Economic Advisors; chairs the Board of Trustees at the Washington Center for Real Estate Research at the University of Washington; and is an Advisory Board Member at the Runstad Center for Real Estate Studies at the University of Washington where he also lectures in real estate economics.
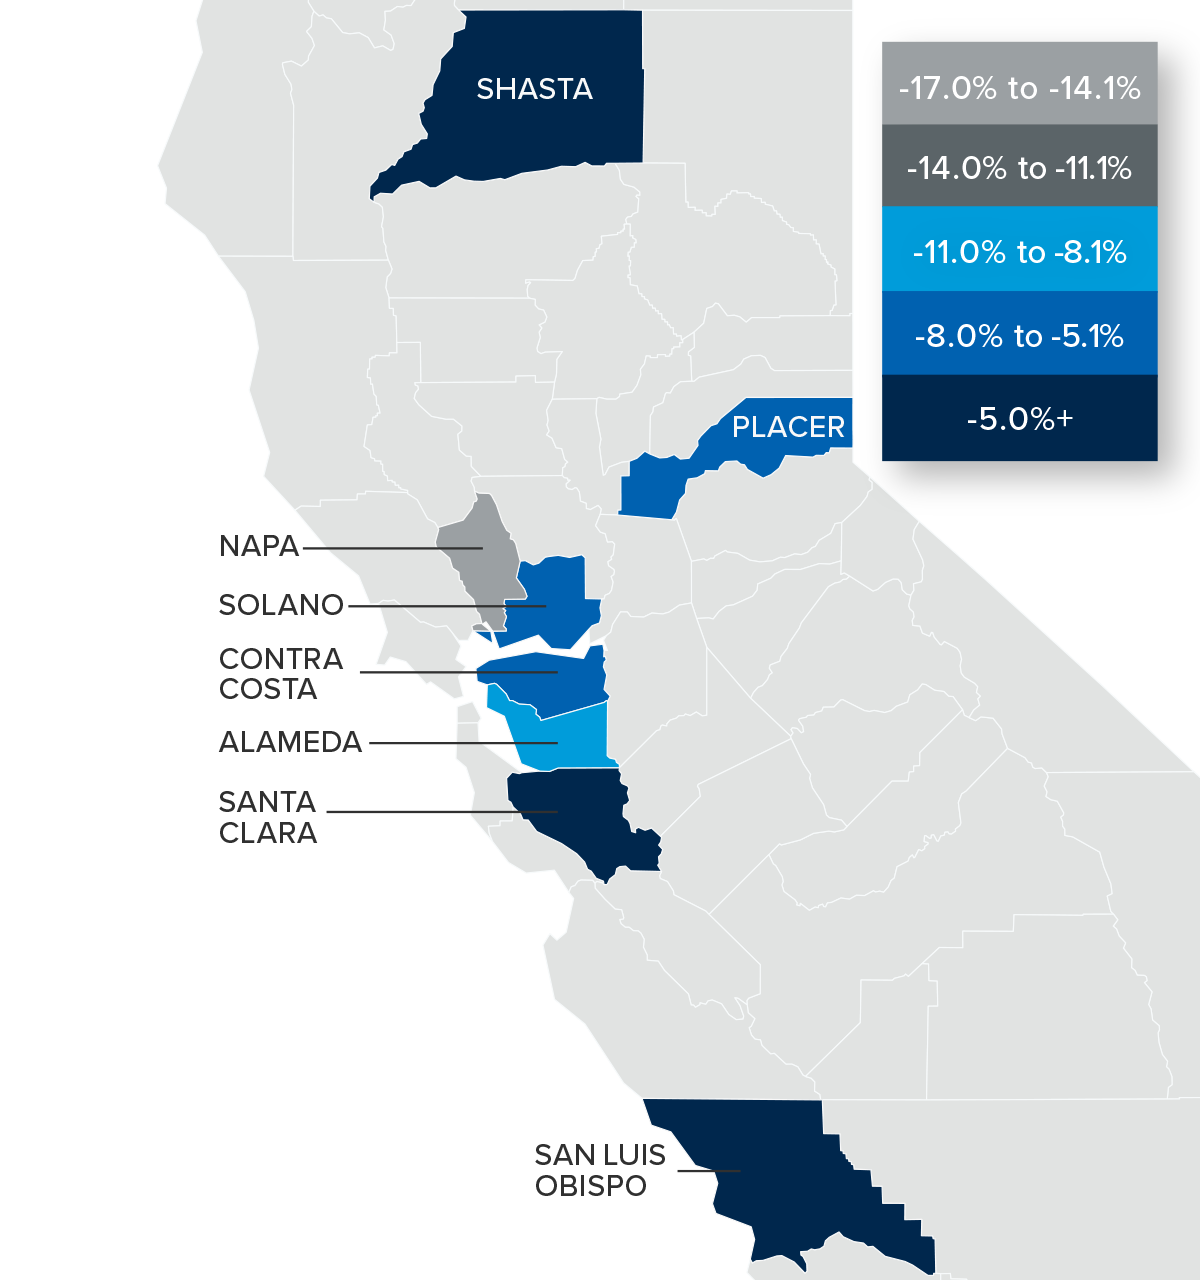
The following analysis of select counties of the Northern California real estate market is provided by Windermere Real Estate Chief Economist Matthew Gardner. We hope that this information may assist you with making better-informed real estate decisions. For further information about the housing market in your area, please don’t hesitate to contact your Windermere Real Estate agent.
Regional Economic Overview
Total employment in the counties covered by this report was flat year over year. Job gains in Placer, San Luis Obispo, and Santa Clara counties were offset by job losses in the rest of the region. That said, the regional unemployment rate was a reasonable 3.5%. The lowest jobless rate was in San Luis Obispo County (3%), and the highest rate was in Shasta County (4.9%).
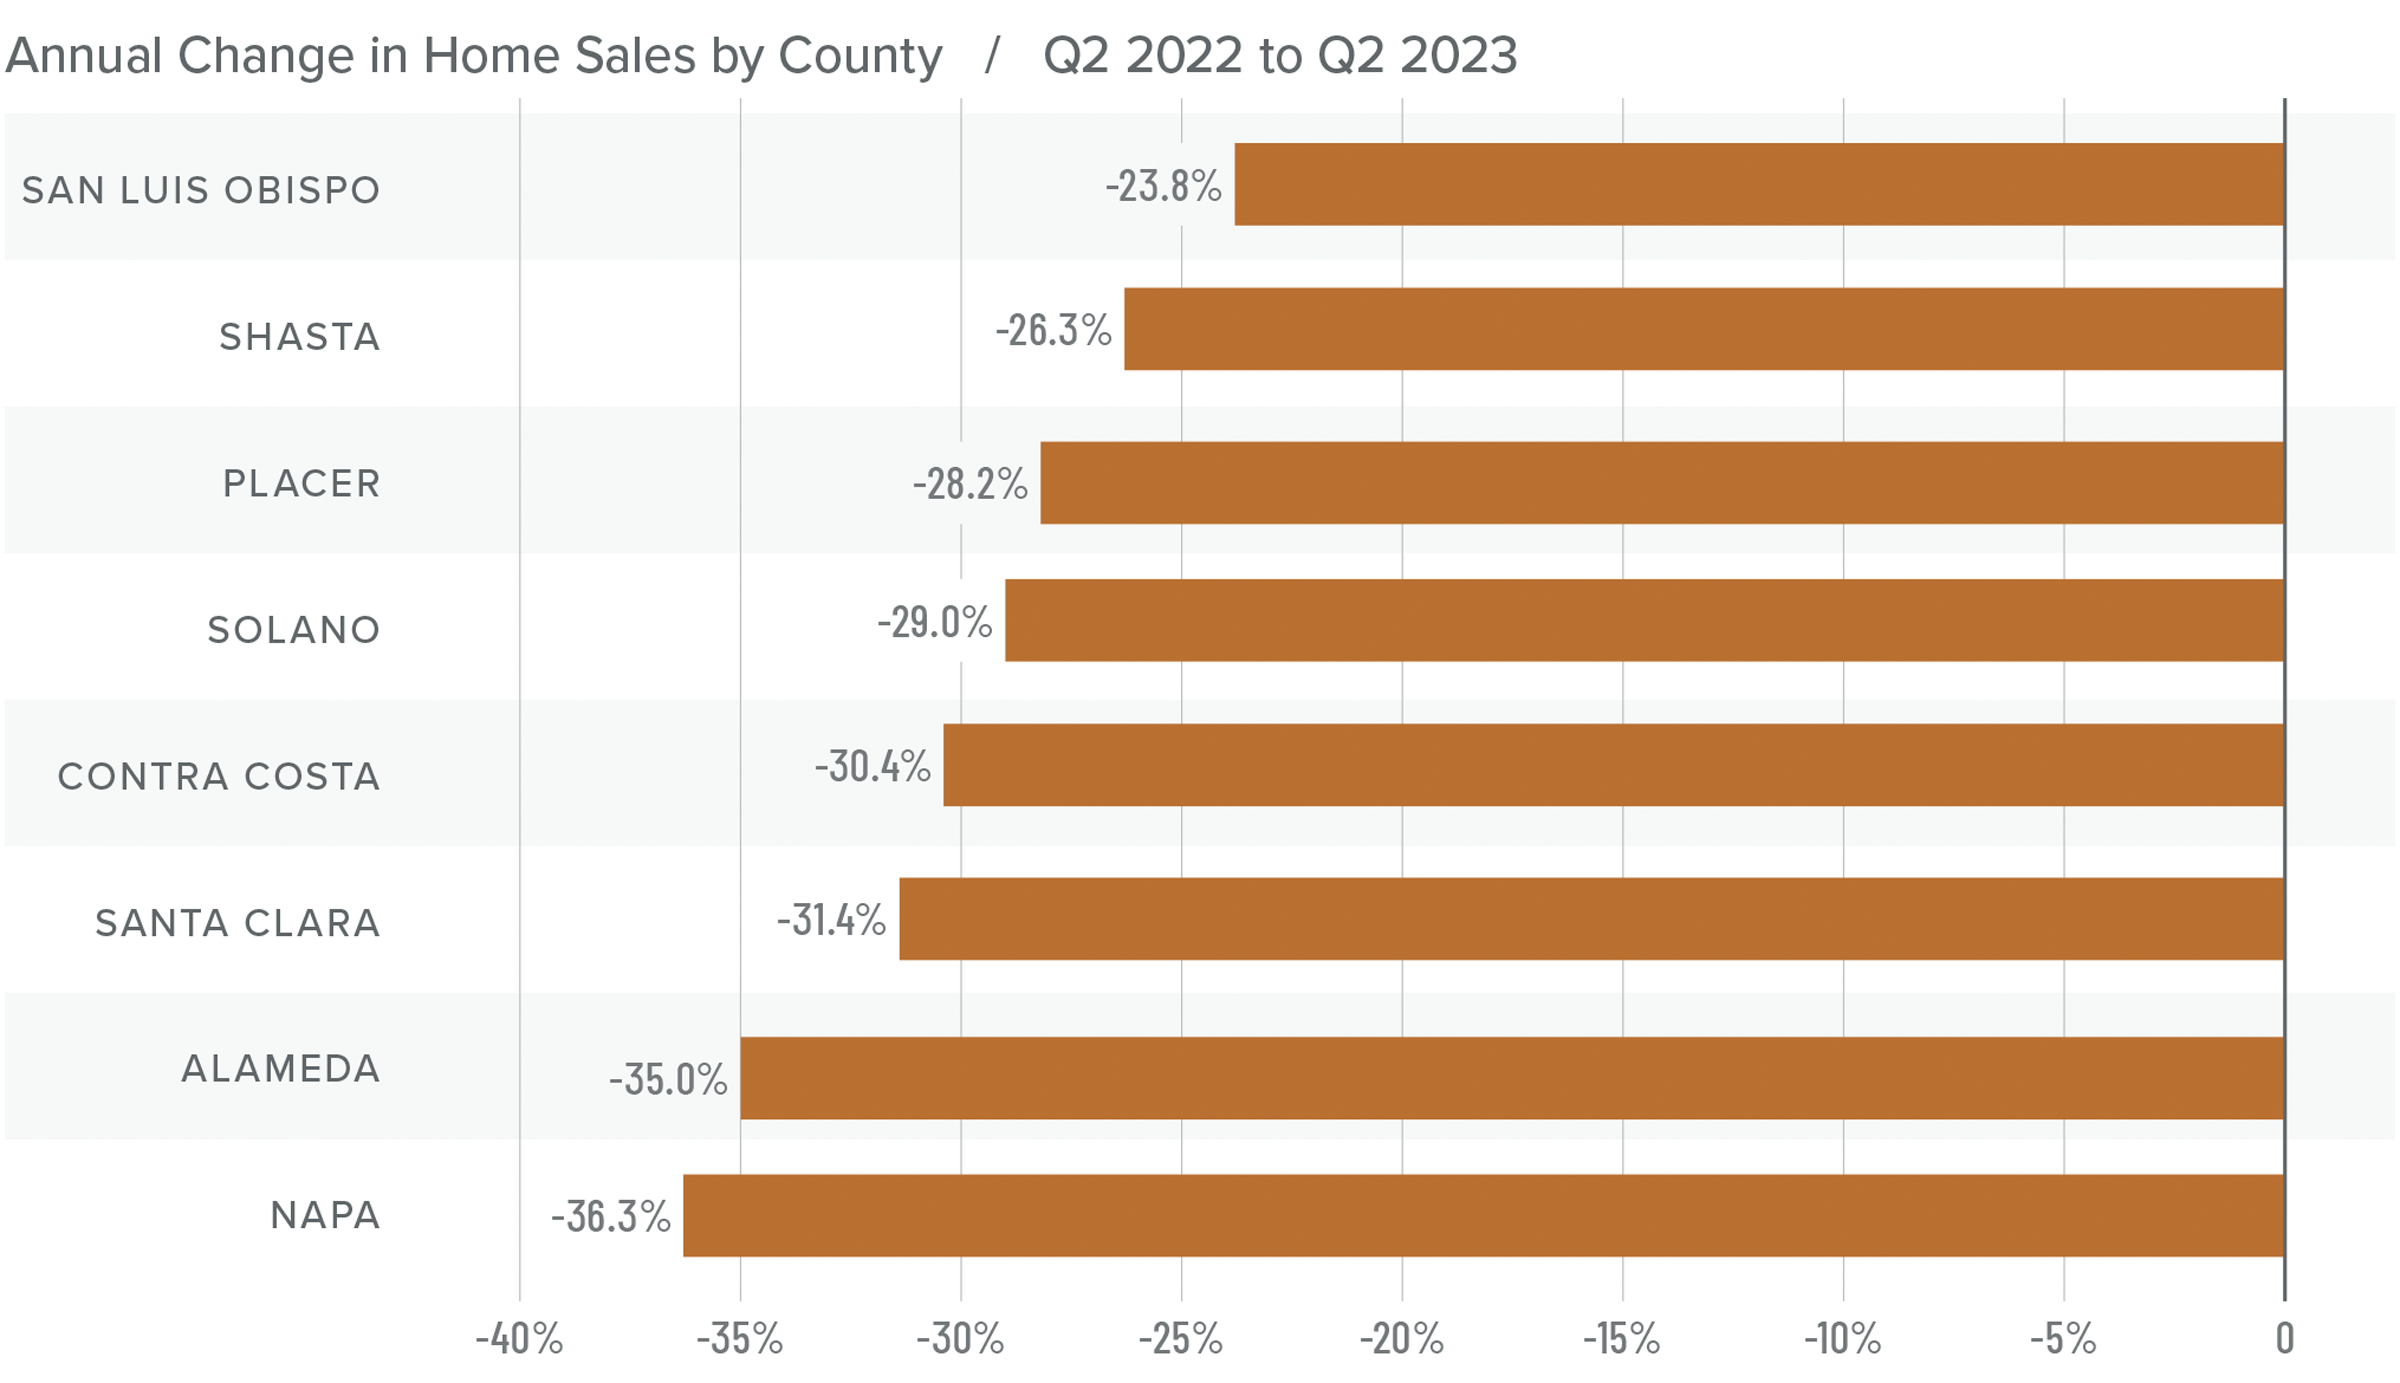
Northern California Home Sales
❱ In the second quarter of 2023, 9,999 homes sold, which was a significant decrease from the more than 14,500 homes that sold in the second quarter of 2022. However, sales were up almost 50% compared to the first quarter of this year.
❱ Year over year, sales fell across the board, but there was significant growth in all market areas compared to the first quarter of 2023.
❱ Listing inventory was up 15.2% from the first quarter, which likely contributed to better sales volume despite higher mortgage rates.
❱ Pending home sales were up 33.1% from the first quarter of 2023, which suggests that the growth in sales may continue into the summer.
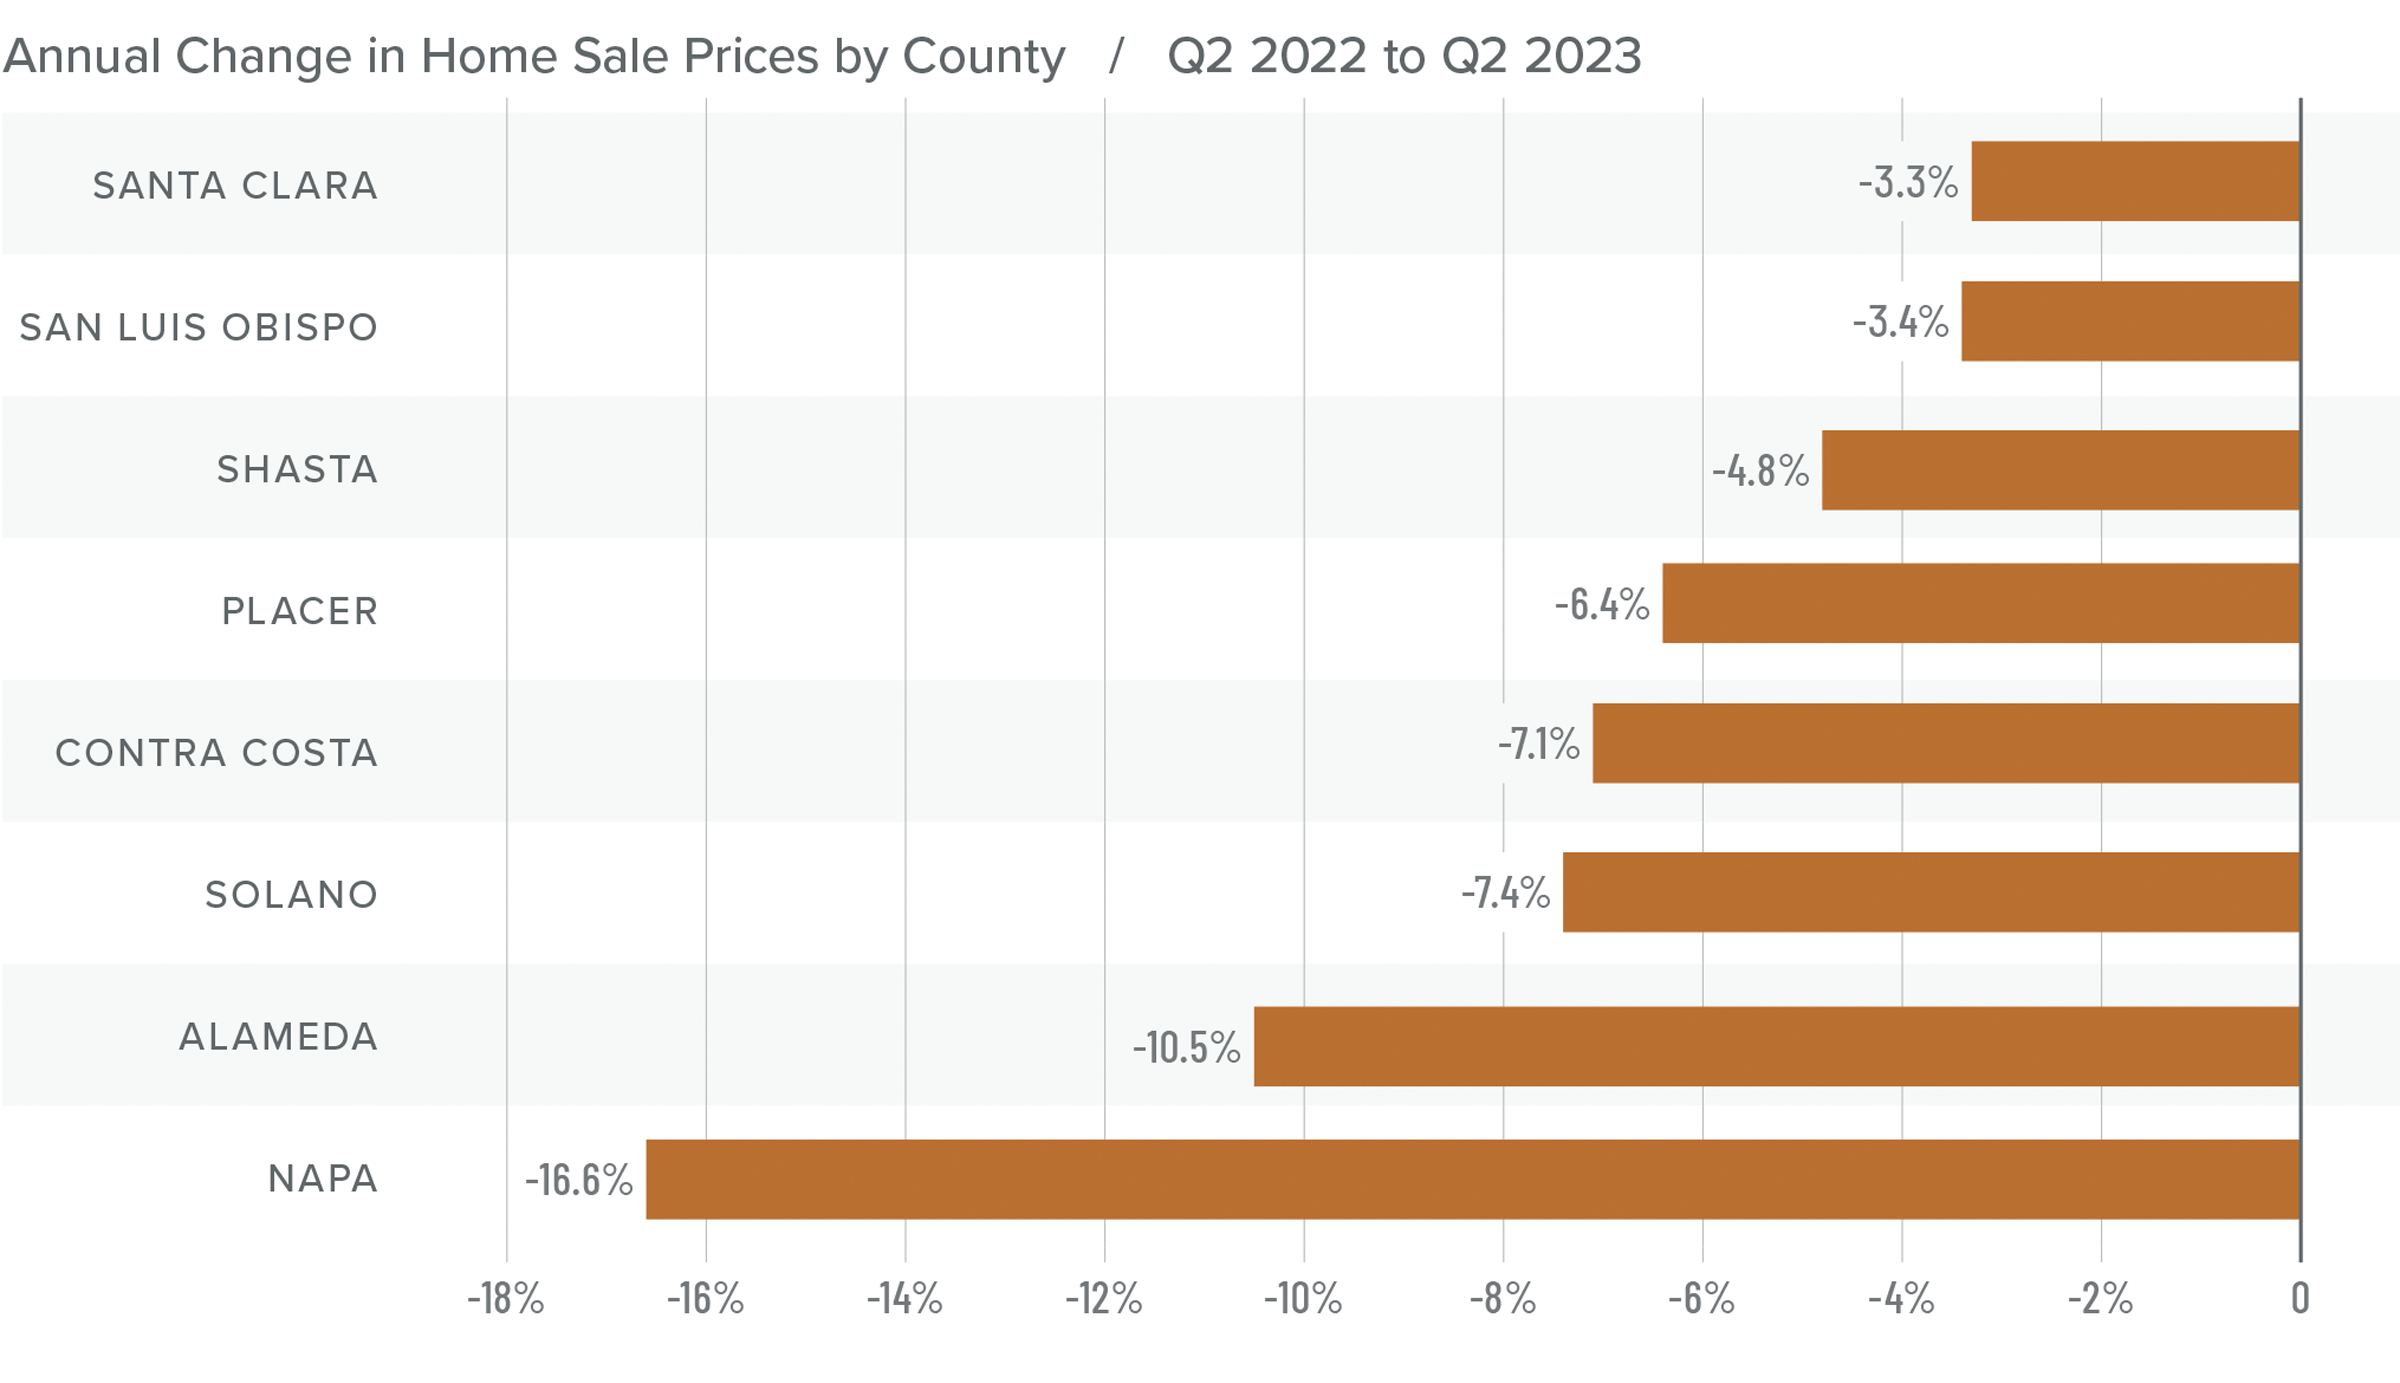
Northern California Home Prices
❱ Higher mortgage rates continue to impact home prices. The average price of a home sold in the region dropped 7.1% from the second quarter of 2022, but sale prices were up 16.1% compared to the first quarter of this year.
❱ Median list prices in the region rose 5.6% compared to the previous quarter. However, all markets were not equal: median asking prices dropped in Santa Clara, Placer, Shasta, and San Luis Obispo counties.
❱ Prices fell across the board from the second quarter of 2022, with double-digit drops in Napa and Alameda counties. Compared to the first quarter of 2023, sale prices were higher in all market areas, with double-digit growth in Alameda, Contra Costa, Napa, and Santa Clara counties.
❱ I predicted in the first quarter Gardner Report that the worst of the price drops were behind us, and the data suggests that this is true. Stability is returning, even in the face of higher mortgage rates.
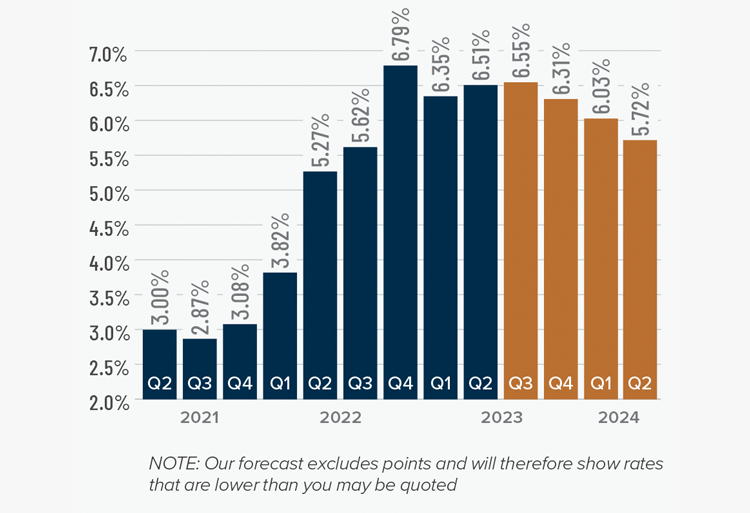
Mortgage Rates
Although they were less erratic than the first quarter, mortgage rates unfortunately trended higher and ended the quarter above 7%. This was due to the short debt ceiling impasse, as well as several economic datasets that suggested the U.S. economy was not slowing at the speed required by the Federal Reserve.
While the June employment report showed fewer jobs created than earlier in the year, as well as downward revisions to prior gains, inflation has not sufficiently slowed. Until it does, rates cannot start to trend consistently lower. With the economy not slowing as fast as expected, I have adjusted my forecast: Rates will hold at current levels in third quarter and then start to trend lower through the fall. Although there are sure to be occasional spikes, my model now shows the 30-year fixed rate breaking below 6% next spring.
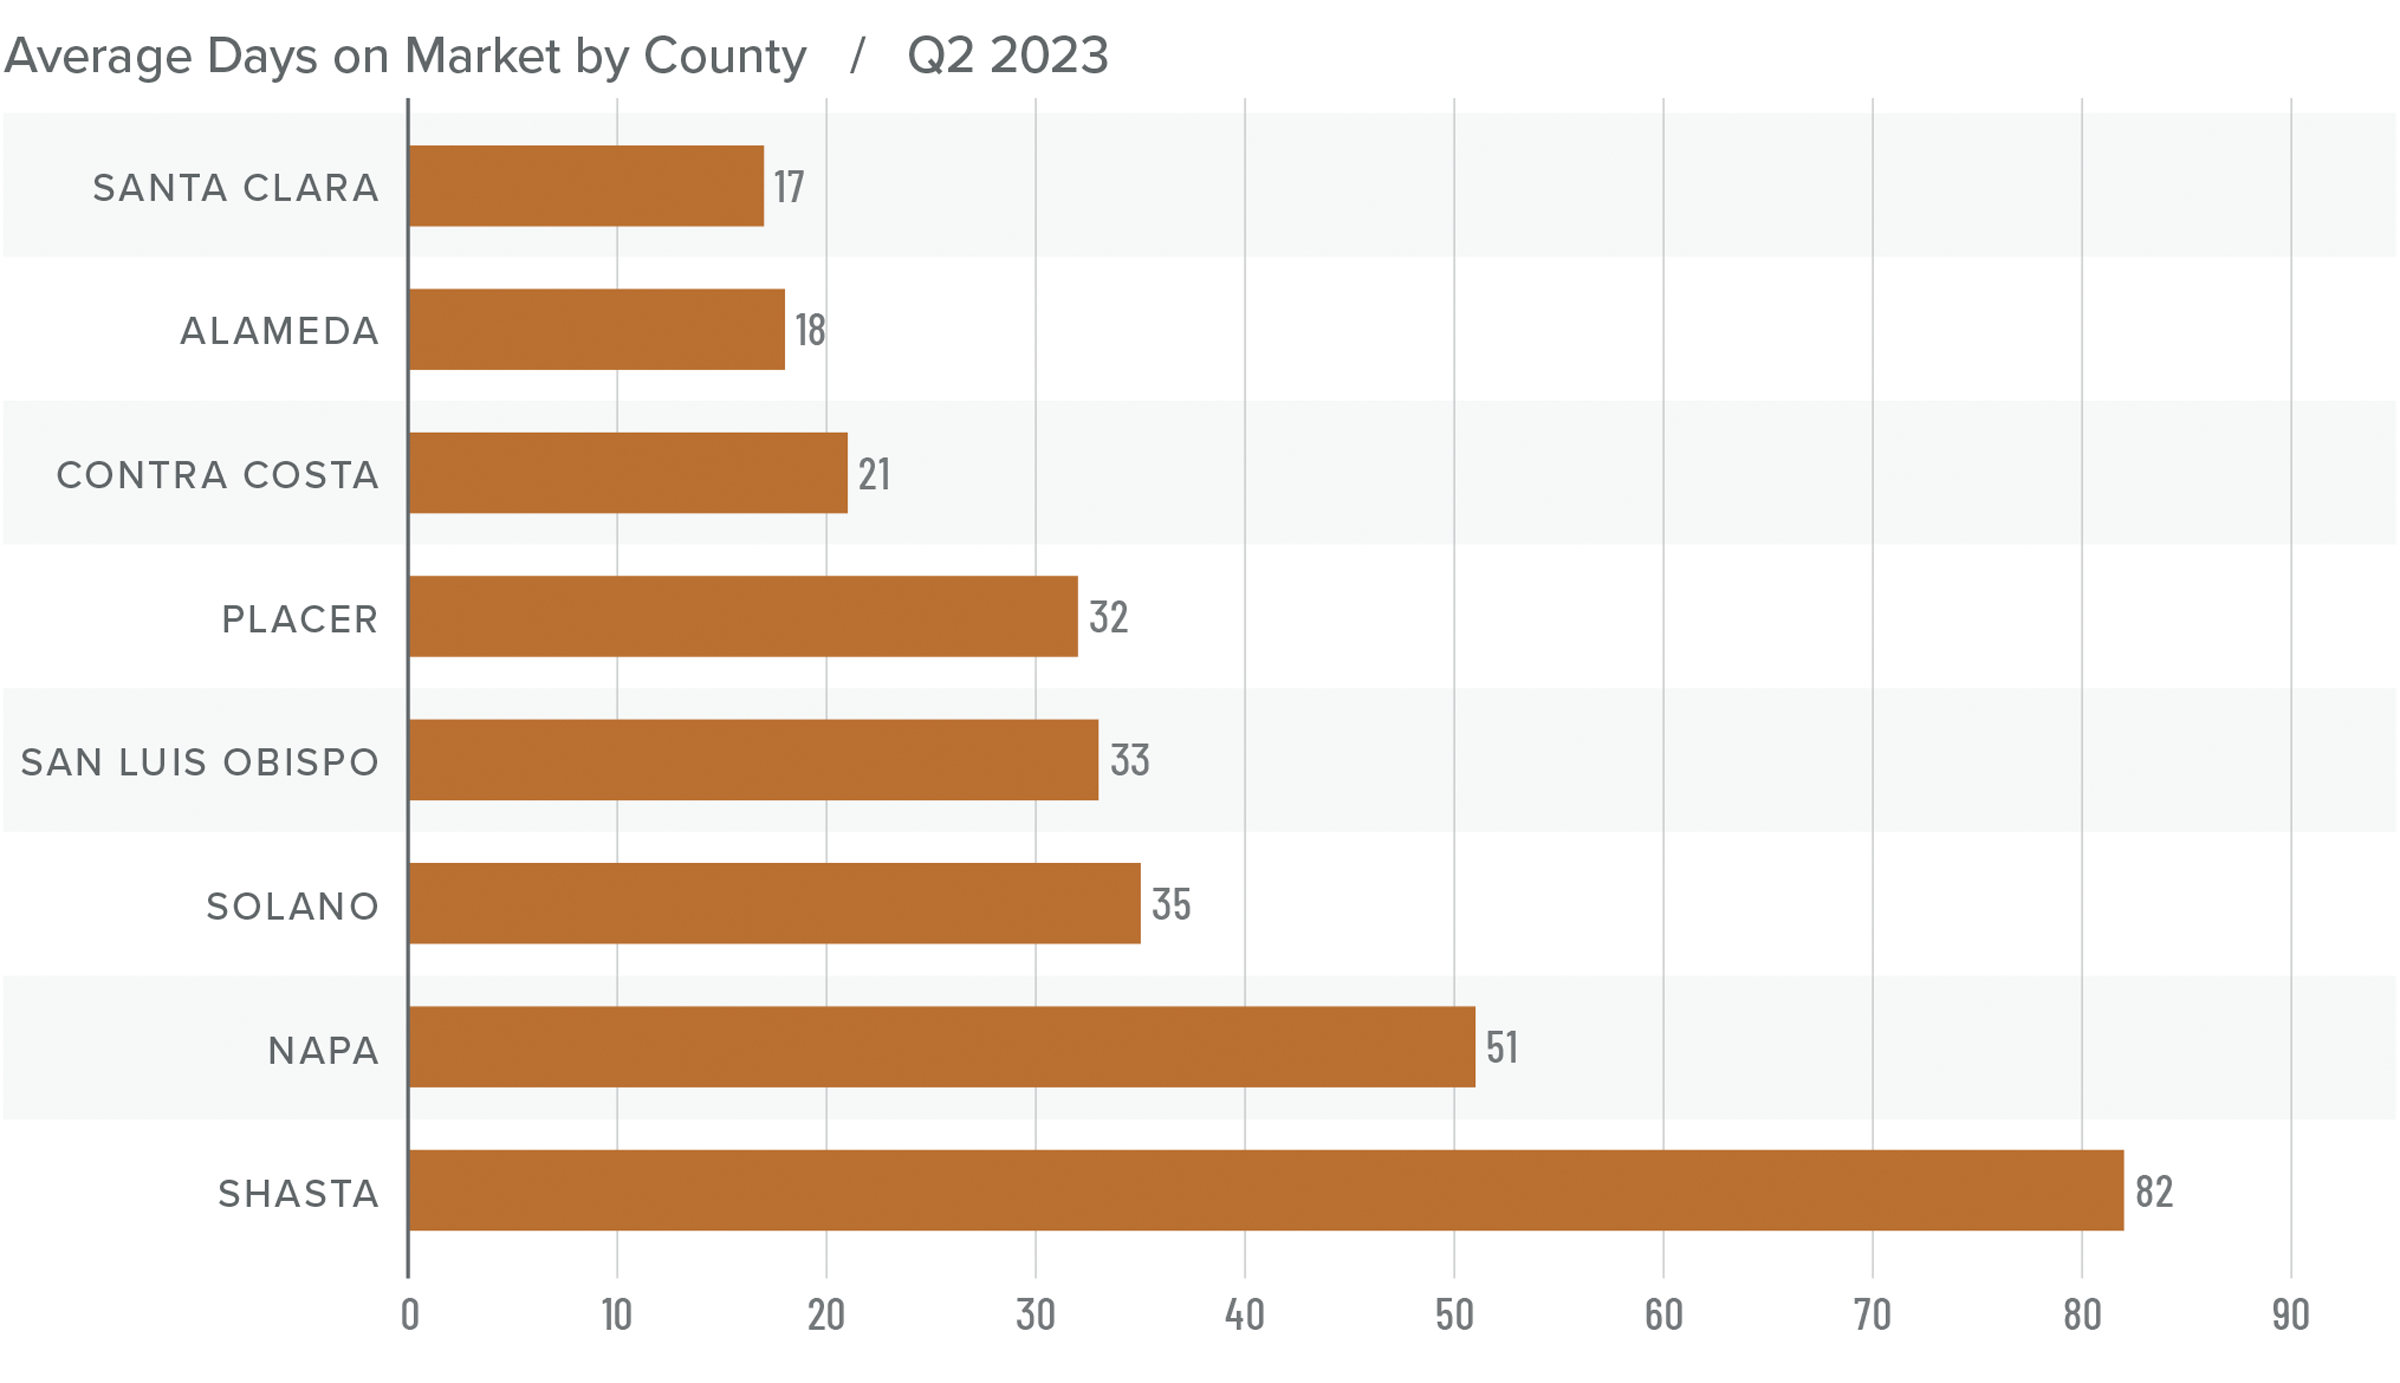
Northern California Days on Market
❱ The average time it took to sell a home in the Northern California counties in this report rose ten days compared to the second quarter of 2022.
❱ The length of time it took to sell a home rose across the region compared to the second quarter of 2022. However, market time fell across the board compared to the first quarter of this year.
❱ In the second quarter, it took an average of 36 days to sell a home, which was 15 fewer days than in the first quarter of the year.
❱ Homes sold the fastest in Santa Clara County and slowest in Shasta County. Compared to the first quarter of 2023, the greatest drop in market time was in Solano County (-27 days) and Placer County (-17 days).
Conclusions
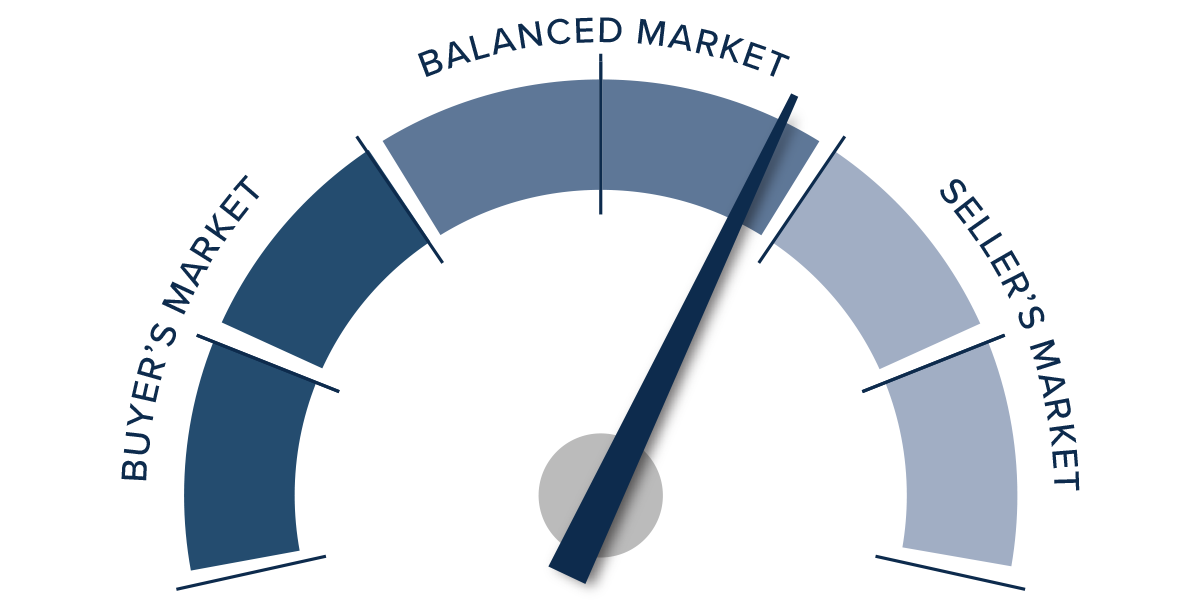
This speedometer reflects the state of the region’s real estate market using housing inventory, price gains, home sales, interest rates, and larger economic factors.
It was interesting to see the housing market pick back up even though the economy appears to be on pause and mortgage rates are high. The question is whether this can continue. Despite higher supply levels, they remain well below historic averages, which is causing prices to rise. The reason for this is that 30% of homeowners in California have a mortgage rate at or below 3%, so there is no incentive to sell if they don’t have to.
Assuming that supply will not increase significantly and that my forecast for mortgage rates to fall modestly through the rest of the year is accurate, I stand by my prediction that the worst of the price drops are over in the Northern California markets covered by this report. Given all the above, I am moving the needle more in favor of sellers, but still holding in the balanced quadrant of the speedometer.
About Matthew Gardner
As Chief Economist for Windermere Real Estate, Matthew Gardner is responsible for analyzing and interpreting economic data and its impact on the real estate market on both a local and national level. Matthew has over 30 years of professional experience both in the U.S. and U.K.
In addition to his day-to-day responsibilities, Matthew sits on the Washington State Governors Council of Economic Advisors; chairs the Board of Trustees at the Washington Center for Real Estate Research at the University of Washington; and is an Advisory Board Member at the Runstad Center for Real Estate Studies at the University of Washington where he also lectures in real estate economics.

 Facebook
 X
X
 Pinterest
 Copy Link


")


