
 Facebook
 X
X
 Pinterest
 Copy Link


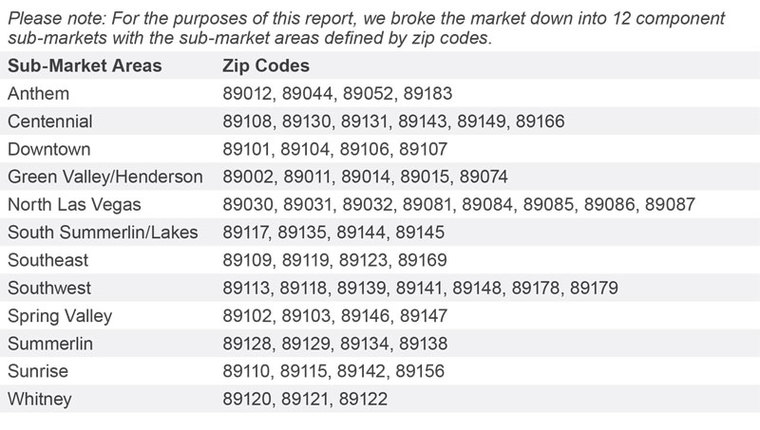
ECONOMIC OVERVIEW
Annual employment in Colorado grew by a respectable 2.3% in February, which equated to about 64,000 new jobs over the past 12 months. Within the metropolitan market areas included in this report, employment has been mixed, with Denver, Fort Collins, and Colorado Springs reporting above-average growth. However, Greeley and Grand Junction saw a modest decline in employment.
In February, the unemployment rate in Colorado was 2.9%, down from 3.3% a year ago. The lowest reported unemployment rates were in Fort Collins and Boulder, at just 2.6%. The highest rate was in Grand Junction, but it was still a respectable 4.7%.
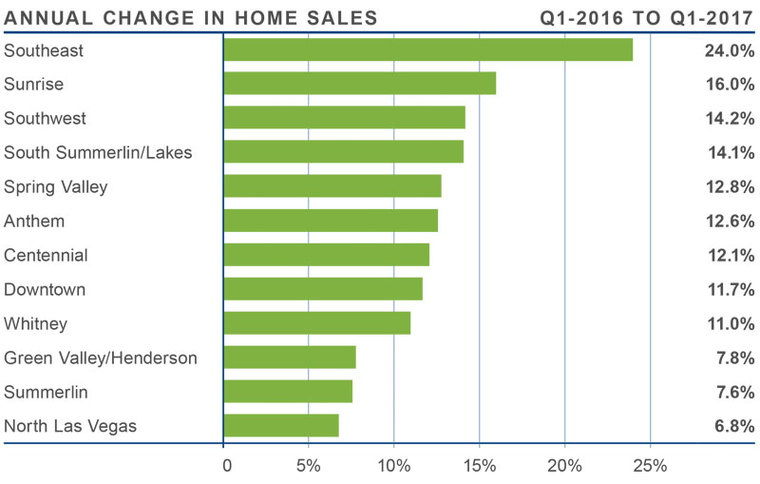
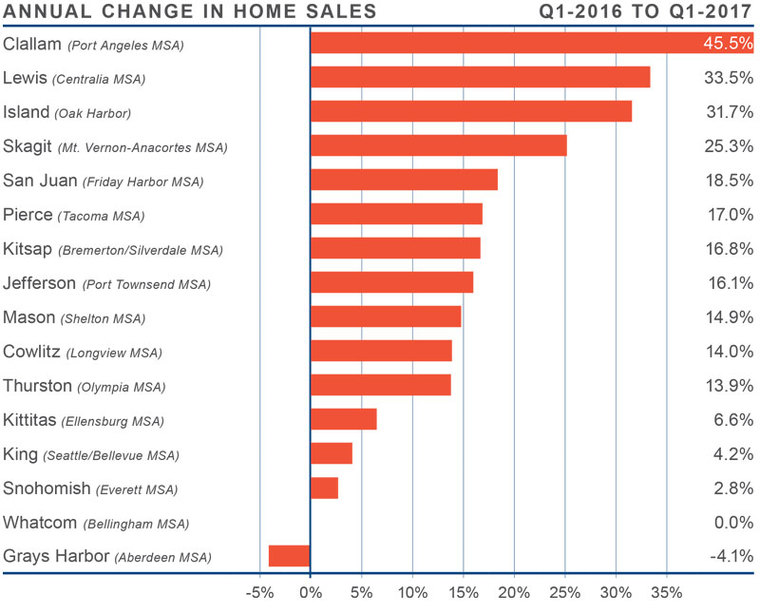
HOME SALES
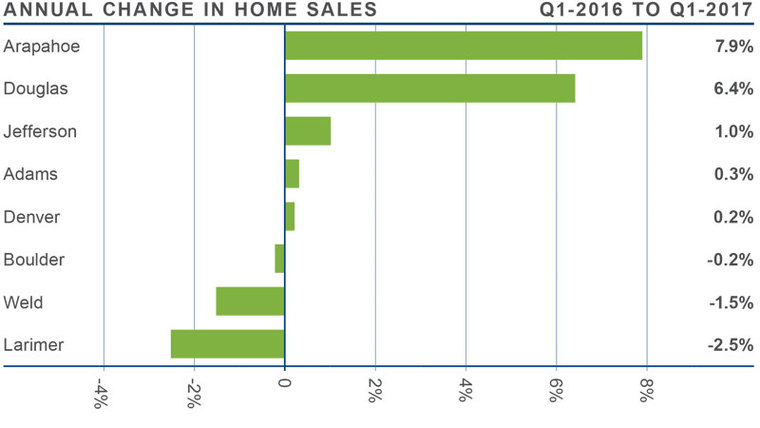
- There were 11,640 home sales during the first quarter of 2017, an annual increase of 2.2%.
- Arapahoe County saw sales grow at the fastest rate over the past 12 months, with a 7.9% increase. There were also impressive increases in Douglas County. There were very modest sales declines in the relatively small Larimer and Weld Counties.
- Listing activity remains well below historic averages, with the total number of homes for sale in the first quarter 10.7% below that seen a year ago.
- Home sales are generally higher than seen a year ago, but inventory levels are well below where they need to be to satisfy would-be buyers.
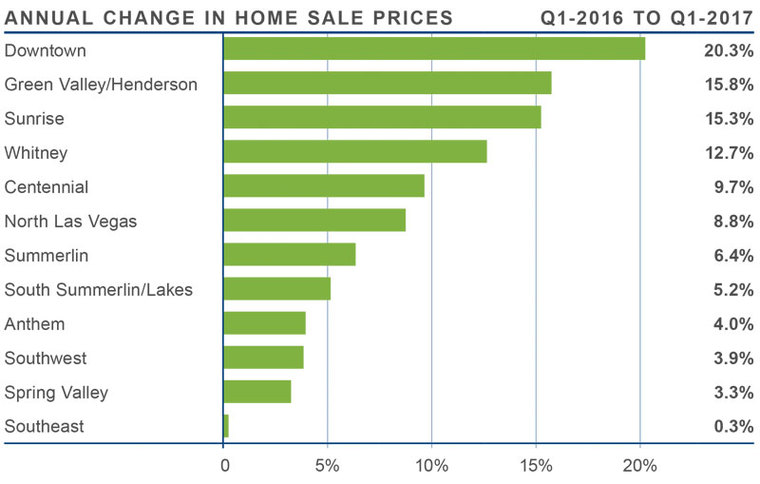
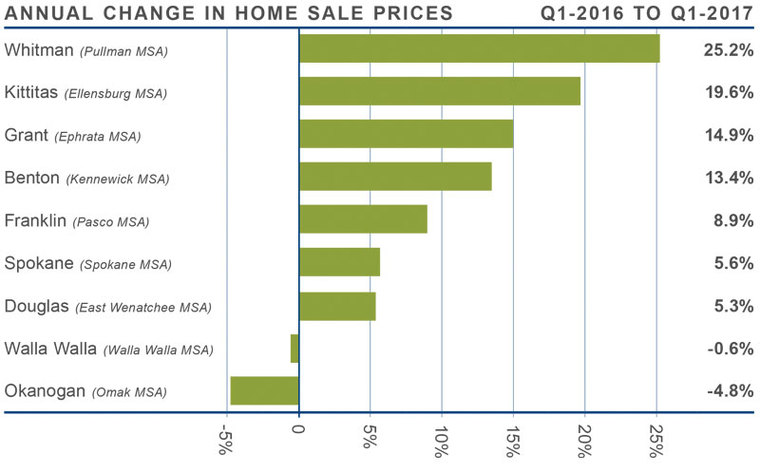
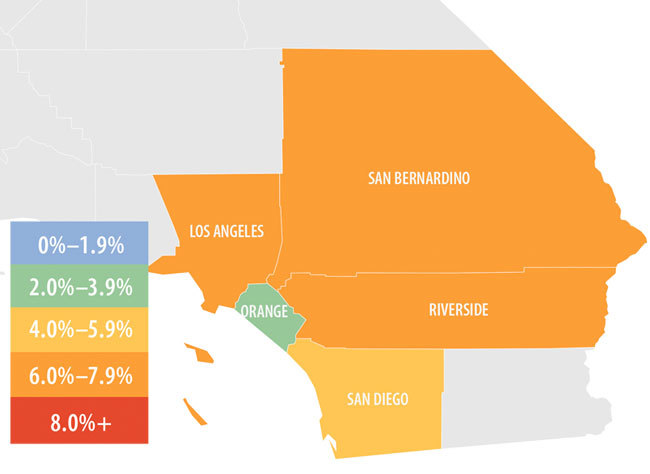
HOME PRICES
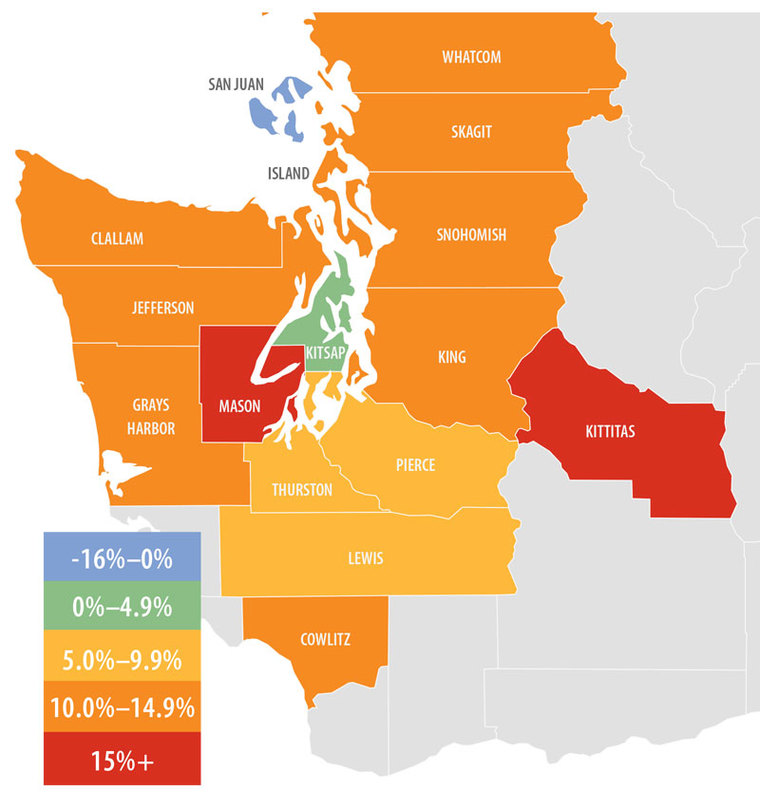
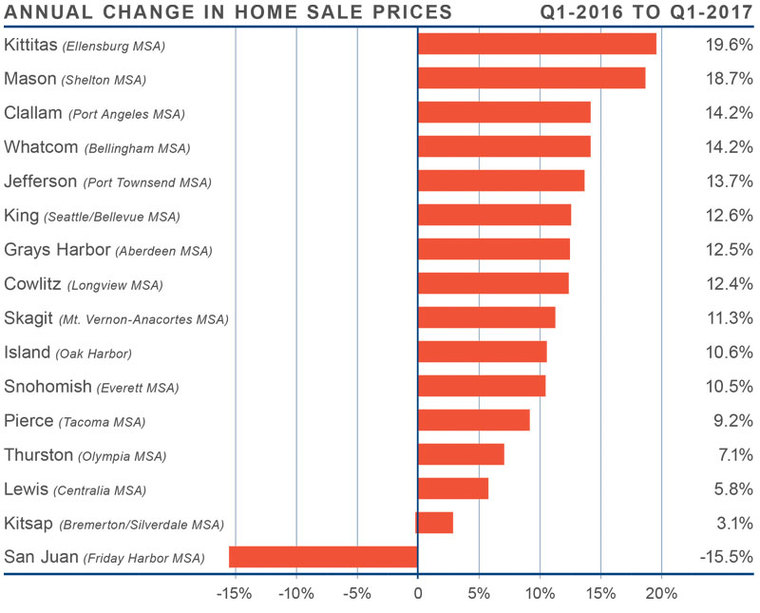
![]() With demand remaining strong, home prices continue to escalate. In the first quarter of this year, average prices rose by 8% when compared to a year ago. Average home prices across the region broke the $400,000 barrier at $402,273.
With demand remaining strong, home prices continue to escalate. In the first quarter of this year, average prices rose by 8% when compared to a year ago. Average home prices across the region broke the $400,000 barrier at $402,273.- Home prices remain well above historic highs and continue to trend upward. While there are very modest slowdowns in price growth—possibly a function of rising interest rates—they should continue to appreciate at above-average rates throughout 2017.
- Appreciation was strongest in Arapahoe and Weld Counties, where prices rose by 12.2% and 10.1% respectively.
- The housing market remains strong and this will continue until we see a substantial increase in the number of homes for sale, which is unlikely in the near-term.
 With demand remaining strong, home prices continue to escalate. In the first quarter of this year, average prices rose by 8% when compared to a year ago. Average home prices across the region broke the $400,000 barrier at $402,273.
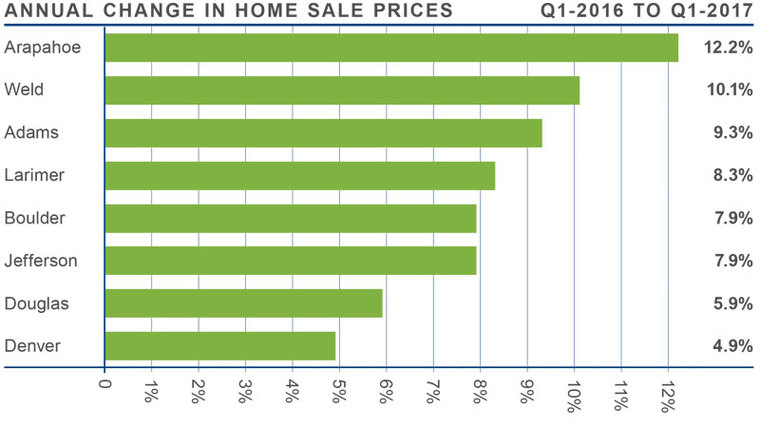
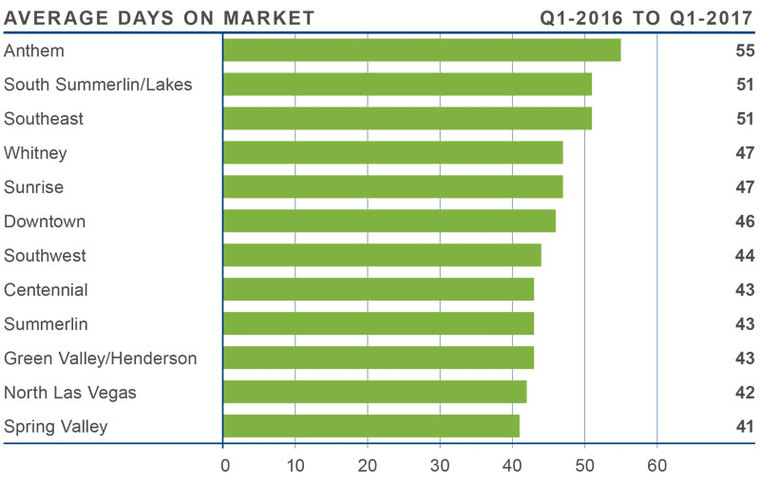
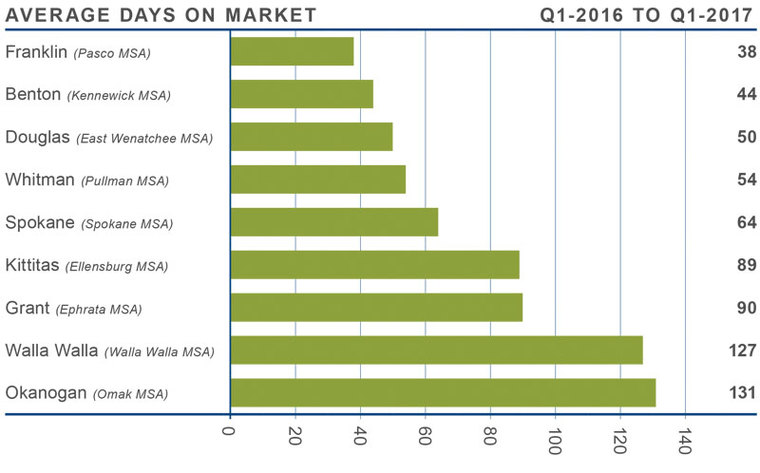
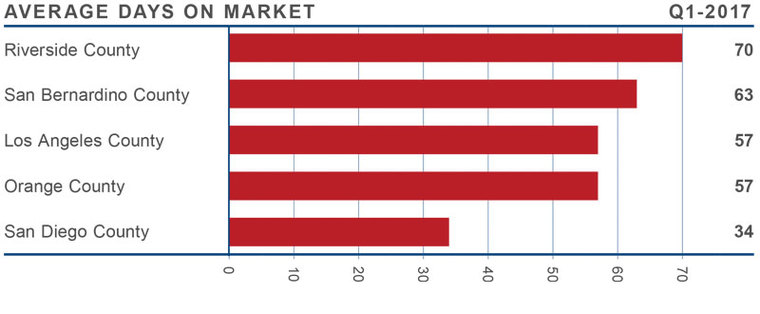
DAYS ON MARKET
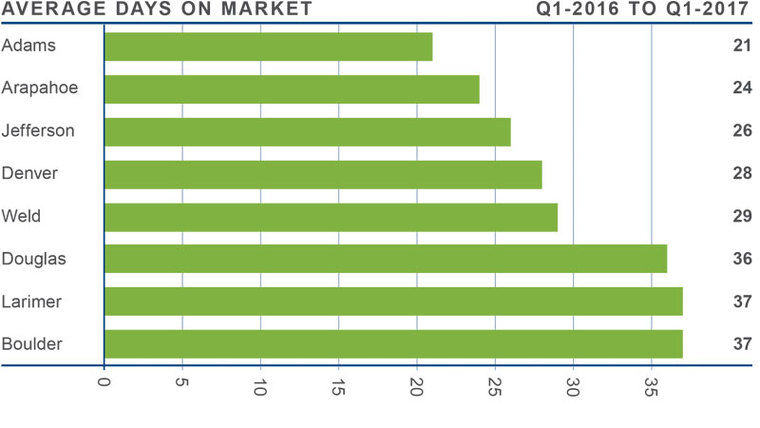
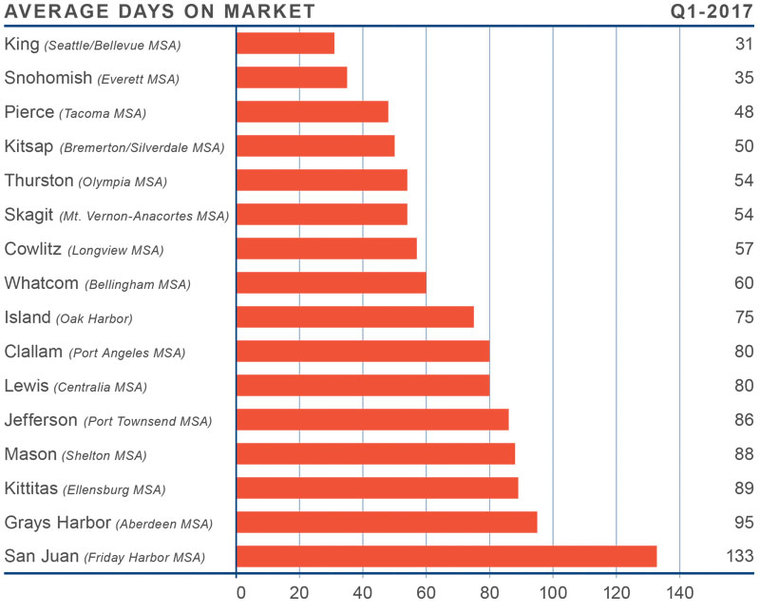
- The average number of days it took to sell a home dropped by one day when compared to the first quarter of 2016.
- Homes in a majority of the counties took less than a month to sell.
- During the first quarter, it took an average of 30 days to sell a home. This is down by one day compared to the same time last year.
- Demand remains very strong across the region, which is evident by the remarkably short amount time that it takes to sell a home.
CONCLUSIONS
 This speedometer reflects the state of the region’s housing market using housing inventory, price gains, home sales, interest rates, and larger economic factors. In the first quarter of 2017, the needle remains well into seller’s territory. The recent increases in mortgage rates have not had any dampening effect on either demand or home prices, and I expect this will remain unchanged through the end of the year.
 Matthew Gardner is the Chief Economist for Windermere Real Estate, specializing in residential market analysis, commercial/industrial market analysis, financial analysis, and land use and regional economics. He is the former Principal of Gardner Economics, and has over 25 years of professional experience both in the U.S. and U.K.

 The speedometer reflects the state of the region’s housing market using housing inventory, price gains, home sales, interest rates, and larger economic factors. Employment growth in Clark County has picked up again, and this bodes well for the housing market in this region. Due to the low number of homes for sale, home prices continue to increase despite rising mortgage rates. Given these factors, I have moved the speedometer more towards the seller’s side. Inventory levels are still very low and competition for well-located—and well-priced—homes remains high.
 Year-over-year, average prices in the region rose by 8.3% to $228,955. Although home prices did fall compared to last quarter, this rate of growth remains well above average.
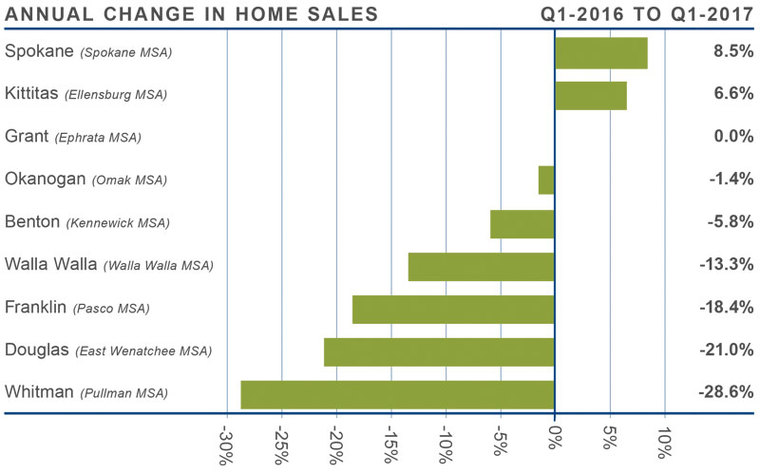
 This speedometer reflects the state of the region’s housing market using housing inventory, price gains, home sales, interest rates, and larger economic factors. For the first quarter of 2017, I moved the needle a little more in favor of sellers. The rapid increase in mortgage rates during the fourth quarter of 2016 has slowed and buyers are clearly out in force. Home prices continue to increase as the number of homes for sale drops. The market remains staunchly in favor of sellers, and this is unlikely to change in the near- to mid-term.
 Average prices in the region rose by 5.3% compared to first quarter of 2016, and are 2.6% higher than fourth quarter of 2016.
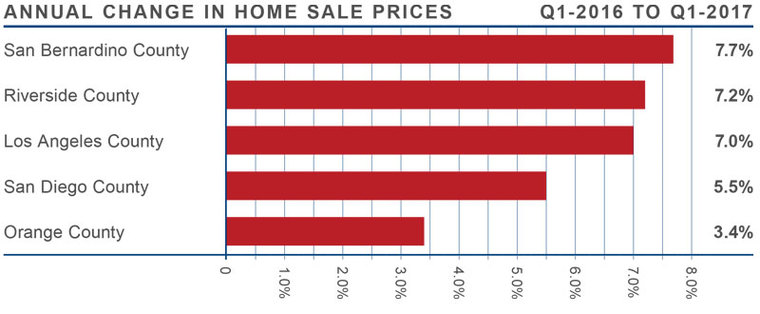
 The speedometer reflects the state of the region’s housing market using housing inventory, price gains, home sales, interest rates, and larger economic factors.
 Matthew Gardner is the Chief Economist for
 A new addition to this year’s event is the Windermere Cut Cinco de Mayo party down along the north shore of the Montlake Cut. Twenty dollars gets you into the beer/margarita garden where you can listen to Spike and the Impalers while munching on food from one of three Mexican food trucks. For more information and to buy tickets go to
  This book
 This speedometer reflects the state of the region’s housing market using housing inventory, price gains, home sales, interest rates, and larger economic factors. For the first quarter of 2017, I moved the needle a little more in favor of sellers. The rapid increase in mortgage rates during the fourth quarter of 2016 has slowed and buyers are clearly out in force.


")


