

The following analysis of select counties of the Northern California real estate market is provided by Windermere Real Estate. We hope that this information may assist you with making better-informed real estate decisions. For further information about the housing market in your area, please don’t hesitate to contact your Windermere Real Estate agent.
Regional Economic Overview
Total employment levels in the counties covered by this report fell year over year, with losses in all eight counties.
The regional unemployment rate rose to 4.3%, which was up from 3.3% in the third quarter of 2022, and is now at the highest level since January of 2022. By county, the lowest jobless rate was in Napa (3.6%) while the highest rate was in Shasta, where 5.1% of the labor force was looking for a job.
Northern California Home Sales
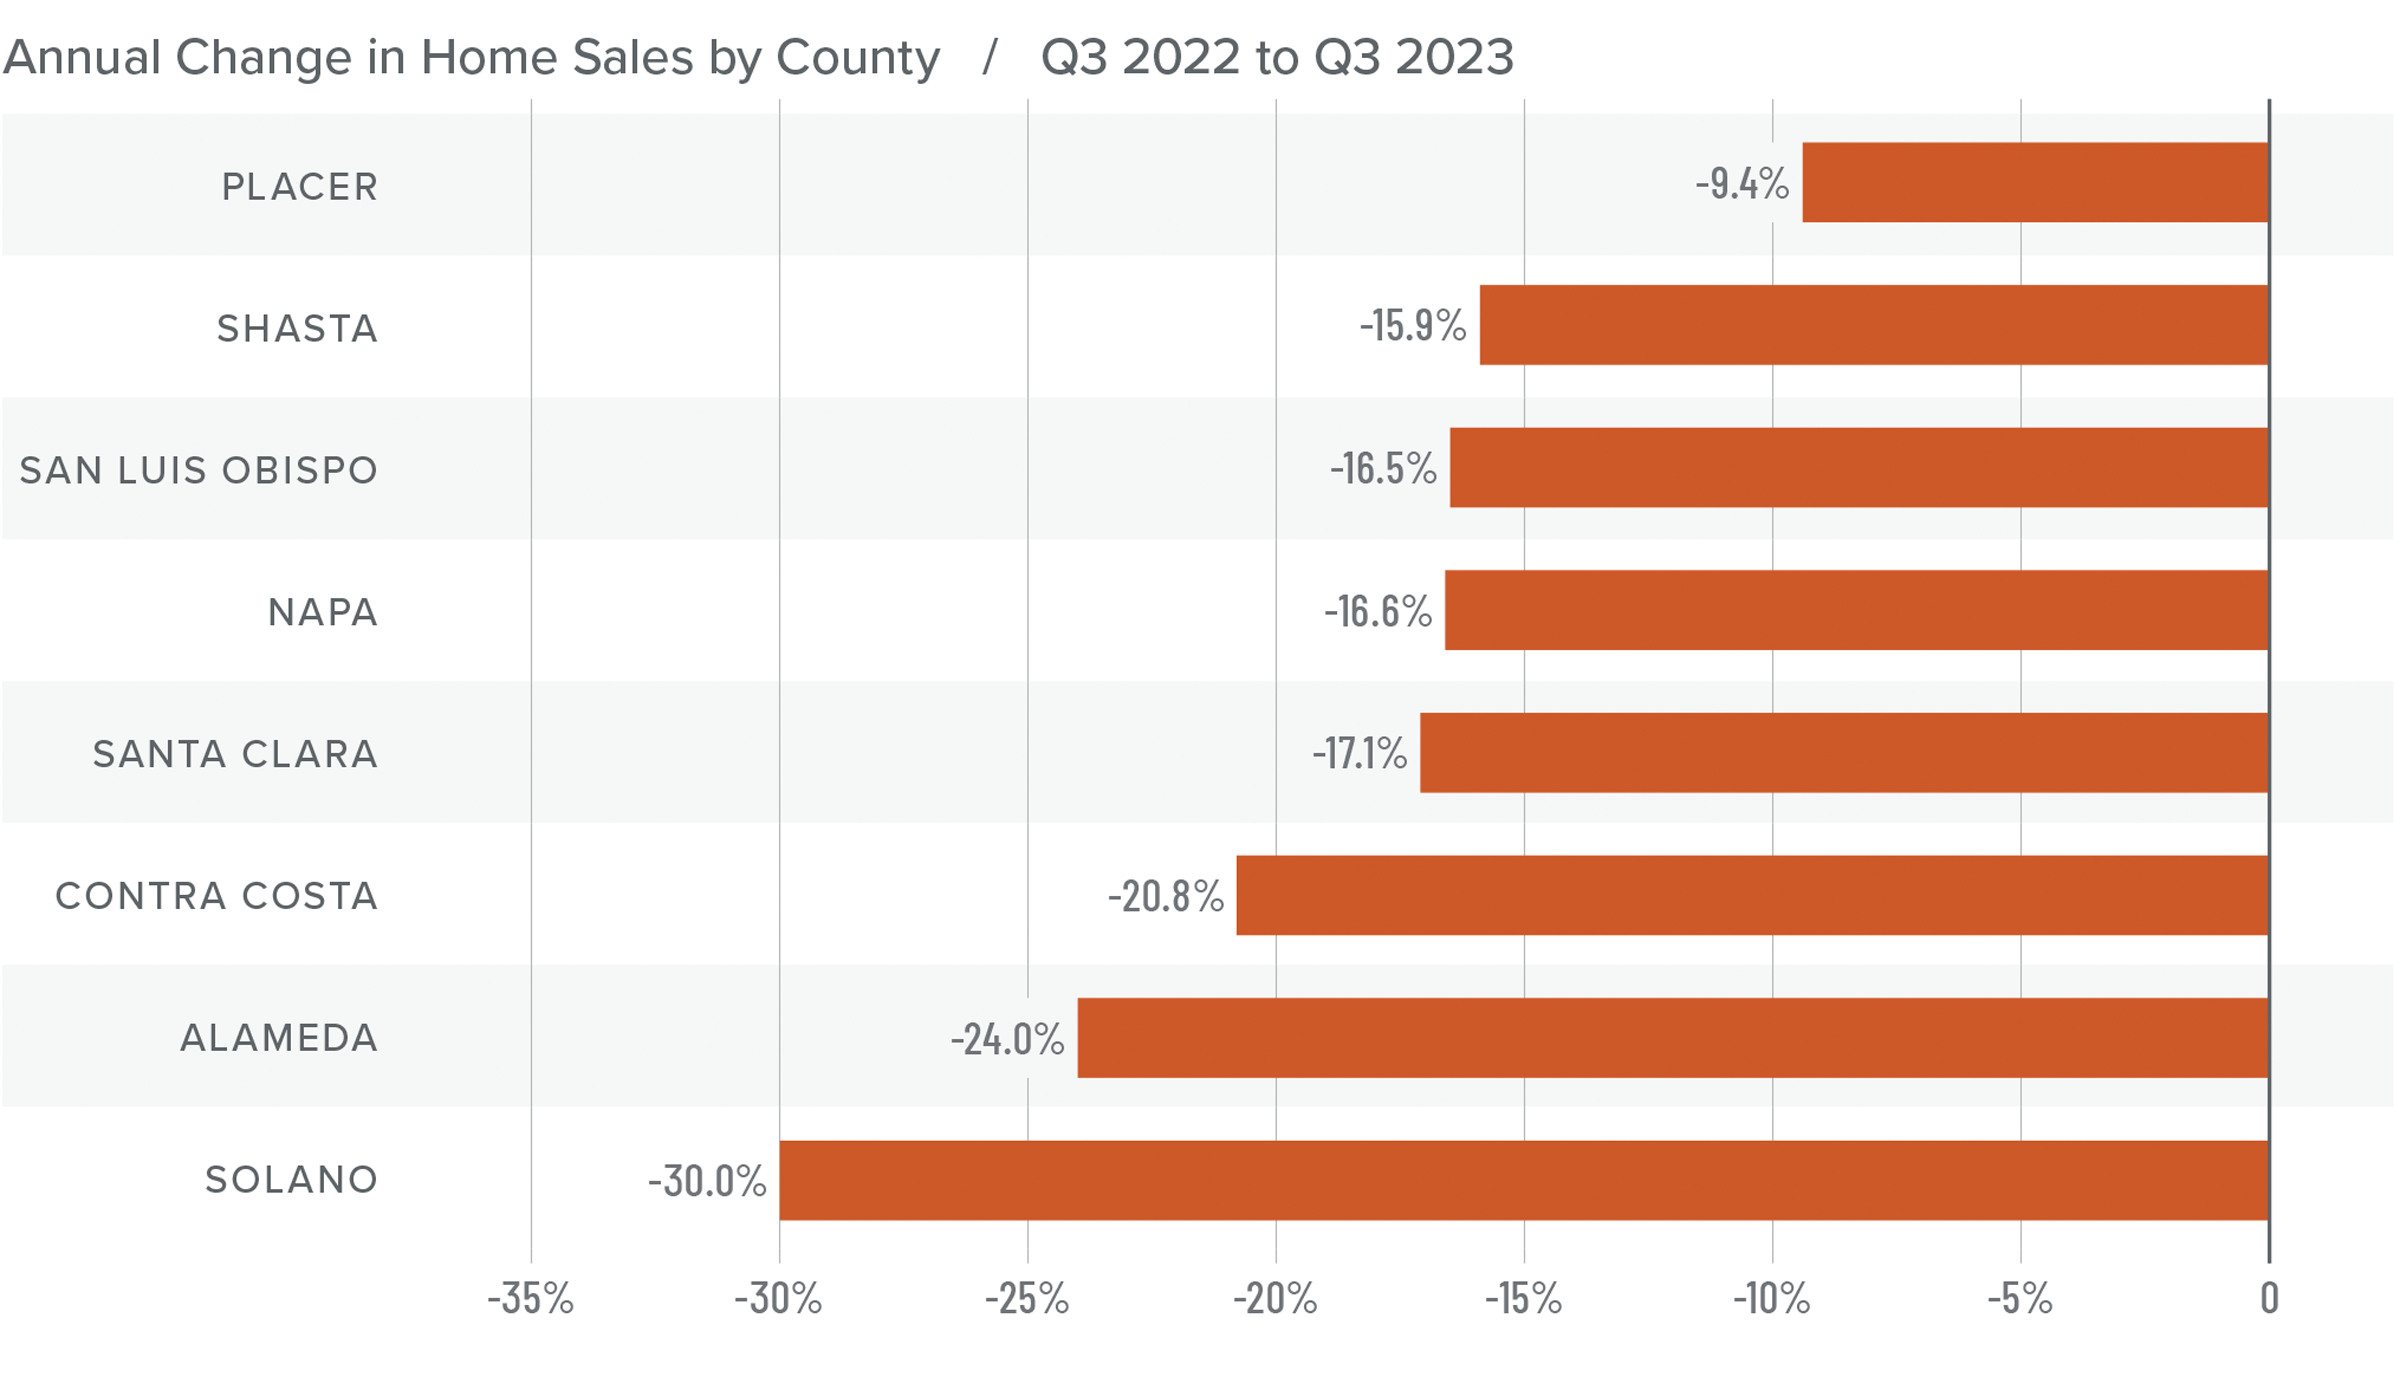
❱ In the third quarter of 2023, 9,284 homes sold, which was a 20% drop from the third quarter of 2022. Sales were 8.4% lower than in the second quarter of this year.
❱ Year over year, sales fell across the board. Only San Luis Obispo was able to grow sales from the previous quarter, but the increase was a very modest .9%.
❱ Quarter over quarter, listing inventory was up 16.2%. The average number of homes for sale was down 37.2% from the third quarter of 2022.
❱ Pending home sales were down 9.8% from the second quarter, suggesting that the market is likely going to continue cooling as we move through the balance of 2023.
Northern California Home Prices
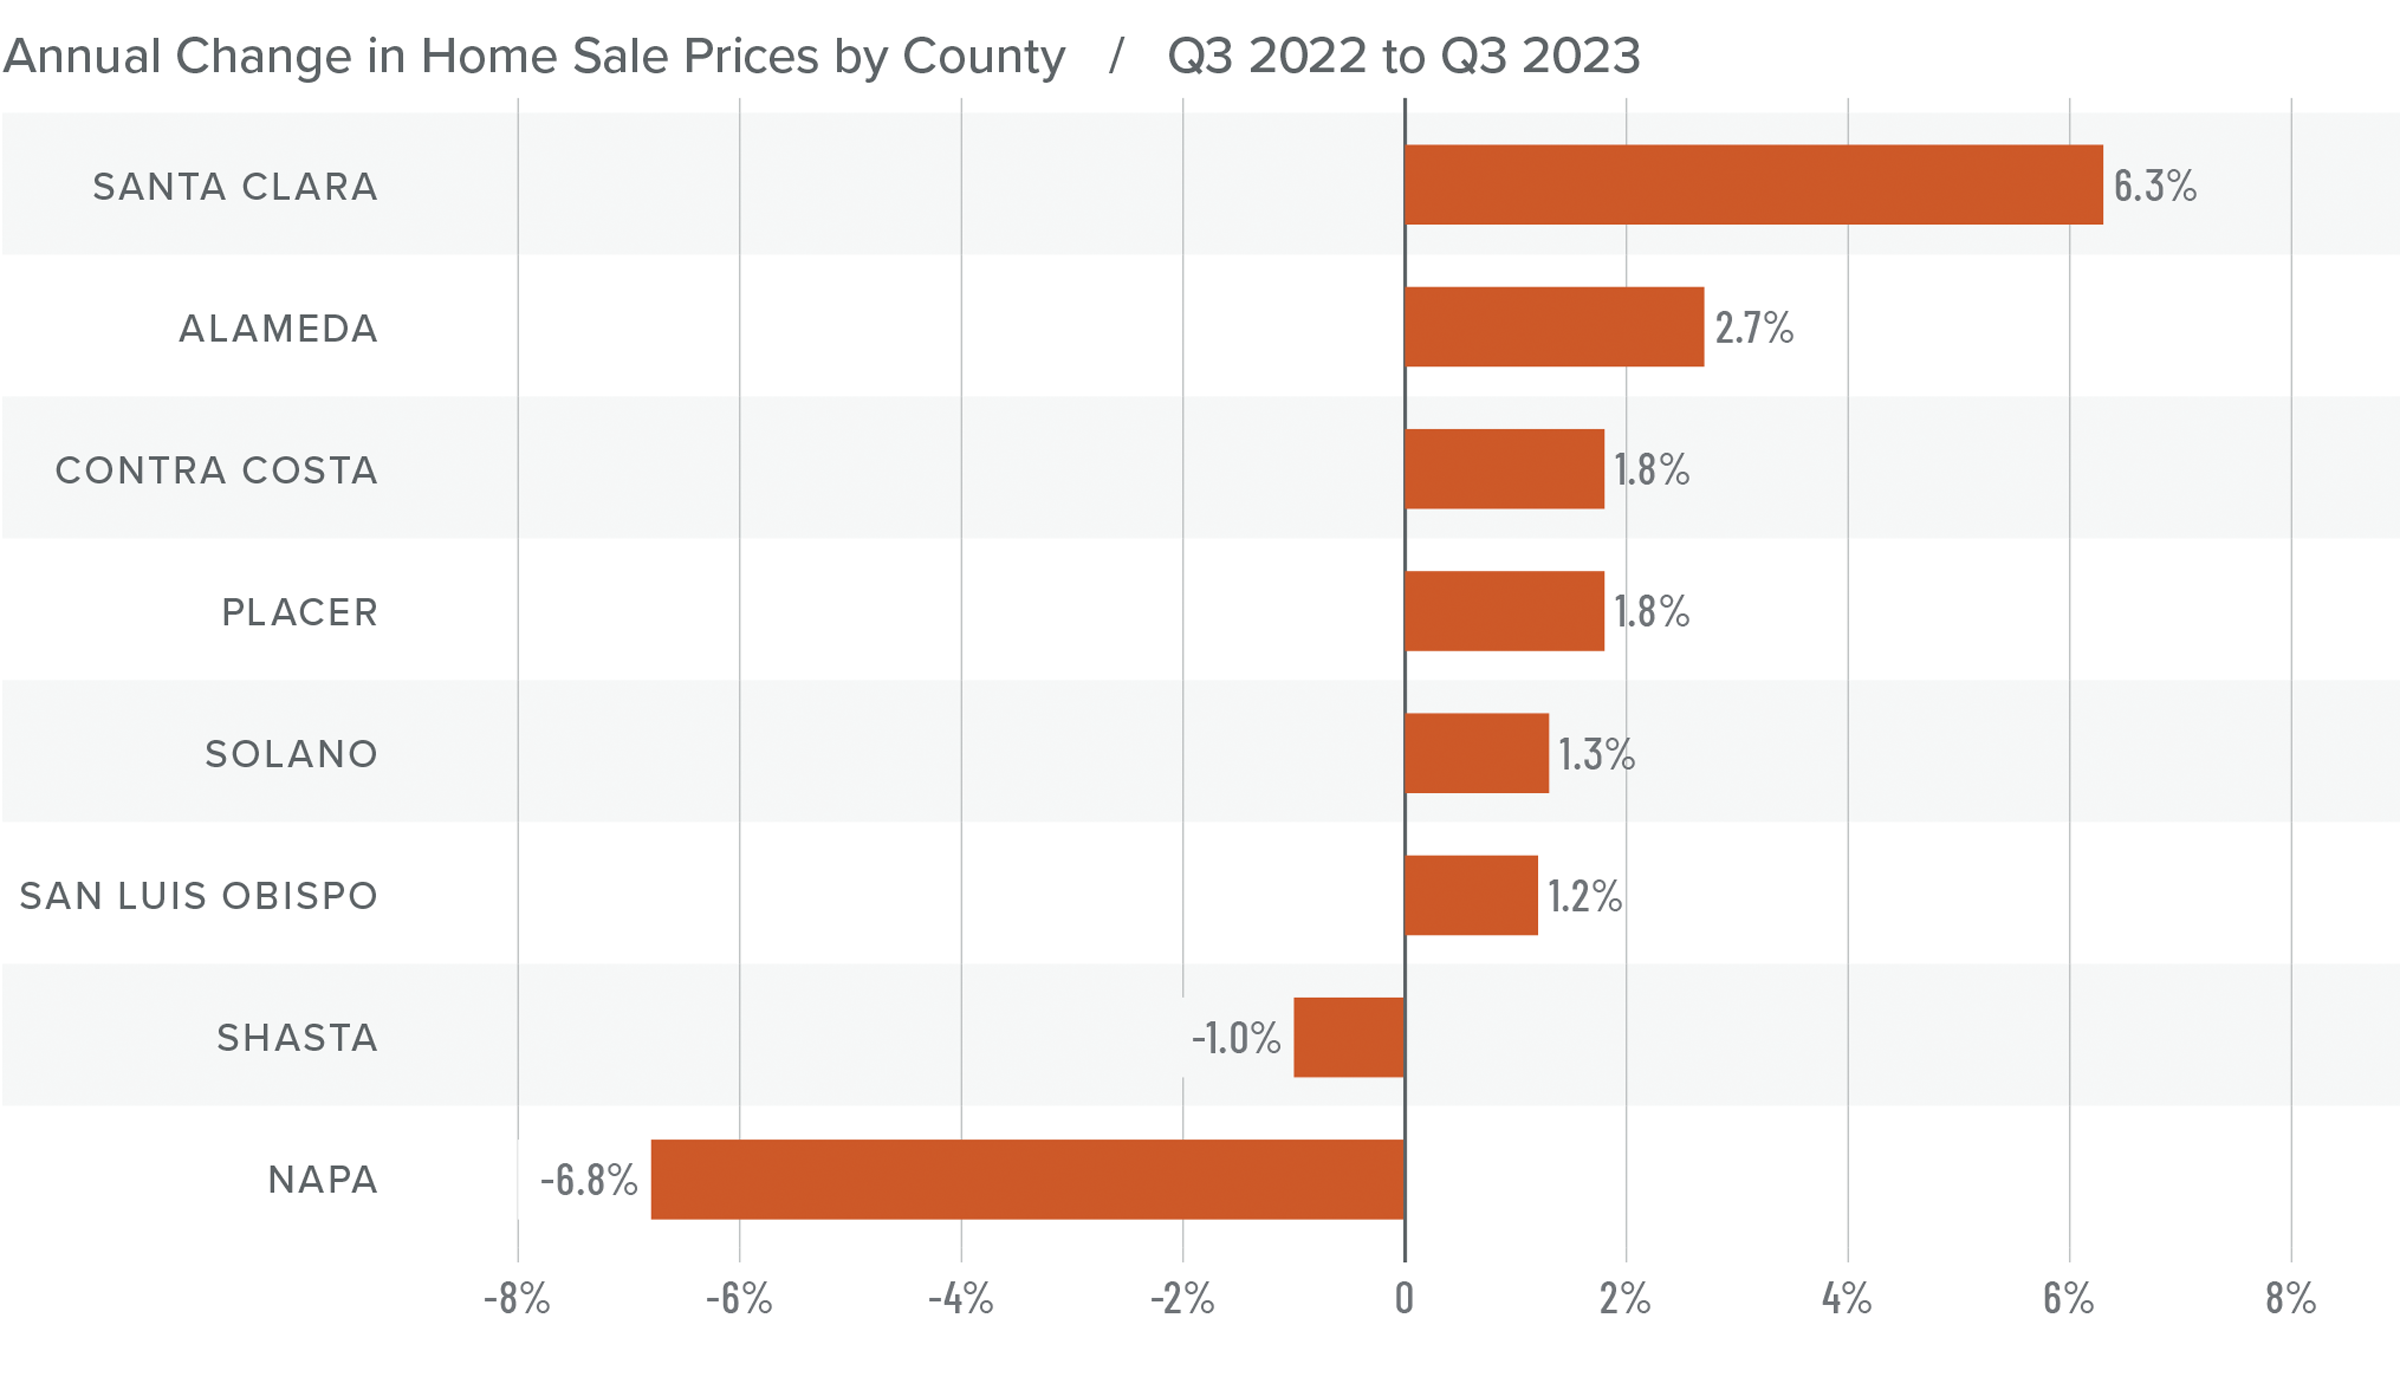
❱ Higher financing costs are impacting home sale prices, which dropped 1.2% from the second quarter of 2023 but were 3.9% higher than during the same period of 2022. The average sale price was $1.217 million.
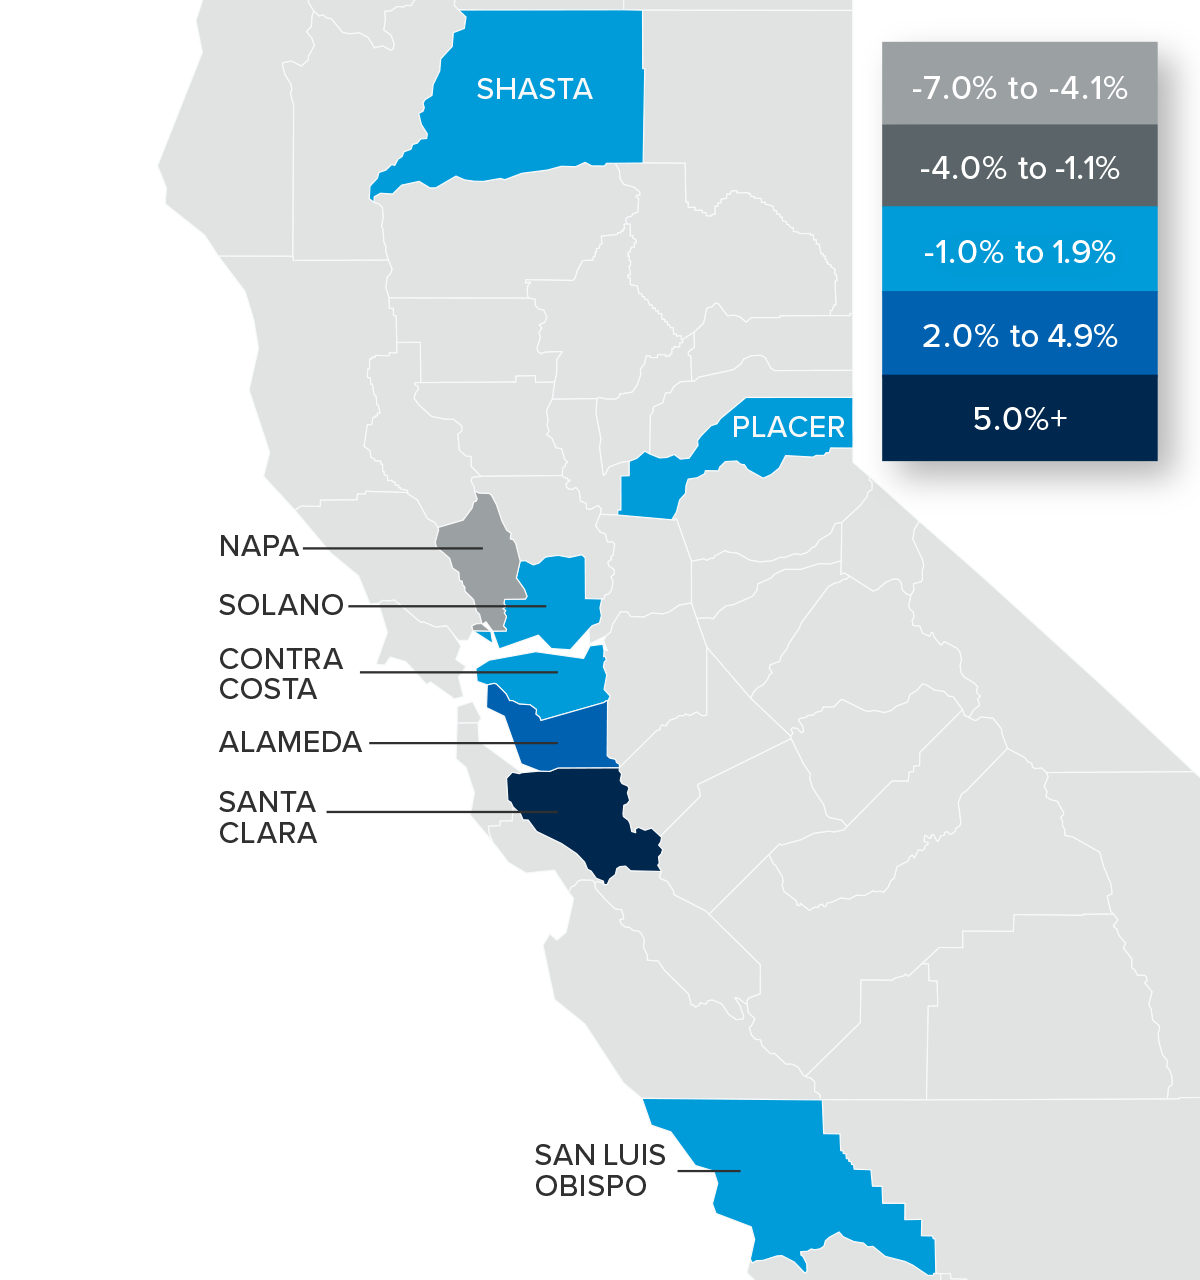
❱ Median list prices in the region fell 3.8% from the second quarter, with double-digit declines in Placer and Napa counties. All counties except Santa Clara (which was flat) saw list prices fall quarter over quarter.
❱ Year over year, prices rose in all counties except Napa and Shasta. Relative to the second quarter, prices were higher in all market areas other than Contra Costa and San Luis Obispo counties.
❱ I believe that the worst of the price drops are behind us, but high mortgage rates are now having an impact.
Mortgage Rates
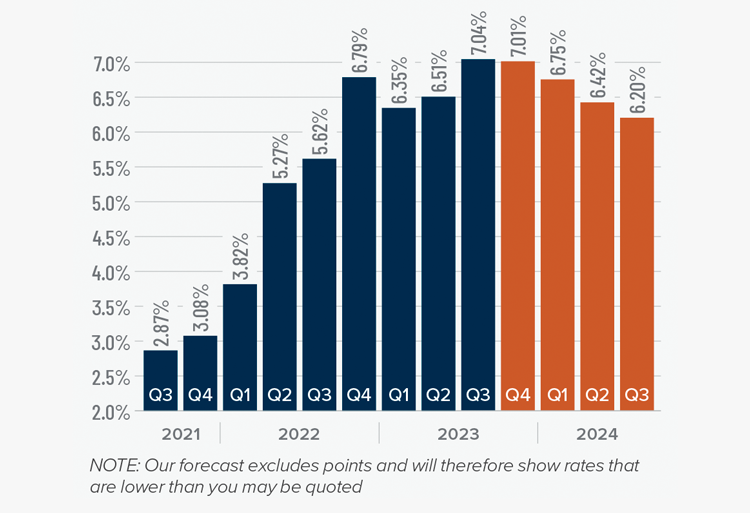
Mortgage rates continued trending higher in the third quarter of 2023 and are now at levels we have not seen since the fall of 2000. Mortgage rates are tied to the interest rate (yield) on 10-year treasuries, and they move in the opposite direction of the economy. Unfortunately for mortgage rates, the economy remains relatively buoyant, and though inflation is down significantly from its high, it is still elevated. These major factors and many minor ones are pushing Treasury yields higher, which is pushing mortgage rates up. Given the current position of the Federal Reserve, which intends to keep rates “higher for longer,” it is unlikely that home buyers will get much reprieve when it comes to borrowing costs any time soon.
With such a persistently positive economy, I have had to revise my forecast yet again. I now believe rates will hold at current levels before starting to trend down in the spring of next year.
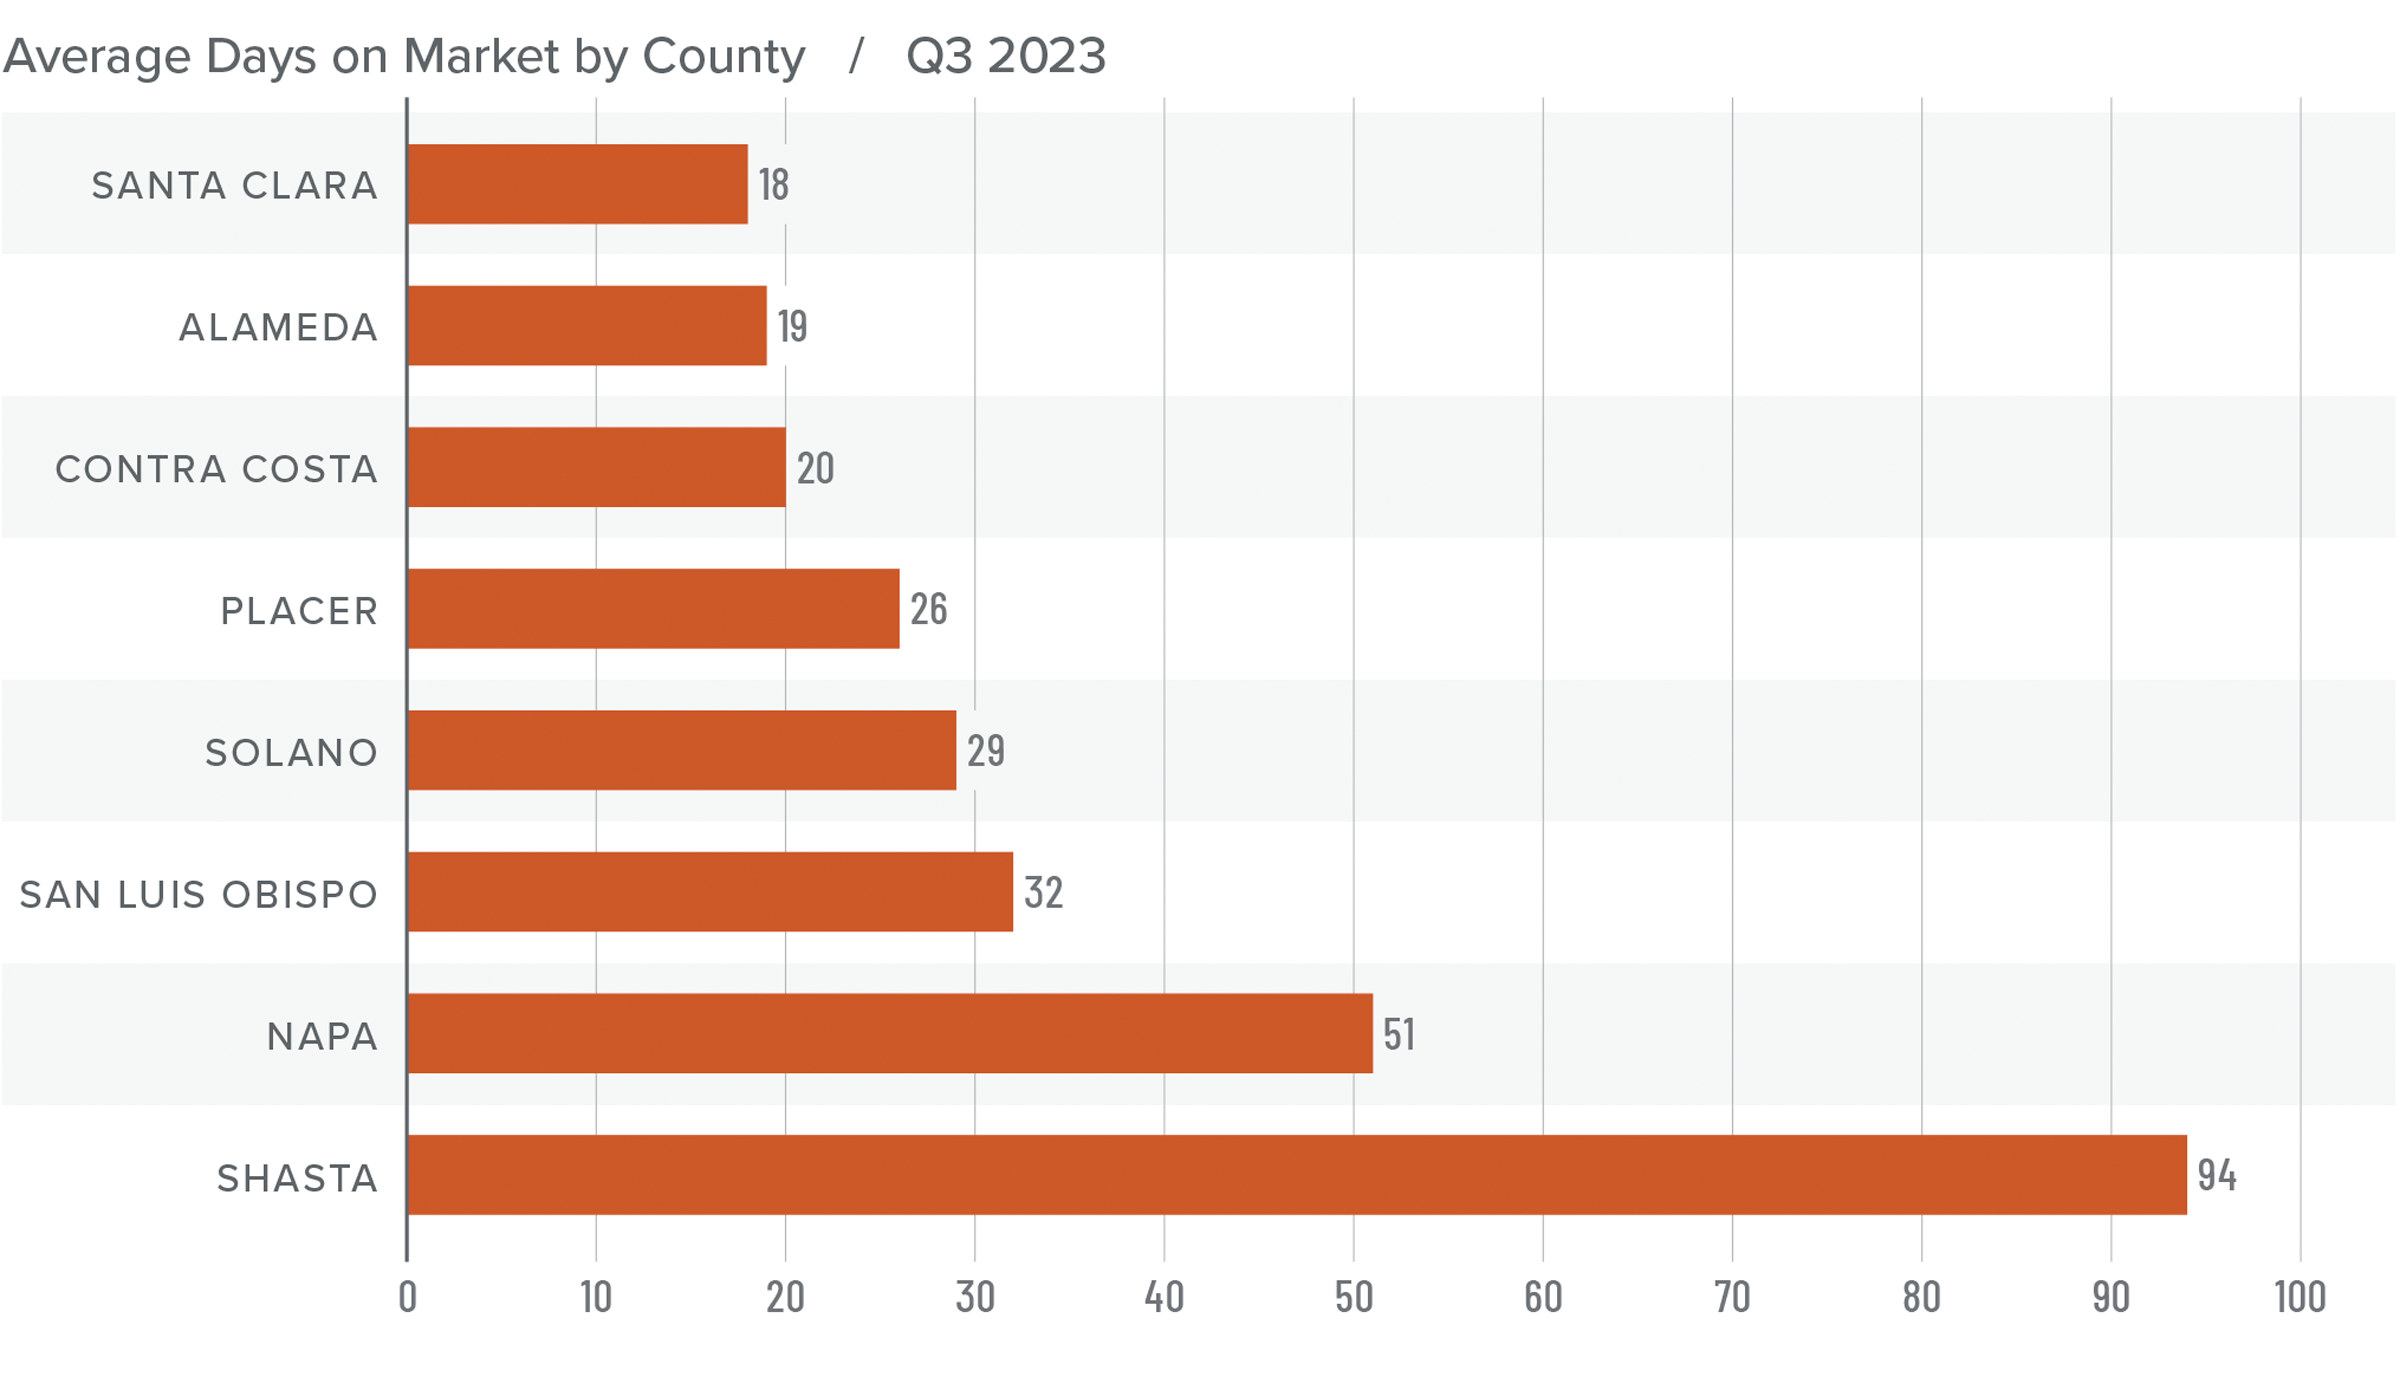
Northern California Days on Market
❱ The average time it took to sell a home in the Northern California counties in this report fell by one day compared to the third quarter of 2022.
❱ Year over year, the length of time it took to sell a home fell in five counties, but rose in Napa, Shasta, and San Luis Obispo counties. Compared to the second quarter of 2023, market time fell in Solano, Placer, and San Luis Obispo counties; was static in Alameda and Napa counties; and rose in Santa Clara and Shasta counties.
❱ In the third quarter, it took an average of 36 days to sell a home, which matched the rate in the second quarter of the year.
❱ Both year over year and quarter over quarter, homes sold the fastest in Santa Clara County and slowest in Shasta County.
Conclusions
This speedometer reflects the state of the region’s real estate market using housing inventory, price gains, home sales, interest rates, and larger economic factors.
With inventory levels rising in every county other than San Luis Obispo and Shasta, home buyers are generally seeing more choice in the region. Interestingly enough, this did not impact the length of time it took for homes to sell in the third quarter.
Home price growth has halted and, given that median list prices also fell from the second quarter of this year, sale prices aren't expected to rise as we move through the final quarter of the year. This theory is also supported by the fact that mortgage rates have yet to peak, which will certainly act as a headwind across the market.
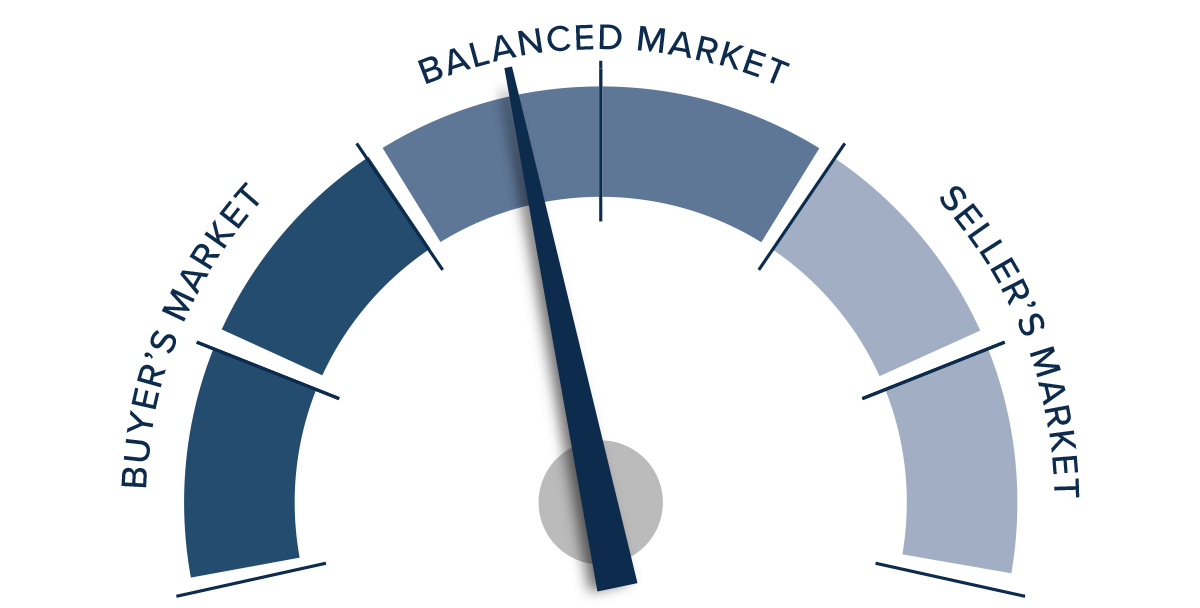
Given all the above, the needle stays in the balanced quadrant of the speedometer, but is tilted a little toward buyers given the modest decline of list prices and the increase in the number of homes for sale.


")


