
 Facebook
 X
X
 Pinterest
 Copy Link

The following analysis of select counties of the Northern California real estate market is provided by Windermere Real Estate Chief Economist Matthew Gardner. We hope that this information may assist you with making better-informed real estate decisions. For further information about the housing market in your area, please don’t hesitate to contact your Windermere Real Estate agent.
Regional Economic Overview
Northern California added 60,900 jobs in the first quarter of 2022, and 213,300 jobs have returned over the past year. With total employment now at 3.02 million, the markets covered by this report have recovered all but 24,800 of the 473,900 jobs lost during the pandemic. With solid growth in the region, the unemployment rate fell from 3.6% at the end of 2021 to 3.1% in March of this year. By county, the lowest jobless rate was in Santa Clara County (2.5%), and the highest rates were in Solano and Shasta counties, where 4.6% of the workforce remains unemployed. The region’s labor force grew in the quarter but remains below pre-pandemic levels. This is likely to mean that businesses will continue to find it hard to attract new employees, which could slow the pace of growth going forward. That said, I feel confident that all the jobs lost to COVID-19 will have been recovered by the spring.
Northern California Home Sales
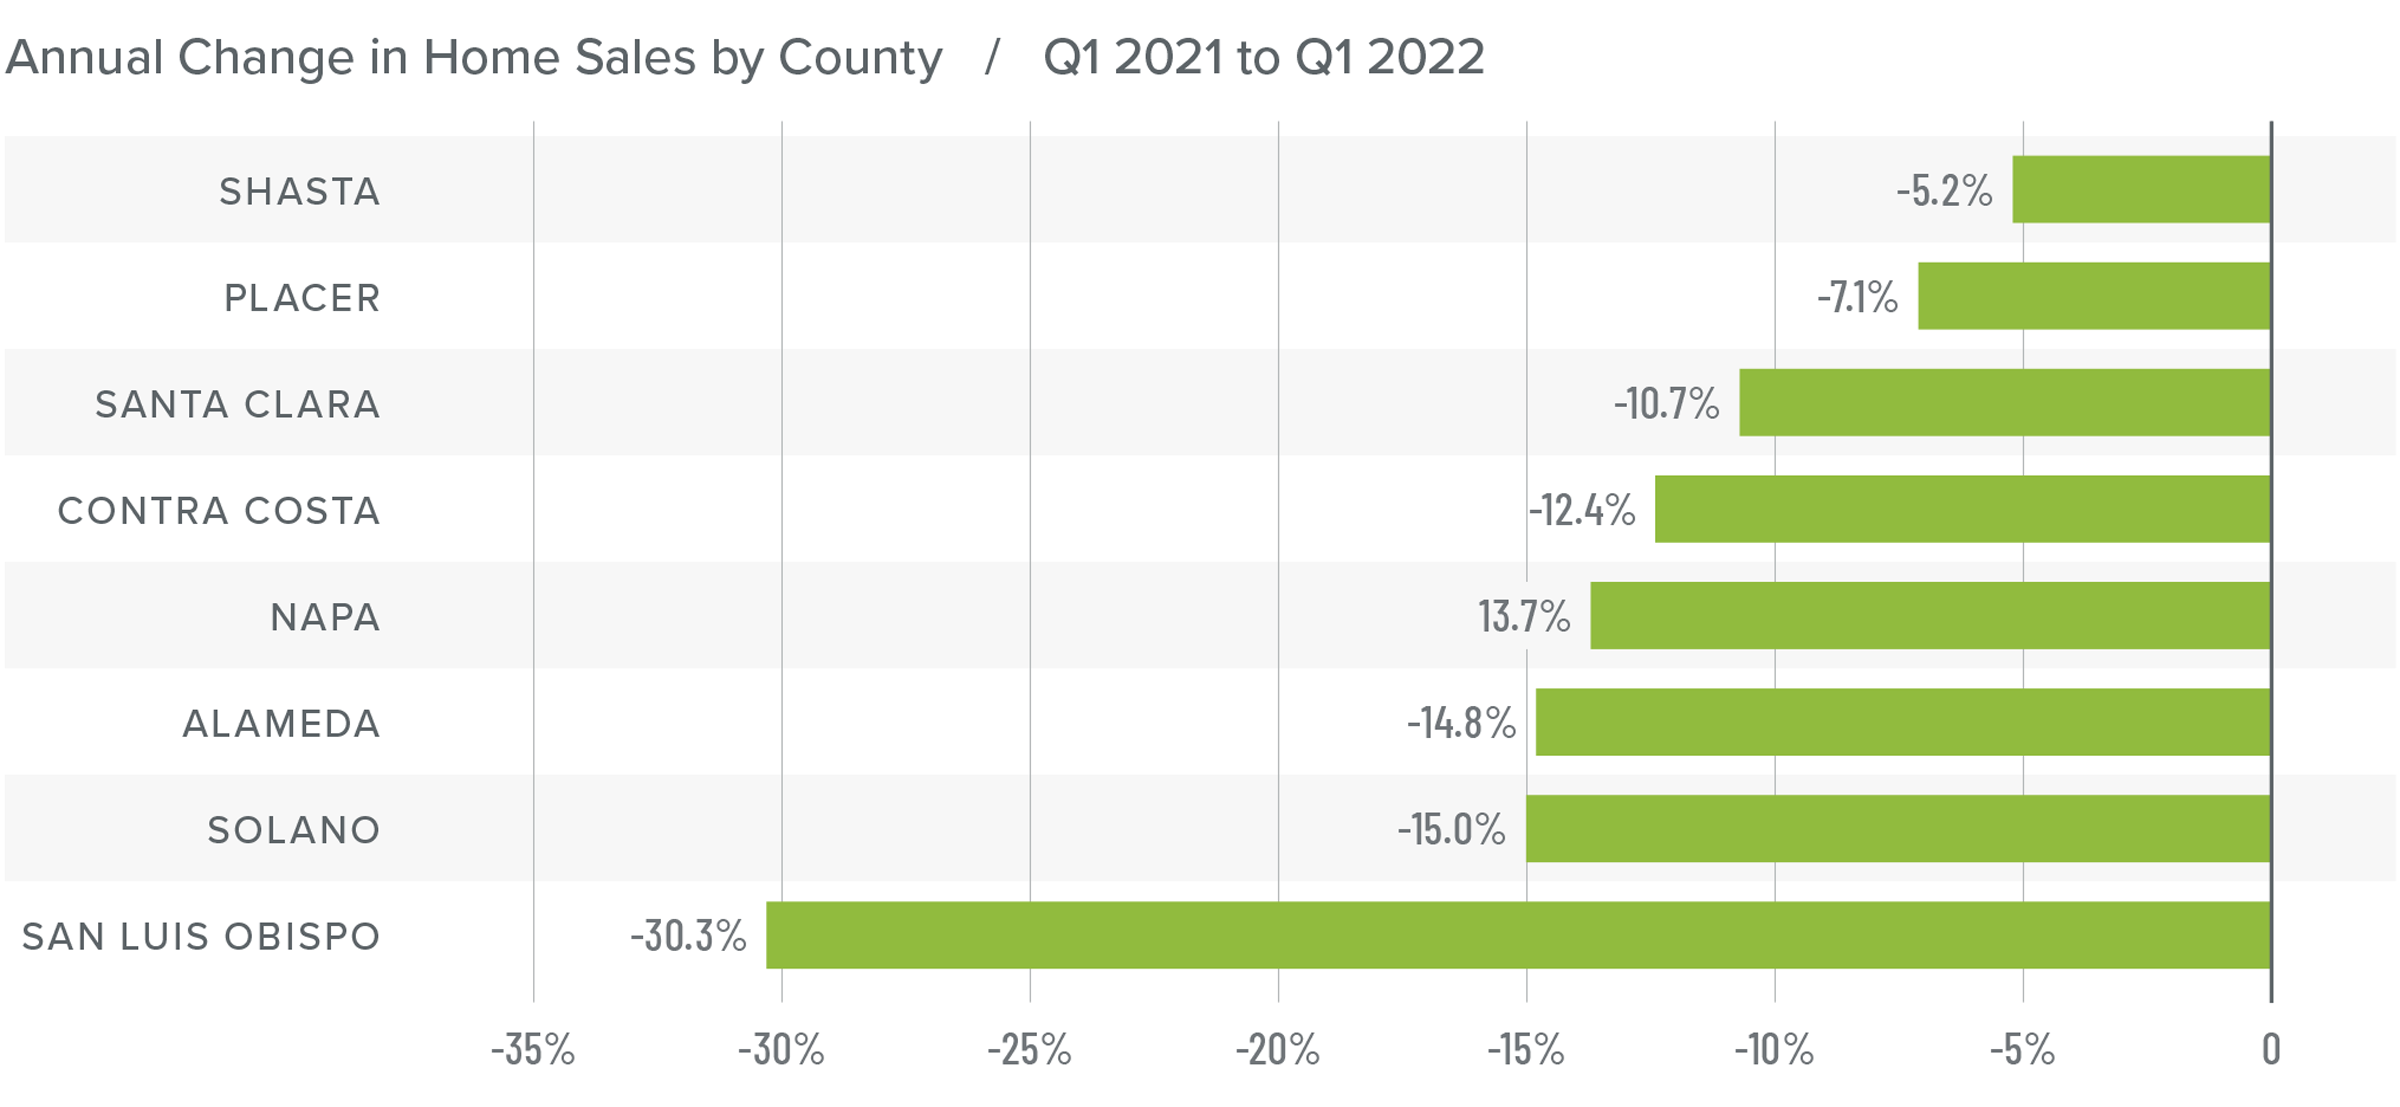
❱ In the first quarter of the year, 10,347 homes sold, which is a drop of 12.4% compared to a year ago. Sales were 27.2% lower than in the fourth quarter of 2021.
❱ Year over year, sales fell in all counties contained in this report. Solano County saw a modest drop, but there were fairly significant decreases across the rest of the region.
❱ With listing activity rising 17% compared to the fourth quarter of 2021, the drop in sales was a little surprising.
❱ Pending home sales ticked up from the final quarter of 2021, suggesting that we may see some growth in sales in the second quarter of this year.
Northern California Home Prices
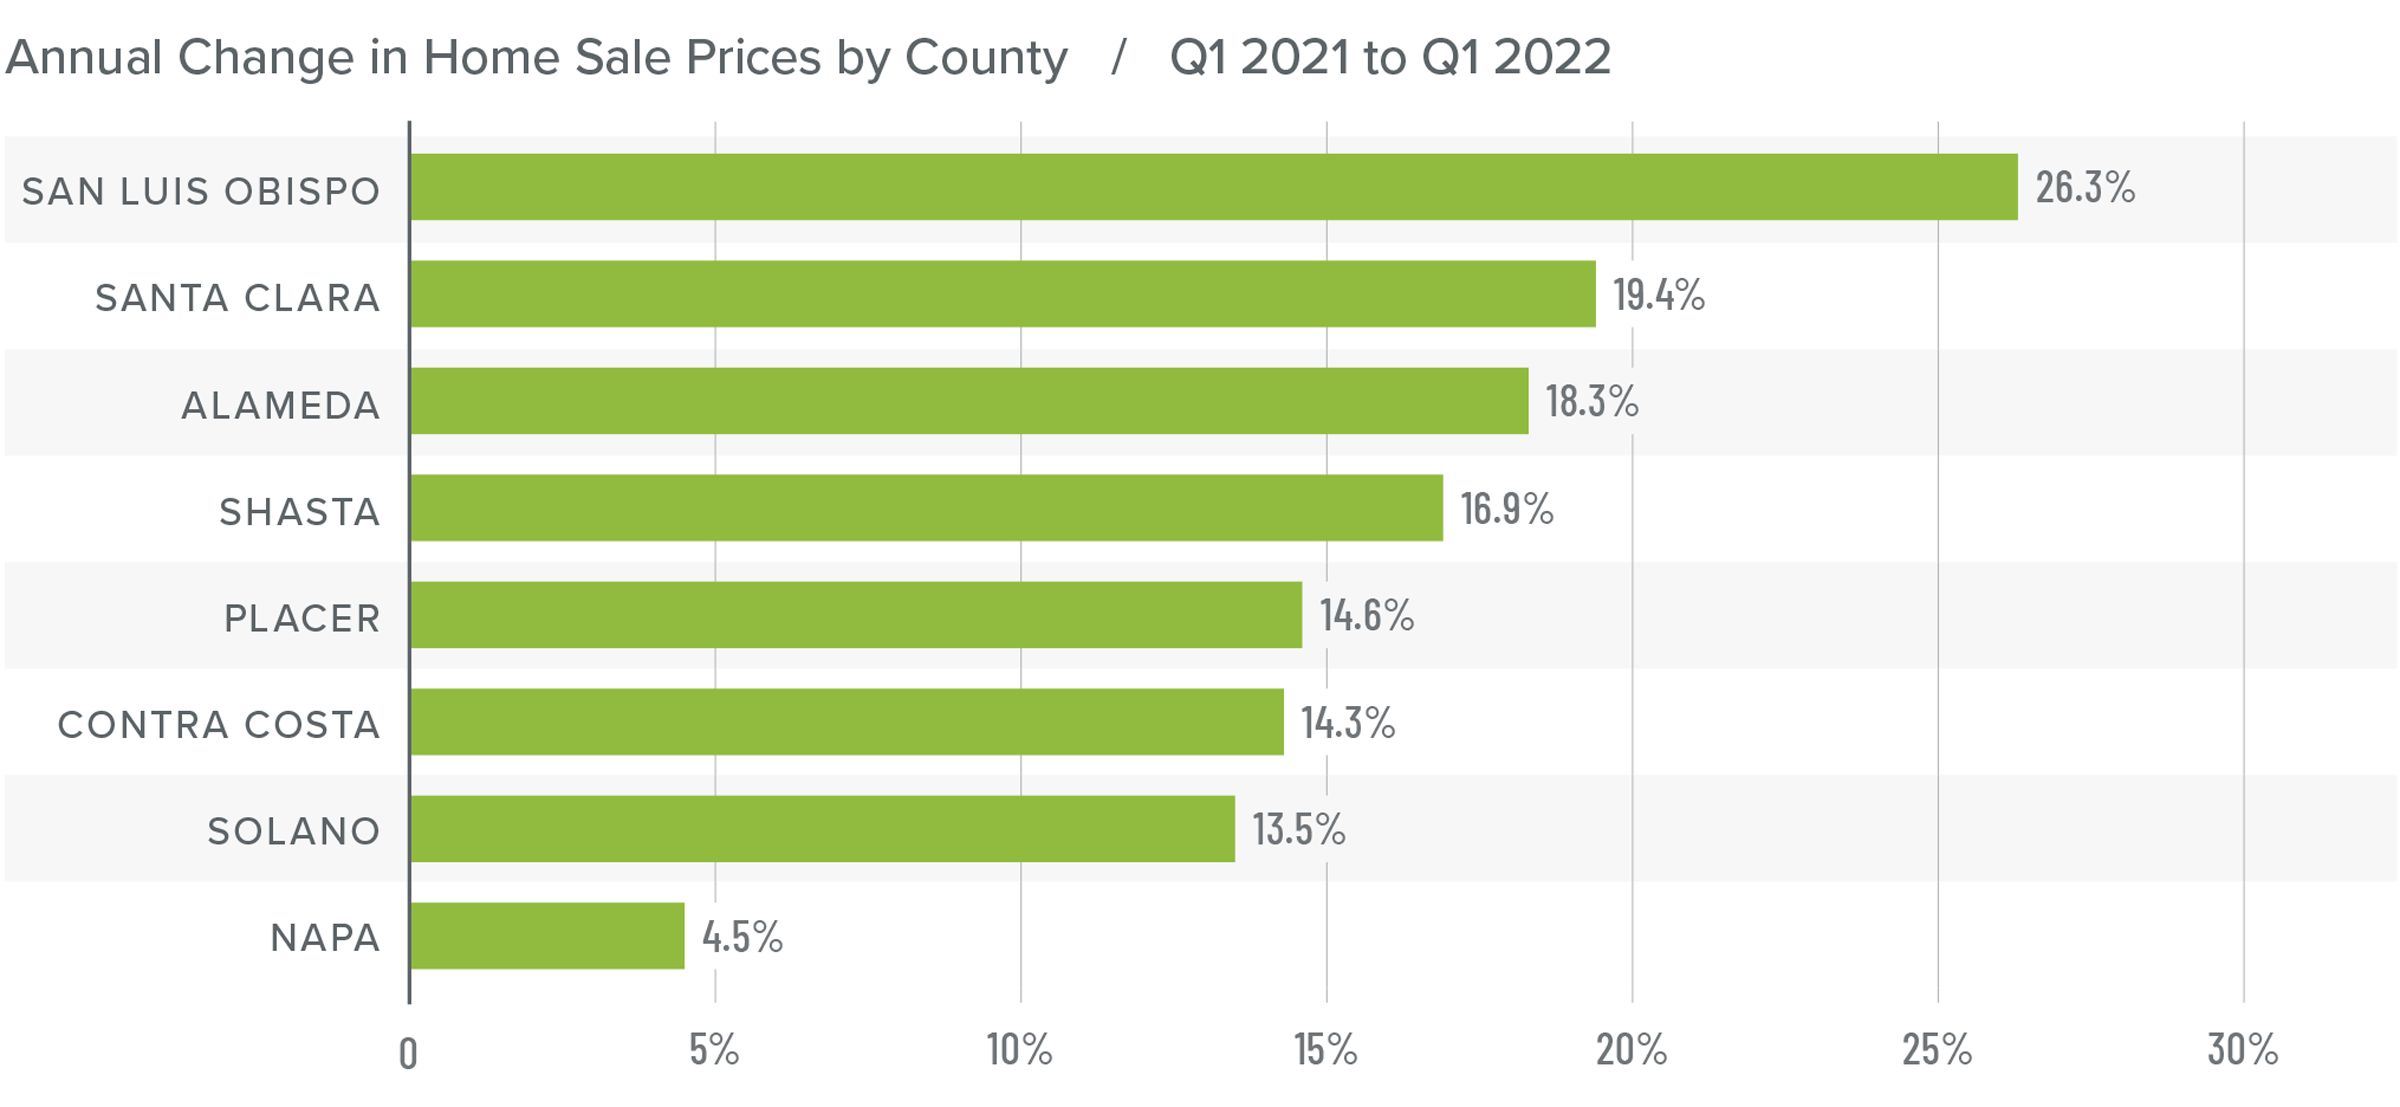
❱ Even with sales pulling back, the average home price in the region rose an impressive 17.2% year over year to $1.215 million. Compared to the final quarter of 2021, home prices rose 4%.
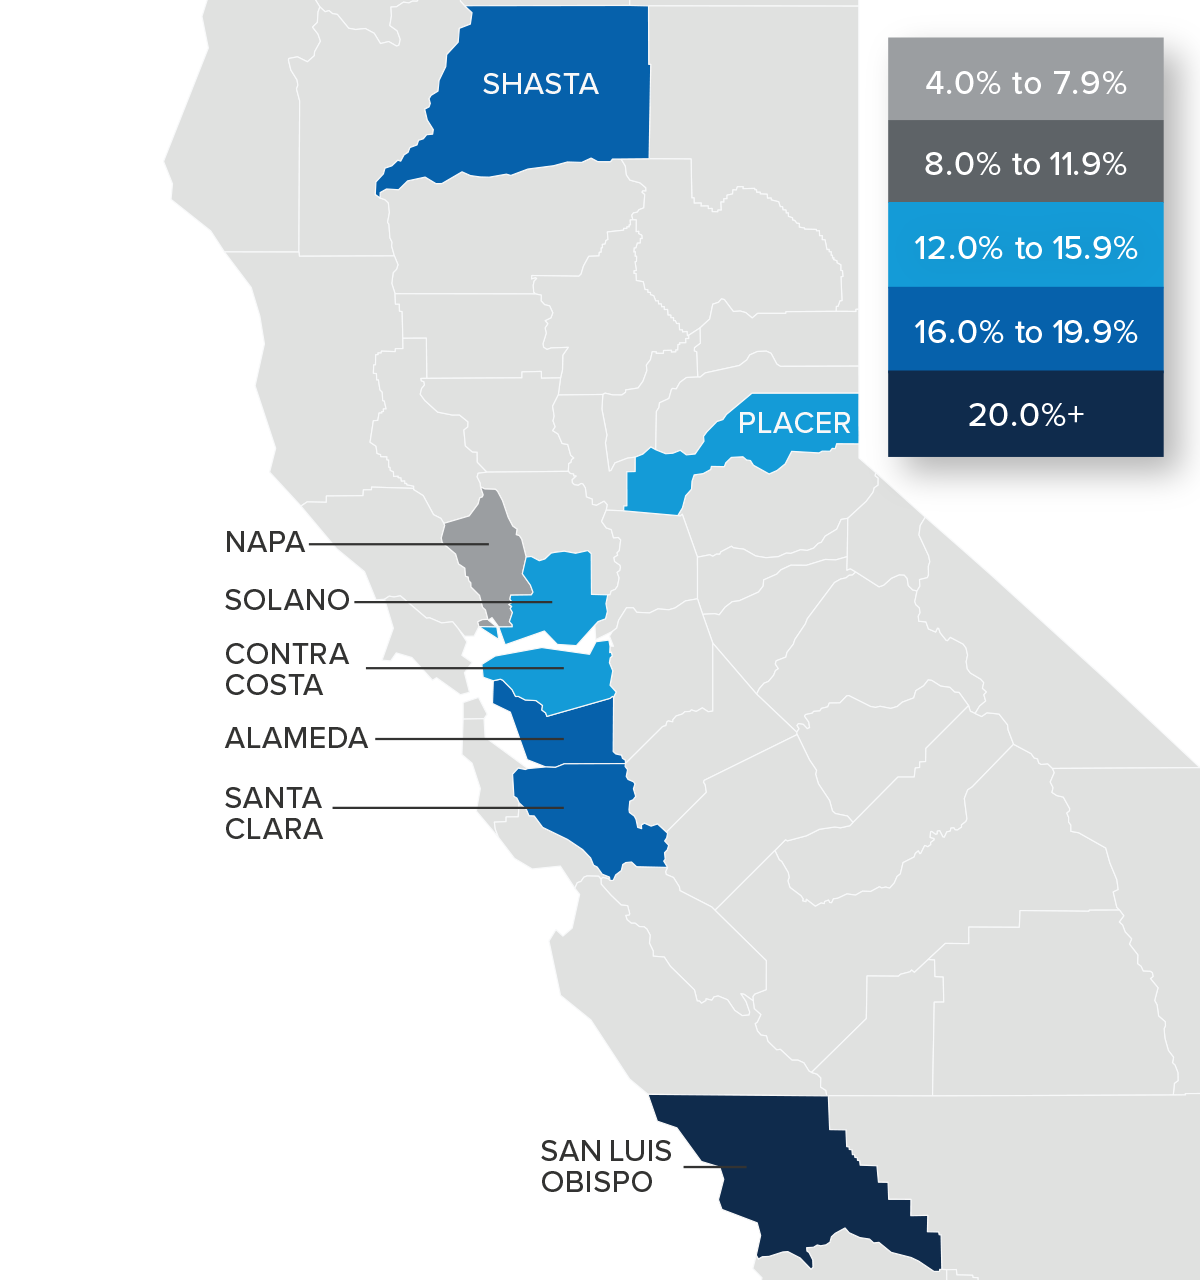
❱ The most affordable county relative to average prices continued to be Shasta. Santa Clara was again the most expensive market.
❱ Prices rose by double digits in all counties other than Napa compared to a year ago. Prices were also higher everywhere but Napa County compared to the fourth quarter of 2021.
❱ Rising prices continue to impact affordability in the region and the significant jump in mortgage rates in the first quarter will not help matters. Any effects of rising rates on prices were not evident in the first quarter, but the second quarter should be more telling.
Mortgage Rates
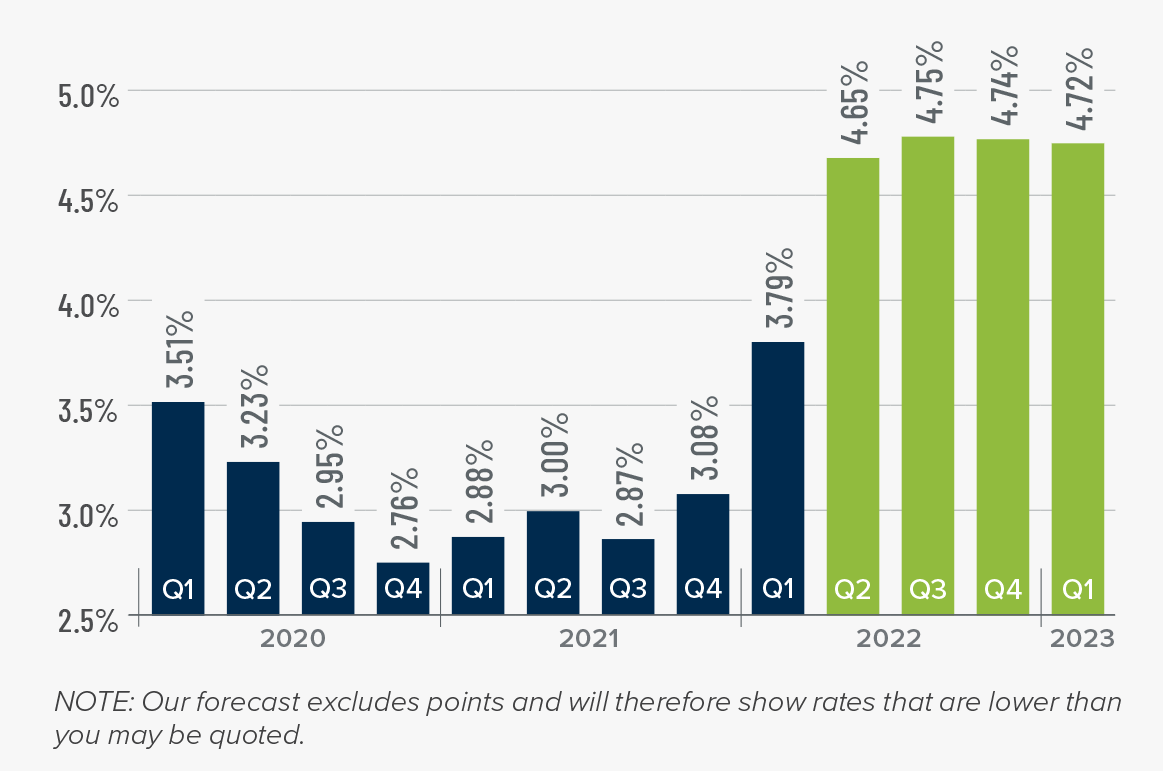
Average rates for a 30-year conforming mortgage were 3.11% at the end of 2021, but since then have jumped over 1.5%—the largest increase since 1987. The speed of the surge in rates is due to the market having quickly priced in the seven-to-eight rate increase that the Fed is expected to implement this year.
Because the mortgage market has priced this into the rates they are offering today, my forecast suggests that we are getting close to a ceiling in rates, and it is my belief that they will rise modestly in the second quarter before stabilizing for the balance of the year.
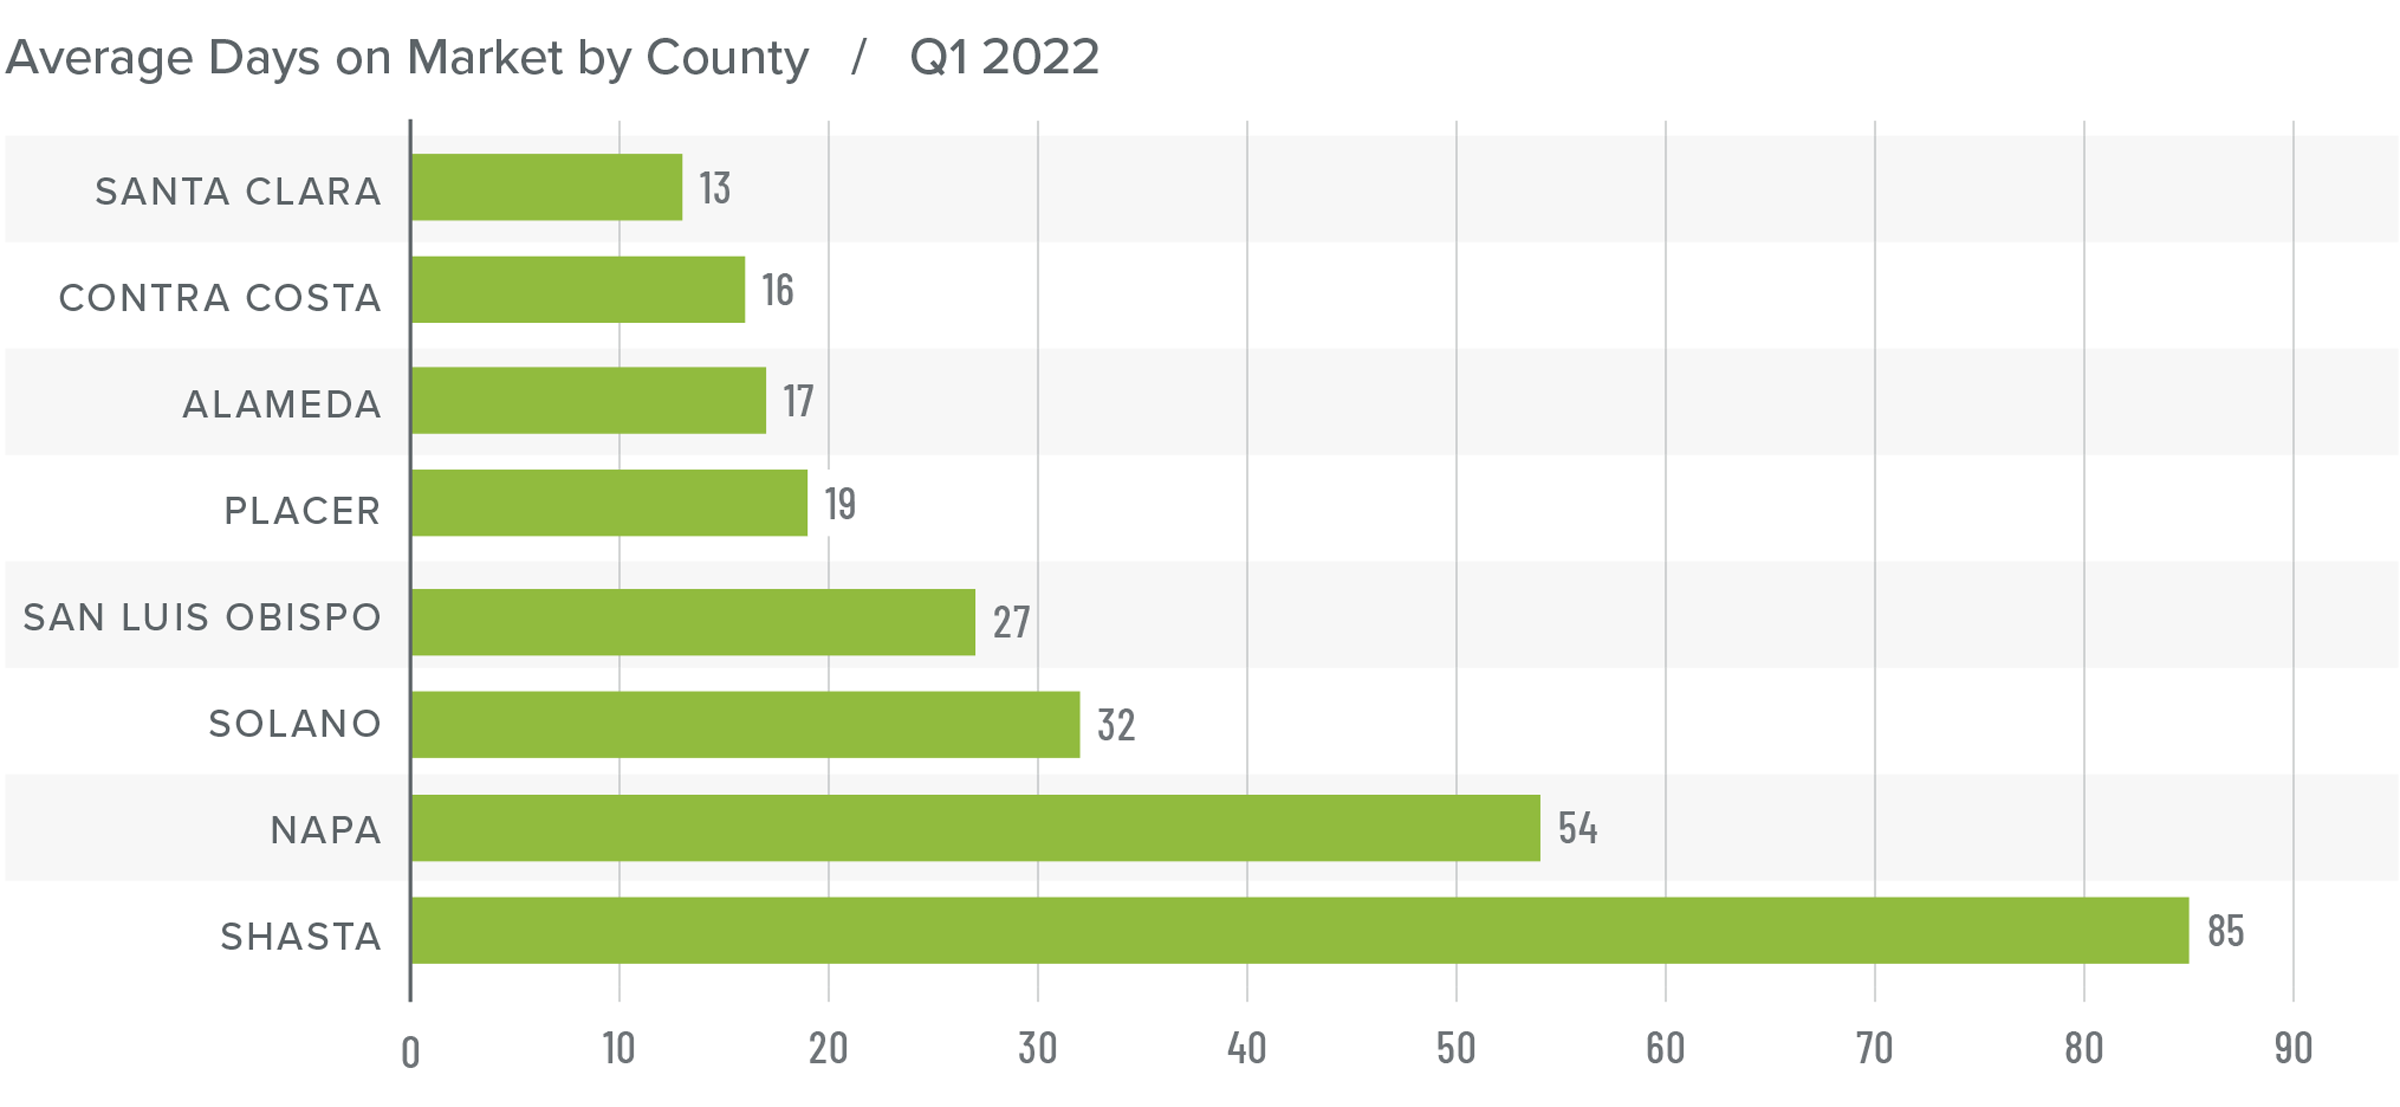
Northern California Days on Market
❱ The average time it took to sell a home in the Northern California counties in this report dropped seven days compared to the first quarter of 2021.
❱ The amount of time it took to sell a home dropped in every county other than Solano (+1 day) compared to a year ago. Days on market fell everywhere except Shasta, Placer, and San Luis Obispo compared to the fourth quarter of 2021.
❱ In the first quarter, it took an average of 33 days to sell a home, which matched the fourth quarter of 2021.
❱ The greatest drop in market time from a year ago was in Napa County, where it took 14 fewer days to sell a home.
Conclusions
This speedometer reflects the state of the region’s real estate market using housing inventory, price gains, home sales, interest rates, and larger economic factors.
The jump in home prices compared to the prior quarter may be a surprise to some given the rapid increase in mortgage rates. However, when rates rise, there is typically a lag in time before we know the impact on the market. The increase in the number of homes for sale means there is more choice for buyers which, combined with higher financing costs, should start to taper the pace of price appreciation as we move into the spring buying season. Affordability continues to be a concern, but the market does not appear to be overly affected thus far. Average listing prices in most counties are increasing, which suggests that sellers remain confident for the time being.

Although prices continue to increase at a significant pace, the growth in listing activity combined with lower sales may suggest that the market may be starting to slow from the frenetic pace of the past few years. With all the data here, I have moved the needle a little towards home buyers, although it clearly remains a seller’s market.
About Matthew Gardner

As Chief Economist for Windermere Real Estate, Matthew Gardner is responsible for analyzing and interpreting economic data and its impact on the real estate market on both a local and national level. Matthew has over 30 years of professional experience both in the U.S. and U.K.
In addition to his day-to-day responsibilities, Matthew sits on the Washington State Governors Council of Economic Advisors; chairs the Board of Trustees at the Washington Center for Real Estate Research at the University of Washington; and is an Advisory Board Member at the Runstad Center for Real Estate Studies at the University of Washington where he also lectures in real estate economics.
")


