
 Facebook
 X
X
 Pinterest
 Copy Link

The following analysis of the Northern California real estate market is provided by Windermere Real Estate Chief Economist Matthew Gardner. We hope that this information may assist you with making better-informed real estate decisions. For further information about the housing market in your area, please don’t hesitate to contact your Windermere Real Estate agent.
Regional Economic Overview
The job recovery in Northern California picked up its pace last fall, which was good news given the lackluster job growth last summer. Total employment has now risen to 2.94 million, and the markets covered by this report have recovered all but 106,000 of the 474,900 jobs that were lost during the pandemic. Year over year, total employment rose 125,800, causing the unemployment rate to drop from 6.5% to 4%—a far cry from the pandemic peak of 14%. By county, the lowest jobless rate was in Santa Clara County (3.2%), and the highest was in Solano County, where 5.4% of the workforce remains unemployed. The latest data does not cover the period when the Omicron variant of COVID-19 came to light, so we will not see any of its impacts until the January data becomes available. It is also worth noting that the region’s labor force has not been increasing at the expected pace, which can actually slow the job recovery as businesses have a hard time finding workers. Of note is that there are currently more than 78,000 fewer working-age people in the workforce than before the pandemic started.
northern california Home Sales
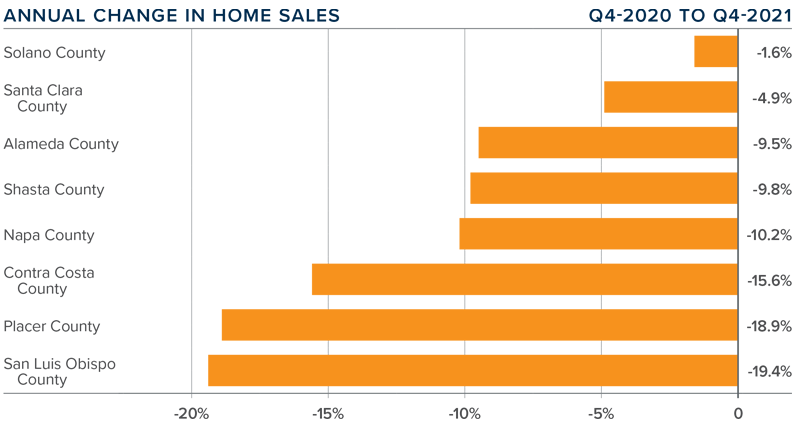
❱ In the final quarter of 2021, 14,218 homes sold—a drop of 10.6% compared to a year ago and 14.2% lower than in the third quarter. Seasonality is at least partially responsible for the quarter-over-quarter drop, but it’s also because inventory constraints are limiting sales.
❱ Year-over-year, sales fell in all the counties contained in this report, with a modest drop in Solano County and fairly significant decreases across the rest of the region.
❱ Listing activity fell 32% compared to the same period a year ago, which certainly played a part in the lower sales numbers.
❱ Pending home sales were also lower, suggesting that sales in the first quarter of 2022 may slow further.
northern california Home Prices
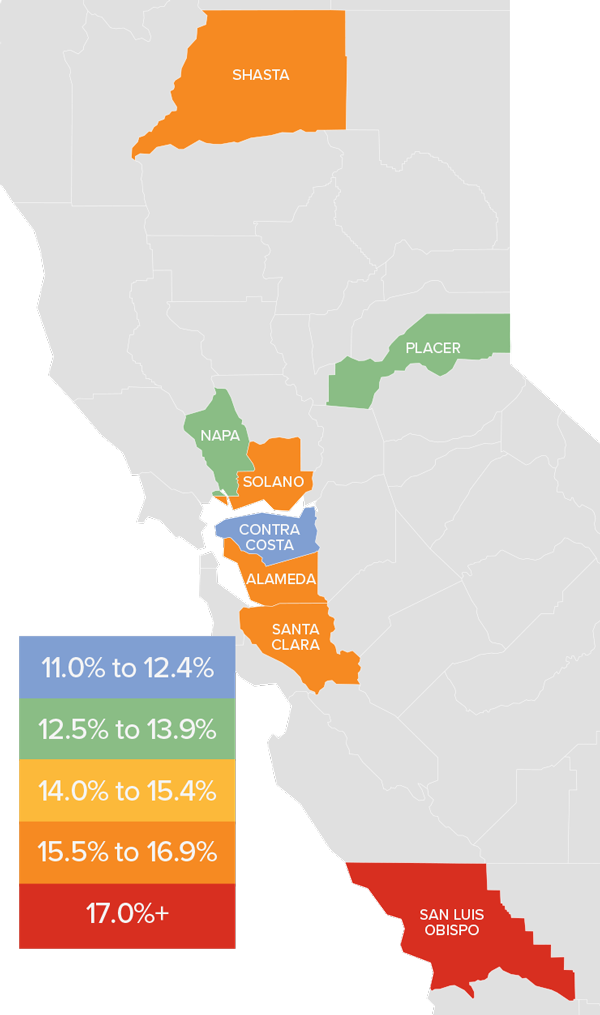
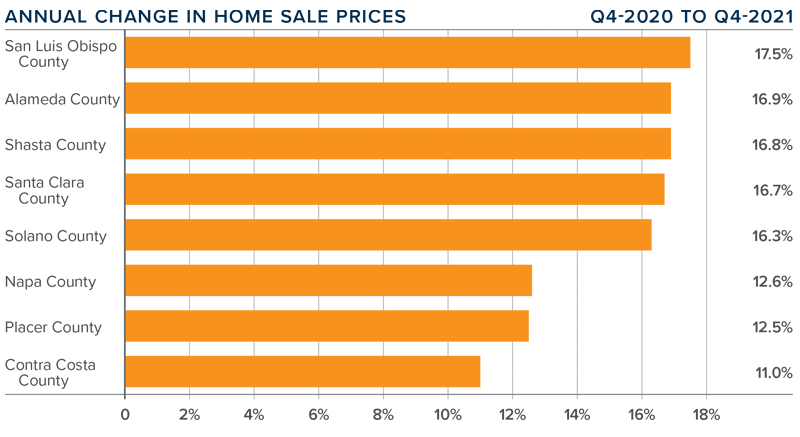
❱ The average home price in the counties contained in this report rose 16.2% year over year to $1.168 million. Of note is that prices fell 2.1% from the third quarter but this may simply be due to seasonality.
❱ The most affordable county relative to average sale prices was Shasta. Santa Clara remains the most expensive market.
❱ Average prices in all counties rose double digits compared to a year ago, but fell in all counties other than Alameda, Santa Clara, and San Luis Obispo compared to the third quarter of the year.
❱ Affordability continues to be an issue in all areas, but the pace of price growth has been slowing as mortgage rates rose .3% in the quarter. I anticipate that rates will continue to trend higher as we move through the year, which is also likely to act as somewhat of a headwind to price appreciation.
Days on Market
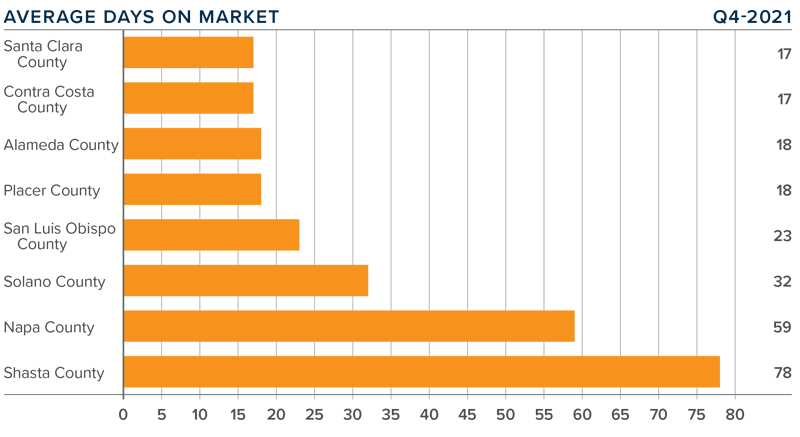
❱ The average time it took to sell a home dropped five days compared to the final quarter of 2020.
❱ The amount of time it took to sell a home dropped in every county compared to the previous year, but the average days on market rose across the board compared to the third quarter of 2021.
❱ In the fourth quarter, it took an average of 33 days to sell a home, which was 4 more days than it took during the third quarter.
❱ The greatest drop in market time was in San Luis Obispo County, where it took 19 fewer days to sell a home than it did the prior year.
Conclusions

This speedometer reflects the state of the region’s real estate market using housing inventory, price gains, home sales, interest rates, and larger economic factors.
While the pace of price growth slowed in the fourth quarter, appreciation remains very strong. Those wondering what it will take to cause the market to slow down must consider two factors: supply and financing costs. It’s unlikely that there will be any significant increase in inventory in the coming year, but mortgage rates are on the rise. Even though I do not expect them to breach 4% until 2023, higher rates are likely to take some of the heat out of the market.
I have decided to leave the needle in the same position as in the third quarter. As rising mortgage rates are offset by low housing supply, it remains a seller’s market.
About Matthew Gardner

As Chief Economist for Windermere Real Estate, Matthew Gardner is responsible for analyzing and interpreting economic data and its impact on the real estate market on both a local and national level. Matthew has over 30 years of professional experience both in the U.S. and U.K.
In addition to his day-to-day responsibilities, Matthew sits on the Washington State Governors Council of Economic Advisors; chairs the Board of Trustees at the Washington Center for Real Estate Research at the University of Washington; and is an Advisory Board Member at the Runstad Center for Real Estate Studies at the University of Washington where he also lectures in real estate economics.
")


