In this week’s episode of Mondays with Matthew, Windermere Chief Economist Matthew Gardner kicks off a series of episodes in which he answers questions from his followers. The first deals with how COVID-19 will impact buyer behaviors, especially in more urban markets.
Job growth is critical to the health of the housing market, so on this week’s episode of “Mondays with Matthew,” Windermere Chief Economist Matthew Gardner analyzes the effect of COVID-19 on employment and what we can expect for the duration of the year.
We are excited to introduce the Gardner Report to Northern California! The following analysis of the real estate market in select counties of Northern California is provided by Windermere Real Estate Chief Economist Matthew Gardner. We hope that this information may assist you with making better-informed real estate decisions. For further information about the housing market in your area, please don’t hesitate to contact your Windermere agent.
A MESSAGE FROM MATTHEW GARDNER
Needless to say, any discussion about the U.S. economy, state economy, or housing markets in the first quarter of this year is almost meaningless given events surrounding the COVID-19 virus.
Although you will see below data regarding housing activity in the region, many markets came close to halting transactions in March and many remain in some level of paralysis. As such, drawing conclusions from the data is almost a futile effort. I would say, though, it is my belief that the national and state housing markets were in good shape before the virus hit and will be in good shape again, once we come out on the other side. In a similar fashion, I anticipate the national and regional economies will start to thaw, and that many of the jobs lost will return with relative speed. Of course, all of these statements are wholly dependent on the country seeing a peak in new infections in the relatively near future. I stand by my contention that the housing market will survive the current economic crisis and it is likely we will resume a more normalized pattern of home sales in the second half of the year.
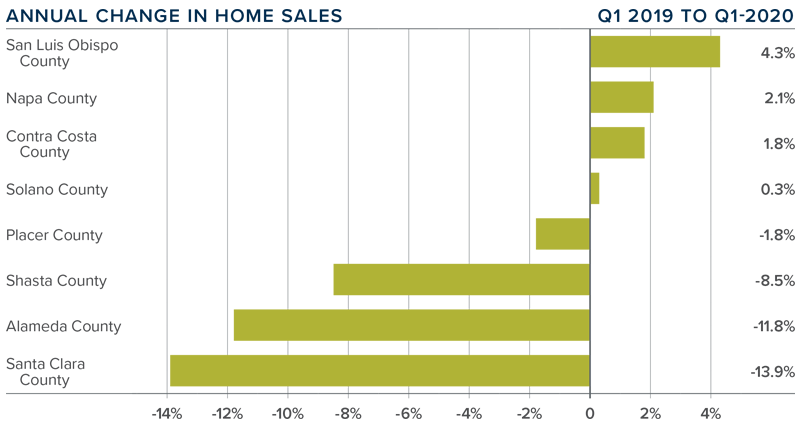
HOME SALES
In the first quarter of 2020, 6,191 homes sold, a drop of 3.8% compared to the first quarter of 2019.
Sales were a mixed bag, with increases in half of the counties contained in this report and half seeing sales slow. Of note was the decent increase in sales in Contra Costa County, but this was offset by a drop in sales in Alameda County.
The contraction of sales may be attributed to a significant drop in inventory, which was down 24.7% from a year ago. This decline is likely due to COVID-19. Second quarter data will confirm or refute this thesis.
Pending home sales dropped 6.1% compared to the first quarter of 2019. Again, this is likely due to COVID-19.
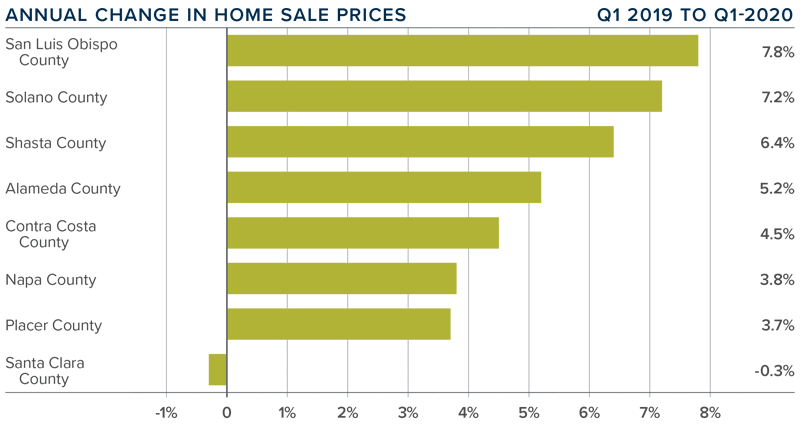
HOME PRICES
The average home price in the Northern Californian counties contained in this report rose 3.7% year-over-year to $784,843.
The most affordable counties in terms of average sale prices were Shasta and Solano. Price growth in these markets was very solid.
Average prices rose in all counties other than Santa Clara, which is not surprising given it is the most expensive market covered in this report. Prices across most counties rose at above-average long-term rates, with impressive increases in San Luis Obispo and Solano counties.
As this is the first report prepared for counties within Northern California, my ability to comment is limited. That said, it will be interesting to see how the market further reacts to COVID-19 and we look forward to offering analysis and perspective when we get second quarter data.
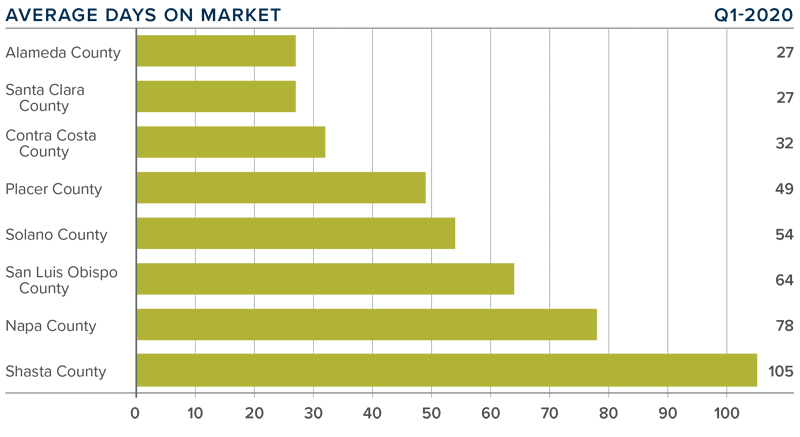
DAYS ON MARKET
The average time it took to sell a home in the Northern Californian counties covered by this report dropped five days compared to the first quarter of 2019.
In the first quarter, it took an average of 55 days to sell a home. Homes sold fastest in Alameda and Santa Clara counties, and slowest in Shasta County.
The amount of time it took to sell a home dropped in all counties other than Shasta (+2 days) and San Luis Obispo (+4 days).
The greatest drop in market time was in Napa County, where it took 17 fewer days to sell a home than in the first quarter of 2019.
CONCLUSIONS
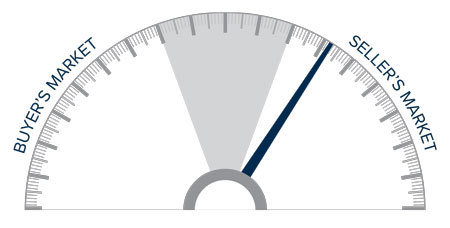
This speedometer reflects the state of the region’s real estate market using housing inventory, price gains, home sales, interest rates, and larger economic factors.
Given the current economic environment, I have decided to freeze the needle in place until we see
a restart in the economy. Once we have resumed “normal” economic activity, there will be a period of adjustment with regard to housing. Therefore, it is appropriate to wait until later in the year to offer my opinions about any quantitative impact the pandemic will have on the housing market.
ABOUT MATTHEW GARDNER
As Chief Economist for Windermere Real Estate, Matthew Gardner is responsible for analyzing and interpreting economic data and its impact on the real estate market on both a local and national level. Matthew has over 30 years of professional experience both in the U.S. and U.K.
In addition to his day-to-day responsibilities, Matthew sits on the Washington State Governors Council of Economic Advisors; chairs the Board of Trustees at the Washington Center for Real Estate Research at the University of Washington; and is an Advisory Board Member at the Runstad Center for Real Estate Studies at the University of Washington where he also lectures in real estate economics.
Chief Economist for Windermere Real Estate, Matthew Gardner, returns for his weekly update, Mondays with Matthew. This week, he discusses forbearance options available to homeowners who are struggling to pay their mortgage.
The following analysis of select Maui real estate markets is provided by Windermere Real Estate Chief Economist Matthew Gardner. We hope that this information may assist you with making better-informed real estate decisions. For further information about the housing market in your area, please don’t hesitate to contact your Windermere agent.
A MESSAGE FROM MATTHEW GARDNER
Needless to say, any discussion about the U.S. economy, state economy, or housing markets in the first quarter of this year is almost meaningless given events surrounding the COVID-19 virus.
Although you will see below data regarding housing activity in the region, many markets came close to halting transactions in March and many remain in some level of paralysis. As such, drawing conclusions from the data is almost a futile effort. I would say, though, it is my belief that the national and state housing markets were in good shape before the virus hit and will be in good shape again, once we come out on the other side. In a similar fashion, I anticipate the national and regional economies will start to thaw, and that many of the jobs lost will return with relative speed. Of course, all of these statements are wholly dependent on the country seeing a peak in new infections in the relatively near future. I stand by my contention that the housing market will survive the current economic crisis and it is likely we will resume a more normalized pattern of home sales in the second half of the year.
HOME SALES
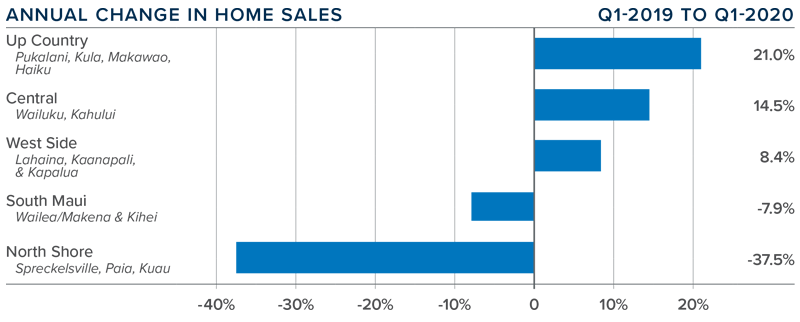
In the first quarter of 2020, 545 homes sold. This was an increase of 3% over the first quarter of 2019, but a drop of 1.1% from the fourth quarter of 2019.
Not all markets saw a drop in sales, with notable increases in the Up Country and Central markets compared to the first quarter of 2019.
The rise in sales came as aggregate inventory levels rose 6.3%. Clearly, the market did not experience any effects from COVID-19 in the first quarter. It will be interesting to see how the numbers look in the second quarter.
Pending home sales were up 0.4% compared to the fourth quarter of 2019, suggesting that second quarter closings may be reasonably good.
HOME PRICES
The average home price in the region rose 2.6% year-over-year to $880,006 but was down 5.8% compared to the final quarter of 2019.
Affordability remains a significant issue. As we move through the second quarter, I will be interested to see how demand reacts to COVID-19. Any significant slowdown in demand will put downward pressure on home prices.
Price changes on Maui were uneven, rising in three areas and falling in two. There were significant price gains in the North Shore market area.
It is too early to say what effects COVID-19 will have on housing values on Maui. I will be watching this closely, specifically as it pertains to buyers of vacation homes.
DAYS ON MARKET
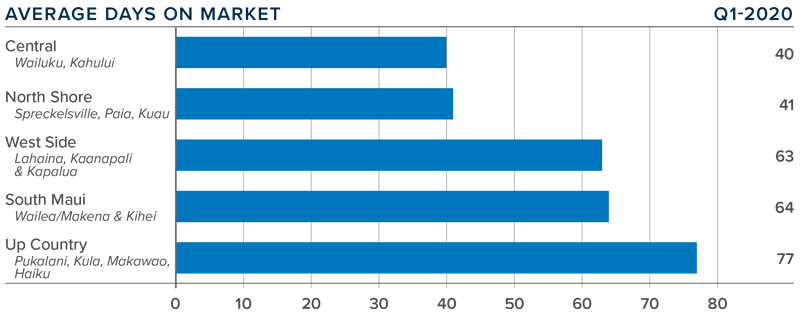
The average number of days it took to sell a home on Maui dropped 17 days compared to the first quarter of 2019.
In the first quarter it took an average of 57 days to sell a home, with the Central market selling at the fastest pace. Up Country homes are taking the longest time to sell.
The amount of time it took to sell a home dropped in all markets other than South Maui.
It is likely we will see the length of time it takes to sell homes on Maui trend higher until the effects of COVID-19 are fully realized.
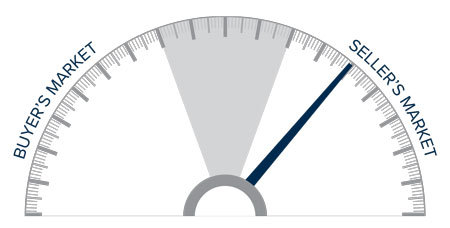
CONCLUSIONS
This speedometer reflects the state of the region’s real estate market using housing inventory, price gains, home sales, interest rates, and larger economic factors.
Given the current economic environment, I have decided to freeze the needle in place until we see a restart in the economy. Once we have resumed “normal” economic activity, there will be a period of adjustment with regard to housing. Therefore, it is appropriate to wait until later in the year to offer my opinions about any quantitative impact the pandemic will have on the housing market.
ABOUT MATTHEW GARDNER
As Chief Economist for Windermere Real Estate, Matthew Gardner is responsible for analyzing and interpreting economic data and its impact on the real estate market on both a local and national level. Matthew has over 30 years of professional experience both in the U.S. and U.K.
In addition to his day-to-day responsibilities, Matthew sits on the Washington State Governors Council of Economic Advisors; chairs the Board of Trustees at the Washington Center for Real Estate Research at the University of Washington; and is an Advisory Board Member at the Runstad Center for Real Estate Studies at the University of Washington where he also lectures in real estate economics.
The following analysis of the Big Island real estate market is provided by Windermere Real Estate Chief Economist Matthew Gardner. We hope that this information may assist you with making better-informed real estate decisions. For further information about the housing market in your area, please don’t hesitate to contact your Windermere agent.
A MESSAGE FROM MATTHEW GARDNER
Needless to say, any discussion about the U.S. economy, state economy, or housing markets in the first quarter of this year is almost meaningless given events surrounding the COVID-19 virus.
Although you will see below data regarding housing activity in the region, many markets came close to halting transactions in March and many remain in some level of paralysis. As such, drawing conclusions from the data is almost a futile effort. I would say, though, it is my belief that the national and state housing markets were in good shape before the virus hit and will be in good shape again, once we come out on the other side. In a similar fashion, I anticipate the national and regional economies will start to thaw, and that many of the jobs lost will return with relative speed. Of course, all of these statements are wholly dependent on the country seeing a peak in new infections in the relatively near future. I stand by my contention that the housing market will survive the current economic crisis and it is likely we will resume a more normalized pattern of home sales in the second half of the year.
HOME SALES
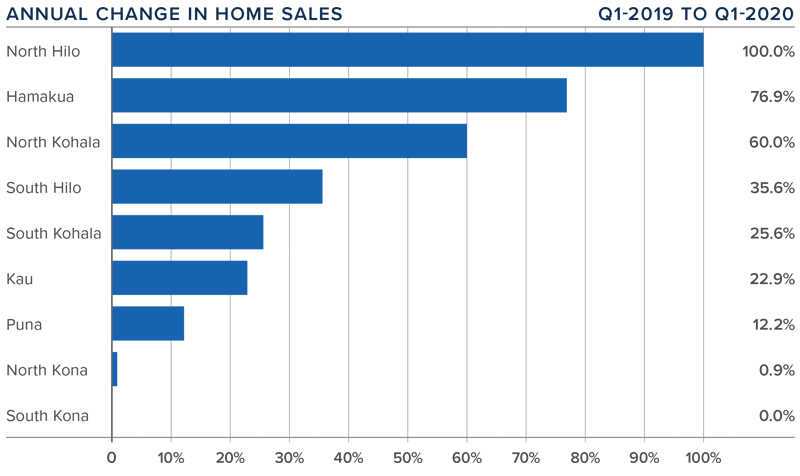
In the first quarter of 2020, 814 homes sold on the Big Island, an increase of 15.6% compared to the first quarter of 2019 but 1.2% lower than the fourth quarter of 2019.
Sales either matched year ago numbers or were higher in all markets. There was significant growth in sales in the North Hilo market. Hamakua and North Kohala markets also saw a significant increase in sales activity.
The growth in sales came as inventory levels dropped 14.3% from a year ago. The average number of homes for sale in the quarter was also down 2.9% from the fourth quarter of 2019.
It should be noted that pending home sales dropped 2.8% from the final quarter of 2019. I will be watching to see if this contraction can be attributed to COVID-19 or if it was just a normal fluctuation.
HOME PRICES
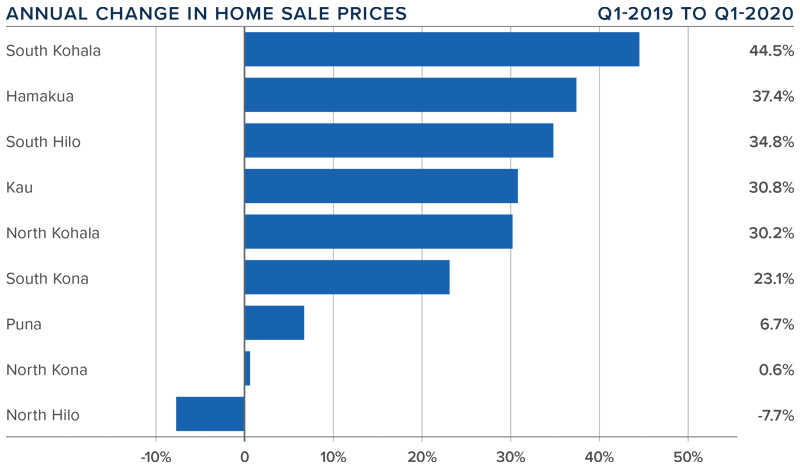
The average home price in the region rose 15% year-over-year to $620,813. When compared to the fourth quarter of 2019, prices rose an impressive 7%.
Affordability remains an issue, but low interest rates have clearly been motivating buyers. As a result, prices continue to rise.
Prices rose in all market areas other than North Hilo. Appreciation was strongest in the small South Kohala market area. All other areas except North Kona saw significant increases.
The second quarter will likely give us good data about any fallout in the housing market associated with COVID-19.
DAYS ON MARKET
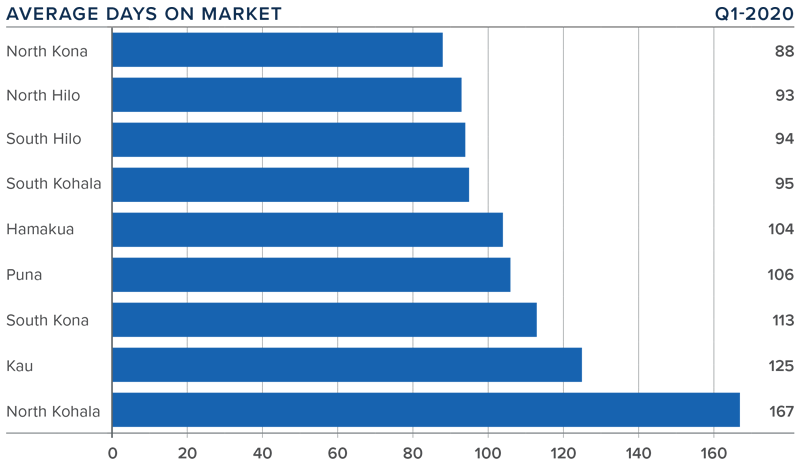
The average time it took to sell a home on the Big Island rose 28 days compared to the first quarter of 2019.
In the first quarter, it took an average of 109 days to sell a home. Homes sold fastest in North Kona and North Hilo and slowest in North Kohala.
The amount of time it took to sell a home rose in all market areas other than in South Kona and Kau, which dropped by one and 30 days respectively.
It took six days longer to sell a home in the first quarter versus the final quarter of 2019.
CONCLUSIONS
This speedometer reflects the state of the region’s real estate market using housing inventory, price gains, home sales, interest rates, and larger economic factors.
Given the current economic environment, I have decided to freeze the needle in place until we see
a restart in the economy. Once we have resumed “normal” economic activity, there will be a period of adjustment with regard to housing. Therefore, it is appropriate to wait until later in the year to offer my opinions about any quantitative impact the pandemic will have on the housing market.
ABOUT MATTHEW GARDNER
As Chief Economist for Windermere Real Estate, Matthew Gardner is responsible for analyzing and interpreting economic data and its impact on the real estate market on both a local and national level. Matthew has over 30 years of professional experience both in the U.S. and U.K.
In addition to his day-to-day responsibilities, Matthew sits on the Washington State Governors Council of Economic Advisors; chairs the Board of Trustees at the Washington Center for Real Estate Research at the University of Washington; and is an Advisory Board Member at the Runstad Center for Real Estate Studies at the University of Washington where he also lectures in real estate economics.
We are excited to introduce the Gardner Report to Park City, Utah! The following analysis of select neighborhoods in the Park City real estate market is provided by Windermere Real Estate Chief Economist Matthew Gardner. We hope that this information may assist you with making better-informed real estate decisions. For further information about the housing market in your area, please don’t hesitate to contact your Windermere agent.
A MESSAGE FROM MATTHEW GARDNER
Needless to say, any discussion about the U.S. economy, state economy, or housing markets in the first quarter of this year is almost meaningless given events surrounding the COVID-19 virus.
Although you will see below data regarding housing activity in the region, many markets came close to halting transactions in March and many remain in some level of paralysis. As such, drawing conclusions from the data is almost a futile effort. I would say, though, it is my belief that the national and state housing markets were in good shape before the virus hit and will be in good shape again, once we come out on the other side. In a similar fashion, I anticipate the national and regional economies will start to thaw, and that many of the jobs lost will return with relative speed. Of course, all of these statements are wholly dependent on the country seeing a peak in new infections in the relatively near future. I stand by my contention that the housing market will survive the current economic crisis and it is likely we will resume a more normalized pattern of home sales in the second half of the year.
HOME SALES
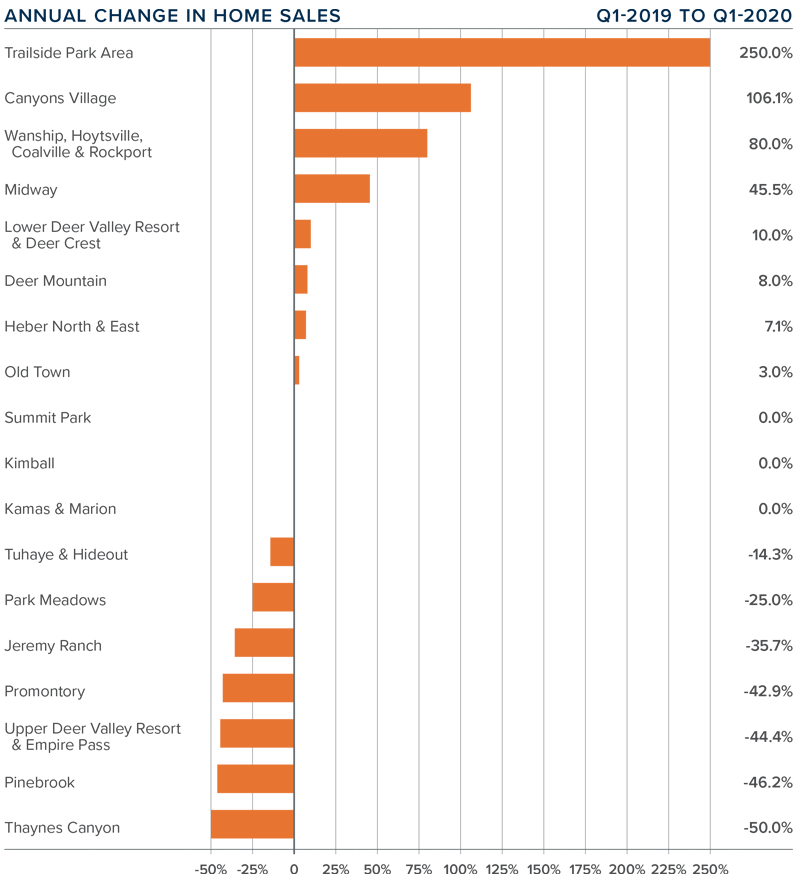
In the first quarter of 2020, 170 homes sold, an increase of 18.9% over the first quarter of 2019.
Sales were a mixed bag, with increases in eight neighborhoods, sales static in three, and dropping in seven. There was double-digit growth in sales in several areas. However, as the market areas in this report are all relatively small, significant swings in either direction are not unexpected.
The growth in sales came as inventory levels fell by a very significant 70% from a year ago. This can likely be attributed to COVID-19. Second quarter data will confirm or refute this thesis.
Pending home sales dropped 40% compared to the first quarter of 2019. Again, this is likely due to COVID-19.
HOME PRICES
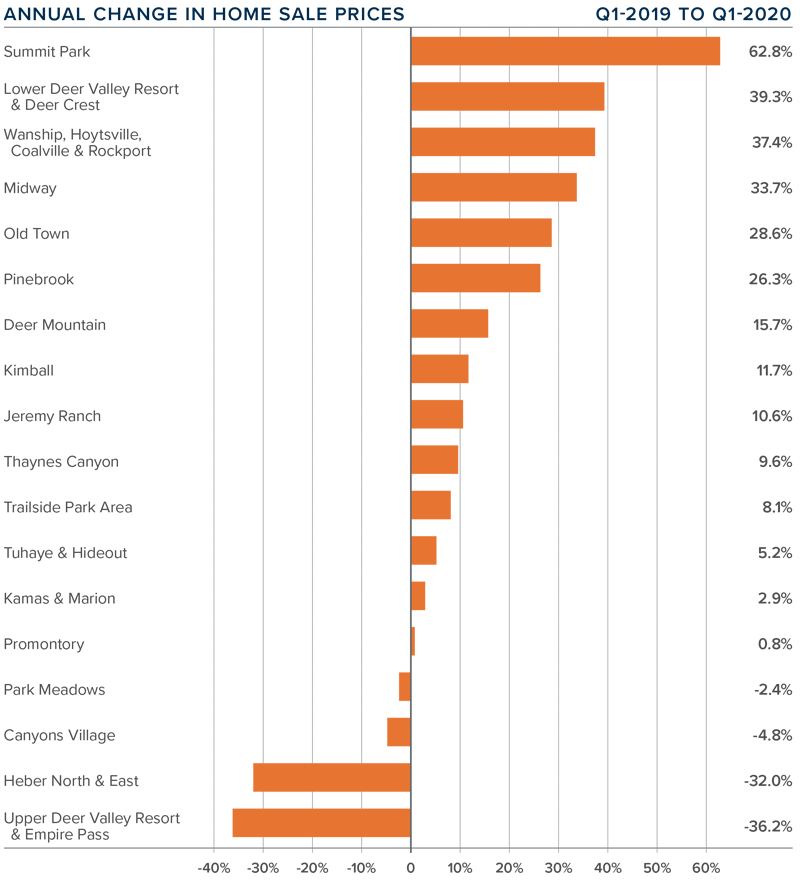
The average home price in the Park City neighborhoods contained in this report dropped 2.1% year-over-year to $1.152 million.
The most affordable neighborhoods — in terms of average sale prices — were Kimball and Kamas & Marion. The most expensive were Lower Deer Resort & Deer Crest, Promontory, and Upper Deer Resort & Empire Pass.
Although aggregate prices went down, prices still rose in a majority of the neighborhoods that this report analyzes. The Summit Park area had significant gains, and an additional eight areas had double-digit increases. On an annual basis, prices dropped in four markets, with the Upper Deer Valley area seeing the biggest declines.
As this is the first Park City Gardner Report, commentary is limited. It will be interesting to see how the market further reacts to COVID-19 and we look forward to offering analysis and perspective when we get second quarter data.
DAYS ON MARKET
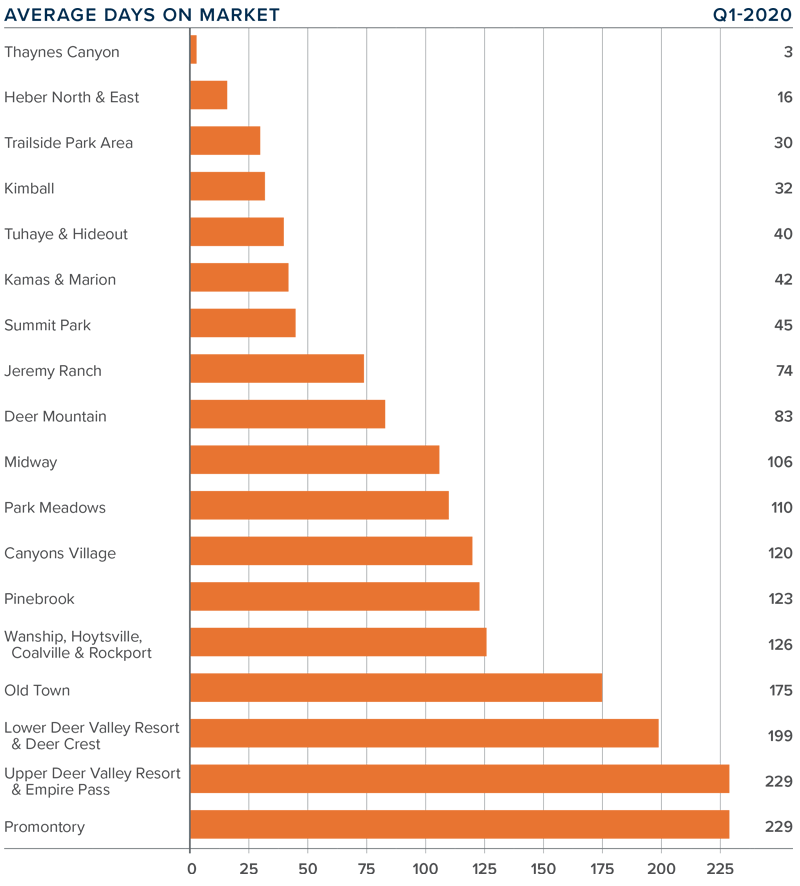
The average time it took to sell a home in the Park City area dropped 42 days compared to the first quarter of 2019.
The amount of time it took to sell a home dropped in 13 market areas and rose in 5.
In the first quarter, it took an average of 99 days to sell a home, with homes selling fastest in Thaynes Canyon and slowest in the Promontory neighborhood.
The greatest drop in market time was in the Thaynes Canyon and Heber North & East neighborhoods.
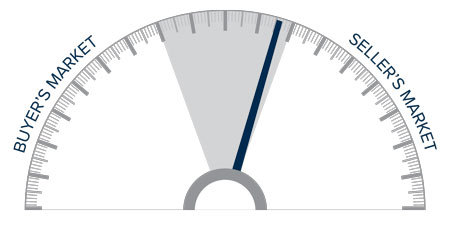
CONCLUSIONS
This speedometer reflects the state of the region’s real estate market using housing inventory, price gains, home sales, interest rates, and larger economic factors.
Given the current economic environment, I have decided to freeze the needle in place until we see a restart in the economy. Once we have resumed “normal” economic activity, there will be a period of adjustment with regard to housing. Therefore, it is appropriate to wait until later in the year to offer my opinions about any quantitative impact the pandemic will have on the housing market.
ABOUT MATTHEW GARDNER
As Chief Economist for Windermere Real Estate, Matthew Gardner is responsible for analyzing and interpreting economic data and its impact on the real estate market on both a local and national level. Matthew has over 30 years of professional experience both in the U.S. and U.K.
In addition to his day-to-day responsibilities, Matthew sits on the Washington State Governors Council of Economic Advisors; chairs the Board of Trustees at the Washington Center for Real Estate Research at the University of Washington; and is an Advisory Board Member at the Runstad Center for Real Estate Studies at the University of Washington where he also lectures in real estate economics.
The following analysis of select counties of the Utah real estate market is provided by Windermere Real Estate Chief Economist Matthew Gardner. We hope that this information may assist you with making better-informed real estate decisions. For further information about the housing market in your area, please don’t hesitate to contact me.
A MESSAGE FROM MATTHEW GARDNER
Needless to say, any discussion about the U.S. economy, state economy, or housing markets in the first quarter of this year is almost meaningless given events surrounding the COVID-19 virus.
Although you will see below data regarding housing activity in the region, many markets came close to halting transactions in March and many remain in some level of paralysis. As such, drawing conclusions from the data is almost a futile effort. I would say, though, it is my belief that the national and state housing markets were in good shape before the virus hit and will be in good shape again, once we come out on the other side. In a similar fashion, I anticipate the national and regional economies will start to thaw, and that many of the jobs lost will return with relative speed. Of course, all of these statements are wholly dependent on the country seeing a peak in new infections in the relatively near future. I stand by my contention that the housing market will survive the current economic crisis and it is likely we will resume a more normalized pattern of home sales in the second half of the year.
HOME SALES
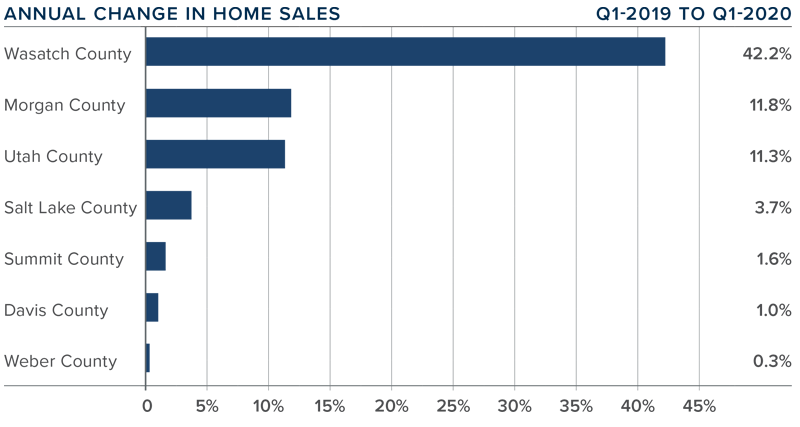
In the first quarter of 2020, 6,996 homes sold, which was a solid 5.1% increase compared to the same period in 2019. Sales were down 20.2% compared to the fourth quarter of 2019.
Total sales activity rose in all counties covered by this report. Year-over-year sales rose by double digits in three counties, with impressive increases in the relatively small Wasatch County.
The number of homes for sale in the first quarter was down by 24.2% compared to the same period a year ago and was 27.2% lower than the fourth quarter of 2019. Clearly COVID-19 has had an impact on prospective home sellers.
Pending sales in the first quarter were up 2.6% compared to the fourth quarter of 2019, suggesting that buyers are still in the market even though listing inventories are very tight.
HOME PRICES
The average home price in the region continued to rise in the first quarter, with a year-over-year increase of 10.4% to an average of $404,316. Prices were a modest 0.3% higher than in the fourth quarter of 2019.
All counties contained in this report saw price increases compared to the same period a year ago.
Appreciation was strongest in Wasatch County where prices were up 37.9%. However, this is a small area and can be subject to significant swings in sale prices.
The takeaway here is that home prices continued to appreciate at considerable rates during the quarter. The big question will be whether this continues as we move through the economic slowdown created by COVID-19.
DAYS ON MARKET
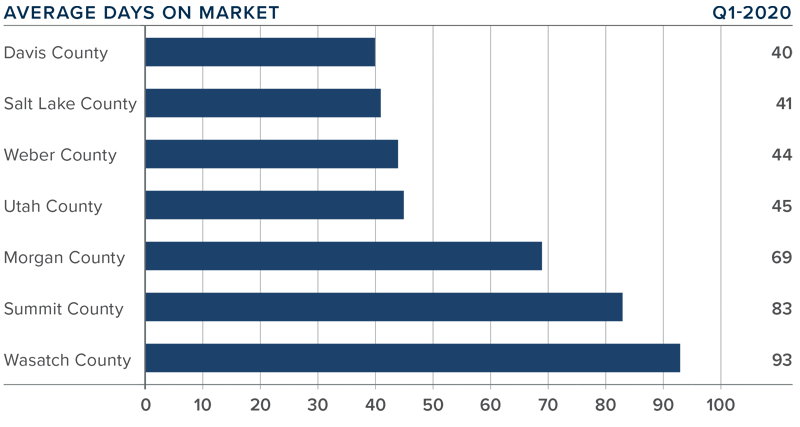
The average number of days it took to sell a home in the counties covered by this report dropped five days compared to the first quarter of 2019.
During the first quarter of the year, it took an average of 59 days to sell a home in the region, up by 2 days when compared to the fourth quarter of 2019.
Homes sold fastest in Davis and Salt Lake counties, and slowest in Summit and Wasatch counties. That said, it took 23 fewer days to sell a home in Summit County than it did a year ago.
Market demand appeared to remain quite robust during the first quarter of this year.
CONCLUSIONS
This speedometer reflects the state of the region’s real estate market using housing inventory, price gains, home sales, interest rates, and larger economic factors.
Given the current economic environment, I have decided to freeze the needle in place until we see
a restart in the economy. Once we have resumed “normal” economic activity, there will be a period of adjustment with regard to housing. Therefore, it is appropriate to wait until later in the year to offer my opinions about any quantitative impact the pandemic will have on the housing market.
ABOUT MATTHEW GARDNER
As Chief Economist for Windermere Real Estate, Matthew Gardner is responsible for analyzing and interpreting economic data and its impact on the real estate market on both a local and national level. Matthew has over 30 years of professional experience both in the U.S. and U.K.
In addition to his day-to-day responsibilities, Matthew sits on the Washington State Governors Council of Economic Advisors; chairs the Board of Trustees at the Washington Center for Real Estate Research at the University of Washington; and is an Advisory Board Member at the Runstad Center for Real Estate Studies at the University of Washington where he also lectures in real estate economics.
The following analysis of select Montana real estate markets is provided by Windermere Real Estate Chief Economist Matthew Gardner. We hope that this information may assist you with making better-informed real estate decisions. For further information about the housing market in your area, please don’t hesitate to contact your Windermere agent.
A MESSAGE FROM MATTHEW GARDNER
Needless to say, any discussion about the U.S. economy, state economy, or housing markets in the first quarter of this year is almost meaningless given events surrounding the COVID-19 virus.
Although you will see below data regarding housing activity in the region, many markets came close to halting transactions in March and many remain in some level of paralysis. As such, drawing conclusions from the data is almost a futile effort. I would say, though, it is my belief that the national and state housing markets were in good shape before the virus hit and will be in good shape again, once we come out on the other side. In a similar fashion, I anticipate the national and regional economies will start to thaw, and that many of the jobs lost will return with relative speed. Of course, all of these statements are wholly dependent on the country seeing a peak in new infections in the relatively near future. I stand by my contention that the housing market will survive the current economic crisis and it is likely we will resume a more normalized pattern of home sales in the second half of the year.
HOME SALES
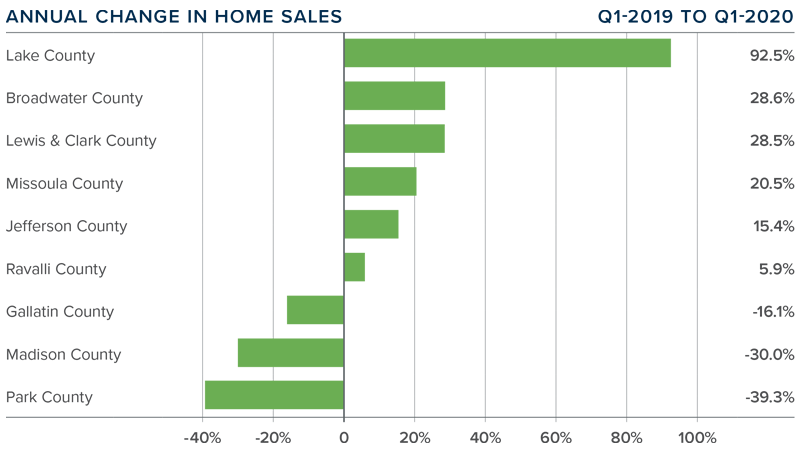
In the first quarter of 2020, 573 homes sold, an increase of 6.2% over the same period in 2019.
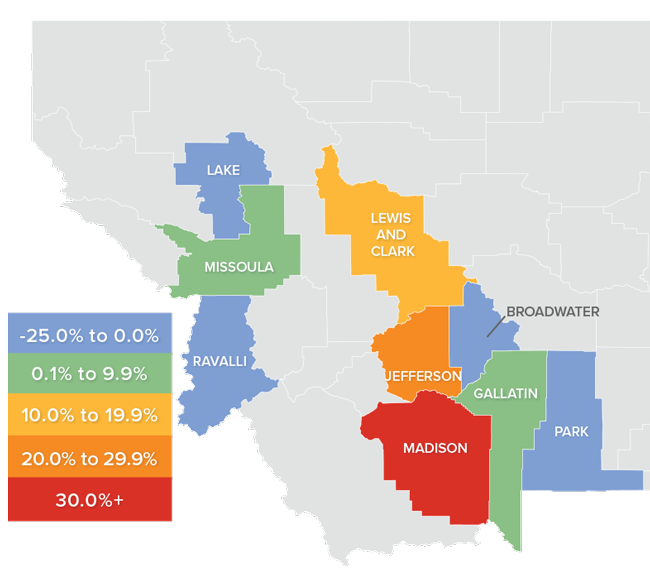
Total sales activity was a mixed bag, with increases in six counties and declines in three. The largest annual increase was in very small Lake County where sales were up by more than 92%. The largest drop in sales was in the also small Park County.
The number of homes for sale remains well below levels I would like to see, with an average of 1,172 listings in the first quarter within the counties contained in this report.
Low inventory levels continue to hold back home sales. The COVID-19 situation will likely cause sales to contract in the near-term; however, when housing activity starts to normalize again, I believe the market will still favor sellers given the low number of homes for sale.
HOME PRICES
Year-over-year prices were essentially static (+0.4%) and averaged $371,555. That said, prices were up 7.5% compared to the final quarter of 2019.
Average prices dropped in four counties, but this doesn’t concern me because they are all very small markets which makes them prone to extreme price swings.
Even though sale prices in the region did not rise appreciably, there were several counties that experienced significant price growth.
The takeaway from this data is that the market saw price growth stall. Given the effects of COVID-19, it is difficult to predict whether or not this will continue.
DAYS ON MARKET
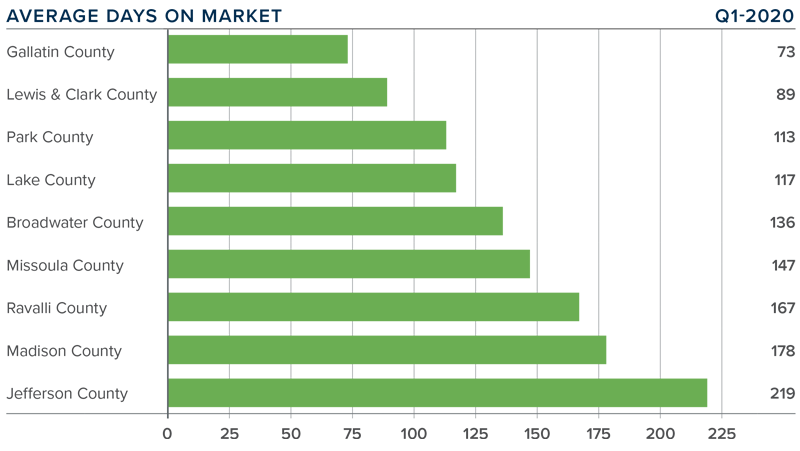
The average number of days it took to sell a home rose 16 days compared to the first quarter of 2019.
During the first quarter of 2020, it took an average of 138 days to sell a home in the region.
Homes sold fastest in Gallatin County and slowest in Jefferson County. Two counties — Lake and Lewis & Clark — saw days on market drop compared to the same period a year ago.
The takeaway here is that market time rose modestly, and this is very likely to continue in the second quarter until the effects of the COVID-19 pandemic are behind us.
CONCLUSIONS
This speedometer reflects the state of the region’s real estate market using housing inventory, price gains, home sales, interest rates, and larger economic factors.
Given the current economic environment, I have decided to freeze the needle in place until we see a restart in the economy. Once we have resumed “normal” economic activity, there will be a period of adjustment with regard to housing. Therefore, it is appropriate to wait until later in the year to offer my opinions about any quantitative impact the pandemic will have on the housing market.
ABOUT MATTHEW GARDNER
As Chief Economist for Windermere Real Estate, Matthew Gardner is responsible for analyzing and interpreting economic data and its impact on the real estate market on both a local and national level. Matthew has over 30 years of professional experience both in the U.S. and U.K.
In addition to his day-to-day responsibilities, Matthew sits on the Washington State Governors Council of Economic Advisors; chairs the Board of Trustees at the Washington Center for Real Estate Research at the University of Washington; and is an Advisory Board Member at the Runstad Center for Real Estate Studies at the University of Washington where he also lectures in real estate economics.
Every year for the past 35 years, Windermere Real Estate has closed its doors on the first Friday in June for its annual Community Service Day so that our 9,000-member team can head into our local neighborhoods and volunteer. This year, in light of COVID-19, we have made the decision to replace Community Service Day with an immediate fundraising challenge for our offices to help food banks whose operations, and the people they serve, have been heavily impacted by the virus.
Between now and Tuesday May 5, we are matching every dollar, up to $250,000, that our offices raise, with the goal of donating $500,000 to food banks in the communities across the Western U.S. where we operate. The public is also invited to participate by donating to the Windermere Foundation here. All donations will be directed to food banks with the greatest need.
Those who struggle with poverty and depend on food programs are having difficulty meeting their basic needs. Our mission is to help local food banks in our communities keep their shelves stocked and keep food on the tables of those families.
Due to COVID-19, food bank representatives expect the number of people they normally serve to double. The increased consumer demand on grocery stores has slowed the pipeline of food bank donations, which are crucial to their ability to serve their communities. With these complicating factors, every food bank has the same answer when it comes to their greatest need: dollars.
Neighbors in Need is the latest example of the Windermere family coming together in support of our local communities during the COVID-19 epidemic. The positive impact we have seen across our footprint thus far gives us confidence in our ability to meet our total donation goal of $500,000. If you would like to help, you can donate here:

 Facebook
 X
X
 Pinterest
 Copy Link


 This speedometer reflects the state of the region’s real estate market using housing inventory, price gains, home sales, interest rates, and larger economic factors.
 As Chief Economist for Windermere Real Estate, Matthew Gardner is responsible for analyzing and interpreting economic data and its impact on the real estate market on both a local and national level. Matthew has over 30 years of professional experience both in the U.S. and U.K.
 The average home price in the region rose 2.6% year-over-year to $880,006 but was down 5.8% compared to the final quarter of 2019.
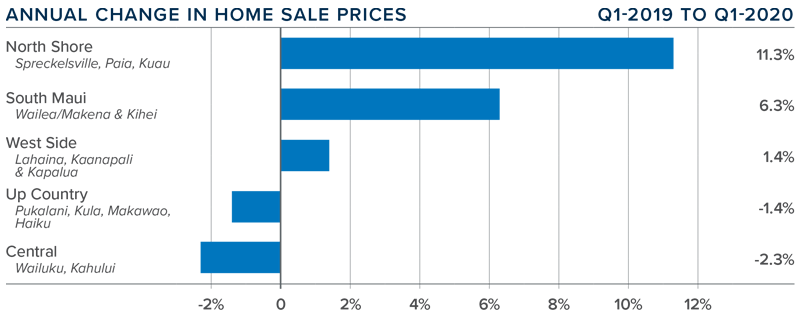
 This speedometer reflects the state of the region’s real estate market using housing inventory, price gains, home sales, interest rates, and larger economic factors.
 This speedometer reflects the state of the region’s real estate market using housing inventory, price gains, home sales, interest rates, and larger economic factors.
 This speedometer reflects the state of the region’s real estate market using housing inventory, price gains, home sales, interest rates, and larger economic factors.
 As Chief Economist for Windermere Real Estate, Matthew Gardner is responsible for analyzing and interpreting economic data and its impact on the real estate market on both a local and national level. Matthew has over 30 years of professional experience both in the U.S. and U.K.
 The average home price in the region continued to rise in the first quarter, with a year-over-year increase of 10.4% to an average of $404,316. Prices were a modest 0.3% higher than in the fourth quarter of 2019.
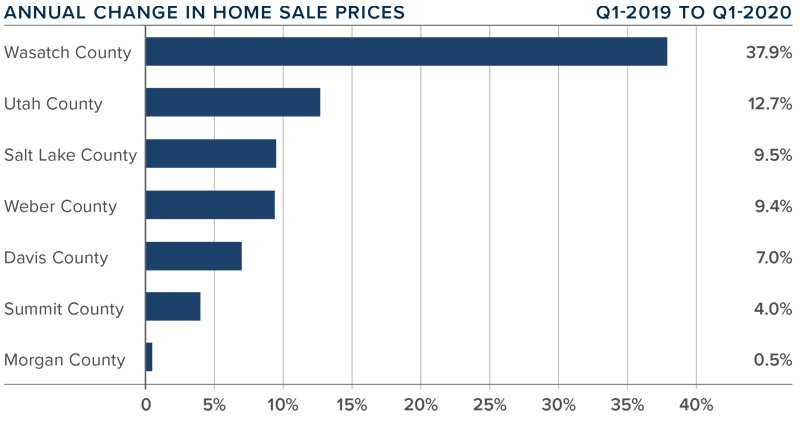
 This speedometer reflects the state of the region’s real estate market using housing inventory, price gains, home sales, interest rates, and larger economic factors.
 Year-over-year prices were essentially static (+0.4%) and averaged $371,555. That said, prices were up 7.5% compared to the final quarter of 2019.
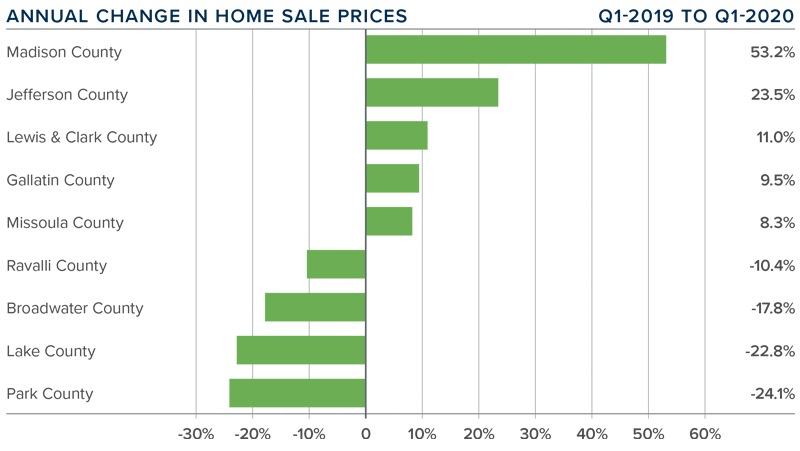
 This speedometer reflects the state of the region’s real estate market using housing inventory, price gains, home sales, interest rates, and larger economic factors.

")


