

The following analysis of select counties of the Central Washington real estate market is provided by Windermere Real Estate. We hope that this information may assist you with making better-informed real estate decisions. For further information about the housing market in your area, please don’t hesitate to contact your Windermere Real Estate agent.
Regional Economic Overview
Central Washington job growth ground to a halt, adding only 762 jobs since the third quarter of 2022, which represents a growth rate of .4%. Although Yakima and Douglas counties added jobs (1,900 and 159, respectively), this was offset by employment levels falling in the other three counties.
The seasonally adjusted unemployment rate in Central Washington was 4.9% in the third quarter, matching the level during the same period of 2022. The lowest unemployment rate was in Chelan County at 3.9%. The region’s highest jobless rate was in Kittitas County, where 5.5% of the labor force was without work.
Central Washington Home Sales
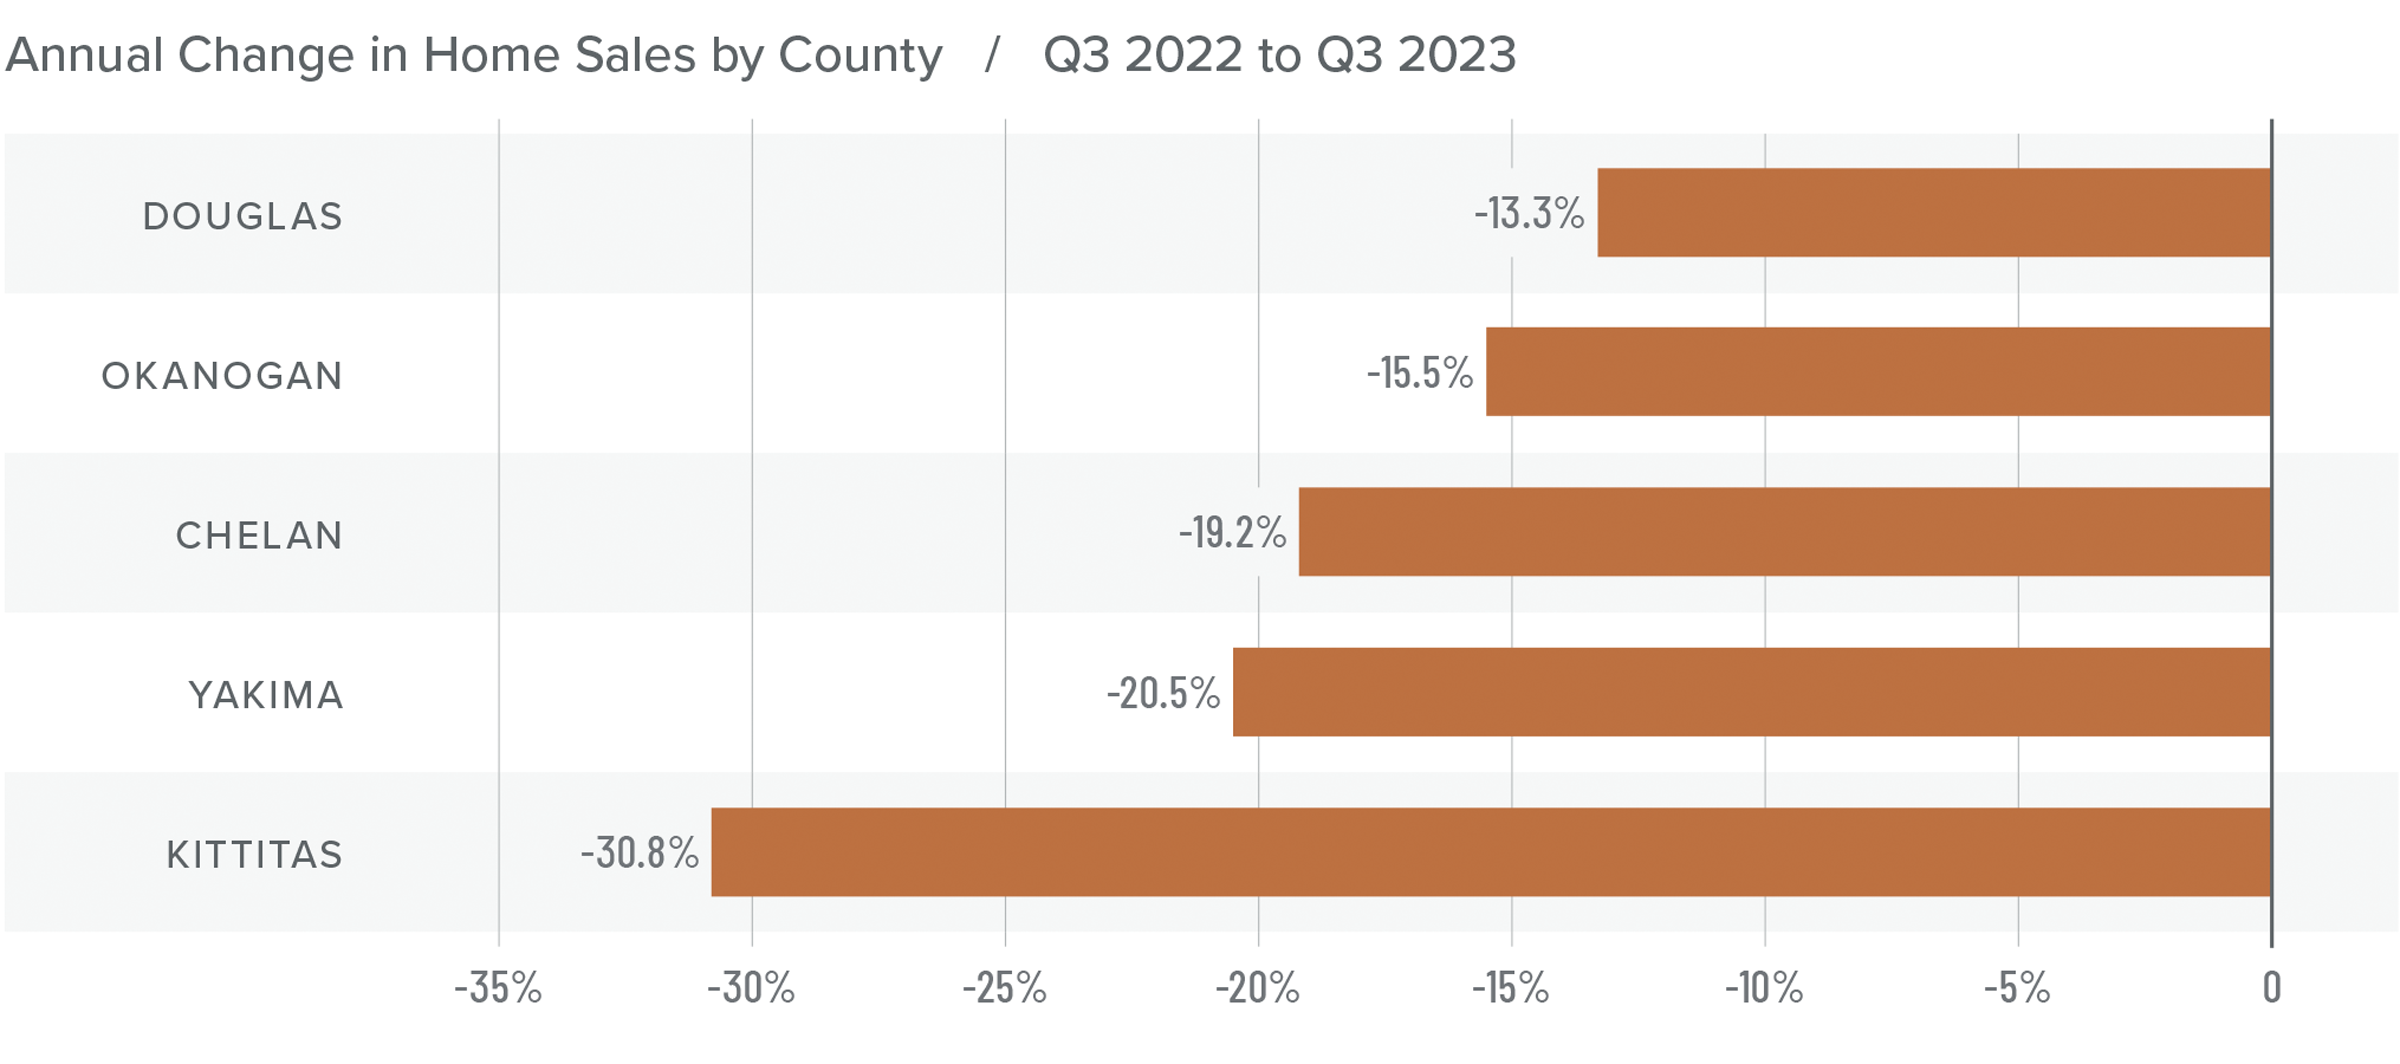
❱ There were 1,131 home sales in Central Washington in the third quarter of 2023, representing a decline of 20.9% from the same quarter in 2022. Sales were 11.1% higher than in the second quarter of this year.
❱ Year over year, sales fell significantly across the board. However, there were solid increases in all counties compared to the second quarter of this year.
❱ Pending sales, an indicator of future closings, were flat compared to the previous quarter, suggesting that market momentum may take a pause in the final quarter of 2023.
❱ Inventory levels were down 17.7% from the second quarter. The market remains remarkably tight, and I do not anticipate any improvement through the end of the year.
Central Washington Home Prices
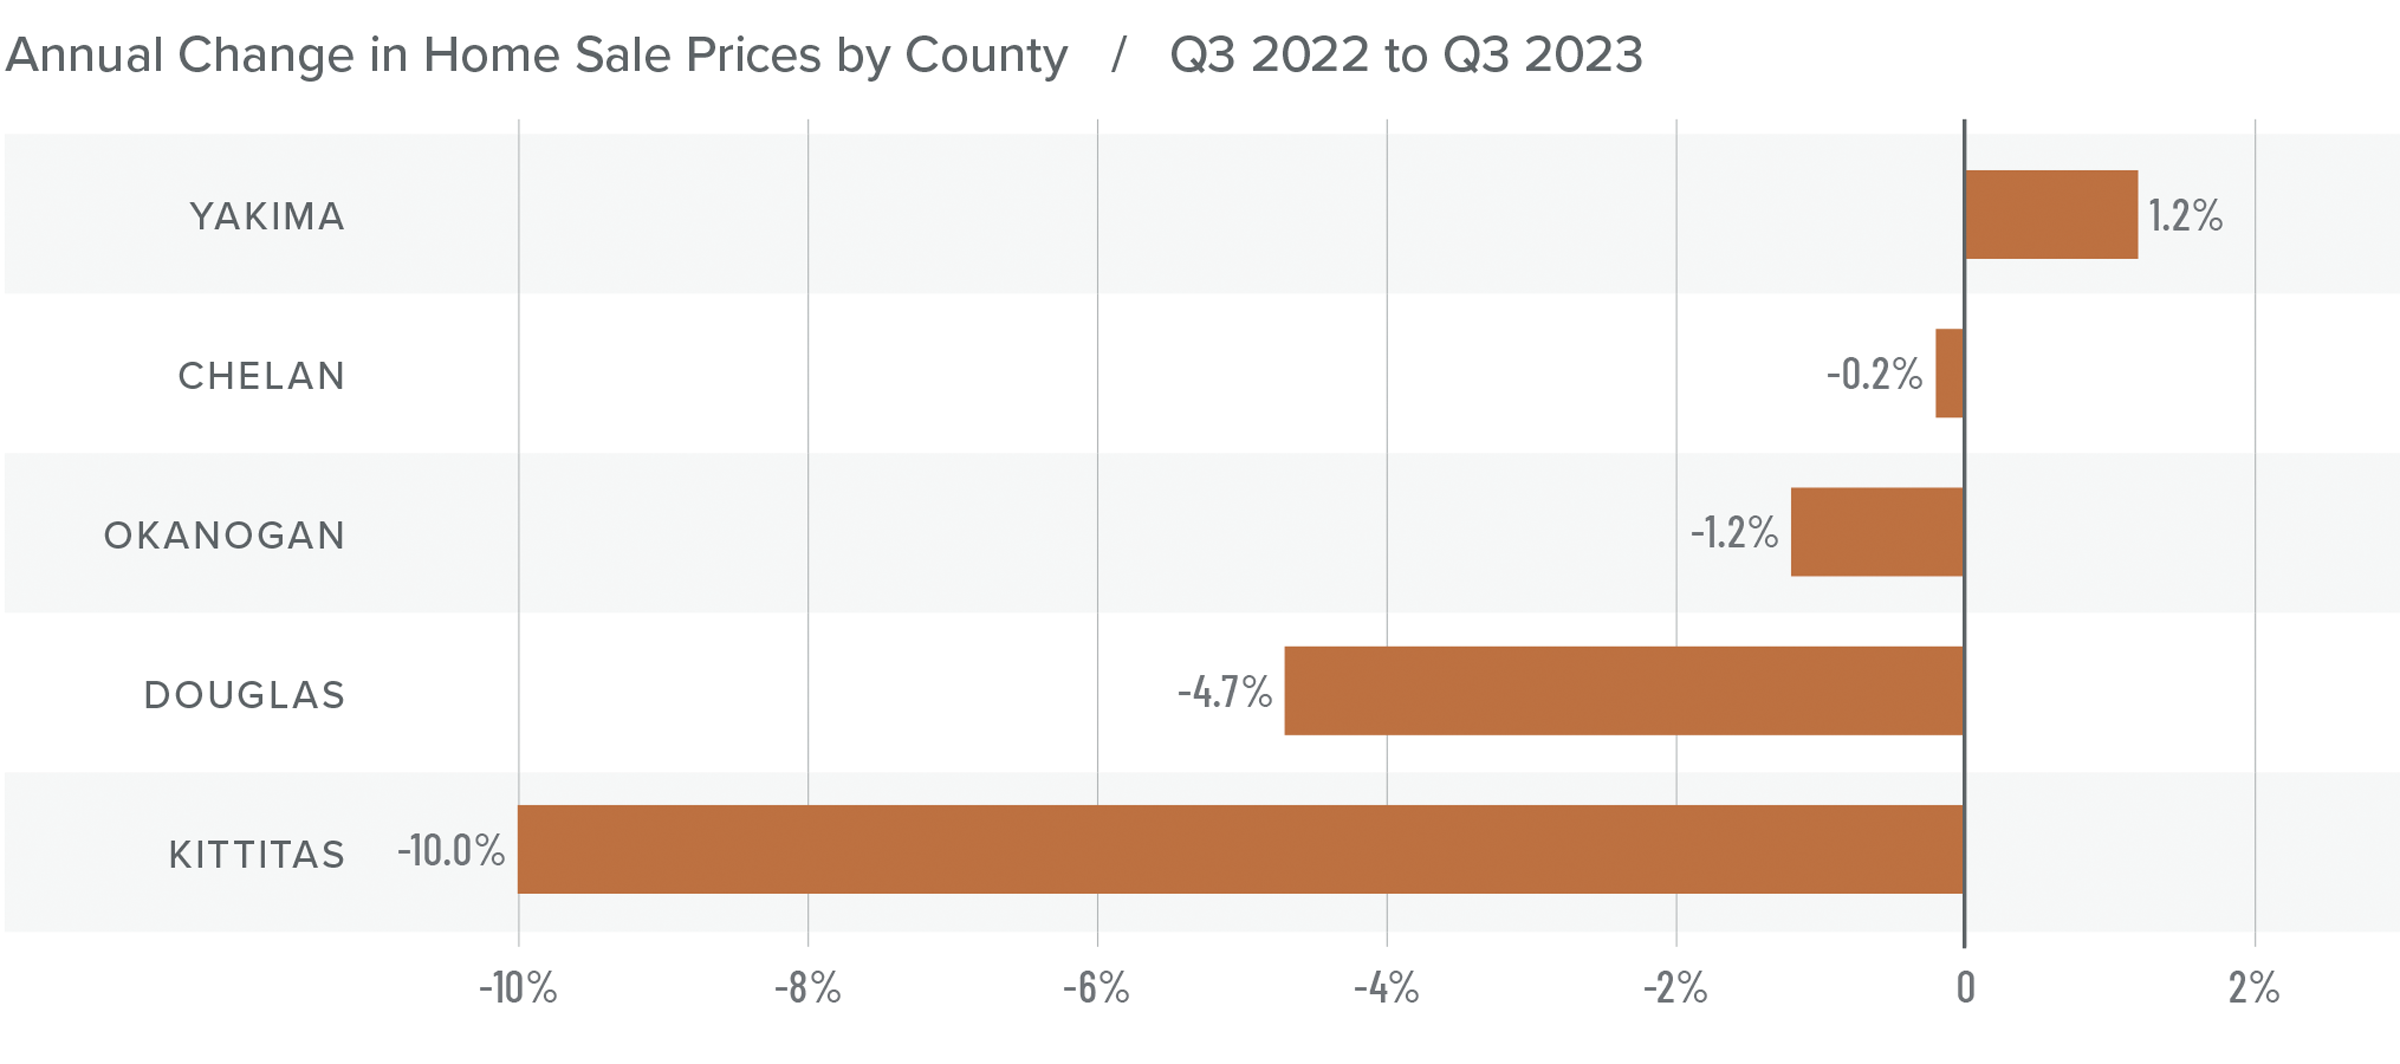
❱ The average home price in Central Washington fell 3.1% year over year to $500,399. Prices were 4.6% higher than in the second quarter of this year.
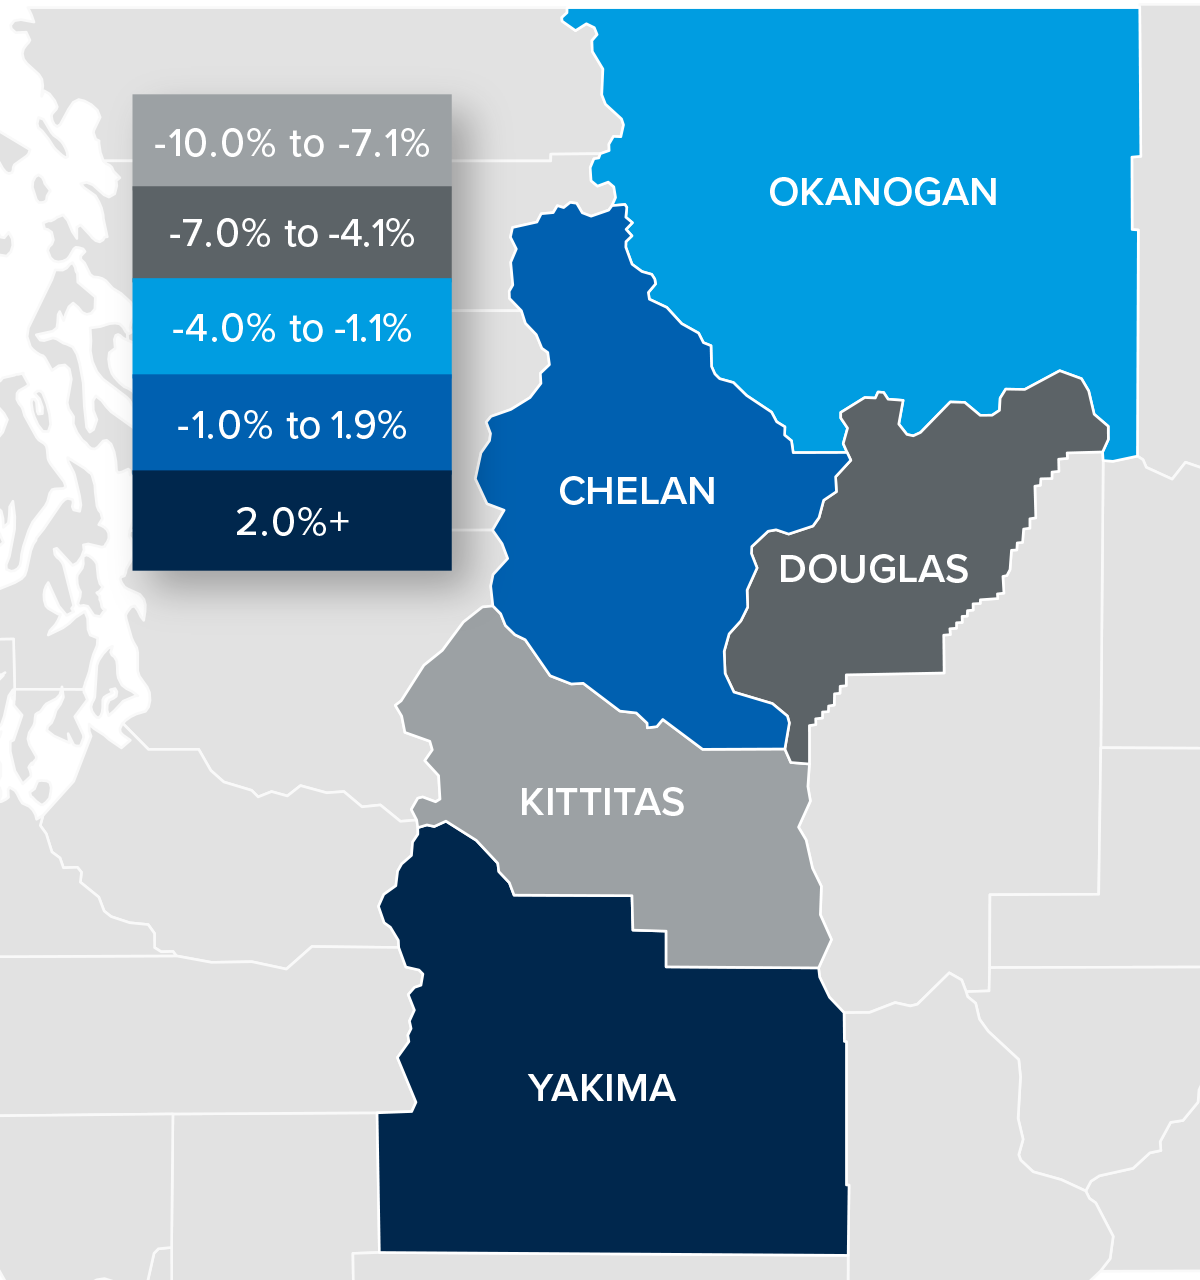
❱ Compared to the third quarter of 2022, prices fell in every county except Yakima. Compared to the second quarter of this year, prices rose in Okanogan (+1.9%), Yakima (+4%), and Chelan (+13%) counties. Prices fell modestly in Douglas and Kittitas counties, where they were 1.6% and 2.8% lower, respectively.
❱ Median list prices rose in Yakima and Douglas counties but fell in the rest of the markets compared to the second quarter of the year. It seems that sellers may be starting to respond to the far higher mortgage rates that buyers are facing.
❱ Inventory levels remain remarkably low, which is supporting home values. But the market is starting to be impacted by the highest mortgage rates we’ve seen in over two decades. This means market conditions are apt to be somewhat muted during the fall and winter months.
Mortgage Rates
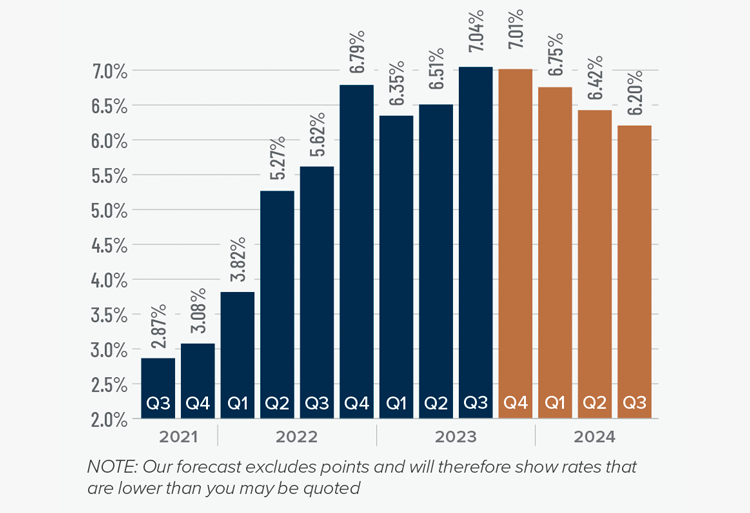
Mortgage rates continued trending higher in the third quarter of 2023 and are now at levels we have not seen since the fall of 2000. Mortgage rates are tied to the interest rate (yield) on 10-year treasuries, and they move in the opposite direction of the economy. Unfortunately for mortgage rates, the economy remains relatively buoyant, and though inflation is down significantly from its high, it is still elevated. These major factors and many minor ones are pushing Treasury yields higher, which is pushing mortgage rates up. Given the current position of the Federal Reserve, which intends to keep rates “higher for longer,” it is unlikely that home buyers will get much reprieve when it comes to borrowing costs any time soon.
With such a persistently positive economy, I have had to revise my forecast yet again. I now believe rates will hold at current levels before starting to trend down in the spring of next year.
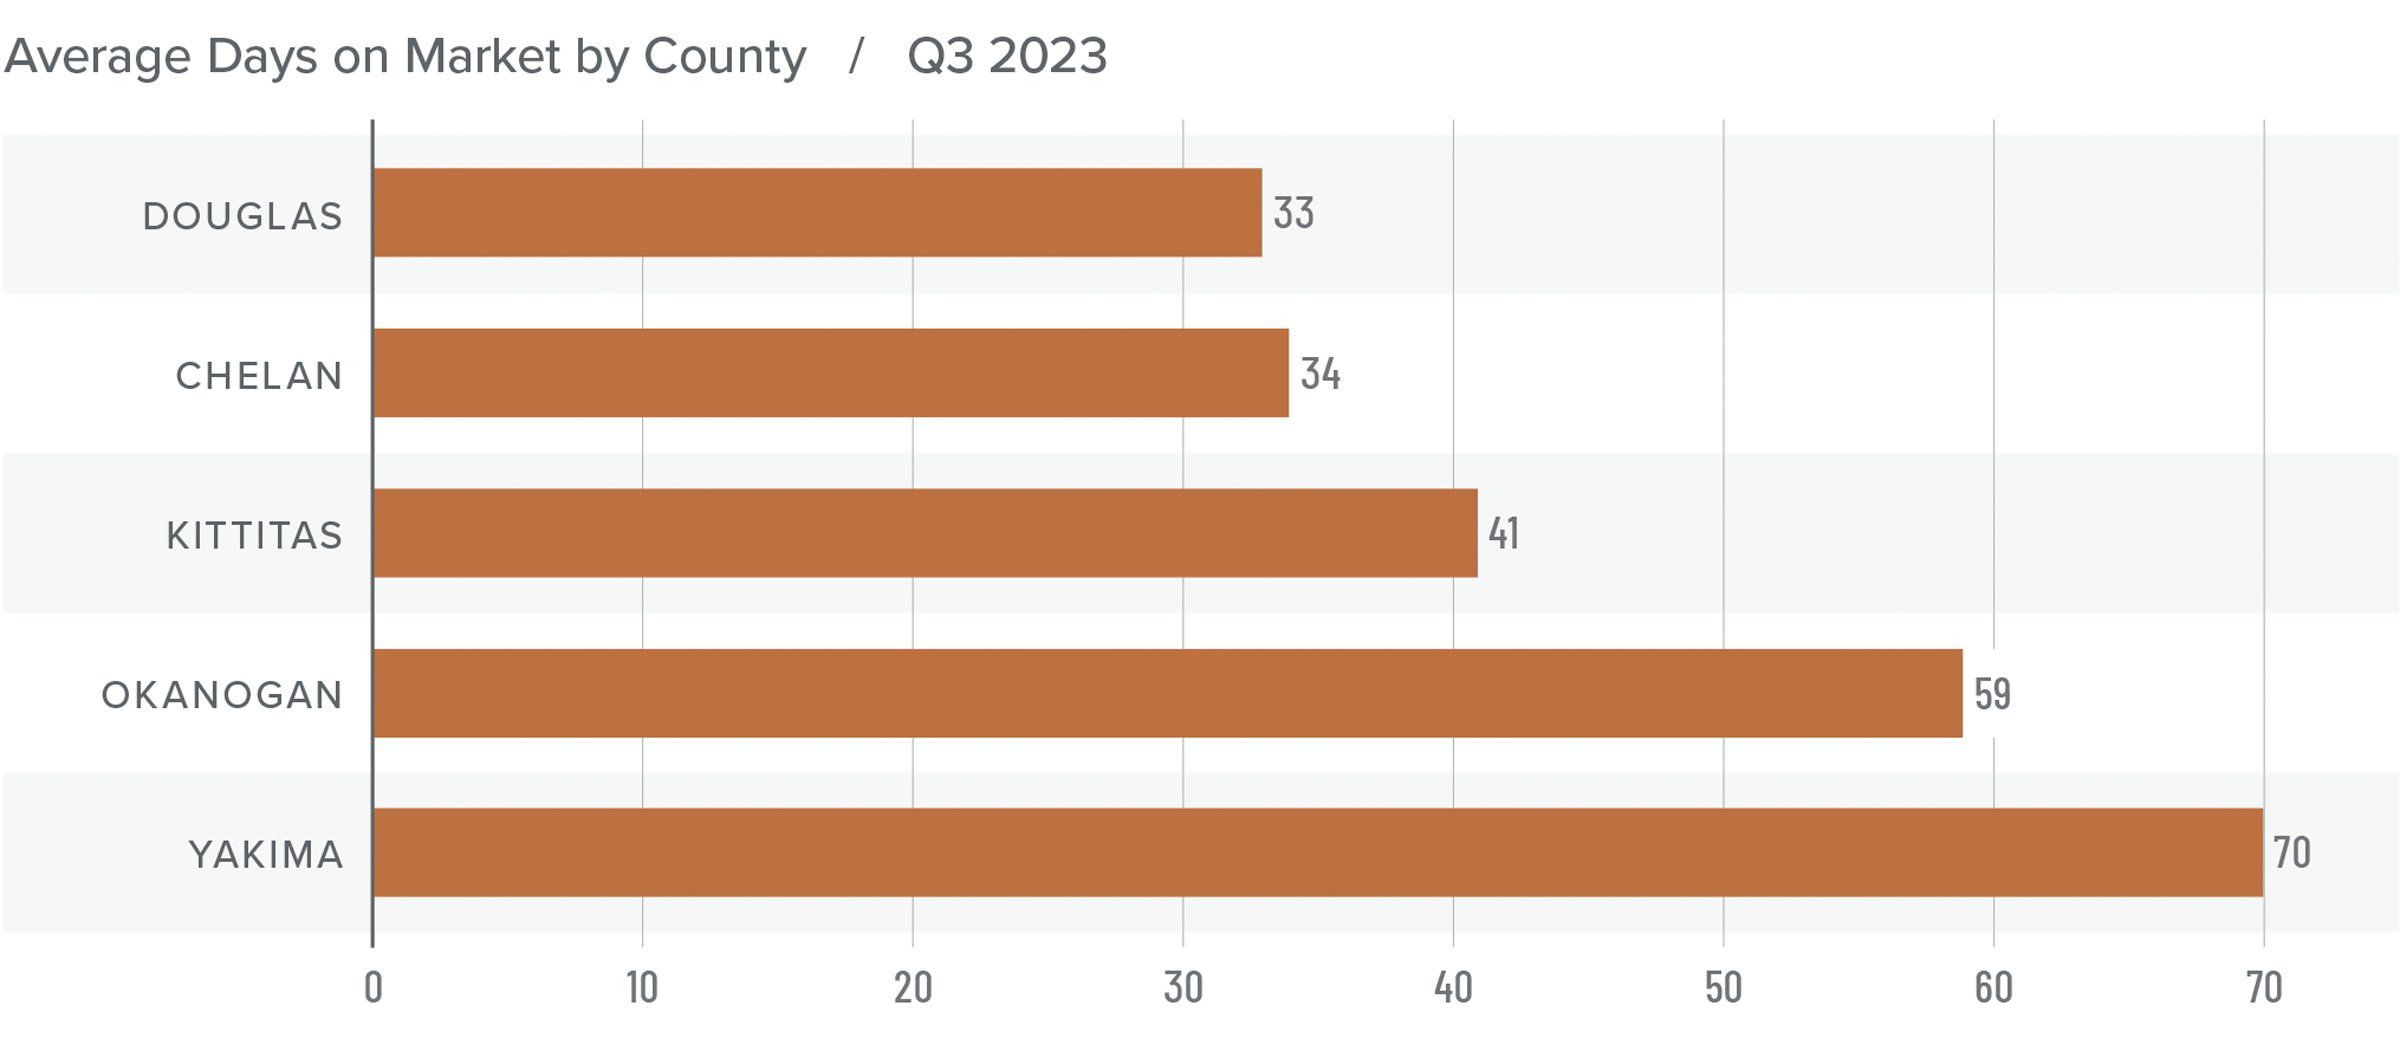
Central Washington Days on Market
❱ The average time it took to sell a home in Central Washington in the third quarter of 2023 was 47 days.
❱ Average market time rose in all counties year over year, but fell in every county other than Kittitas compared to the second quarter of 2023.
❱ It took ten more days to sell a home in Central Washington than it did during the third quarter of 2022.
❱ On average, it took six fewer days to sell a home in the third quarter of 2023 than it did in the second.
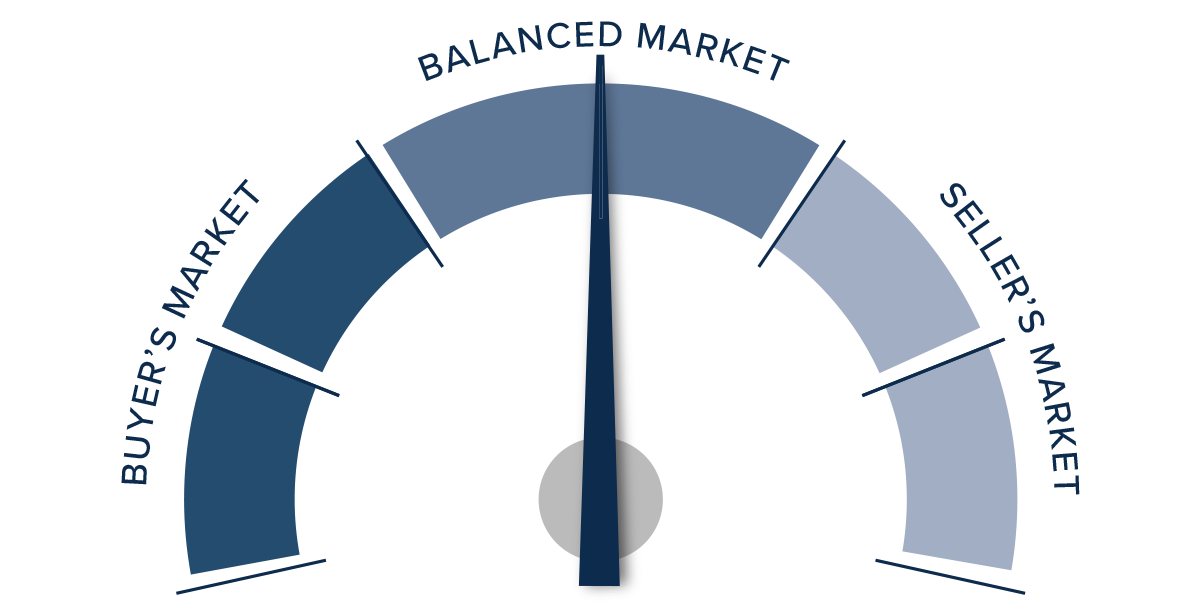
Conclusions
This speedometer reflects the state of the region’s real estate market using housing inventory, price gains, home sales, interest rates, and larger economic factors.
Listing activity declined across the region, but this was due to a major drop in the number of homes for sale in Yakima County. All other areas saw inventory levels rise. Furthermore, while list prices were up 16% from the second quarter on a regional level, they were modestly lower in Okanogan, Chelan, and Kittitas counties.
In all, this makes for a somewhat confusing market where it’s unclear whether buyers or sellers have the upper hand.
Far higher mortgage rates combined with declining affordability may have factored into sellers lowering their asking prices in some counties. This should favor home buyers, but low inventory levels give sellers a bit of an advantage. Ultimately, the market is currently lacking direction. Therefore, the needle swings back toward the middle.

")


")


