
 Facebook
 X
X
 Pinterest
 Copy Link

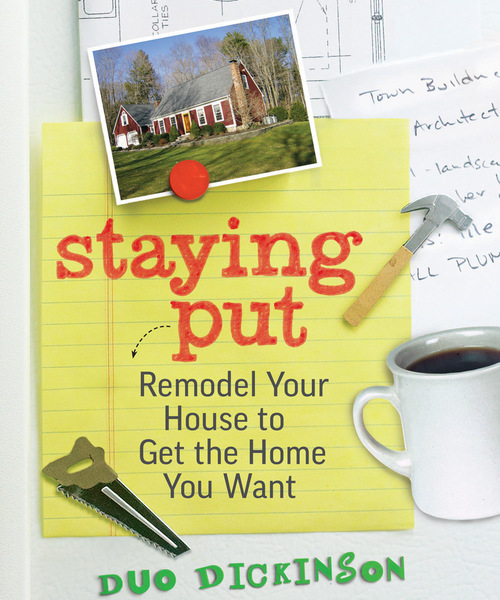
In "Staying Put," architect and writer Duo Dickinson has assembled a terrific and practical guide to help us make real improvements to our homes. Dickinson, an advocate of well-designed and affordable homes for all, has specialized in residential design for more than three decades.
This is not your typical architect's book about design. There's no obscure language nor design-for-design's-sake ideas. It is a practical, down-to-earth guide that walks anyone through the rational process of how to remodel your house to get the home you want, from how to think about your house and overcoming hurdles to a list of "Duo's Do's and Don'ts" for the homeowner. Along the way, there's plenty of nice before-and-after photos to help explain the points. Do read the book. You'll be glad you did.
The Taunton Press Inc, original photo on Houzz
The cover says it all. The ubiquitous photo of a gorgeous, award-winning home that's beyond most of us is replaced with images of a saw, cup of morning joe and a to-do list.
Are you staying put yourself? Read on for 8 of Dickinson's suggestions.
Mick Hales, original photo on Houzz
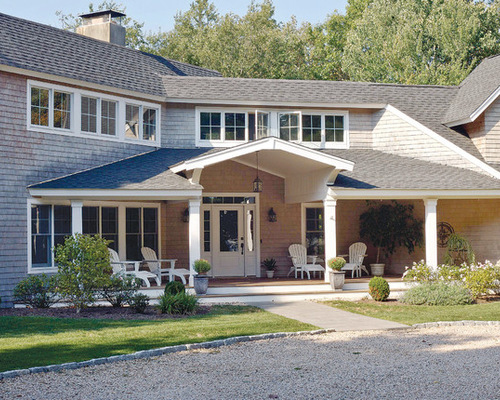
Consider the compass points. The tips and illustrated examples are wonderfully straightforward. For example, we see a house that gets overheated, the siding degrades and the front door bakes in the sun because it all faces south.
Dickinson's common-sense advice: Rework the front of the house with a new wide porch that shades the front door and some smaller, yet well-sized windows to create a lot more curb appeal while reducing maintenance and energy consumption. It's a triple win: more beauty and comfort with less cost.
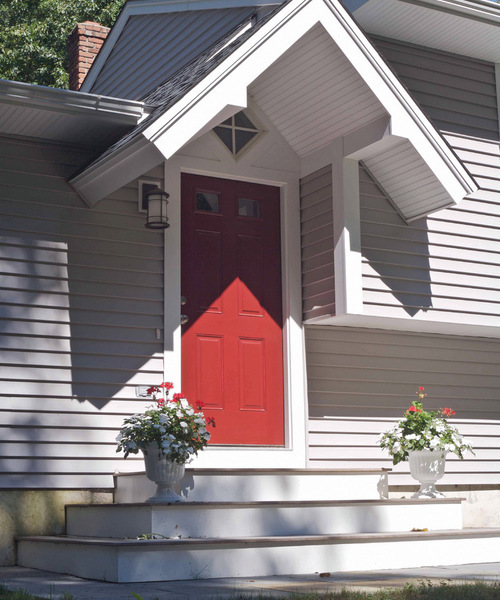
Avoid gutters. Statements such as "gutters and leaders are devout to be avoided" may sound like heresy to many but certainly are the truth. Proving his point, Dickinson illustrates how a properly-built roof overhang can shed all the water it must without the complications, such as ice dams, caused by gutters.
Embrace small moves. Dickinson provides a wealth of simple solutions illustrated with before-and-after photos. He shows how to use small moves for big dividends, such as taking out a wall between a kitchen and a hallway to make room for more kitchen storage.
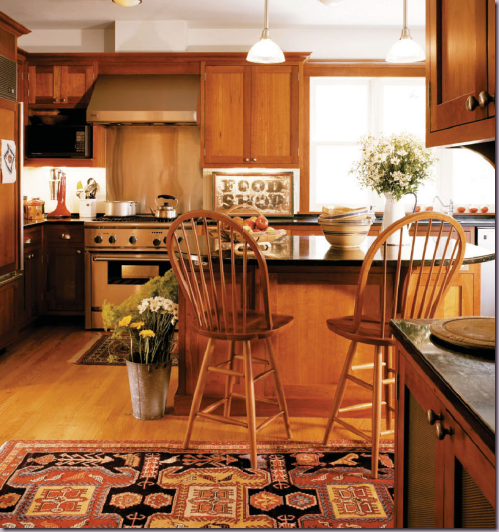
Mick Hales, original photo on Houzz
Enhance curb appeal. The book offers solutions to common problems with a particular style, such as how to improve and enhance an entrance into a split-level home.
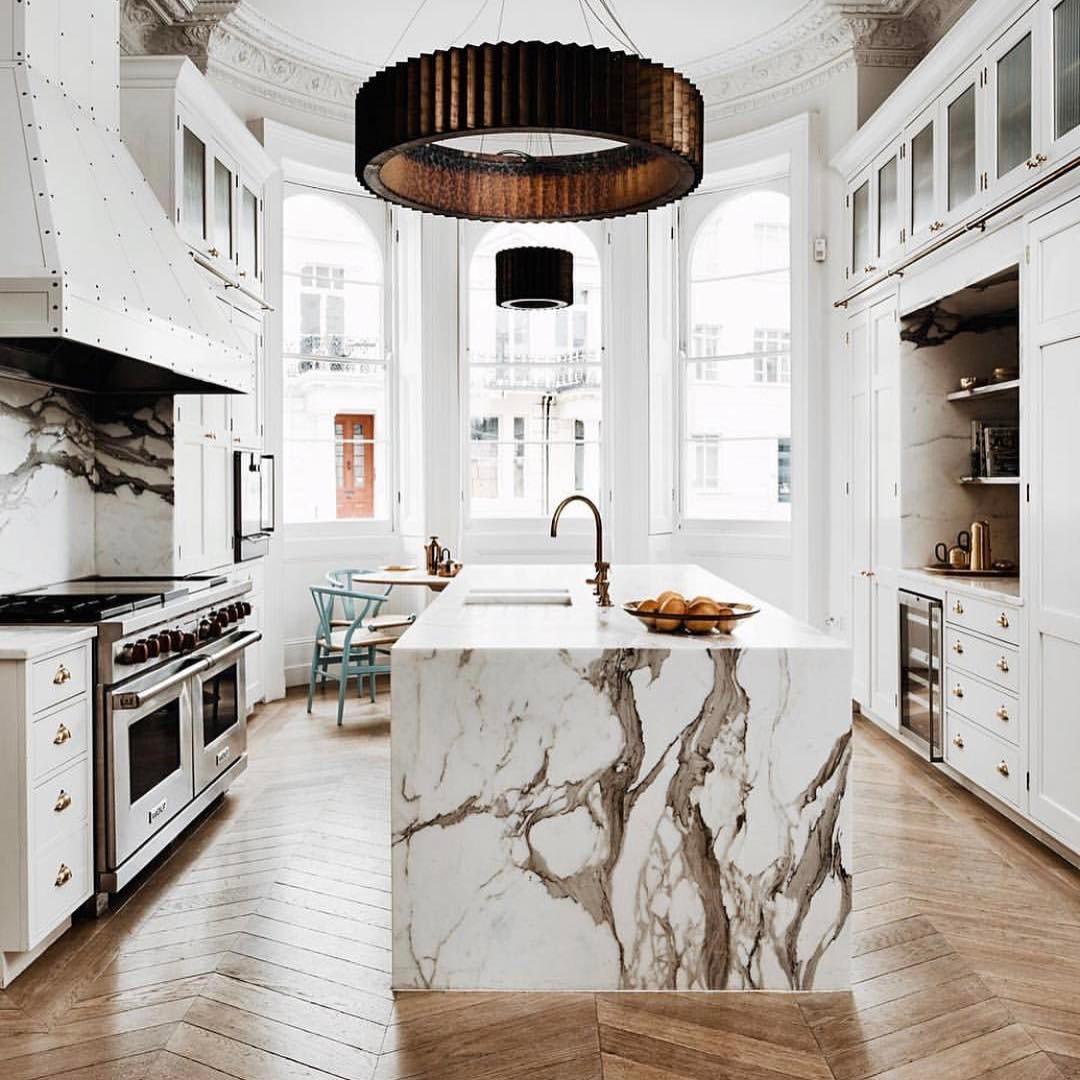
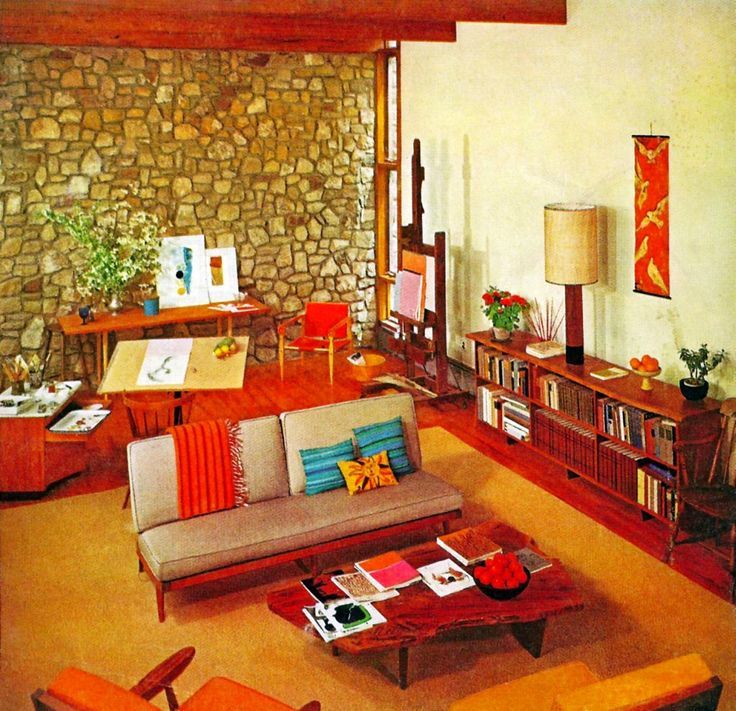
Open up to the outside. Dickinson provides some excellent examples of how we can use modern windows and doors to strengthen the connection between inside and outside. Our homes, says Dickinson, no longer need be "later-day caves."
Find your home. Learning more about the style of the house you have will help you avoid obstacles in remodeling and recognize the best opportunities for improving your particular home.
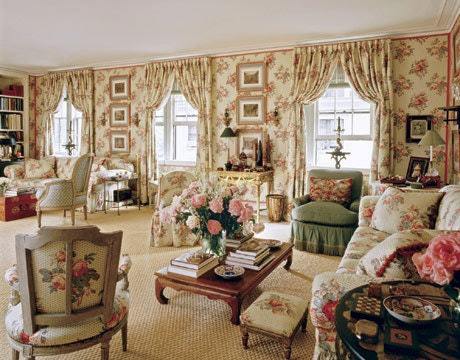
Mick Hales, original photo on Houzz
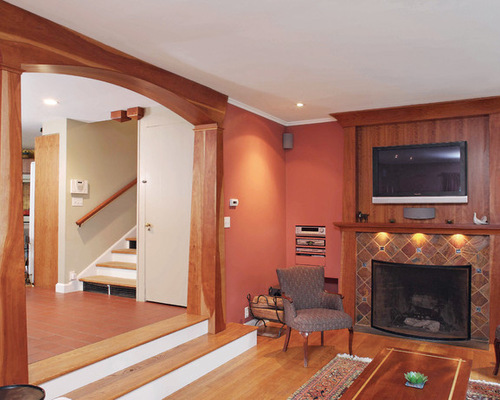
Open up the inside. Snippets of advice sprinkled throughout the book are like refreshing raindrops that clear the cobwebs away. One such snippet: "If you walk through a room to get to a room, something is wrong." You know — it's when that new great room gets added to a modest house, and the result is some kind of dyslexic creature that's really two houses rather than one.
So rather than even building an addition, Dickinson suggests you make the most of what you already have. In this example, widening the opening between rooms strengthens this room's connection with the rest of the home, increasing its utility and spaciousness.
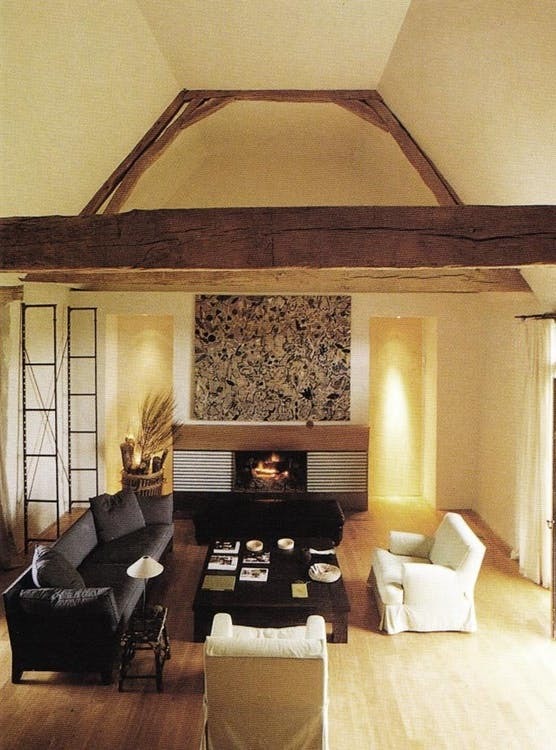
The Taunton Press Inc, original photo on Houzz
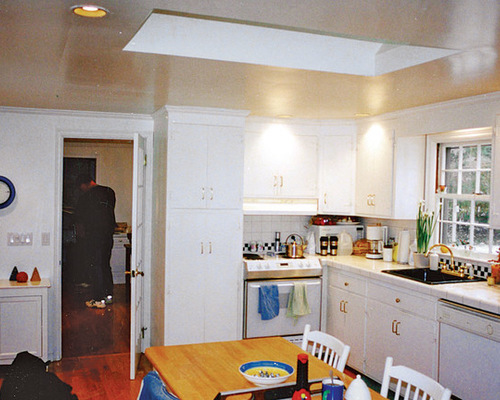
Work with what you've got (before): Keeping the kitchen size the same while vaulting the ceiling dramatically increases the overall spaciousness of the room, as you'll see in the next photo.
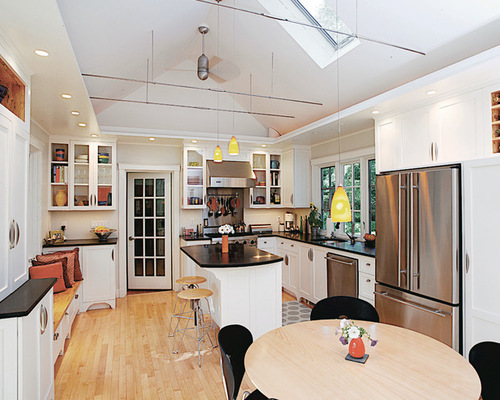
Mick Hales, original photo on Houzz
Work with what you've got (after): Walls, doors, appliances and even the skylight and kitchen sink were all left where they were. This all avoided costly plumbing, electrical and mechanical work and rework.
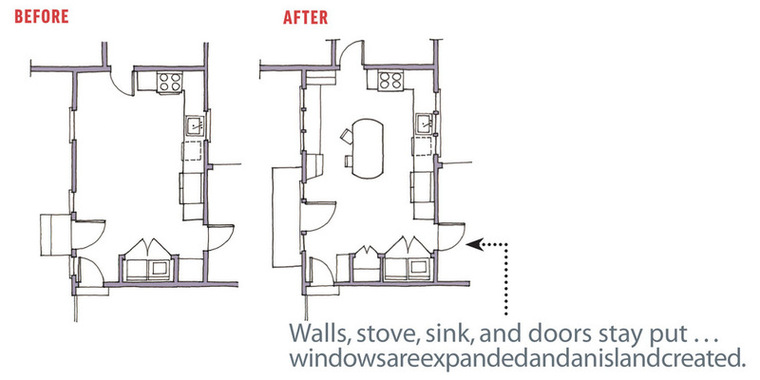
The Taunton Press Inc, original photo on Houzz
Working with what you've got (plans): Dickinson has included before-and-after floor plans for many of the examples. These plans help provide that much more context, allowing the reader to better understand what they may be able to do with the home they already have.


")


