To sell your home for the best price, it needs to be in pristine condition. You’ll work with your agent to identify high-ROI remodeling projects and various ways to improve the property, but all that is a moot point if you don’t declutter before selling your home. Here are some helpful tips to get started.
Getting your home cleaned up and organized is a precursor to capturing appealing listing photos and having successful open houses. You’ll be opening your doors to crowds of interested buyers, and it’s essential that your home feels like a place they want to live. Decluttering will also get you prepared for home staging, whether you’re hiring a professional or staging your home DIY. All these preparatory measures work together to make your home as appealing as possible to a wide pool of buyers.
Decluttering also helps to kickstart the transition of moving out. Homeowners are attached to their homes, and the selling process can bring a lot of those emotions to the surface. By going through your home room by room, sorting through your possessions and paring them down, you’re simultaneously beginning to process the life changes in your near future. Plus, by getting an early jump on organizing your home, it will make moving day a whole lot easier.
For buyers, space equals opportunity, so a tidy, uncluttered home allows them to fill it with their imagination. As such, it’s crucial that buyers see decluttered, spacious areas when they walk into your home or browse through listing photos online.
Take a deep breath; your decluttering doesn’t have to get done all in one sitting. Tackle your home room by room, taking stock of items as you go. The tried-and-true home organization method of keeping boxes labeled “donate,” “keep,” and “throw away” applies here. Separating items by their destinations will help you reduce piles of clutter in no time.
To properly declutter before selling, consider your moving timeline. Between your discussions with your agent and your preparations for your next home, moving day can go from a seemingly distant point in the future to tomorrow in a hurry. Planning a yard sale can help to give yourself a specific deadline by which you need to have finished giving the house a clean sweep.
Emphasize tidiness in small and narrow areas such as hallways, closets, and storage rooms and consider hanging mirrors to make these areas feel less cramped. These little tricks of the trade can help to give the impression that even the spatially limited areas of your home feel bigger. Scrub, wash, and dust the house top to bottom, even the commonly missed cleaning spots. A home that’s sparkling clean is more welcoming to buyers.
Talk to your agent about additional preparations that will put your home in the best position to sell. Your agent knows what buyers in the area are looking for, so lean on them for advice as you get ready to hit the market. For more information on how to get your home ready to sell, visit our selling guide:
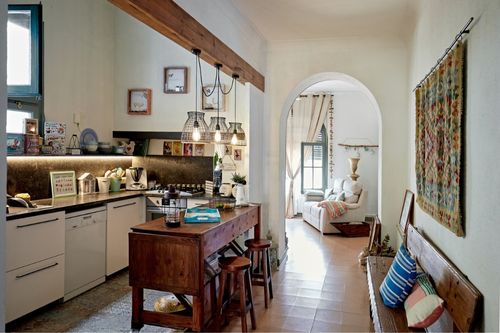
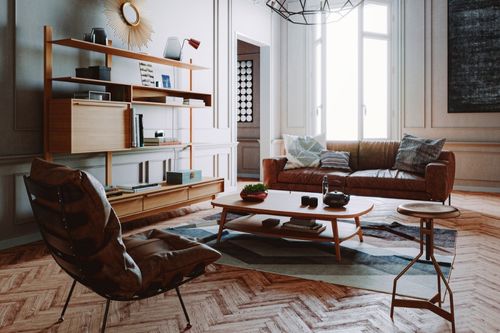
When decorating your home, it can be hard to decide on just one aesthetic. Maybe you’re a fan of mid-century modern interior design but its minimalistic approach leaves you wanting more. Maybe you love the clean look of a farmhouse style interior but wish it had some of that classic Art Deco flair. Fortunately, there’s an approach you can take where you don’t have to limit yourself to the principles of just one line of design thinking. Eclectic interior design is a smorgasbord of home décor styles that allows your imagination to run wild.
What is eclectic interior design?
Eclectic interior design is a blend of different styles, patterns, eras, and all things home décor. By pulling from seemingly contrasting sources of inspiration, it allows homeowners to create an interior that’s uniquely personalized and lively. Eclectic interiors are inherently busy, so it’s important to focus on leveling the dynamic energy among the pieces and artworks you select to create balance, scale, and proportion.
With so many shapes and colors at play, creating harmony is vital. Choose a color palette for your home and select pieces that reinforce that section of the color wheel. That way, when you decorate with accent pieces throughout your home, you’ll have a solid base to work from. This will also help you select which neutral colors will best help to balance out your interior spaces. For example, if you’ve settled on blues and browns as your foundational colors, beiges and creams will act as complimentary neutrals while creating a comfortable, welcoming atmosphere.
When it comes to textures and patterns, you’ve got far more leeway with eclectic interior design than many other styles. Have you been waiting to extract your patterned vintage furniture from your storage space? Still waiting to find a home for that ornate gold-framed mirror? Eclectic design may be just what the doctor ordered. With this style, vintage design can pair with modern furnishings and vice versa. Textures help to create contrast throughout your spaces, but even with eclectic design, repeating a texture in a few spots helps to create cohesion. Similarly, make sure your textural pieces fit somewhere within your color palette to create consistency throughout your home.
A gallery wall is naturally eclectic, making it a perfect way to use up empty wall space while reinforcing this unique home décor style. Create a gallery wall at home by selecting the wall space you’d like to use and mapping out your desired gallery pattern. Once you’ve sketched out your plan, pay a visit to your local framing or hardware store so your artwork can hang professionally and evenly. Assemble your tools, hang your pieces, and admire how a gallery wall can really snap a room together visually. Experiment with different frame colors, designs, and textures that reinforce the rest of your interior. Here’s more on how to curate artwork in your home.
For more info on the various interior design styles, home décor tips and more, visit the Design page of our blog:
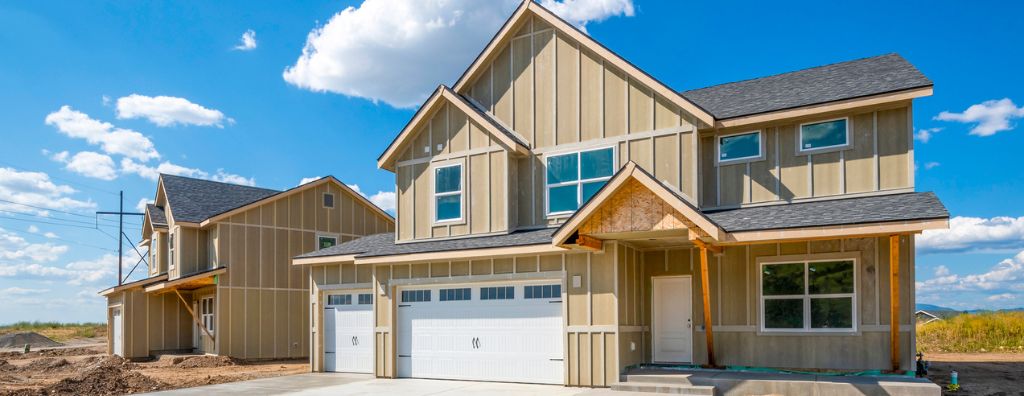
You’ve got several options to choose from when buying your next home. With existing homes, it’s in sellers’ best interest to spruce up their properties, so they’ll usually complete some kind of upgrades, curb appeal projects, and remodeling before hitting the market. A new construction home, however, has no previous owner; it comes brand new. Learning about the new construction buying process will help you understand how it differs from other types of housing, such as existing single-family homes, townhouses, condominiums, etc.
What is a new construction home?
New construction homes are kick-started from two primary sources: the homeowners themselves and developers. When a homeowner is having a home custom built, they work with contractors to build it to their desired specifications on a lot they’ve purchased. This tailored approach comes at a price; building a custom home generally costs more than purchasing a new build from a developer.
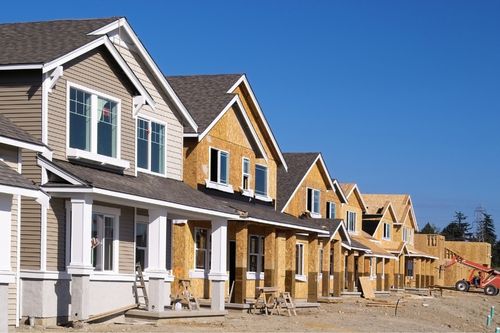
When going the developer route, buyers have options to choose from, namely tract homes and spec homes.
Tract homes make up new neighborhoods on land bought by the builder. They bear a strong resemblance to each other but may offer customizable floor plan and design options to tailor the home to the buyer’s liking.
Spec homes are finished, move-in-ready new builds. Though they offer little to no customization, they may be the right option for you if you’re looking to move right away.
There are four component parts of building a new construction home: land, labor, materials, and regulation. Builders combine those costs to determine what price they need to sell the home to make a profit, accounting for local real estate market trends. However, if the market is driving up those costs, builders are less likely to continue building. As a buyer, keeping tabs on the housing market will help you understand the landscape of available new construction homes.
There’s less room for negotiation in new construction home transactions, so you and your agent should thoroughly discuss what kind of offer you’re able to make. Your agent is your greatest asset during this part of the process; lean on them to understand how to make an offer. You’ll also want to know whether a home warranty comes with the purchase of the new construction home and its cost structure.
Even though these homes are brand new, it’s still worth it to get a home inspection to discover any outstanding repairs that need to be made and begin a dialogue with the builder about fixing them before you move in.
Going into the buying process, it helps to know which new construction homes you’re able to afford. This allows you and your agent to work together to find the best candidate properties. To get an idea of what’s affordable, use our free Home Monthly Payment Calculator by clicking the button below. With current rates based on national averages and customizable mortgage terms, you can experiment with different down payment amounts to get estimates of your monthly payment for any listing price.
How will rising foreclosures impact the U.S. housing market? To give his answer, Windermere Chief Economist Matthew Gardner sheds light on the latest foreclosure data and shows how prepared home buyers are to manage their mortgage debt today compared to the 2000s.
This video on foreclosures is the latest in our Monday with Matthew series with Windermere Chief Economist Matthew Gardner. Each month, he analyzes the most up-to-date U.S. housing data to keep you well-informed about what’s going on in the real estate market.
Rising U.S. Foreclosures
The market has certainly shifted since mortgage rates started skyrocketing last year and, with prices pulling back across much of the country, some have started to become concerned about the likelihood of foreclosures rising—clearly a timely topic given current circumstances.
Hello there! I’m Windermere Real Estate’s Chief Economist Matthew Gardner and for this month’s episode of Monday with Matthew, I pulled the latest data on foreclosure starts and looked and the quality of mortgages that have been given to buyers in order to give you a clear idea of how foreclosures will impact the overall housing market.
For the purposes of this exercise, I’m going to concentrate on foreclosure starts rather than foreclosure filings because data shows us that a majority of homeowners where a foreclosure filing has been submitted to a court by their lender are able to avoid it by refinancing or selling the home, which makes total sense as over 93% of owners in the U.S. have positive equity.
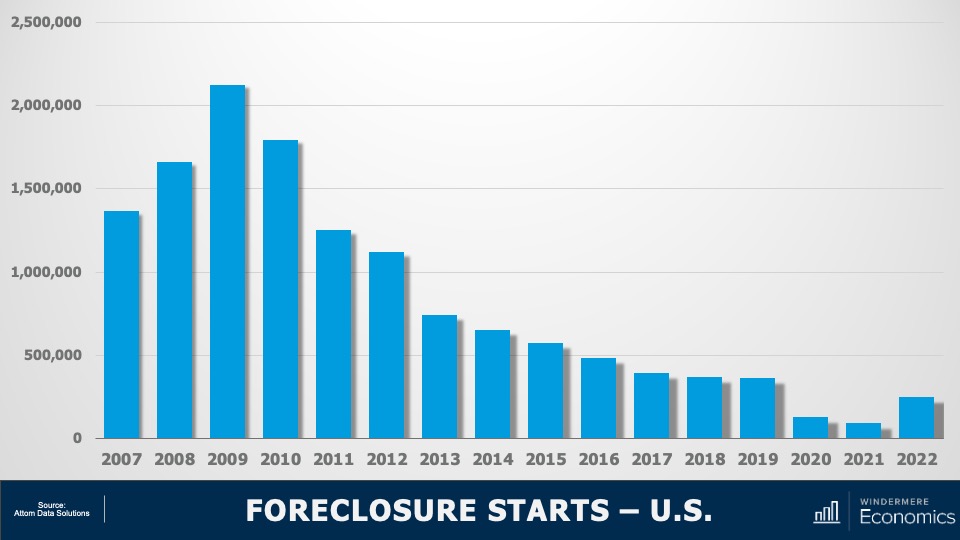
U.S. Foreclosures: Starts 2007-2022
As you can see here, foreclosure starts rose significantly last year. In fact, they were 181% higher than in 2021. But if we zoom out, it’s important to note that foreclosure starts were 31% lower than 2019 and 88% lower than the 2009 peak.
Am I surprised at the increase in foreclosure starts? Not really. The forbearance program was put in place at the start of the pandemic, and it allowed homeowners to temporarily stop making mortgage payments and not be foreclosed on, but that program ended 18 months ago.
And, although a vast majority of the 4.7 million households who entered the program have left it and sold or refinanced their homes, there were always going to be some who were not able to, and this has led to the overall foreclosure activity rising. Let’s take a closer look.
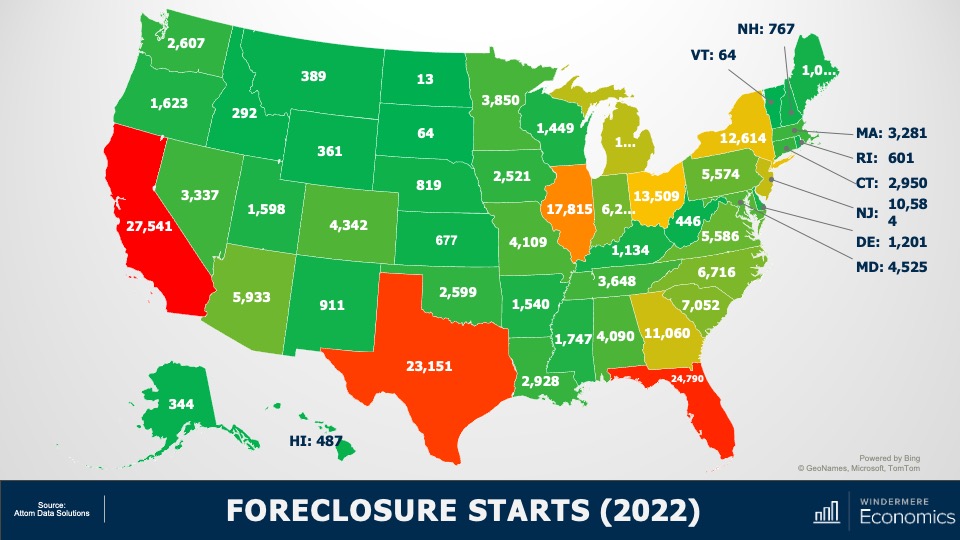
U.S. Foreclosures in 2022
This is a heat map of foreclosure starts by state. And you can see that California, Florida, and Texas saw the highest numbers in 2022. But remember that these are the states that have the greatest number of homes with mortgages so, statistically, we would expect the total number of homes in foreclosure in those states would be higher than the rest of the country. That said, foreclosure starts were significantly higher in Florida, California, Texas, and New York than they were in 2019, the last “pre-COVID” year and before the forbearance program started.
And when we look more myopically, metro areas including New York/New Jersey, Washington DC, the Delaware Valley, Atlanta, Miami, Baltimore, and Dallas all saw total foreclosure starts rise well above what they were in 2019. This may suggest that there are some markets that could see foreclosure activity rise to a level that could materially impact housing in those locations.
But looking at the country as a whole, there are other factors leading me to believe that we will not see the number of homes entering foreclosure rising above the long-term average, and certainly not sufficient to have a material impact on U.S. housing prices.
Let me show you what’s happening on the mortgage side of things. First: credit quality.
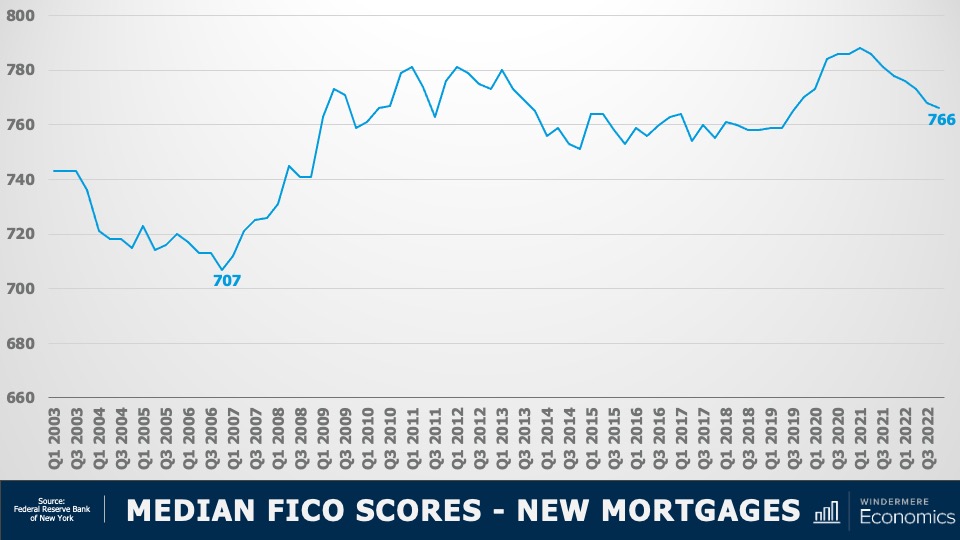
Median FICO Scores for New Mortgages 2003-2022
The median FICO score for new mortgages was 766 in the 4th quarter of 2022. Yes, this is down from the peak seen in early 2021 when it was a whopping 788 but as shown here, it’s far higher than we saw before the housing crisis. Buyers over the past several years had very good credit and, given the tight labor market, we are certainly in a very different place than back before the housing bubble burst.
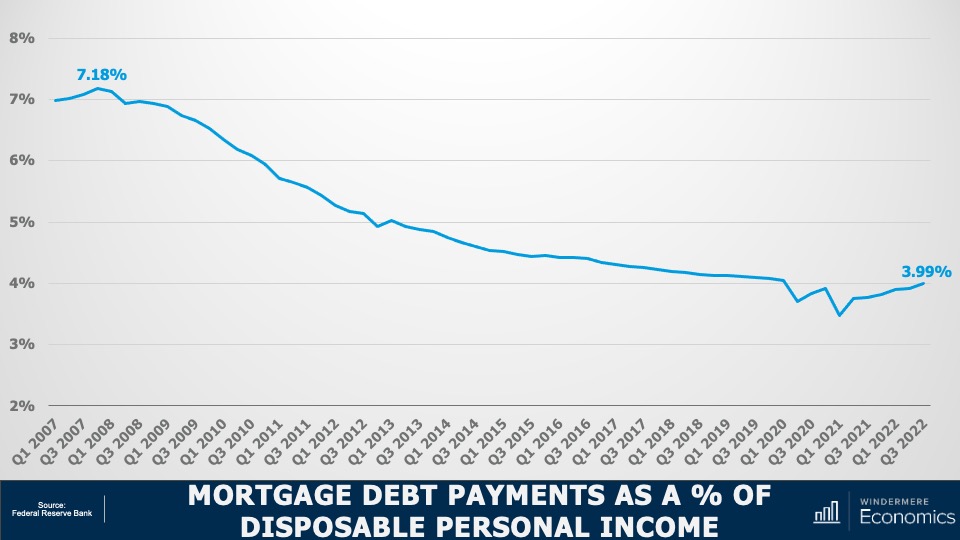
Mortgage Debt Payments Percentages 2007-2022
Secondly, buyers are using larger down payments than in the mid-2000’s, and with the historically low mortgage rates that we saw during the first two years of the pandemic benefitting new buyers as well as allowing existing homeowners to refinance, the share of disposable income that is used to cover mortgage payments remains very low. This basically means that owners aren’t as burdened by their house payments as they were in 2007-2009. And finally…
Equity Rich Households Q4 2022
With the significant run-up in housing values that we have seen over the past few years, 48% of all homeowners with a mortgage have more than 50% equity. Although this share has pulled back a little as mortgage rates rose and values pulled back, it’s still a massive amount of money and, as I mentioned earlier, many homeowners who are faced with foreclosure will end up selling their homes as they still have positive equity rather than go through the foreclosure process.
So, my answer to those of you wondering if we will see foreclosures rise to a level that could impact the overall housing market is “no.”
I don’t see any reason to believe that distressed sales will hurt the market in general, but I will say that there are some local markets where distressed sales could rise to levels that could act as a headwind to price growth in these areas. As always, I’d love to get your thoughts on this topic so please comment below! Until next month, take care and I will see you all soon. Bye now.
To see the latest housing data for your area, visit our quarterly Market Updates page.
About Matthew Gardner
As Chief Economist for Windermere Real Estate, Matthew Gardner is responsible for analyzing and interpreting economic data and its impact on the real estate market on both a local and national level. Matthew has over 30 years of professional experience both in the U.S. and U.K.
In addition to his day-to-day responsibilities, Matthew sits on the Washington State Governors Council of Economic Advisors; chairs the Board of Trustees at the Washington Center for Real Estate Research at the University of Washington; and is an Advisory Board Member at the Runstad Center for Real Estate Studies at the University of Washington where he also lectures in real estate economics.
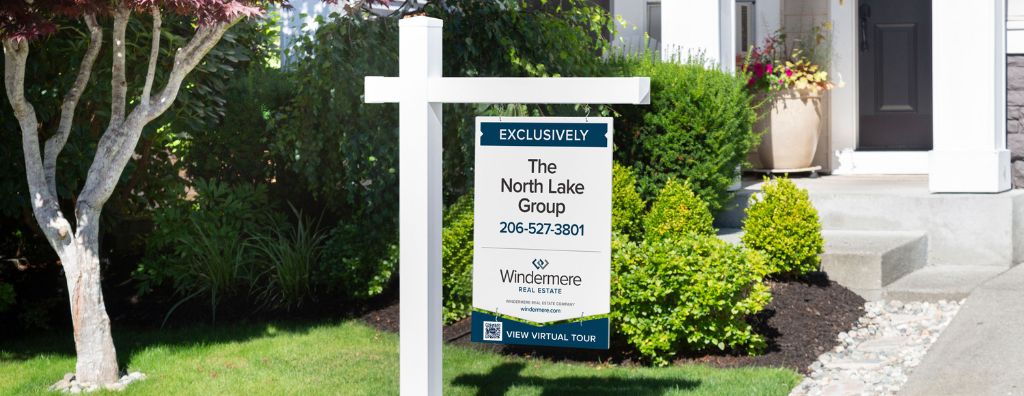
You’ve seen “For Sale” signs around your neighborhood, but what does it take to actually put your home on the market? First-time home sellers often enter the selling process unaware of what’s to come, their heads full of questions. Understanding the selling process will inform your conversations with your real estate agent and will help you stay organized and on schedule as you sell your home for the first time.
Though you’ll eventually walk away from the sale of your home with a lump sum in your pocket, the selling process isn’t without its costs. Real estate agent commission costs typically account for five to six percent of the sale price, but they’re not the only expense you’ll encounter on your selling journey. Between repairs, home upgrades, staging, escrow fees, Capital Gains Tax and more, it’s important to budget for these costs before listing your home.
A successful selling experience starts by working with a professional real estate agent. Real estate agents specialize in keeping up with local market conditions, they have the tools to competitively price your home, and they understand what is driving buyer interest in your area. But beyond these qualities, it’s important that first-time home sellers choose an agent who understands their goals and cares about their happiness. Selling a home can be an emotional roller coaster and having a trusted expert beside you will help you navigate its ups and downs.
Whether you hire a professional or decide to stage your home yourself, what’s important is that you make the commitment. Staging your home creates universal appeal, capturing the attention of the widest possible buyer pool. If your interior is too personalized, it makes it harder for buyers to see themselves in your home. Staging makes financial sense as well, as it often equates to higher sales prices. According to a 2020 survey performed by the Real Estate Staging Association (RESA®), of the 13,000 homes surveyed, 85% of staged homes sold for 5-23% over list price.1
Anything that could potentially give your home a competitive advantage over other listings is worth discussing with your agent. One such strategy is conducting a pre-listing inspection before putting your home on the market. Not only do pre-listing inspections give sellers a better understanding of what repairs may be in order, but they also streamline the selling process by transparently disclosing the details of a property’s condition to the buyer. These reports are especially helpful in competitive markets, since buyers are more likely to waive inspections.
Of all the information coming at you during the selling process, you’ll likely have your mind set on getting the best price for your home. Determining home value is one area where real estate agents excel; their Comparative Market Analysis (CMA) will help them set an accurate and competitive figure. It’s important to separate your emotional attachment to your home from your agent’s calculations. In your mind, your home possesses a certain value, but that may not match what it can realistically fetch on the market. Sometimes it may be even more than you thought!
The more buyer interest you’re able to drum up, the better. Open houses play an important role in the selling process in that they allow buyers to experience the property firsthand. Making this connection requires opening your doors to strangers, which is cause for taking the appropriate safety measures. Remove all prescriptions from your medicine cabinets, lock up precious belongings and personal information, make sure all doors and windows are locked at the end of each day, and discuss your buyer screening process with your agent so you’re on the same page.
The planning doesn’t stop once you’ve sold your home. Before the ink is dry on your real estate contract, your gears will be turning about how to efficiently move into your new home. We’ve created an interactive Moving Checklist with a step-by-step guide to the moving process, from twelve weeks before moving day all the way up until you make your move. The list is also available as an interactive web page and downloadable PDF here:
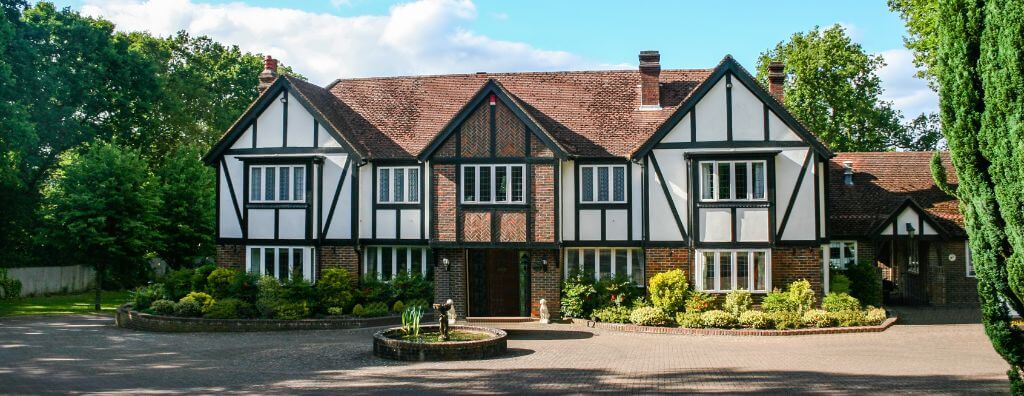
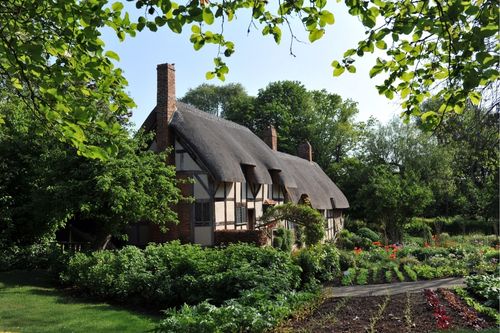
One look at a Tudor style house and you’re instantly transported to the English countryside. This distinct architecture dates back hundreds of years, borrowing elements of Renaissance and Gothic design, and later experienced a revival in the United States that continued to grow in popularity through the mid-twentieth century. Similar to cottage homes, their medieval imagery evokes a storybook charm, and their unique combination of materials makes for a truly signature look.
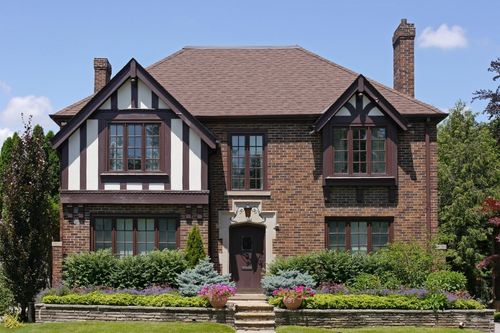
Known for their brown-and-white color scheme, Tudor style houses are typically built from stone or bricks, with a façade of stucco and exposed timbering framing. The framing creates straight lines that connect each level of the home, giving it a sense of geometry. Their steep-pitched, intersecting gabled roofs are tailor-made for climates that experience high levels of precipitation; snow slides off before accumulating, and rainwater has a natural path to the gutter system.
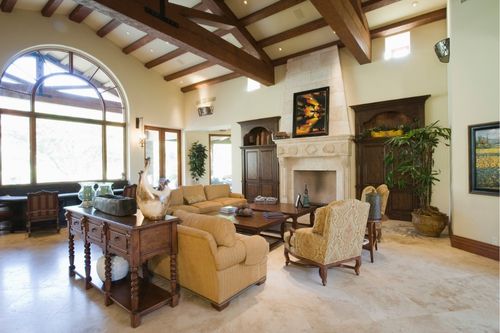
From the outside of a Tudor home, you can imagine sitting around the hearth under exposed wood ceiling beams, taking in the cozy atmosphere as the fireplace crackles. And your imagination would be spot on! A large fireplace is a central feature of these homes, given that they were the primary heating source for households early on in their history. Arched entryways with stonework accents, decorative chimneys, and narrow, closely grouped windows are also defining features of Tudor architecture.
Once World War II-era housing development began to shift toward addressing suburban sprawl affordably, the masonry-heavy Tudor style house became less popular. However, they are still found throughout the U.S. today.
To learn more about the various styles of home design, visit our Architectural Styles page:
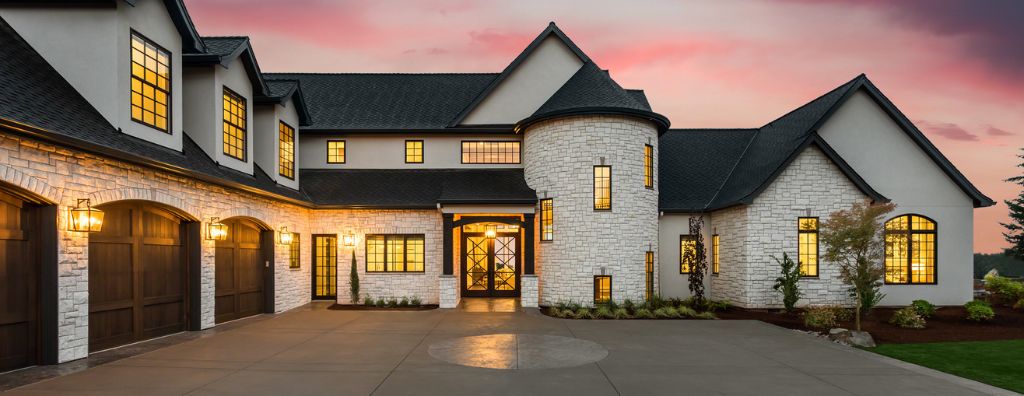
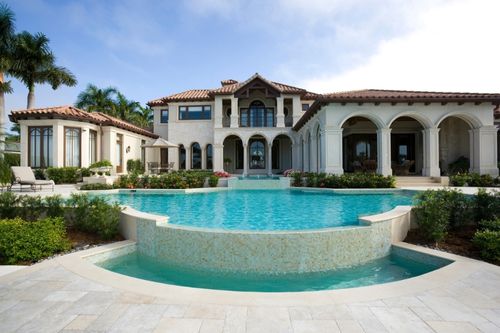
If there’s one thing that’s clear about a mansion or an estate, it’s that they’re not your average houses. But what differentiates the two? Are the two terms interchangeable? Mansions and estates actually each have separate characteristics that give them their special classification. Understanding a bit more about what makes them special can help inform your discussions with your real estate agent when looking for a luxury property of this class.
What defines a house as a mansion?
Mansions typically have a larger footprint than regular houses. Added square footage is a hallmark of mansions where the land allows, but a lesser-square-footage property may also qualify as a mansion in areas where space is limited based on its luxuriousness. Which properties qualify as mansions varies by location.
Mansions deal in excess by nature. Accordingly, these properties will have a greater number of bedrooms and bathrooms than what you’d see in a typical single-family home.
They’ll have rooms designed and built for a specific activity or function. For example, it’s common for mansions to have a game room, an indoor sauna or pool room, a home theater, or even a small bowling alley. These properties are the ideal living situation for homeowners who love to entertain. Elsewhere on the property, a mansion may boast any combination of sport courts, pools, gardens, and multiple-car garages.
In terms of their architectural style, many mansions borrow from older design styles to incorporate a sense of grandeur and prestige. The Victorian architectural style lends itself well to mansions while capturing that classic old-world charm. You may recognize Spanish Revival style homes sold by celebrities on the West Coast, and Colonial style mansions on the East Coast. Modern home designs will often incorporate cutting-edge smart home technology, smart home upgrades, and sustainable home design features such as solar power.
A mansion with an outdoor pool. Image Source: Getty Images – Image Credit: TerryJ
What is the difference between a mansion and an estate?
Estate properties share many of the aforementioned qualities with mansions. They are both luxury properties that feature several bedrooms and bathrooms with impressive amenities such as pools, saunas, sport courts, etc.
But estates differ from mansions in regard to the land they occupy and the historical context of the property. Estates sit on large, several-acre parcels of land. These extensive grounds are primarily where the mansion-vs-estate distinction can be made.
In England, the usage of “estate” usually means there was some form of income-producing activity present on property supporting the house. American estates typically do not have this same relationship between the property and the house. In the U.S. today, estates are differentiated by their size, grounds, and luxury amenities, but typically don’t yield enough agricultural goods to support the property.
The Biltmont Estate in Asheville, North Carolina – Image Source: Shutterstock – Image Credit: ZakZeinert
To learn more about the mansions and estates available in your area, contact a local Windermere agent:
A homeowner’s life is filled with mini hazards that pop up at a moment’s notice. Our appliances make life easier, but they are subject to malfunction. A broken toilet interrupts your day and can cause serious water damage, which emphasizes the importance of timely repairs. The following tips to fix your toilet will help you get your water system and your home life flowing properly again.
If these repairs are beyond your capabilities, don’t hesitate to call a professional plumber.
Problem: there’s water around the base of the toilet
A leaking toilet can have you dealing with the perils of a water damage emergency in no time. If there’s water around the base of your toilet, that’s a telltale sign that the leak has sprung from the wax ring seal. You’ll have to remove your toilet to replace it.
How to Fix a Leaking Toilet
Use a wrench to disconnect the water supply from the shutoff valve. Drain the tank until all water is removed from the bowl.
Disconnect the water supply valve from the toilet tank. Using a screwdriver and wrench, remove the caps on the base of the toilet and the hex bolts beneath them.
Grab the toilet by the bottom and lift it from the ground. Set it aside on material that will prevent damage to your bathroom floor, like a towel or blanket.
Remove the old wax gasket from the flange and install a new one on it by centering it on the flange and pressing it down into place.
Reinstall the toilet by placing it on the bolt holes, keeping it level as you go. Use your weight to press down on the toilet bowl before putting the bolts back in. This helps to compress the new gasket. Caulk around the base of the toilet if needed.
Reconnect the water supply to the shutoff valve and open it before giving your new toilet a test flush. If there are no leaks, you’re done!
Another common issue homeowners face is a running toilet. The constant sound of running water coming from your bathroom isn’t just annoying; it wastes water and can cause spikes in your utility bills. A running toilet is typically due either to a faulty flapper or the water level being too high in the tank, causing overflow.
How to Fix a Running Toilet
The most common cause of a running toilet is that the flapper chain is caught on something. To check for this issue, take the top off the tank to see if the chain is too taught. If so, see if you can release it, after which the flapper should fall into place and stop the run.
If the flapper or the chain are compromised, they’ll need to be replaced. But no sweat, that’s easy! Start by shutting off the water supply and drain the tank by pulling up on the flapper chain. Remove the flapper by unhooking it or removing the ring that holds it in place. Pick up a new matching flapper at your local hardware store and reverse the process to install it and reconnect the chain. If this doesn’t solve your running toilet problem, it may be a larger issue, such as the flush valve.
Problem: the toilet isn’t flushing correctly
If your toilet isn’t flushing correctly, there’s likely something wrong with the flush handle or the water level, or it could be a clogging issue.
How to Fix Flushing Issues
Tighten the flush handle if it’s loose and see if that solves the problem. When you do, make sure the flush lever is working properly. If there’s too much slack in your lift chain, it won’t trigger a proper flush. Make sure it’s not too loose, but not so tight that it can’t flush properly either.
Problem: the toilet has started wobbling
Sometimes homeowners will suddenly notice their toilet feels uneven or is rocking slightly. This is usually because the flange that connects to the drainpipe is sitting higher than the floor.
How to Fix a Wobbly Toilet
The best fix is to wedge shims under the base of the toilet and caulk the area to solidify it.
For more tips on home maintenance, read the following blog post about controlling mold:
Your local market conditions dictate the real estate climate around you. Where things are on the buyer’s/seller’s market spectrum will impact how you and your Windermere real estate agent approach selling your home. As a part of this process, it’s important to understand the different types of markets and how their conditions play into accurately pricing your home.
See the latest data on home sales, home prices, mortgage rates and more for your area here:
The housing market is categorized as a seller’s market when demand for homes is greater than the supply on the market. With limited inventory, competition is high amongst buyers. This drives home prices up, decreases days on market, and often leads to multiple offers from buyers. These are ideal conditions for selling your home, given that buyers are forced to continually sweeten their offers to win out. For example, buyers are often more apt to remove contingencies from their offers in a seller’s market.
A buyer’s market is on the opposite end of the real estate market spectrum. It is usually defined as having six or more months of available inventory—meaning if no new homes were listed, it would take six (or more) months for all available listings to sell.
Because there’s greater supply than demand, there’s less competition among buyers, and it’s the buyer’s agents who often have the leverage during negotiations. Selling in these conditions emphasizes the importance of investing in improving your home before putting it on the market.
A balanced market exists in equilibrium between a seller’s market and a buyer’s market. It is the middle part of the Venn diagram between the two; it shares certain aspects of each, but only dips its toes into both.
When your local real estate market is balanced, it’s important to approach the selling process with a realistic mindset. In a balanced market, bidding wars are less likely and the chances of buyers having complete leverage are slim. These conditions, however, are all the more reason to make your home stand out amongst competing listings. Making repairs, remodeling, and boosting curb appeal can all help attract buyers while increasing the value of your home.
When coming out of a seller’s market, it’s important not to panic when your local real estate market experiences a cool-down or a return toward balance. In a balanced market, there are still plenty of buyers actively seeking homes, albeit at a lesser pace. Even as aggregate home sales decline and days on market increase, these market conditions should not be confused with more extreme situations like the housing market crash of the late 2000s.
Our Chief Economist Matthew Gardner covers recent housing marketing conditions as they compare to the Great Recession. Read his analysis in two recent articles:
All these factors highlight the importance of working with your agent to accurately price your home in a balanced market. Real estate agents have access to the Multiple Listing Service (MLS), which gives them access to a huge network of data on available homes both present and historical. They’ll use this data to conduct a Comparative Market Analysis (CMA) to competitively price your home. To get started, connect with a local, experienced Windermere agent:
Featured Image Source: Windermere Real Estate
Few interior design styles have captivated our imaginations like mid-century modern. Though the mid-century modern movement began to impact design culture many decades ago, we still see its lasting impact today. This vintage style remains popular for homeowners everywhere and shows no signs of slowing down. To aid your home décor efforts, let’s dig a bit deeper into what makes mid-century modern so special.
What is mid-century modern interior design?
The mid-century modern movement came to define graphic design, architecture, product development, and interior design in the 1940s, 1950s, and 1960s. Its emphasis on simplicity was a direct reaction to the more opulent styles that preceded it, heralding a shift in suburban home life. Here are a few of its signature features.
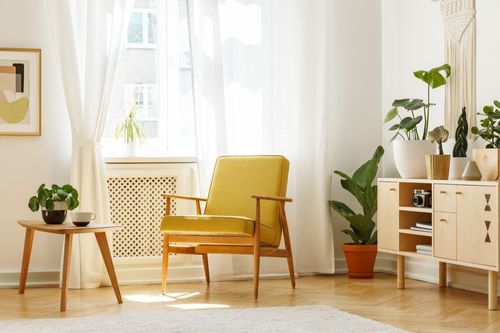
Both mid-century modern architecture and interior design live by the maxim “less is more.” With minimal decoration, the space between objects is emphasized, giving interiors a fresh and clean look. Straight lines are a tenet of this design style, reflected in the signature pieces of the era, such as the Eames chair (pictured below). This minimalist approach to interior design maximizes each object by removing all unnecessary elements.
The minds behind the mid-century modern movement prioritized nature and questioned how interiors could interact with the outside world. Nowadays, it’s common for homeowners incorporating this style to decorate with house plants, but the harmony with nature extends further into home design with such elements as stone materials, exposed wood beams, and floor-to-ceiling windows to maximize natural light.
3. Mid-Century Modern Color Scheme
If you’re a fan of decorating with a neutral color palette, this style is perfect for your home. With a reliance on colors like black, white, cream, and grey, a quintessential feature of this décor style is using bolder colors as accents to pop against a neutral backdrop. Primary colors create added contrast and help to lead the eye throughout a room. Experiment with dark brown or black to create different moods within the mid-century modern color spectrum.
Its ability to remain popular for decades is what separates this style. Its principles are still reflected in the latest home design trends. Perhaps nowhere is this more evident than its philosophy on materials and texture. It combines natural and synthetic materials to bridge the gap between eras, creating interiors that feel simultaneously vintage and modern. Plastic and fiberglass are commonly used manmade materials, while wood, marble, and stone are typical natural elements.
5. More Space, Less Clutter
Just as the space between objects is emphasized, open floorplans are typical in mid-century modern design to create spacious environments. Decorative décor is limited to reduce clutter, and enclosed storage spaces are kept to a minimum. If you’re planning to decorate in this style, it’s an opportunity to pare down your belongings and keep only what’s essential for your lifestyle at home.
For more information on interior design, architecture styles, décor tips, and more, visit the Design category of our blog:

 Facebook
 X
X
 Pinterest
 Copy Link


")


