
 Facebook
 X
X
 Pinterest
 Copy Link
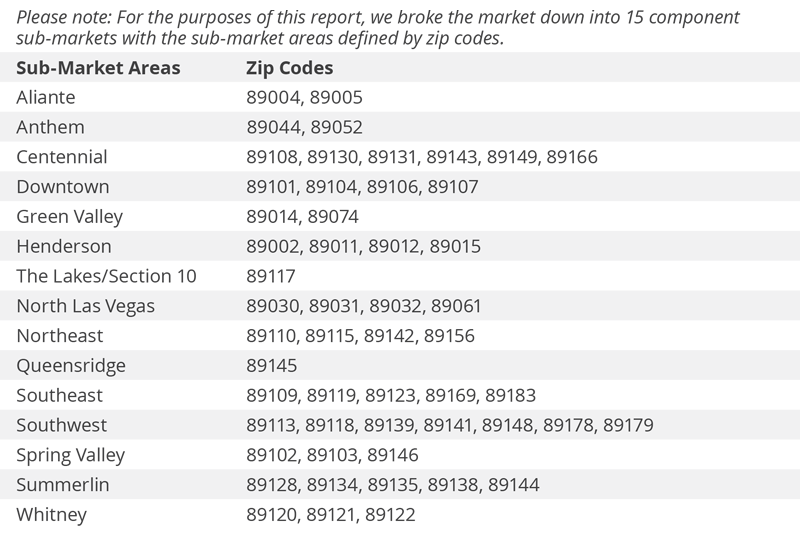
Q3 2023 Nevada Real Estate Market Update

The following analysis of select counties of the Nevada real estate market is provided by Windermere Real Estate. We hope that this information may assist you with making better-informed real estate decisions. For further information about the housing market in your area, please don’t hesitate to contact your Windermere Real Estate agent.
Regional Economic Overview
Though the pace of job growth in Clark County continues to cool, the market added 44,000 new jobs over the past 12 months, which represents a respectable growth rate of 4%.
The non-seasonally adjusted and seasonally adjusted unemployment rate in August was 6.1%. This was down .1% from August of 2022. Although the rate may be disconcerting given the national rate of 3.8%, it should be noted that the jobless rate rose more as a function of a growing labor force. The local labor force rose 2.7% while the national labor force only increased 1.9%.
My updated employment forecast for the Las Vegas metro area shows employment growth continuing to taper. Growth in 2023 will be up 3.4%, and my preliminary 2024 forecast suggests that job growth will slow to around 1.8%.
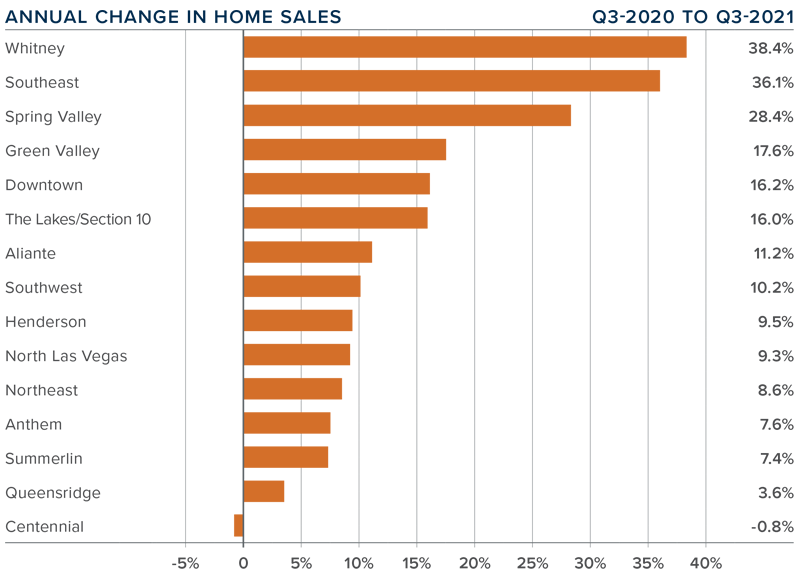
Nevada Home Sales
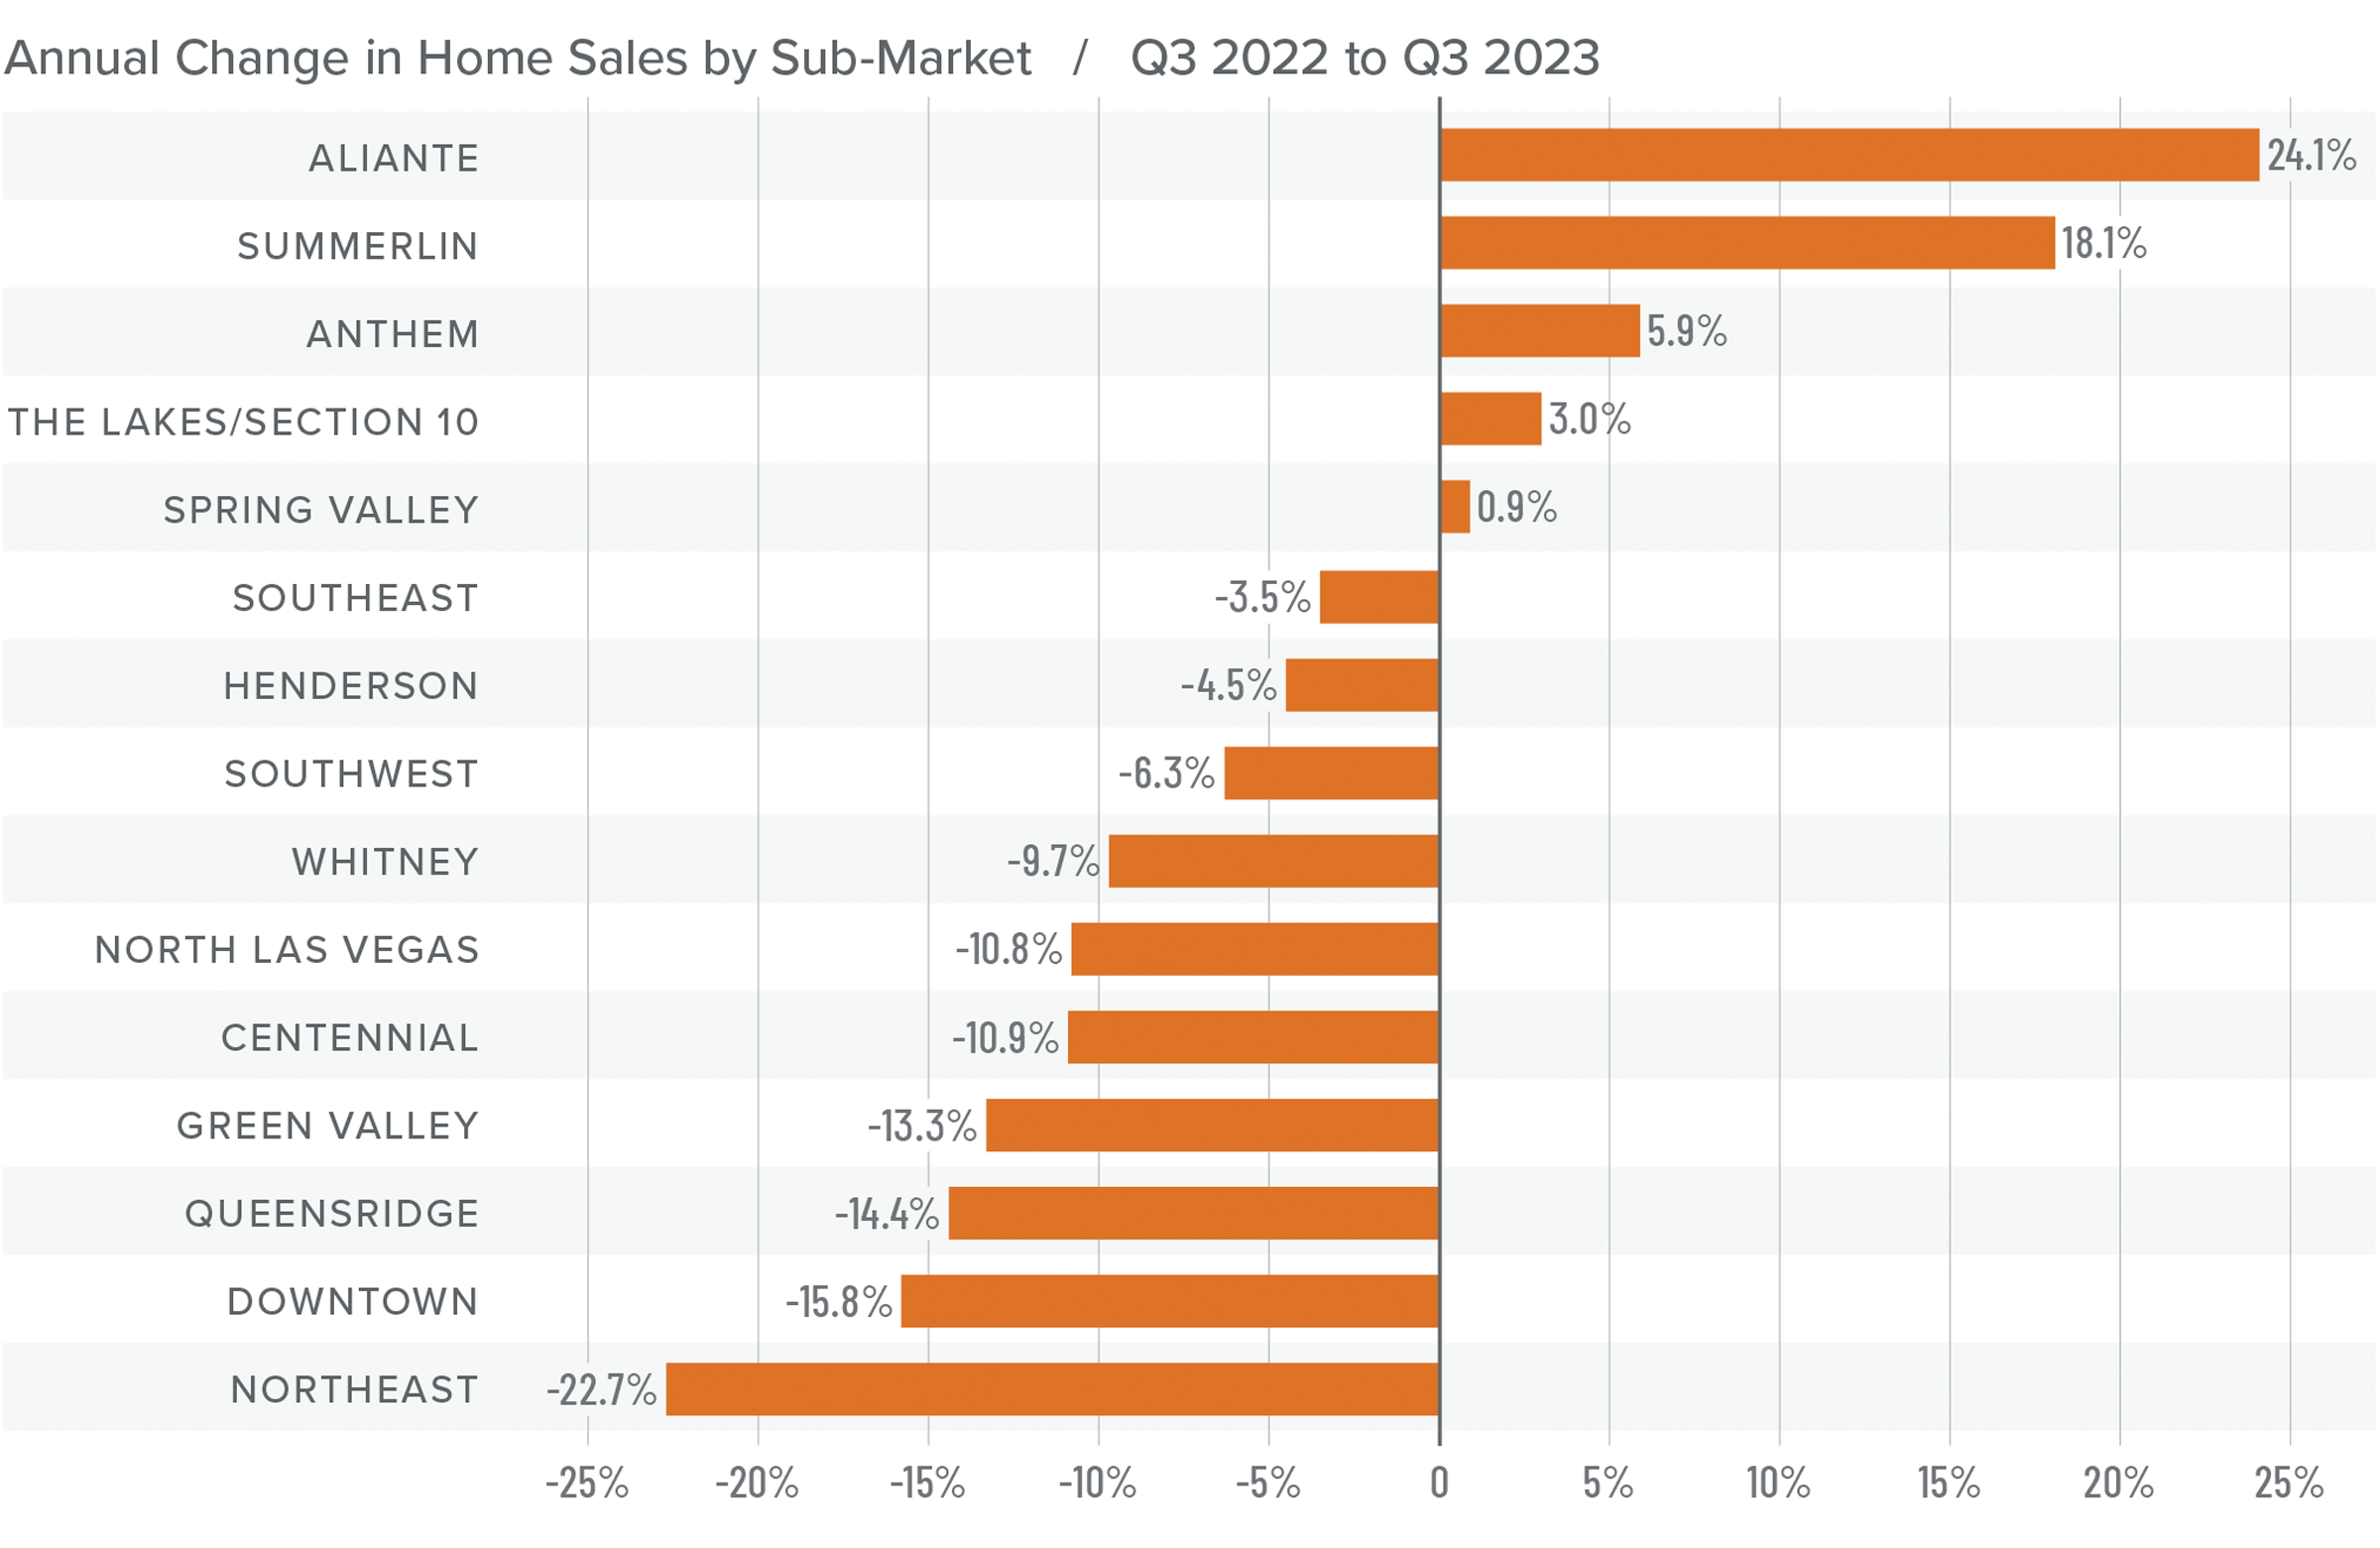
❱ A total of 6,011 homes sold in the third quarter, which was a drop of 6% compared to the same period in 2022. Sales were down 10.8% from the second quarter of 2023.
❱ Compared to the third quarter of 2022, sales fell in a majority of the markets covered by this report. Compared to the second quarter of this year, sales fell in all markets other than the Spring Valley and Aliante neighborhoods, where sales rose 3.6% and 20%, respectively.
❱ Listing activity was flat versus the second quarter of the year, but the number of homes for sale was down more than 54% year over year.
❱ Pending sales, which are an indicator of future closings, fell 13.1% compared to the second quarter, suggesting that sales activity may not grow in the upcoming quarter.
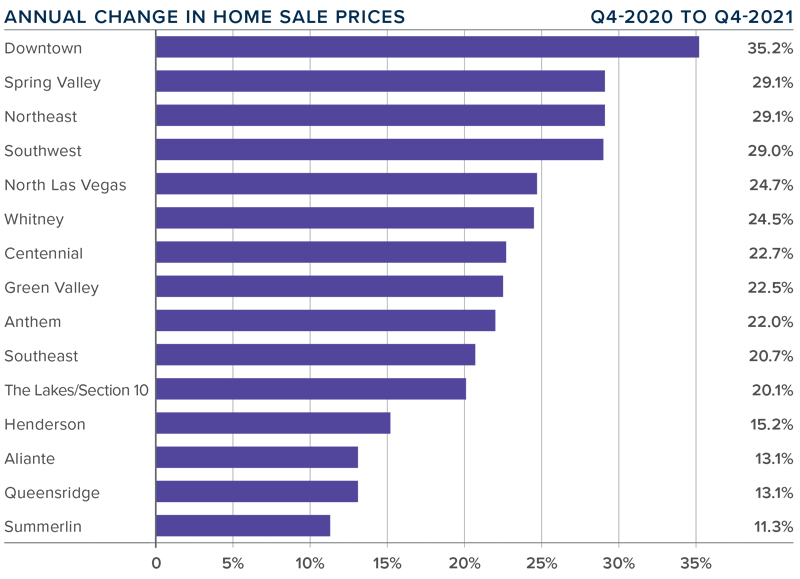
Nevada Home Prices
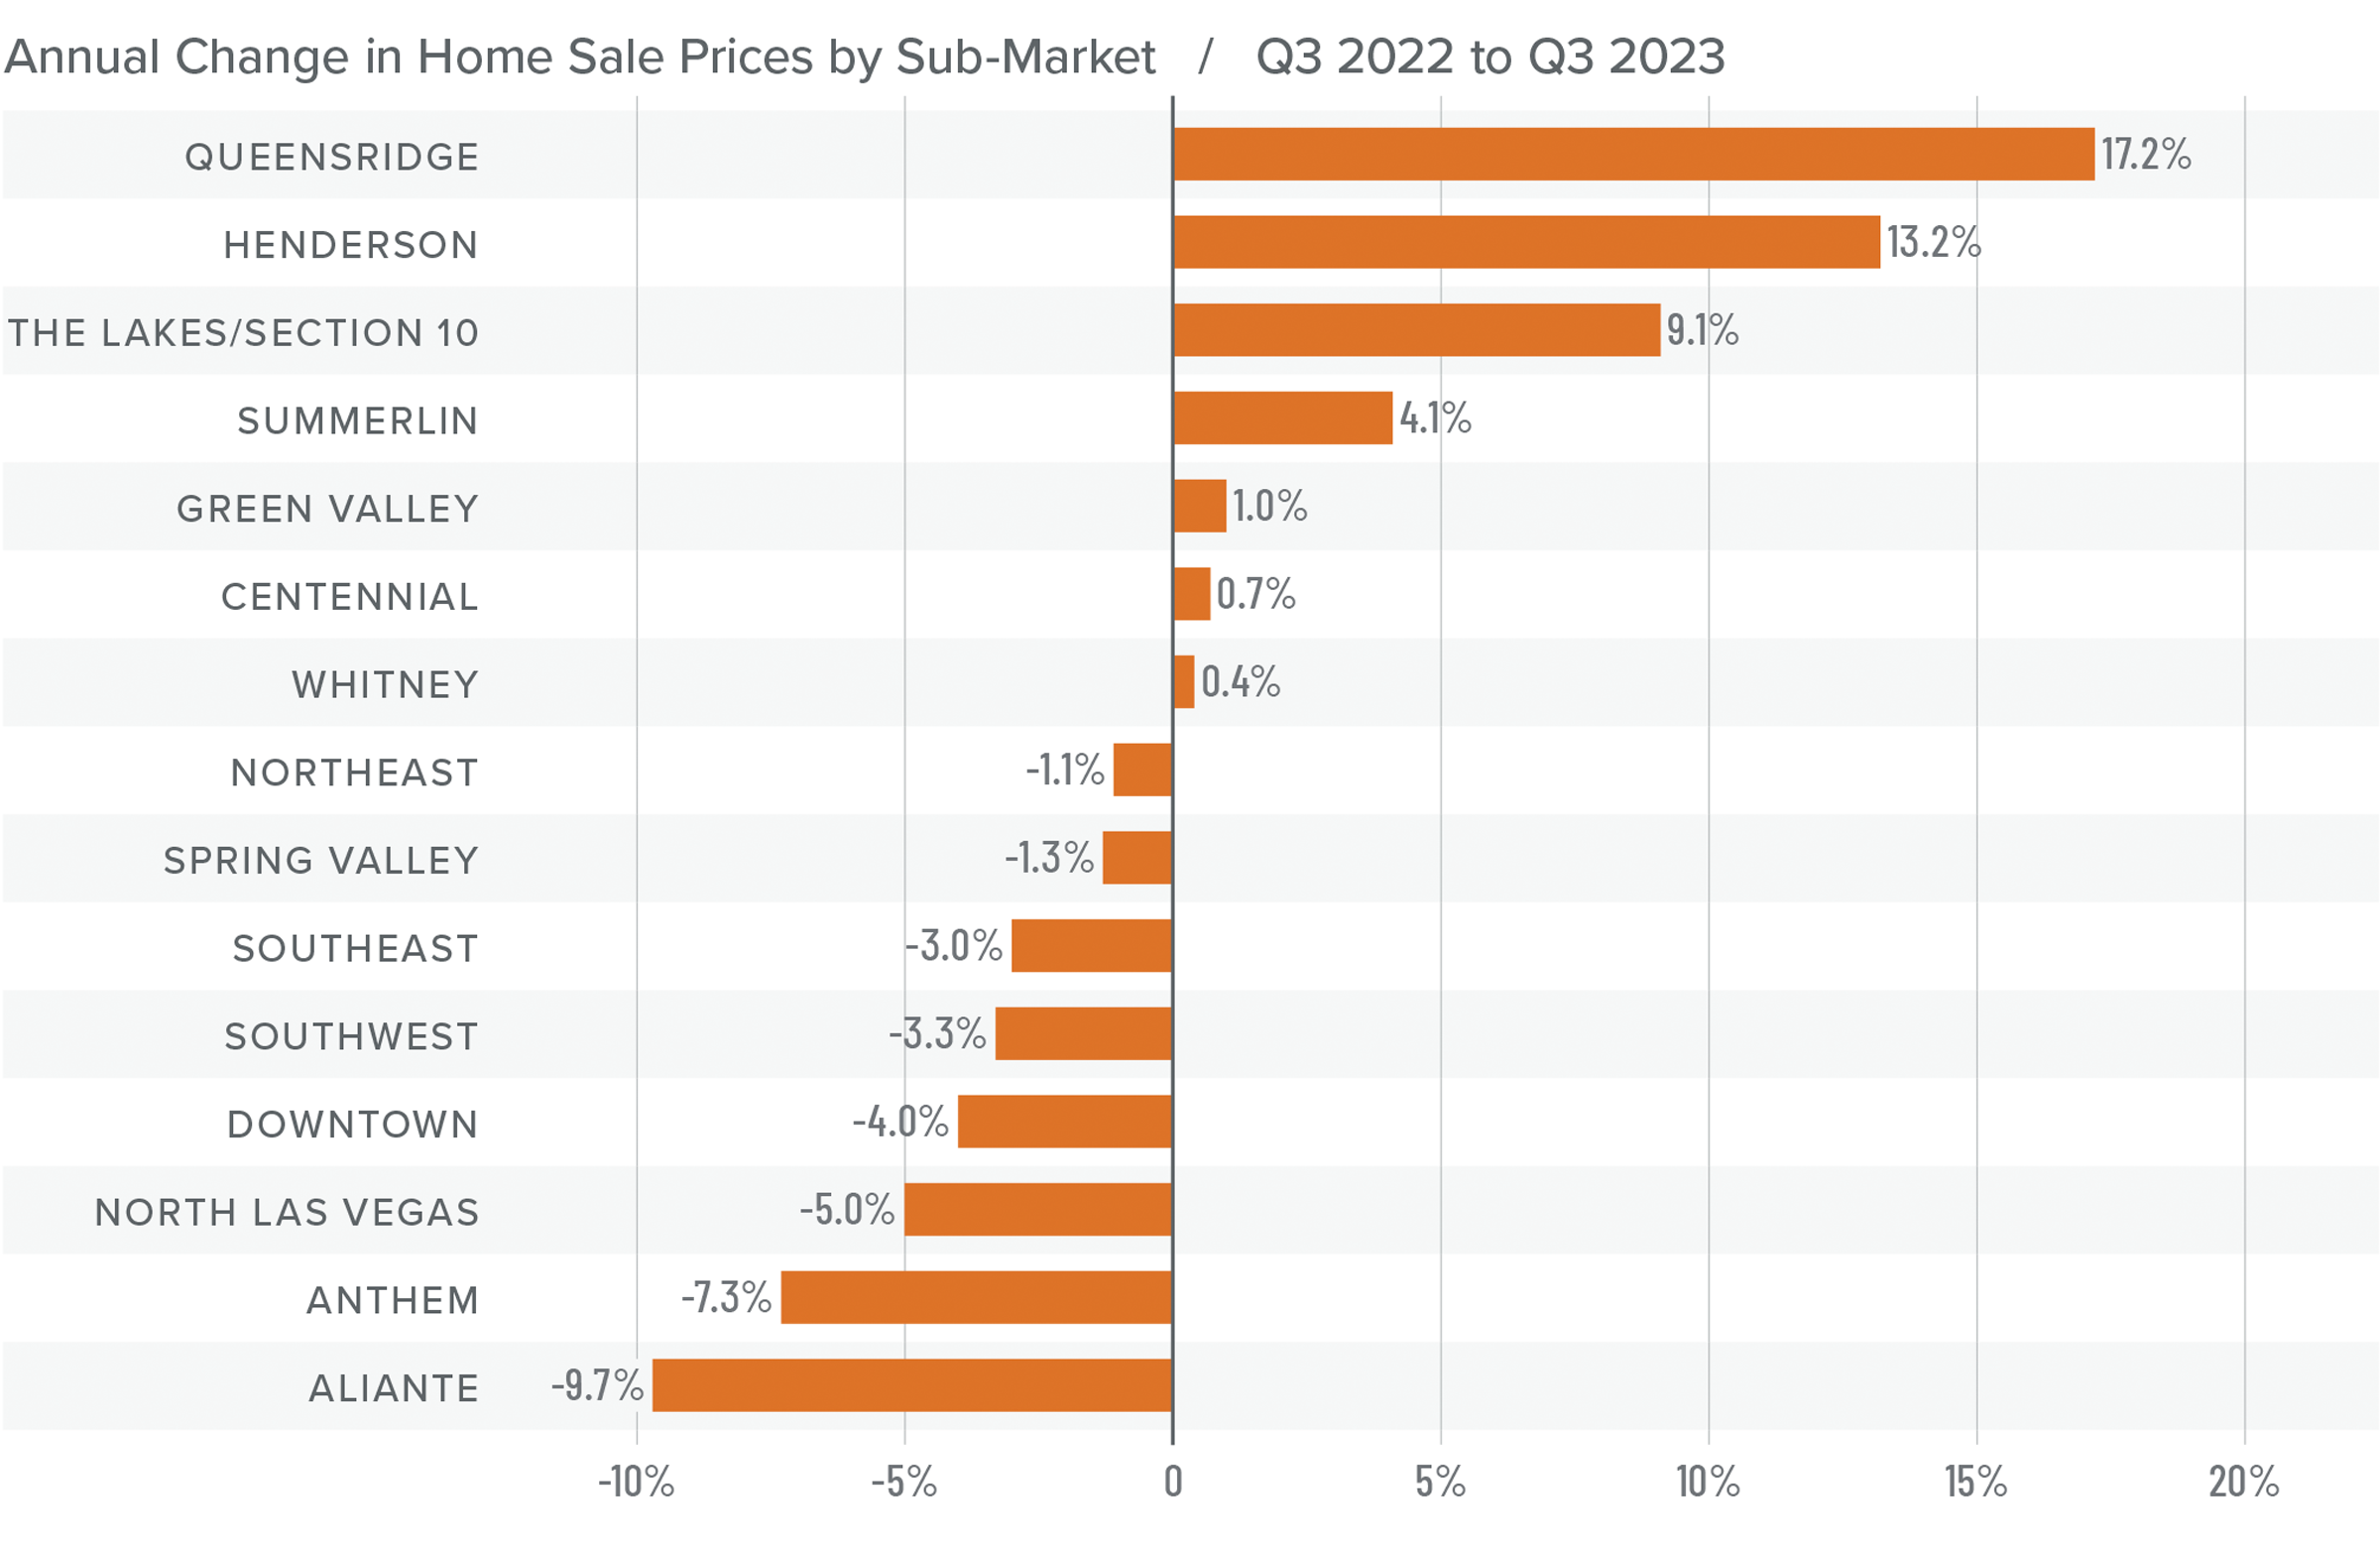
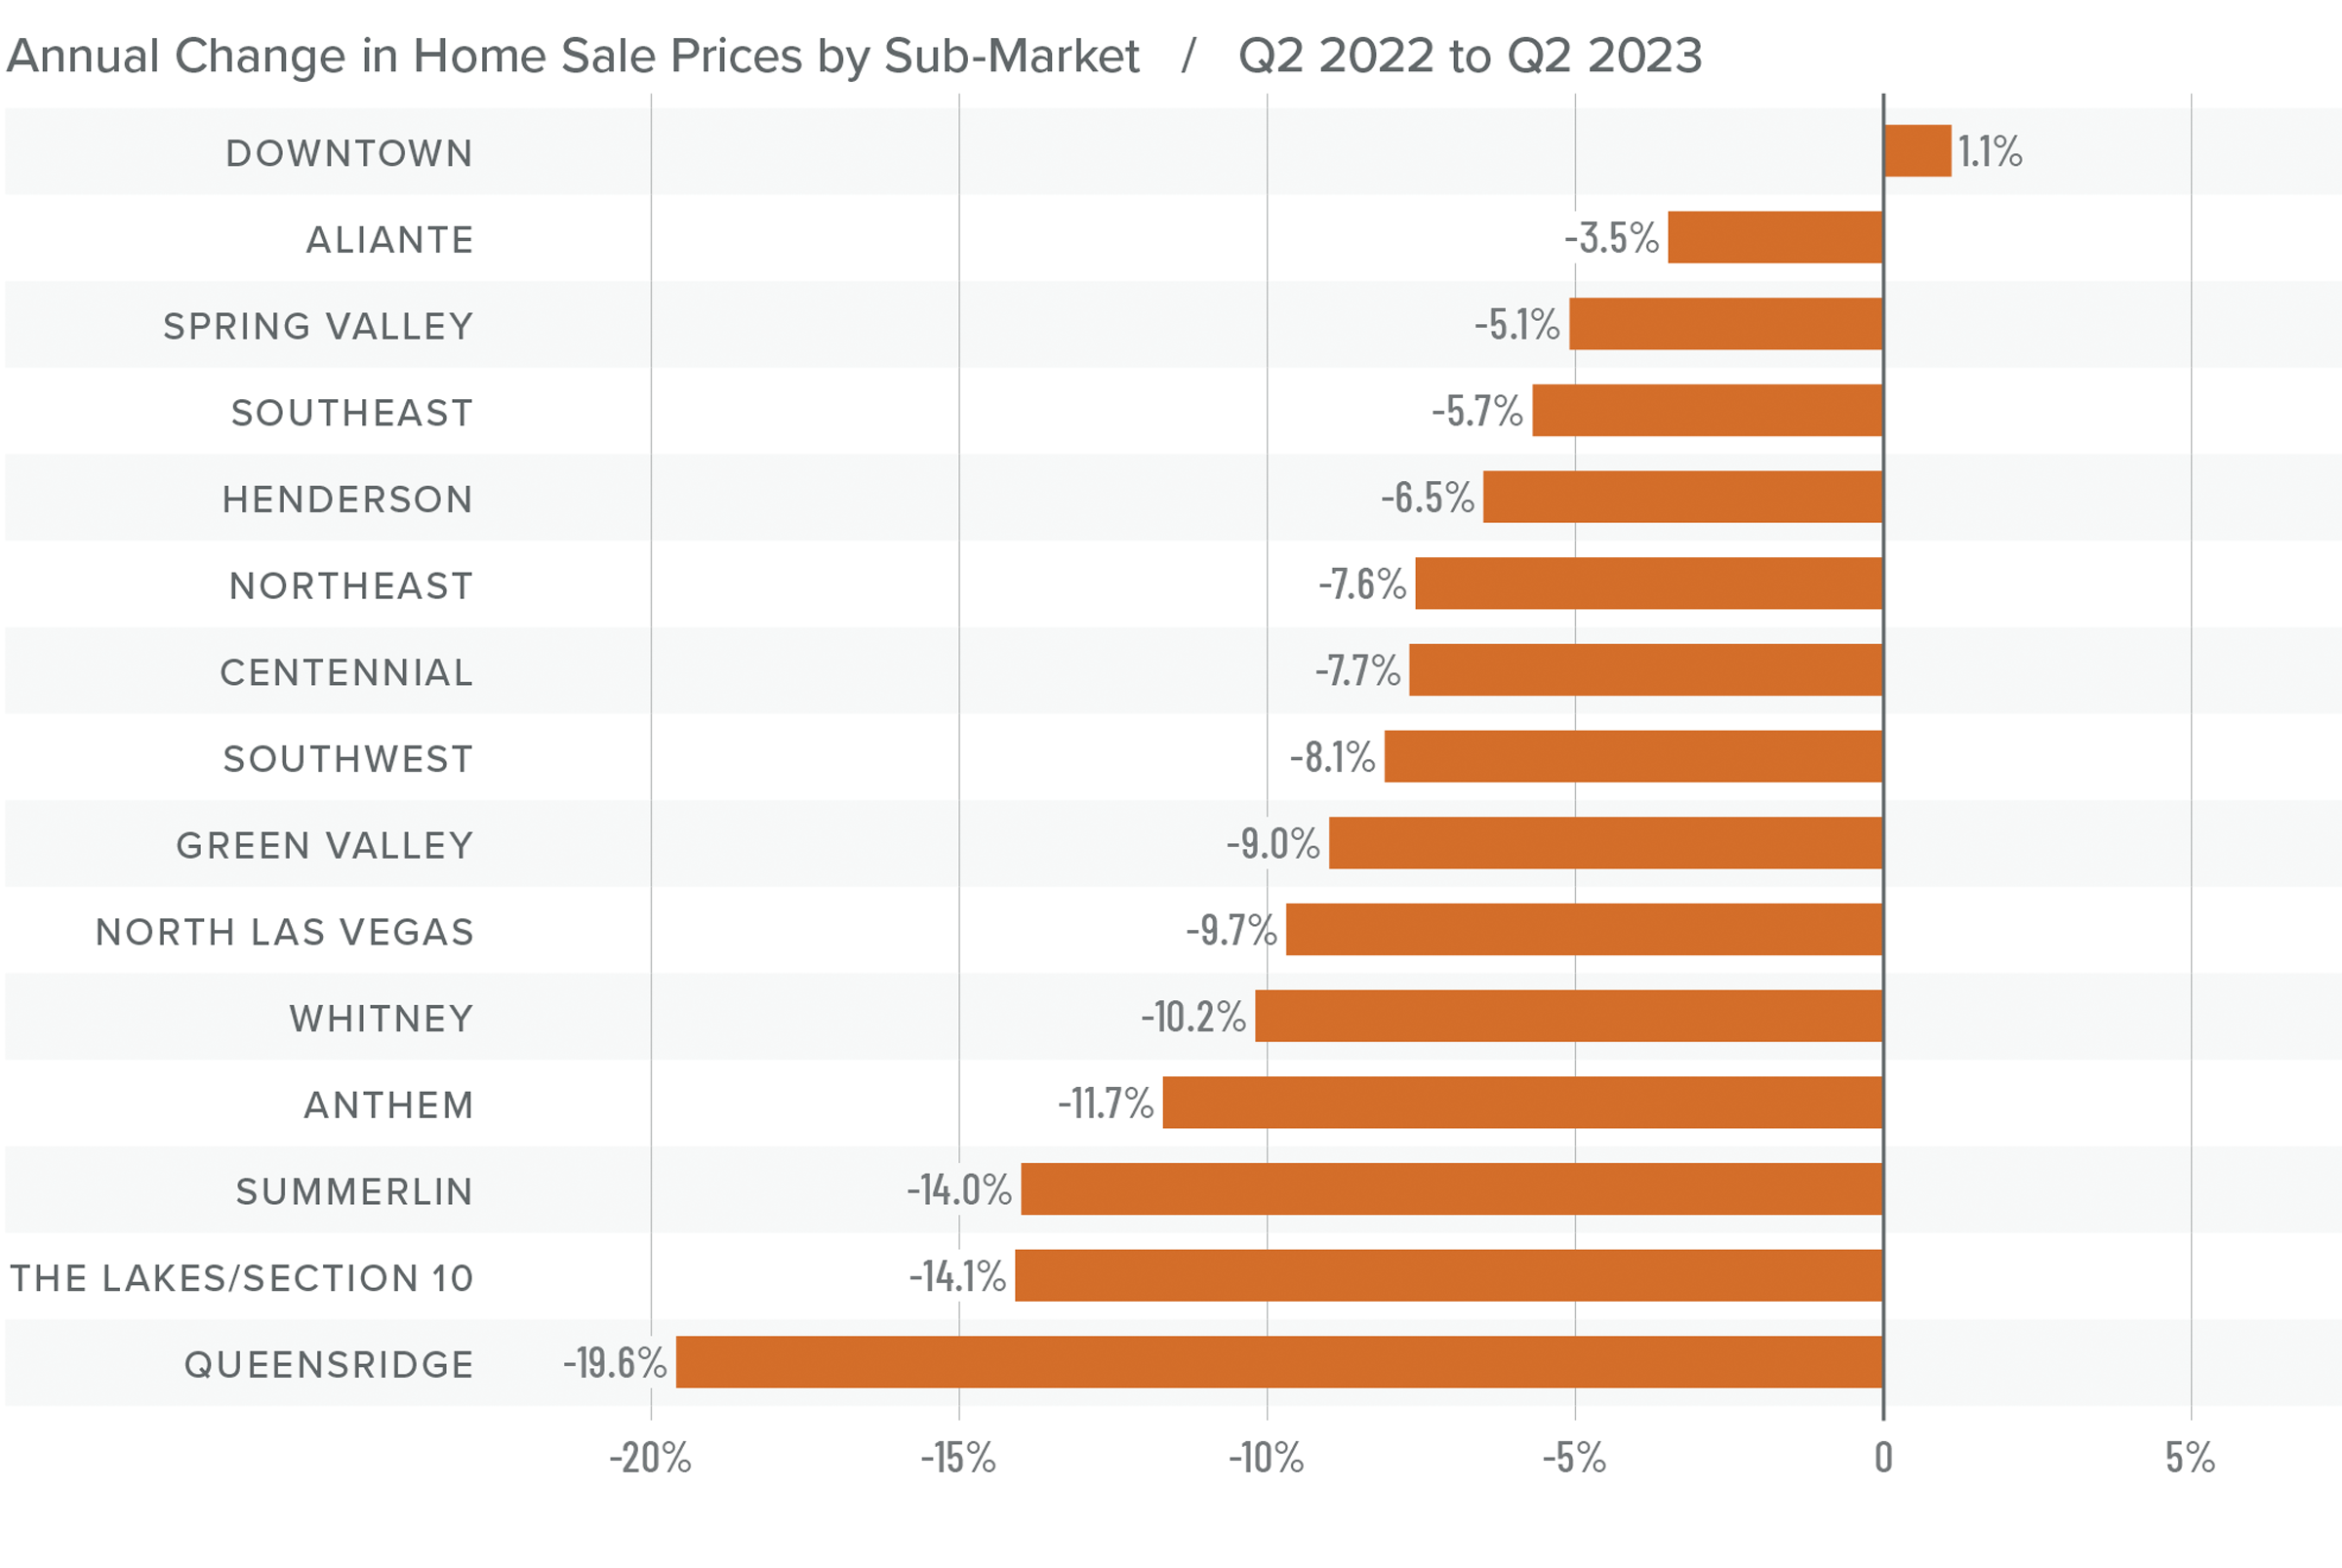
❱ Home prices fell .3% year over year but were .6% higher than in the second quarter of 2023. The average home sale price in the area was $478,355.
❱ Compared to the second quarter, more than half of the neighborhoods saw a drop in median list prices, which are a leading indicator of the housing market. However, increases in the remaining neighborhoods made aggregate list prices essentially flat.
❱ Year over year, prices fell in eight areas but rose in seven, with significant increases in the Queensridge and Henderson neighborhoods. Compared to the second quarter of this year, prices were up in every market other than Downtown, Aliante, Southeast Las Vegas, and Spring Valley.
❱ Lower list prices and flat price growth may suggest that the market is starting to react to higher mortgage rates. I don’t expect sale prices to move much for the balance of this year, but limited inventory should continue to support current values.

Mortgage Rates
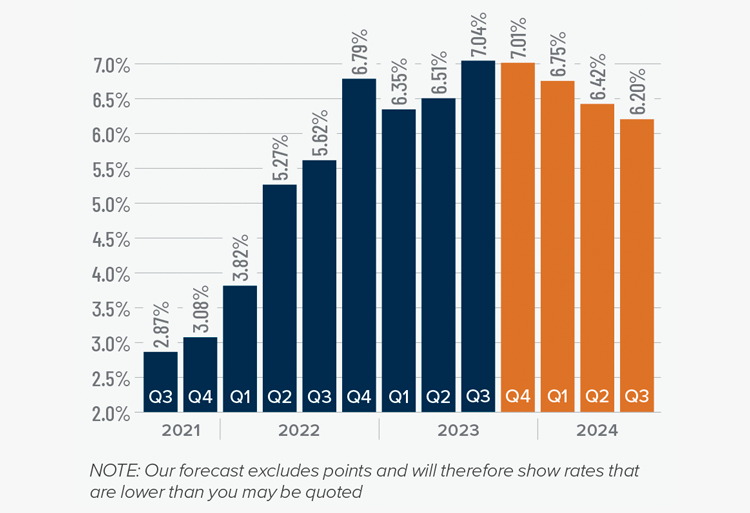
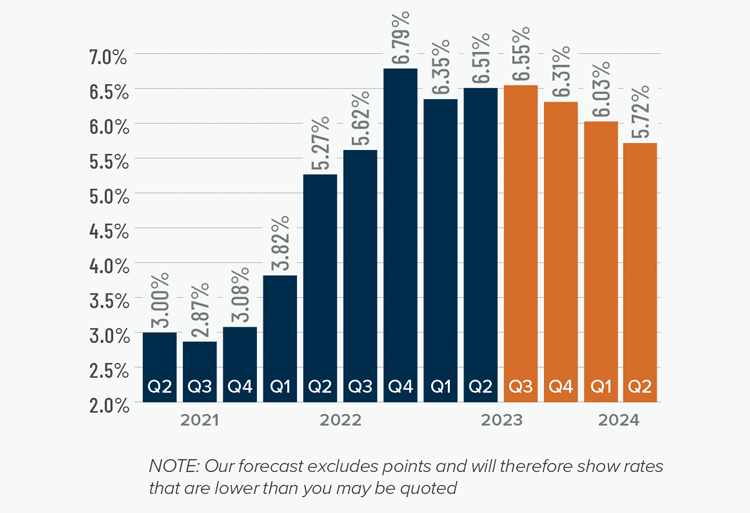
Mortgage rates continued trending higher in the third quarter of 2023 and are now at levels we have not seen since the fall of 2000. Mortgage rates are tied to the interest rate (yield) on 10-year treasuries, and they move in the opposite direction of the economy. Unfortunately for mortgage rates, the economy remains relatively buoyant, and though inflation is down significantly from its high, it is still elevated. These major factors and many minor ones are pushing Treasury yields higher, which is pushing mortgage rates up. Given the current position of the Federal Reserve, which intends to keep rates “higher for longer,” it is unlikely that home buyers will get much reprieve when it comes to borrowing costs any time soon.
With such a persistently positive economy, I have had to revise my forecast yet again. I now believe rates will hold at current levels before starting to trend down in the spring of next year.
Nevada Days on Market
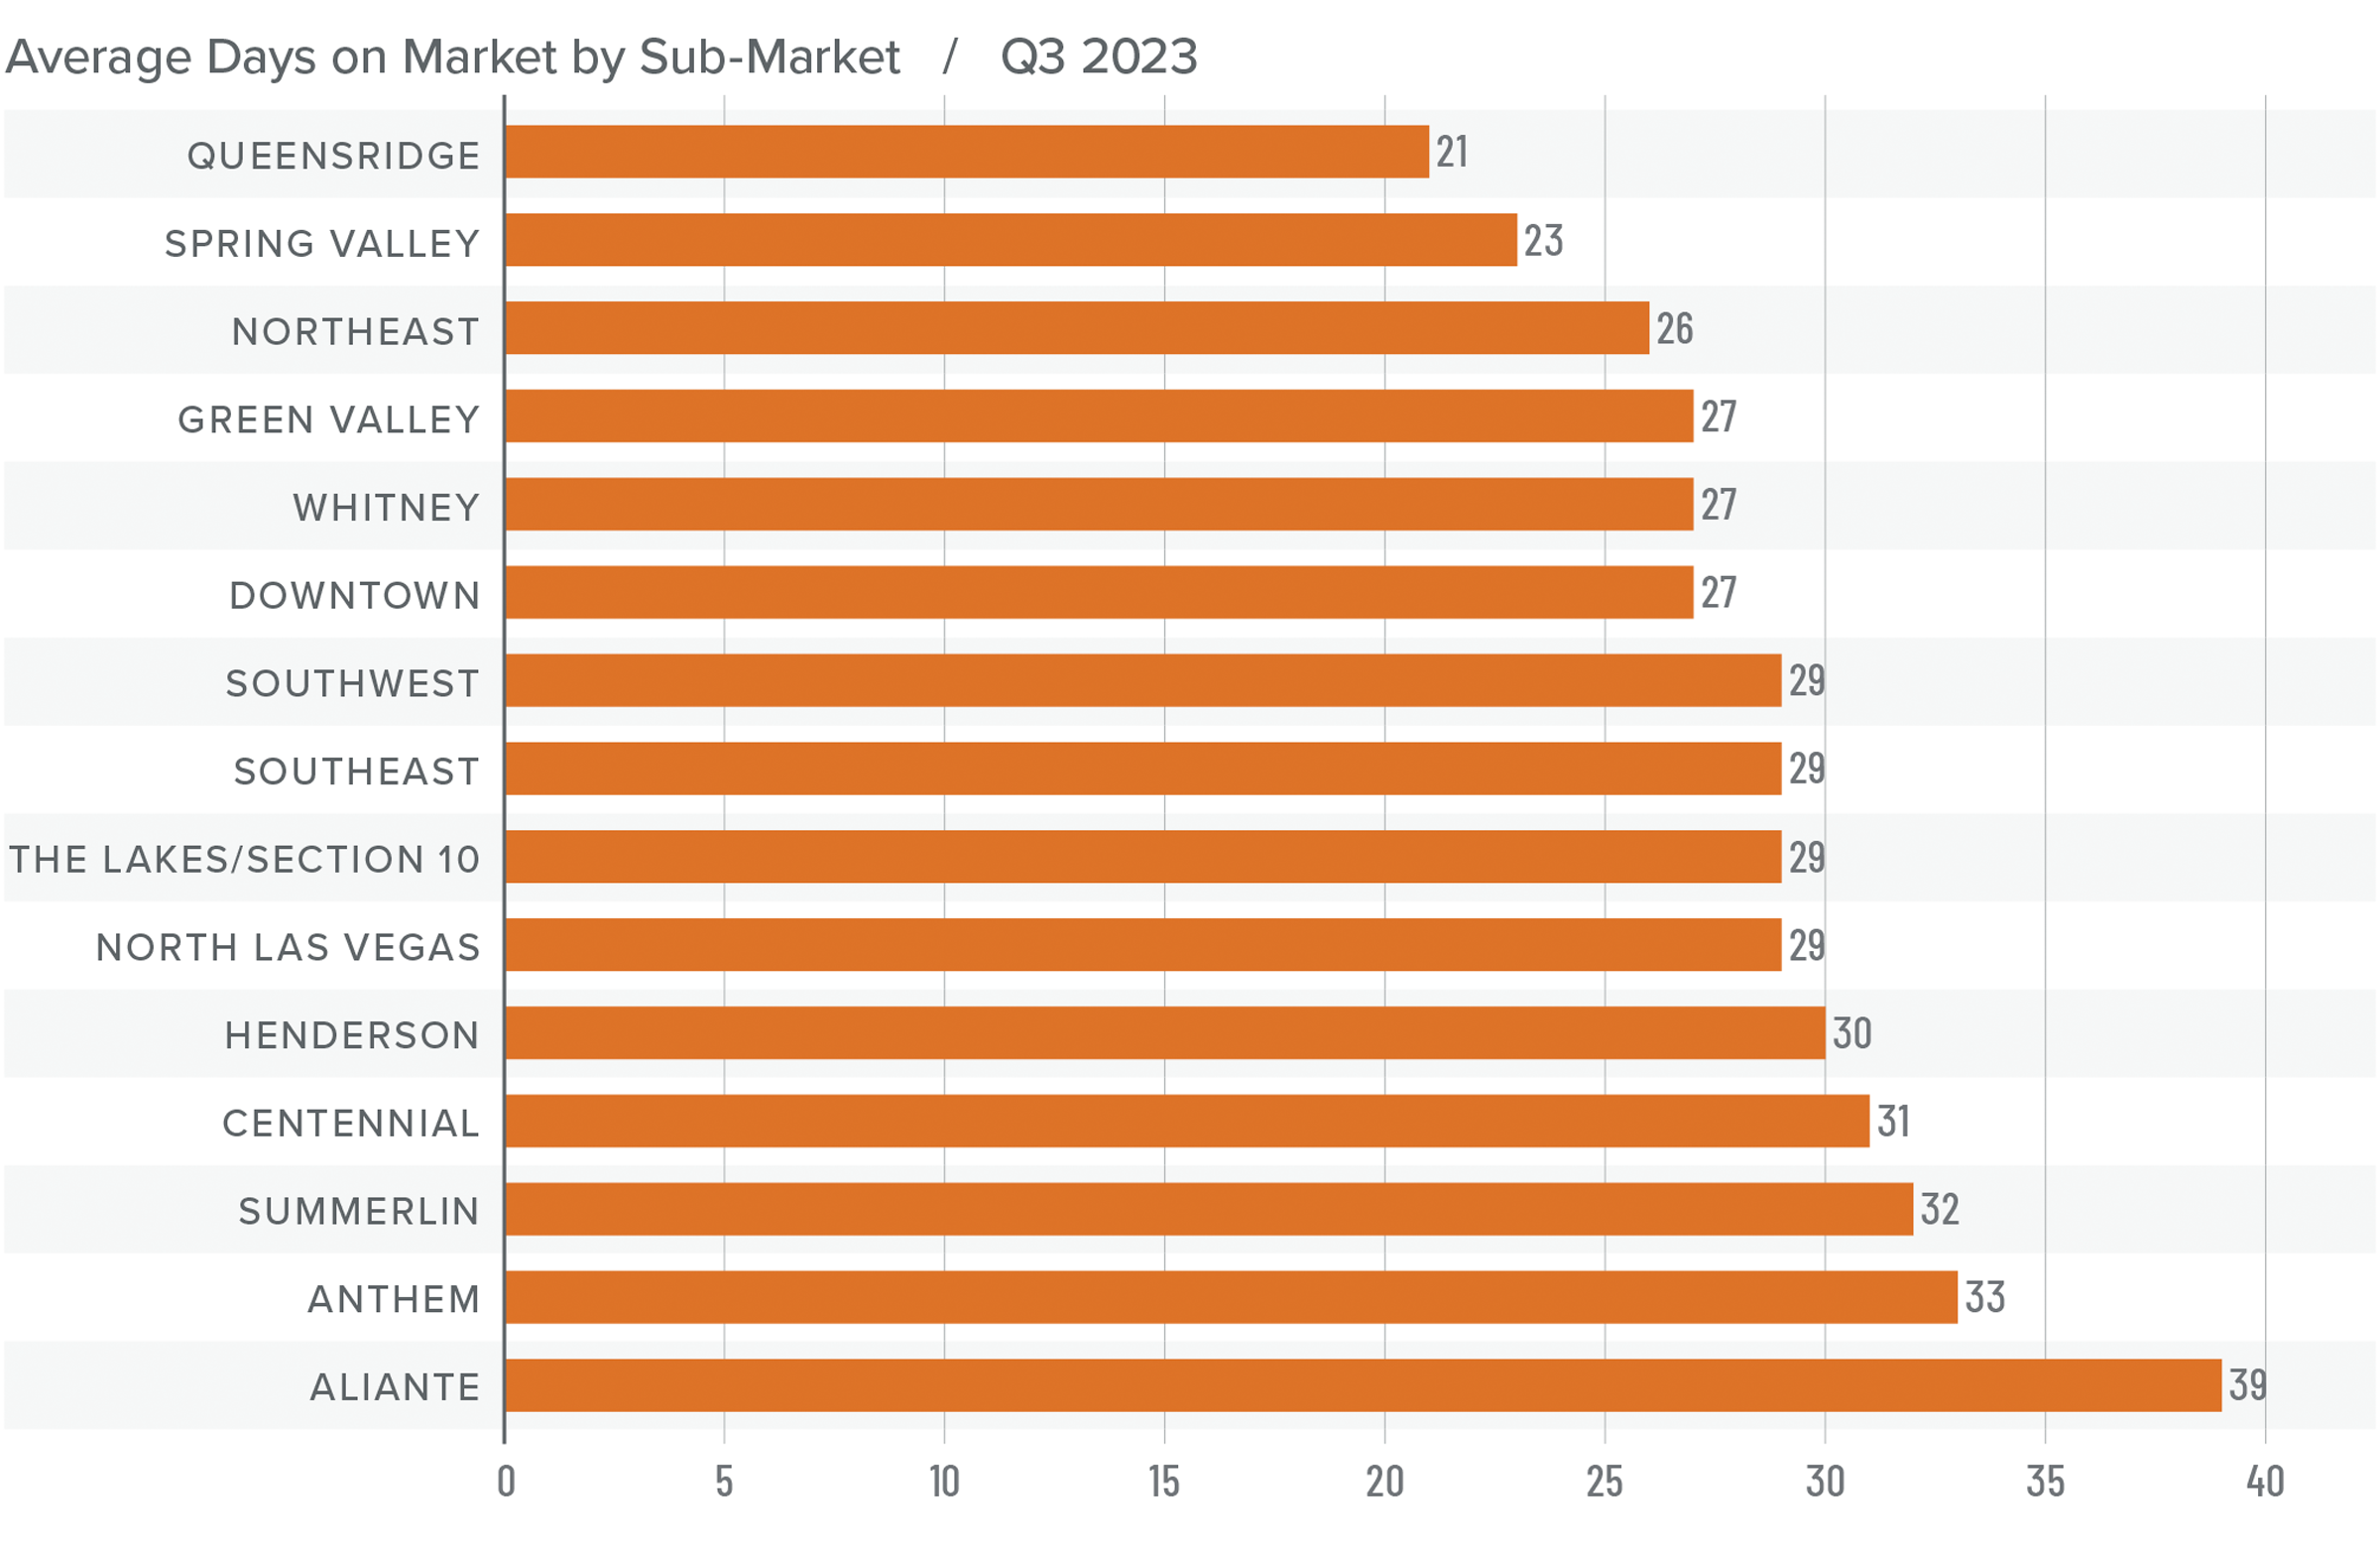
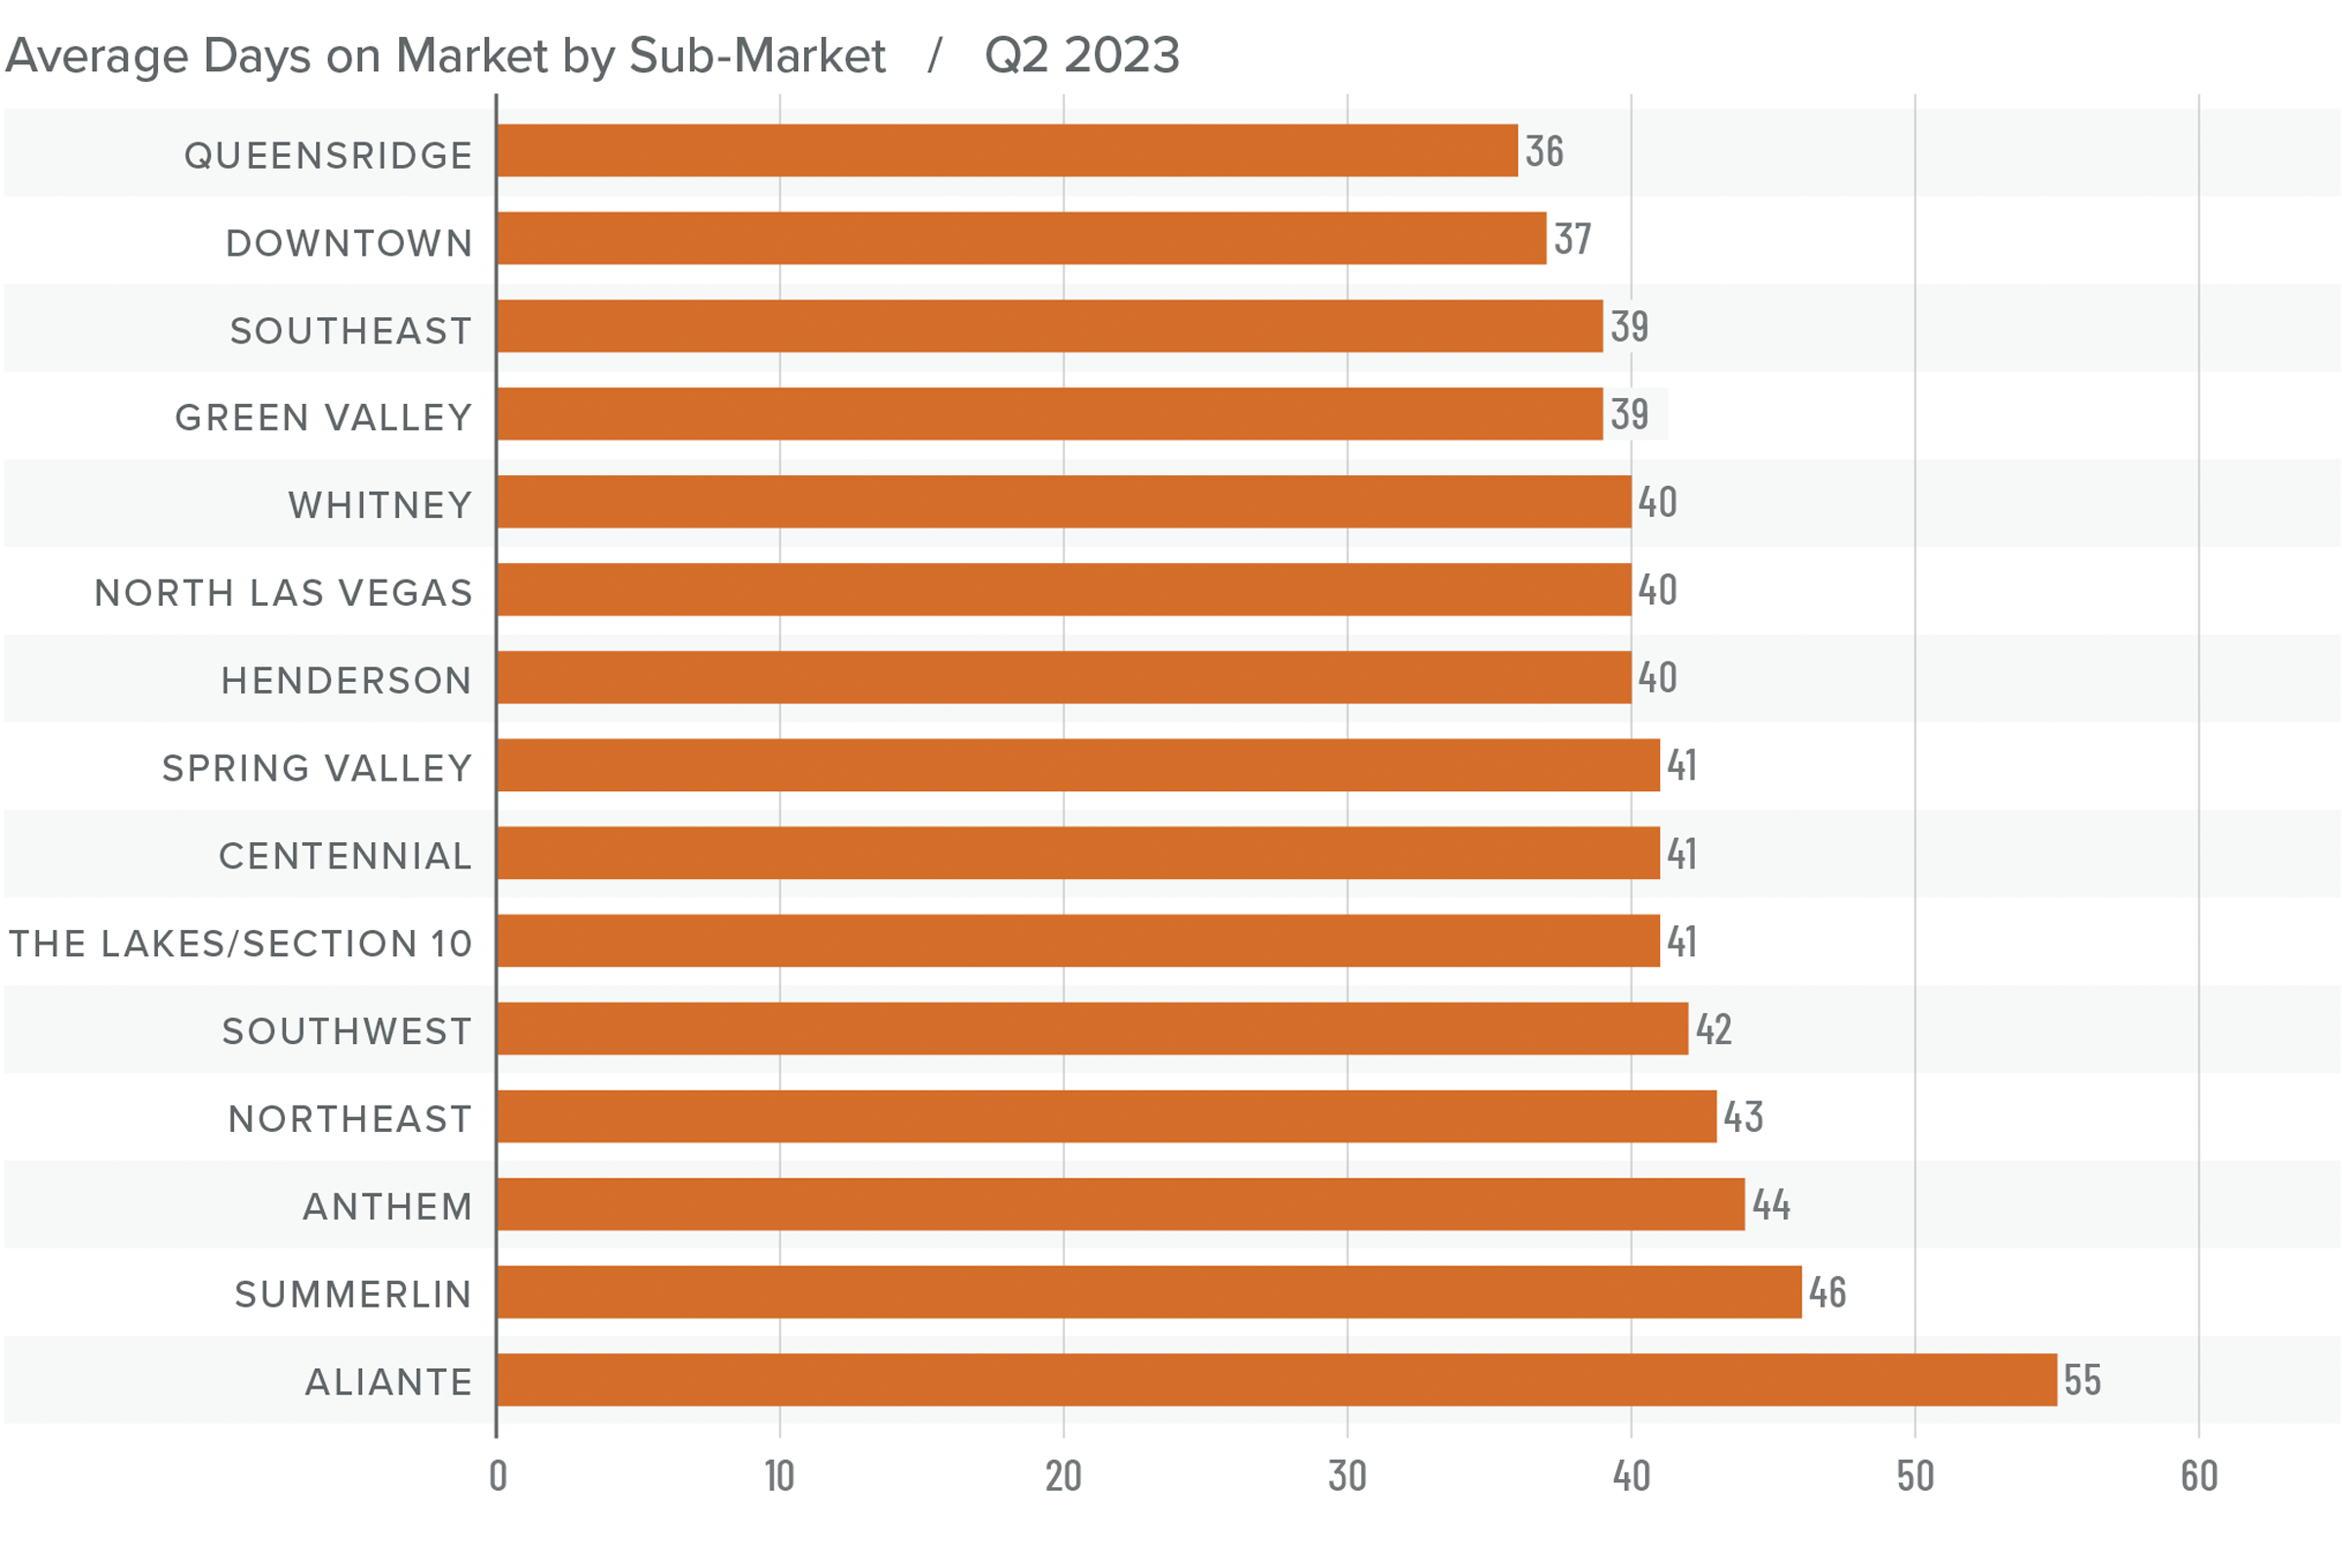
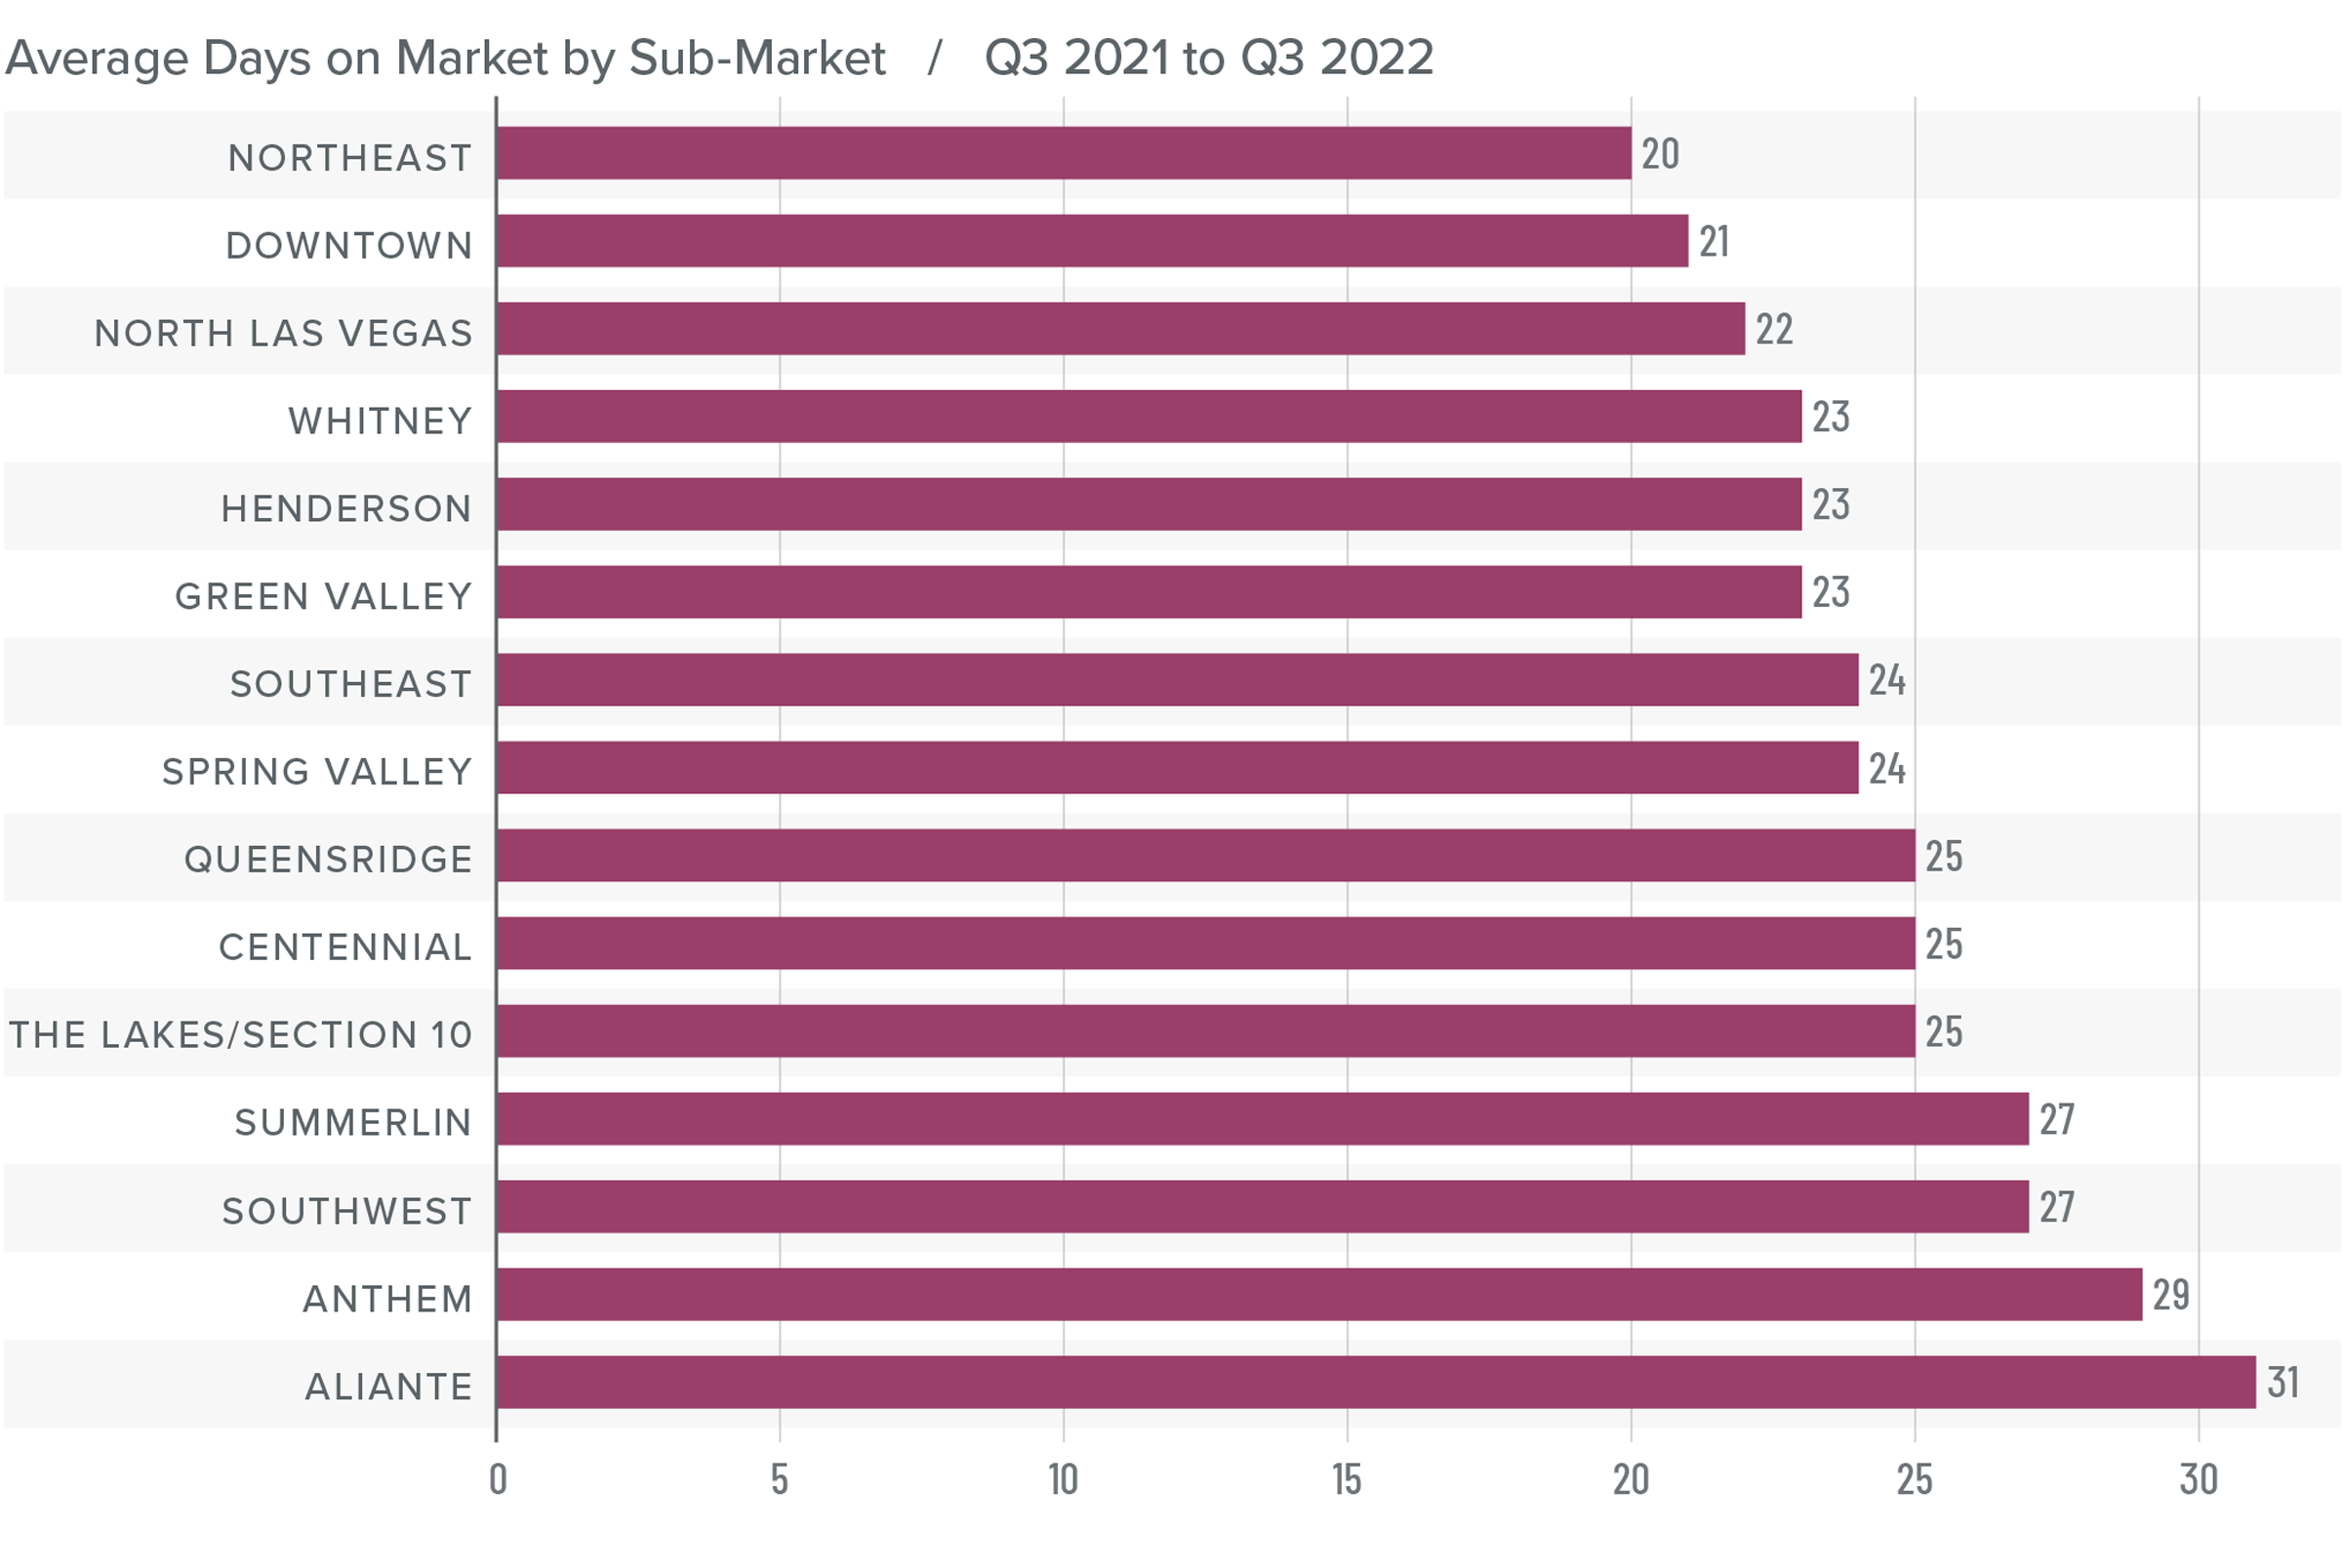
❱ The average time it took to sell a home in the region rose four days from the third quarter of 2022.
❱ It took an average of 29 days to sell a home in the third quarter, which was 13 fewer days than it took in the second quarter of 2023.
❱ Days on market rose in all neighborhoods except Queensridge and Spring Valley compared to the same period in 2022. However, average market time fell in every neighborhood compared to the second quarter of this year.
❱ Low inventory levels combined with buyers who were likely rushing to lock in mortgage rates that were still in the 6% range at the start of the quarter clearly created competitive market conditions.
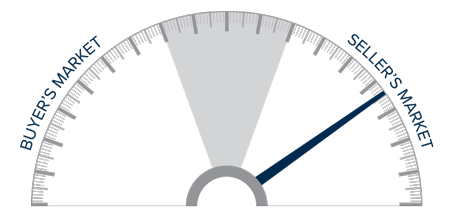
Conclusions
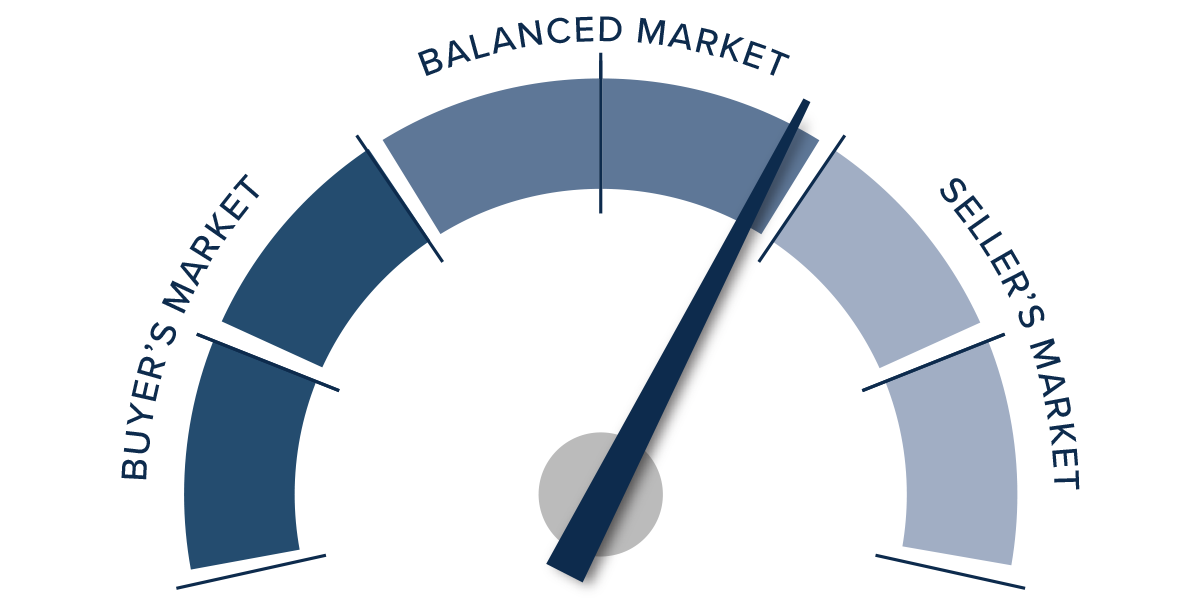
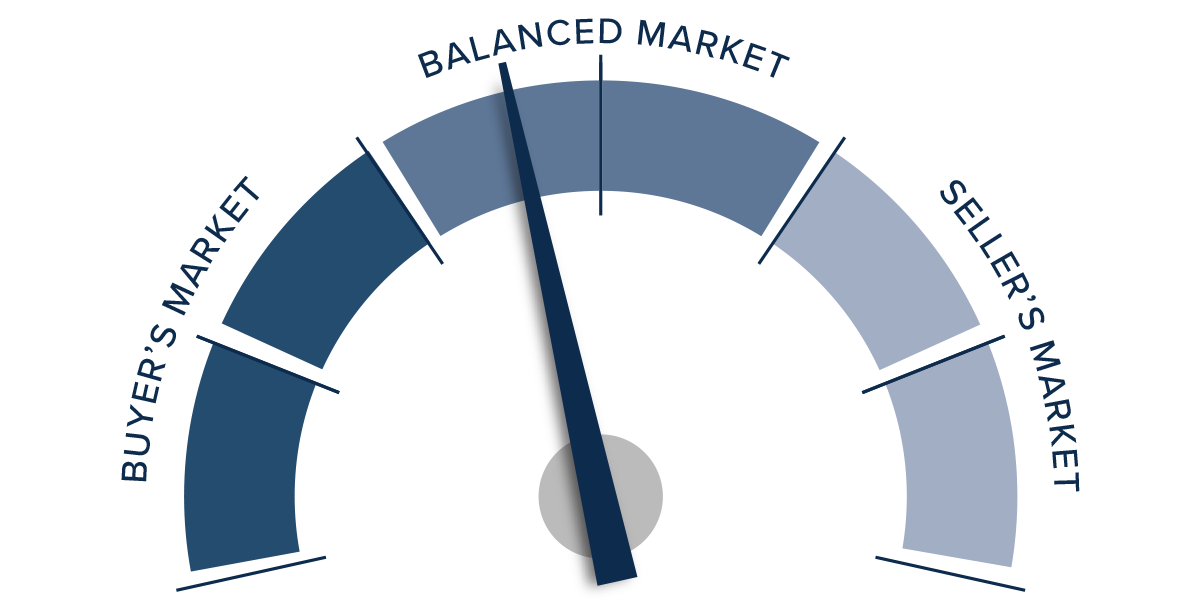
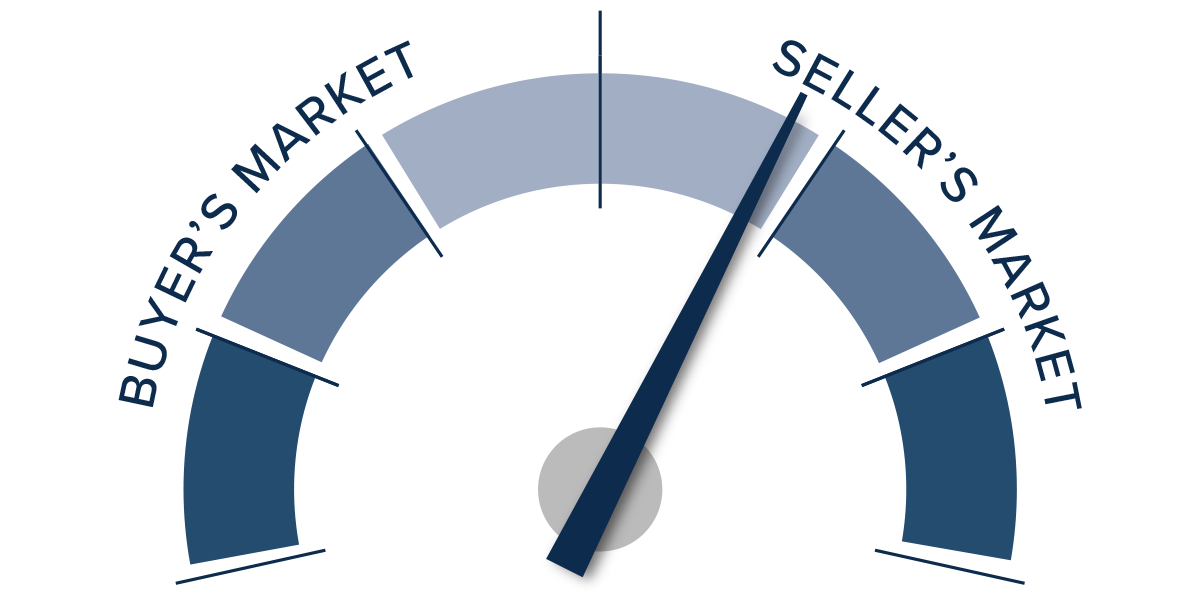
This speedometer reflects the state of the region’s real estate market using housing inventory, price gains, home sales, interest rates, and larger economic factors.
With pending and closed sales lower than earlier in the year and list prices not rising, one might infer that the market is starting to shift in favor of home buyers, but it’s uncertain this is the case.
In the second quarter market update it was suggested that the market was essentially in balance, albeit very slightly tilted toward sellers. Today, there is still a balance between buyers and sellers: limited inventory favors sellers, but lack of price growth favors home buyers (even if they are faced with significantly higher mortgage rates).
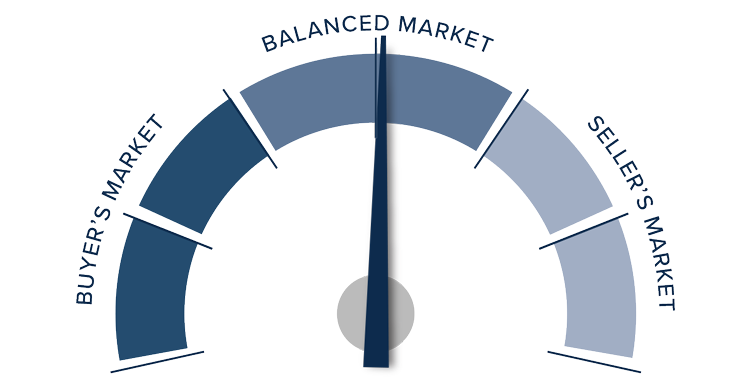
As such, the needle stays in the balanced quadrant, but it’s moved from very modestly favoring sellers to a more neutral position.
Q2 2023 Nevada Real Estate Market Update
The following analysis of select counties of the greater Las Vegas real estate market is provided by Windermere Real Estate Chief Economist Matthew Gardner. We hope that this information may assist you with making better-informed real estate decisions. For further information about the housing market in your area, please don’t hesitate to contact your Windermere Real Estate agent.
Regional Economic Overview
Clark County continues to add jobs, but the pace of growth has started to taper. The market has added 49,200 new jobs over the past 12 months. Although that was the slowest annual growth rate since before the pandemic, it still represents an impressive increase of 4.6%. The non-seasonally adjusted jobless rate in May was a respectable 5.6%. This was up .01% over April, but down from 8.1% the second quarter of 2022. When adjusted for seasonality, the rate was also 5.6%, down from 5.9% in the second quarter of 2022. My latest employment forecast for the Las Vegas metro area suggests that employment growth will continue to taper, but that over 43,000 new jobs will have been created in 2023.
Nevada Home Sales
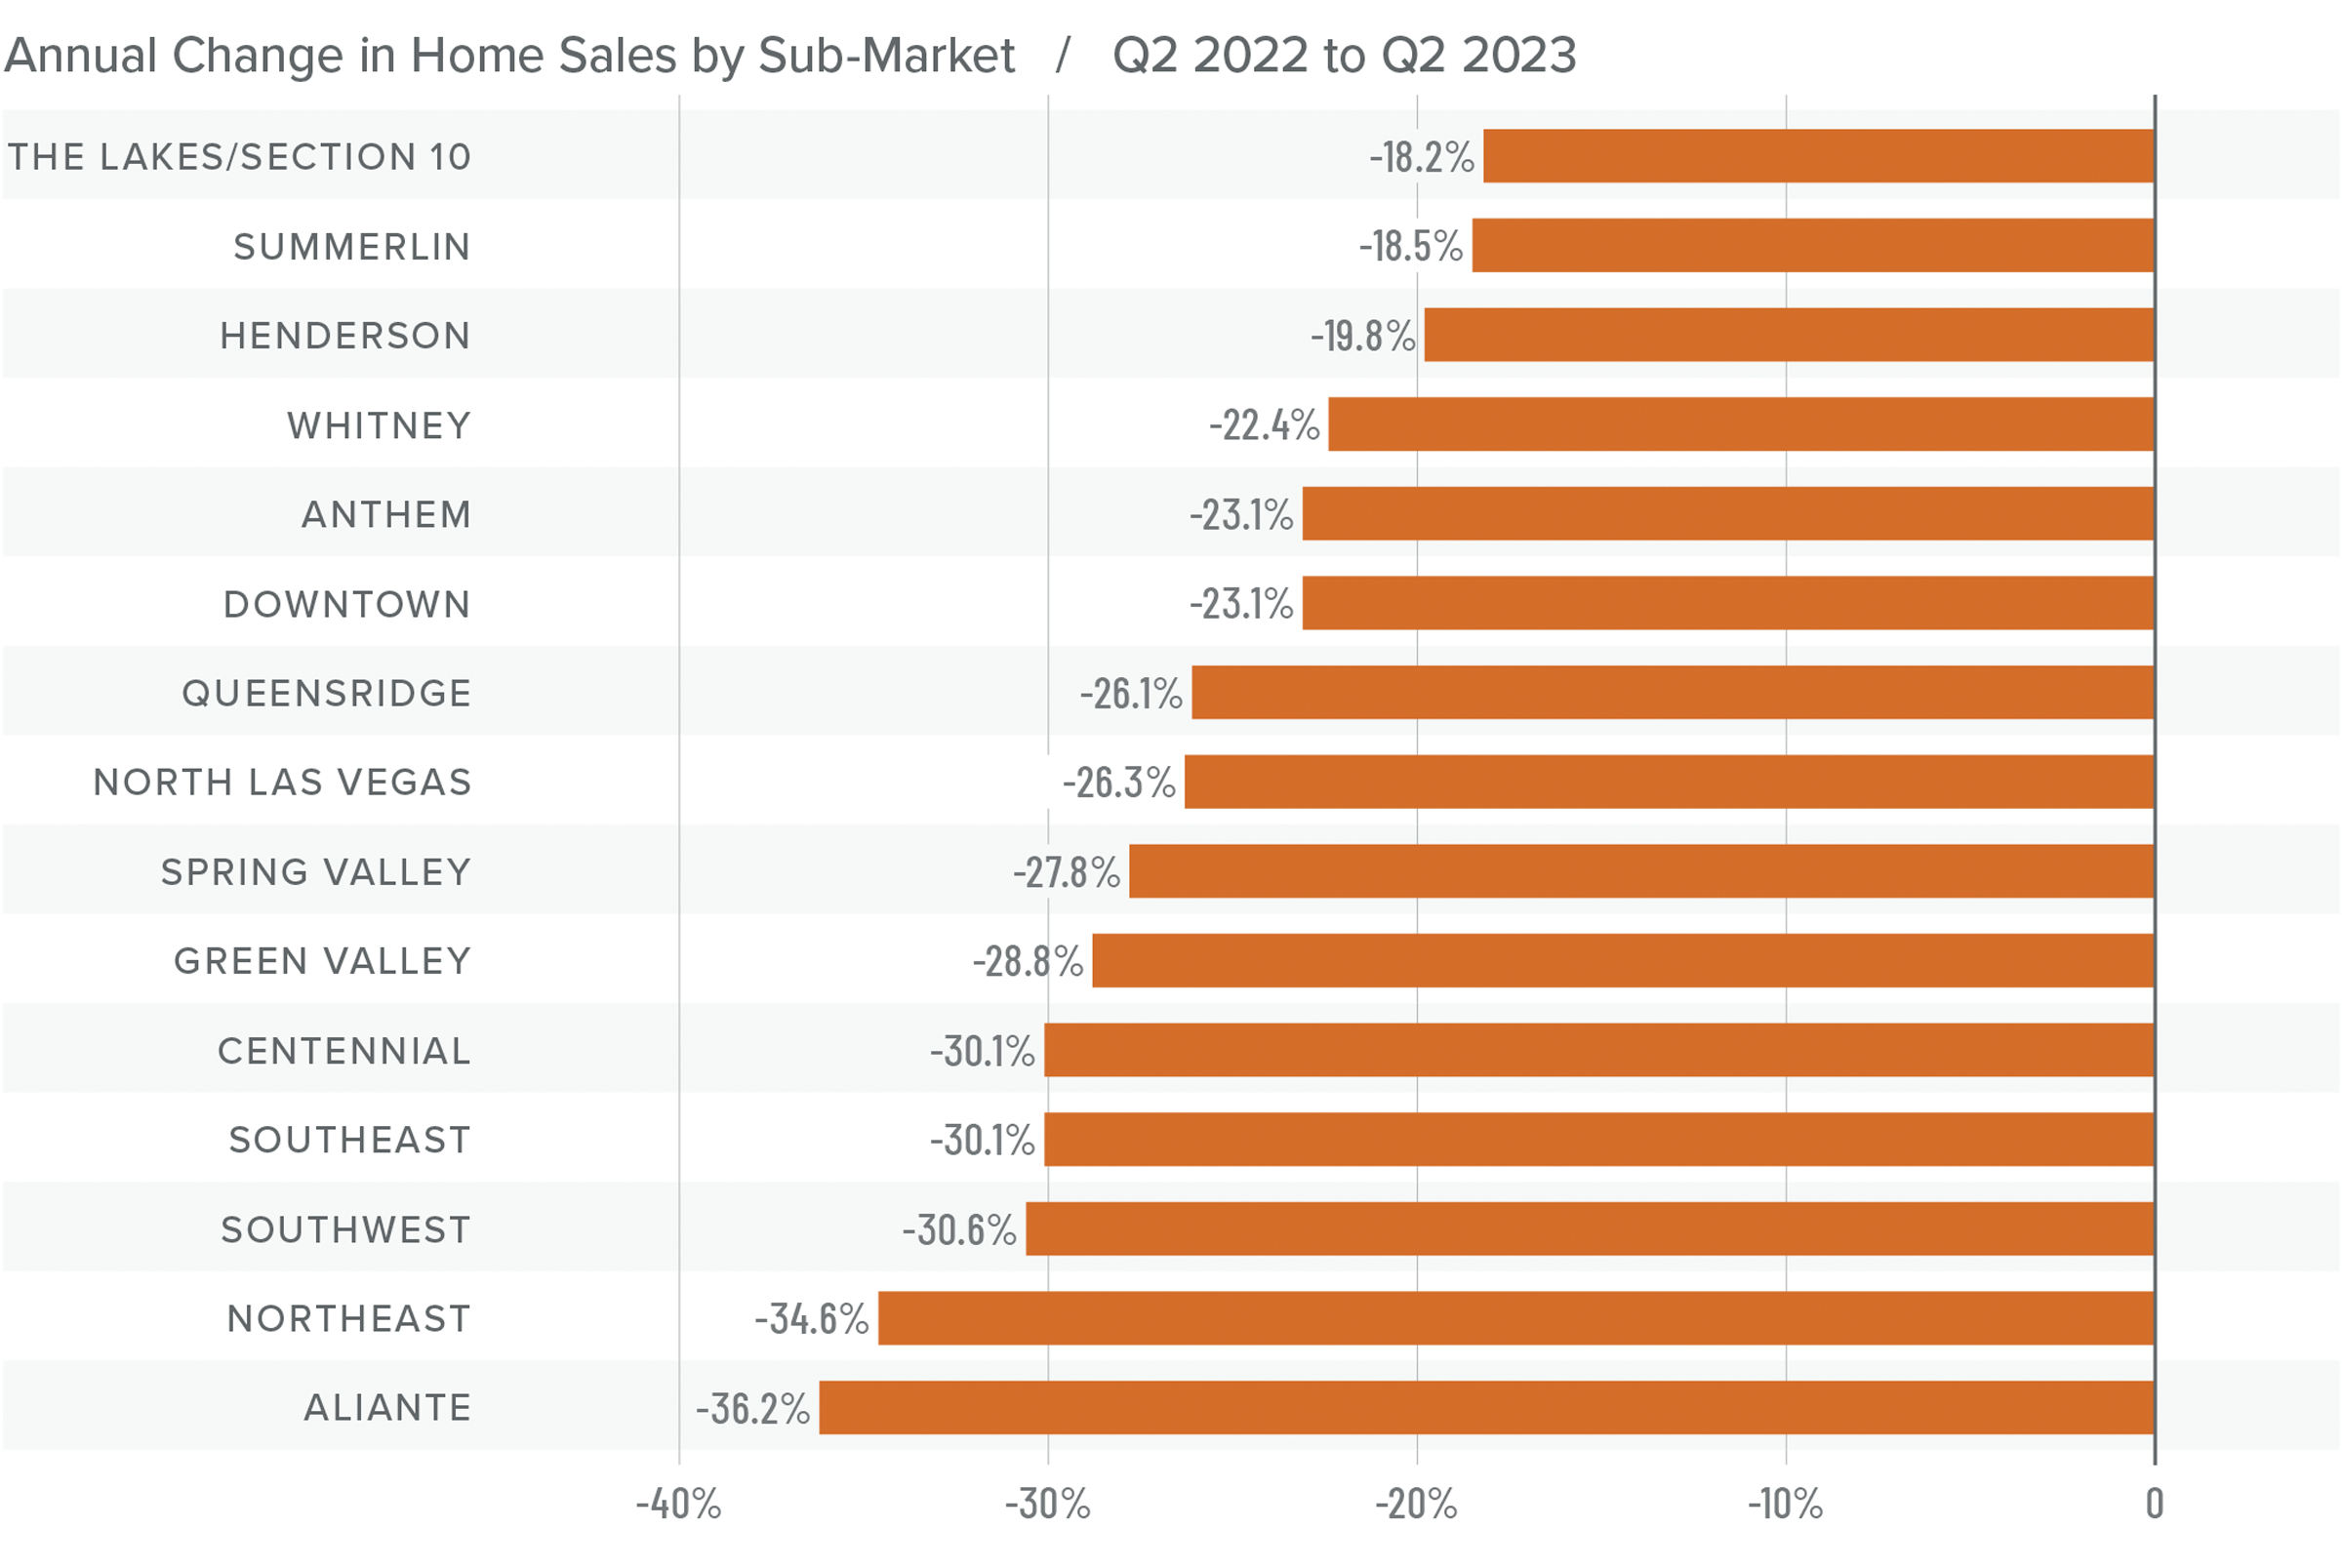
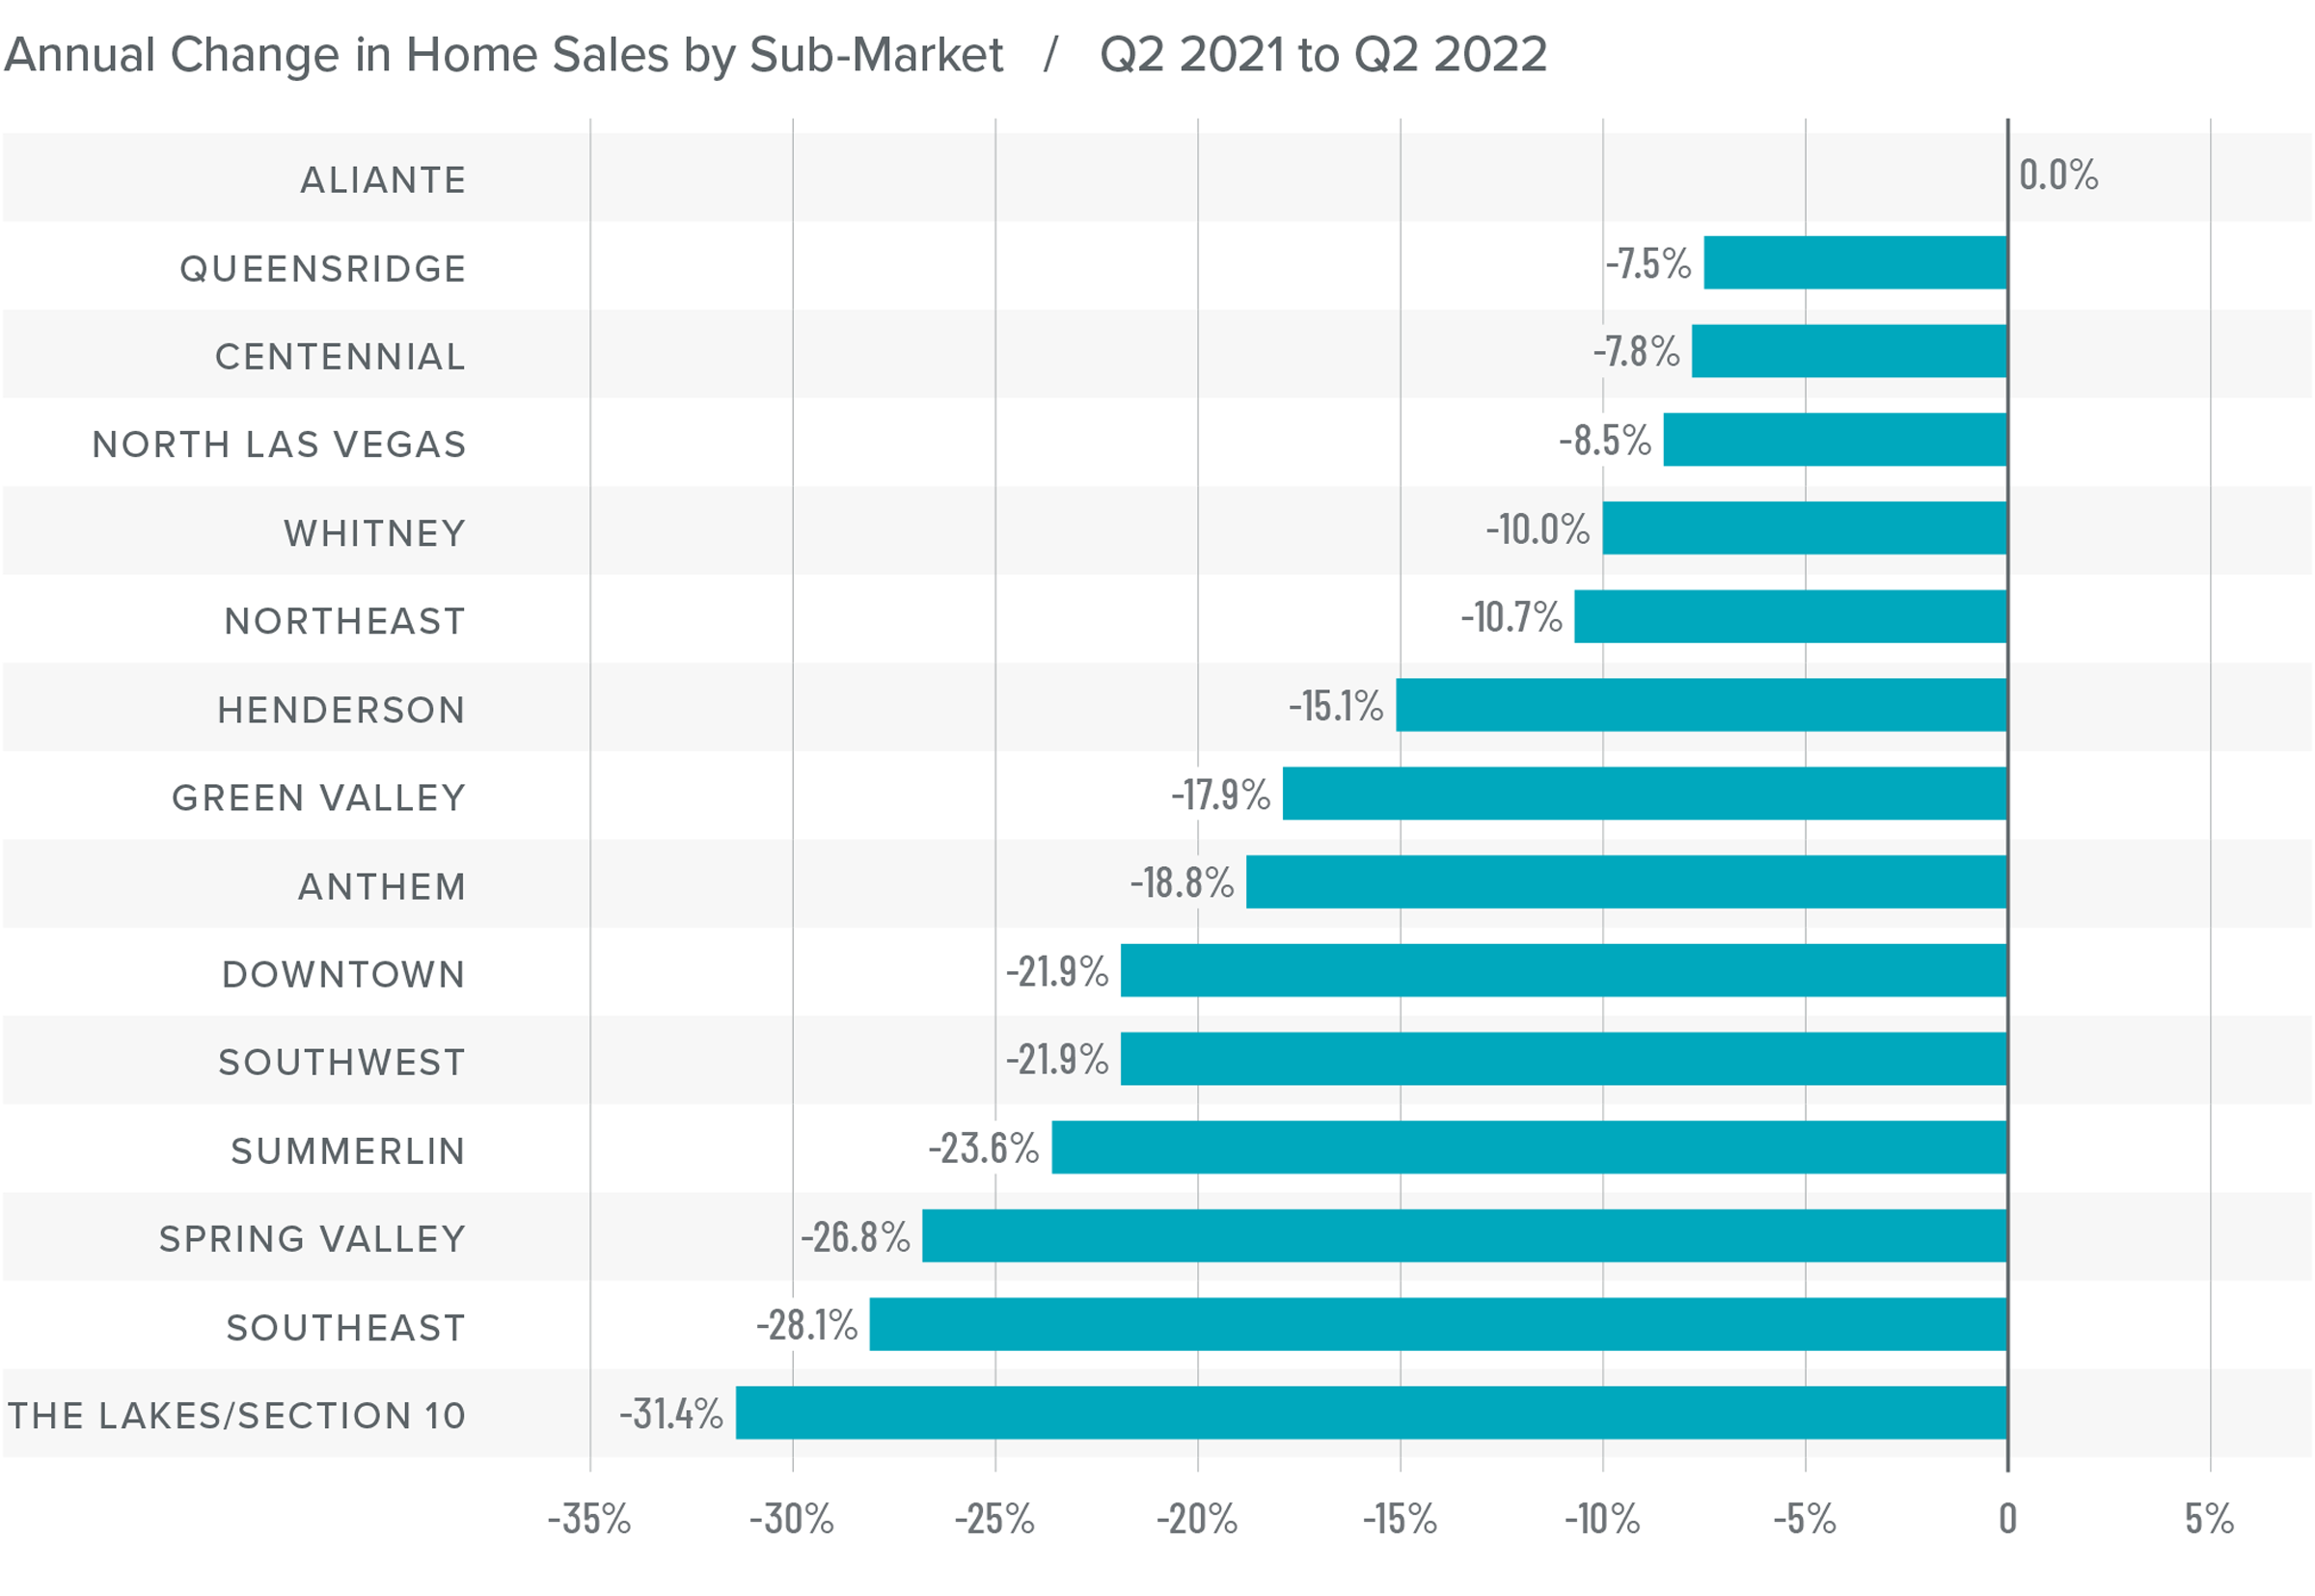
❱ A total of 6,908 homes sold in the second quarter of the year, which was a drop of 26.3% compared to the second quarter of 2022. However, sales continued the upward momentum we saw in the first quarter and were an impressive 23.7% higher than in the first quarter of the year.
❱ Year over year, sales fell significantly across the board. However, sales rose in every neighborhood compared to the first quarter of 2023. Every area except Aliante, The Lakes/Section 8, and Northeast Las Vegas saw double-digit gains.
❱ Even more impressive was the fact that sales rose from the first quarter despite the 2.5% drop in the average number of homes for sale.
❱ Pending sales, which are an indicator of future closings, rose 10.7% compared to the first quarter, suggesting that the market may see further growth in sales in the third quarter of 2023.
Nevada Home Prices
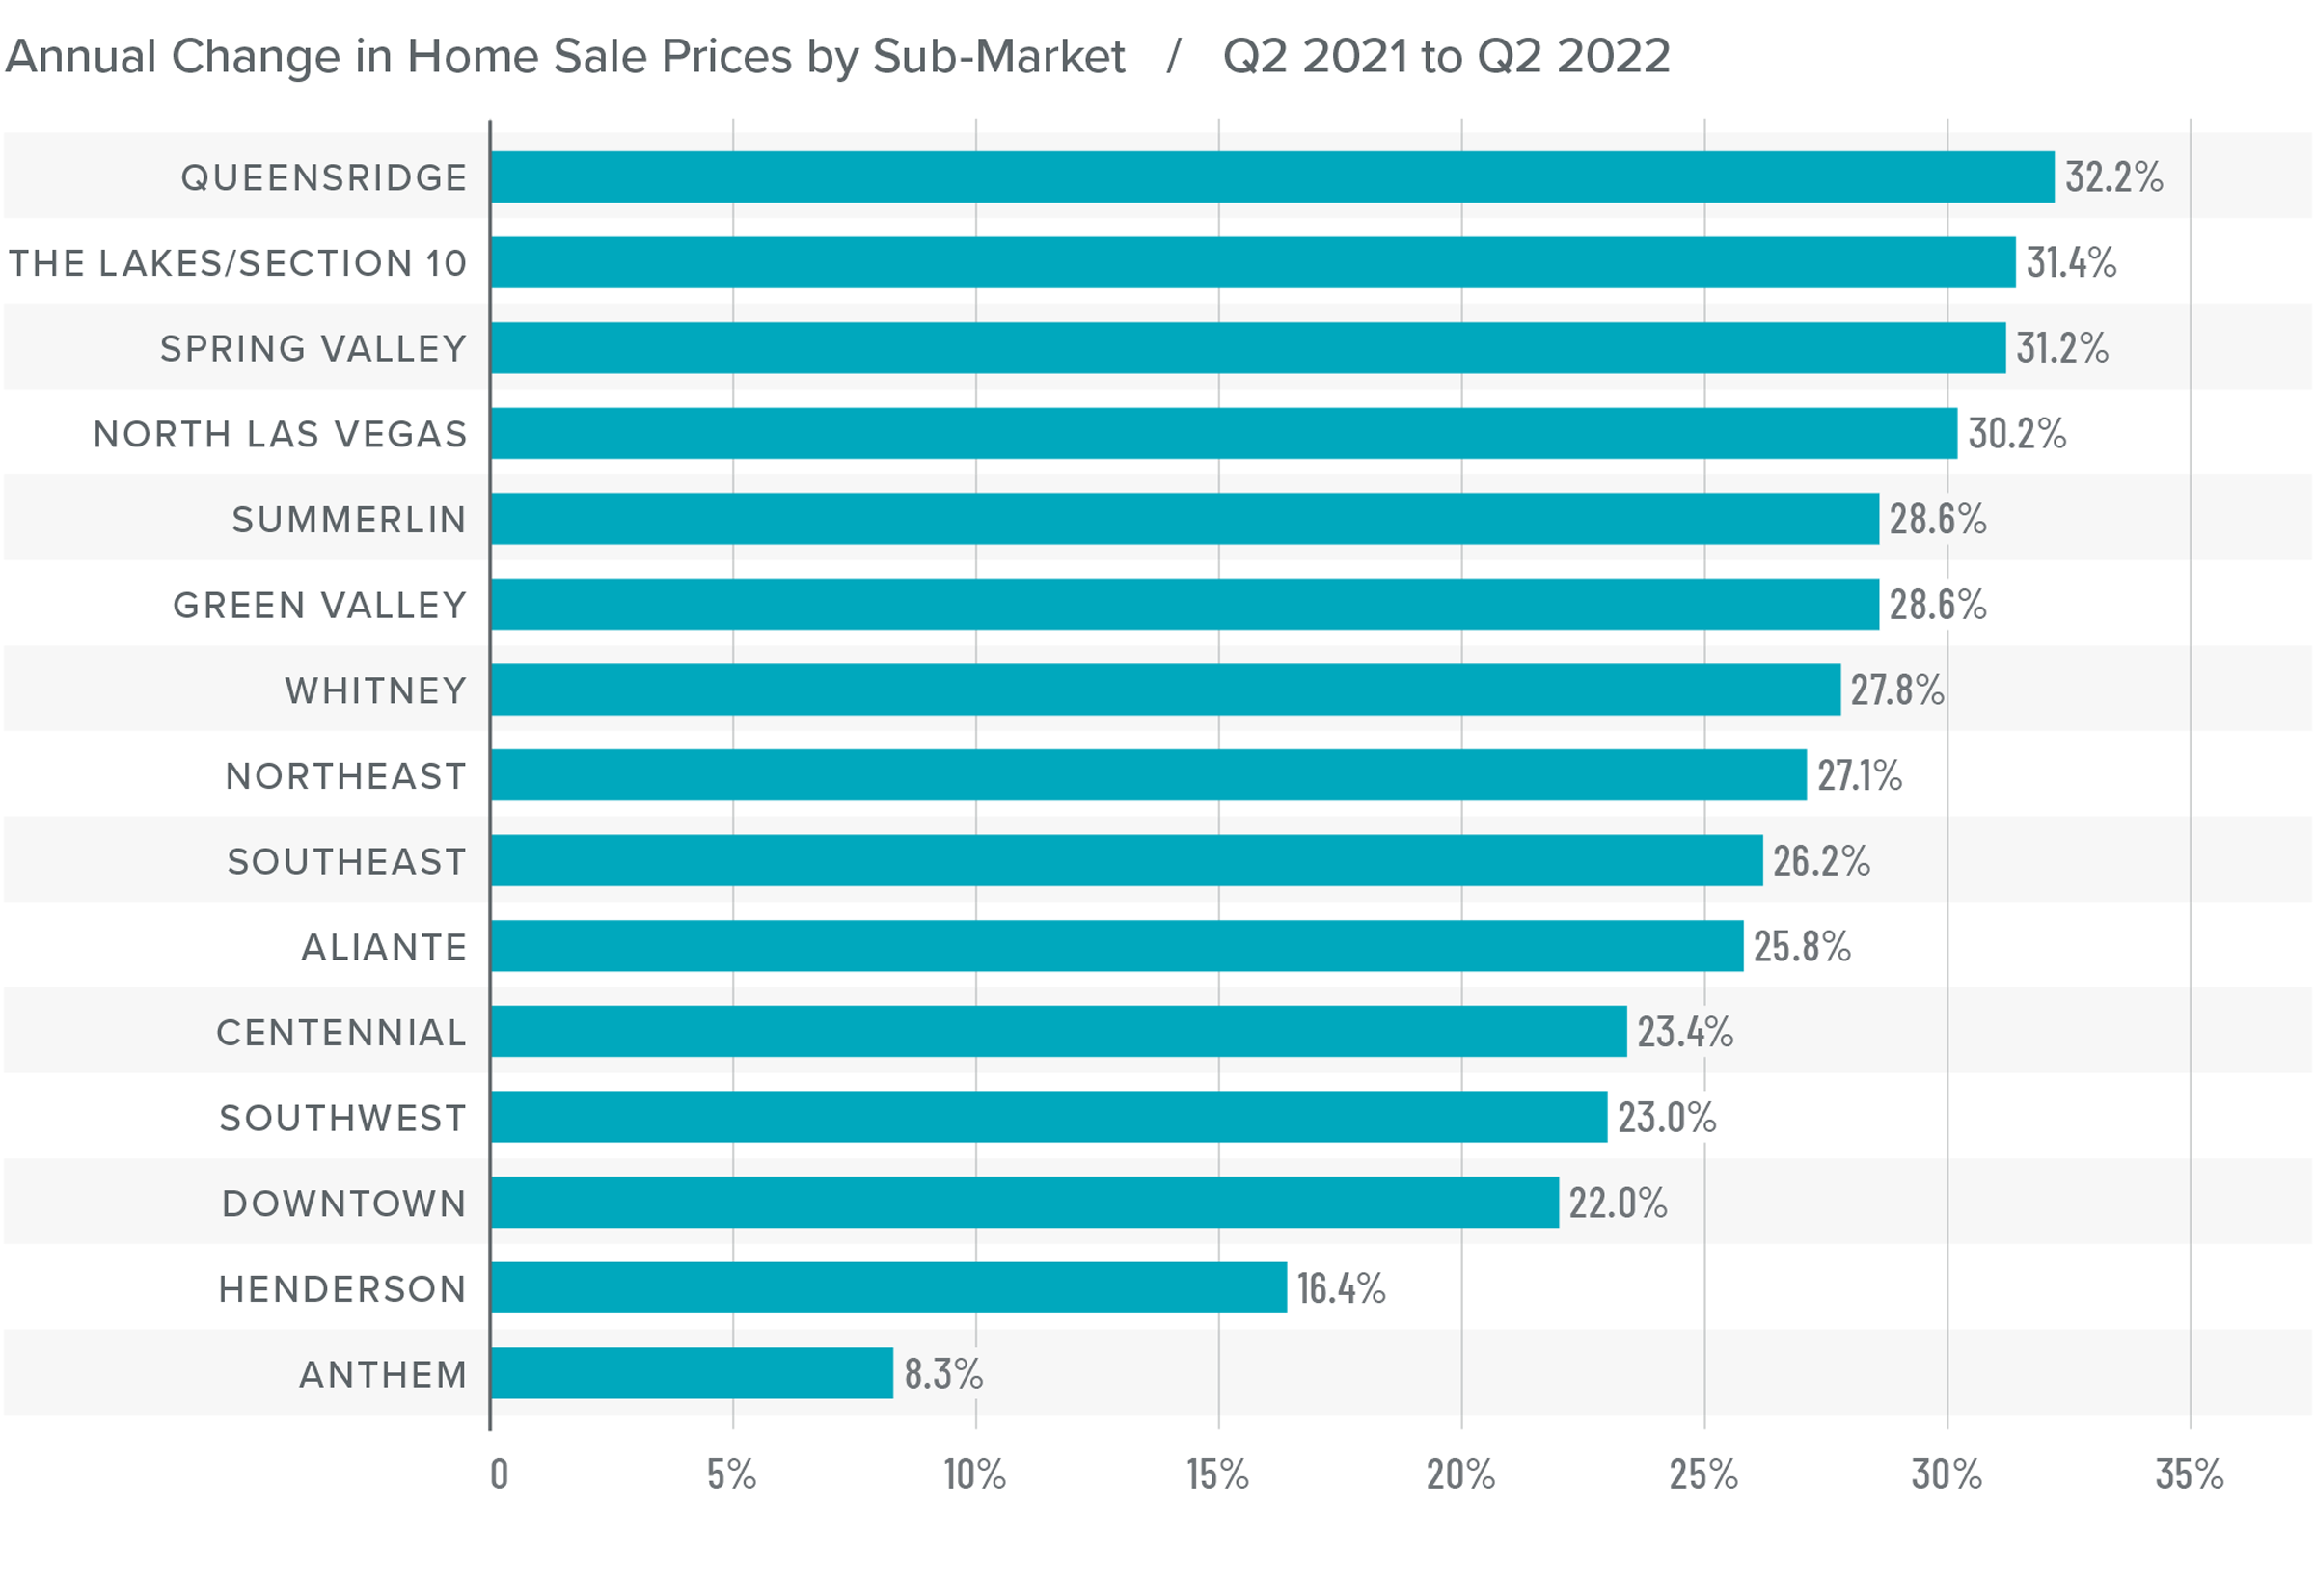
❱ Sale prices fell 10.5% year over year but rose 2.1% compared to the first quarter of 2023. The average home sale price in the area was $481,581.
❱ Median list prices rose 3.9% from the first quarter of the year. The only neighborhood where list prices fell was in Southeast Las Vegas. Even there, the decline was a very modest 1.3%.
❱ Year over year, prices fell in every market other than Downtown. However, compared to the first quarter of this year, prices rose across the board.
❱ It would be natural to think that prices should have fallen further given deteriorating affordability and far higher mortgage rates than we have seen in a number of years; however, that does not appear to be the case.
Mortgage Rates
Although they were less erratic than the first quarter, mortgage rates unfortunately trended higher and ended the quarter above 7%. This was due to the short debt ceiling impasse, as well as several economic datasets that suggested the U.S. economy was not slowing at the speed required by the Federal Reserve.
While the June employment report showed fewer jobs created than earlier in the year, as well as downward revisions to prior gains, inflation has not sufficiently slowed. Until it does, rates cannot start to trend consistently lower. With the economy not slowing as fast as expected, I have adjusted my forecast: Rates will hold at current levels in third quarter and then start to trend lower through the fall. Although there are sure to be occasional spikes, my model now shows the 30-year fixed rate breaking below 6% next spring.
Nevada Days on Market
❱ The average time it took to sell a home in the region rose 26 days compared to the second quarter of 2022.
❱ It took an average of 42 days to sell a home in the second quarter, which was 13 fewer days than it took in the first quarter of 2023.
❱ Days on market rose in all neighborhoods compared to the same period in 2022. However, average market time fell in every neighborhood compared to the first quarter of this year.
❱ Tighter inventory levels are offsetting higher financing costs, which is lowering average market time.
Conclusions
This speedometer reflects the state of the region’s real estate market using housing inventory, price gains, home sales, interest rates, and larger economic factors.
Just when you think you can write off Las Vegas, it comes back to prove you wrong. The area’s housing market is resilient and is likely to continue being that way. Every index other than mortgage rates is favoring sellers right now. Inventory levels are down. Pending and closed sales are up, as are list and sale prices.
While the market currently favors home sellers, they are not in a completely dominant position. That said, given everything I’ve shared in this report, I have pushed the needle more in their favor.
About Matthew Gardner

As Chief Economist for Windermere Real Estate, Matthew Gardner is responsible for analyzing and interpreting economic data and its impact on the real estate market on both a local and national level. Matthew has over 30 years of professional experience both in the U.S. and U.K.
In addition to his day-to-day responsibilities, Matthew sits on the Washington State Governors Council of Economic Advisors; chairs the Board of Trustees at the Washington Center for Real Estate Research at the University of Washington; and is an Advisory Board Member at the Runstad Center for Real Estate Studies at the University of Washington where he also lectures in real estate economics.
Q1 2023 Nevada Real Estate Market Update

The following analysis of select counties of the greater Las Vegas real estate market is provided by Windermere Real Estate Chief Economist Matthew Gardner. We hope that this information may assist you with making better-informed real estate decisions. For further information about the housing market in your area, please don’t hesitate to contact your Windermere Real Estate agent.
Regional Economic Overview
The Las Vegas area continues to add jobs and the pace of growth remains impressive. There are currently 1.118 million people working in the metro area, which is 58,000 more than during the same period in 2022 and represents an annual growth rate of 5.5%. Although the job market remains remarkably robust, the unemployment rate continues to tick modestly higher. Though this may seem unusual, it really isn’t. The number of jobs being added is substantial, which has led the labor force to grow significantly. When people start looking for work, they are counted as “unemployed,” which can raise the jobless rate. The non-seasonally adjusted unemployment rate in February was 6%, which was up from 5.3% in the first quarter of 2022. The seasonally adjusted rate was 6.2%, which was up from 5.5% during the same period in 2022.
Nevada Home Sales
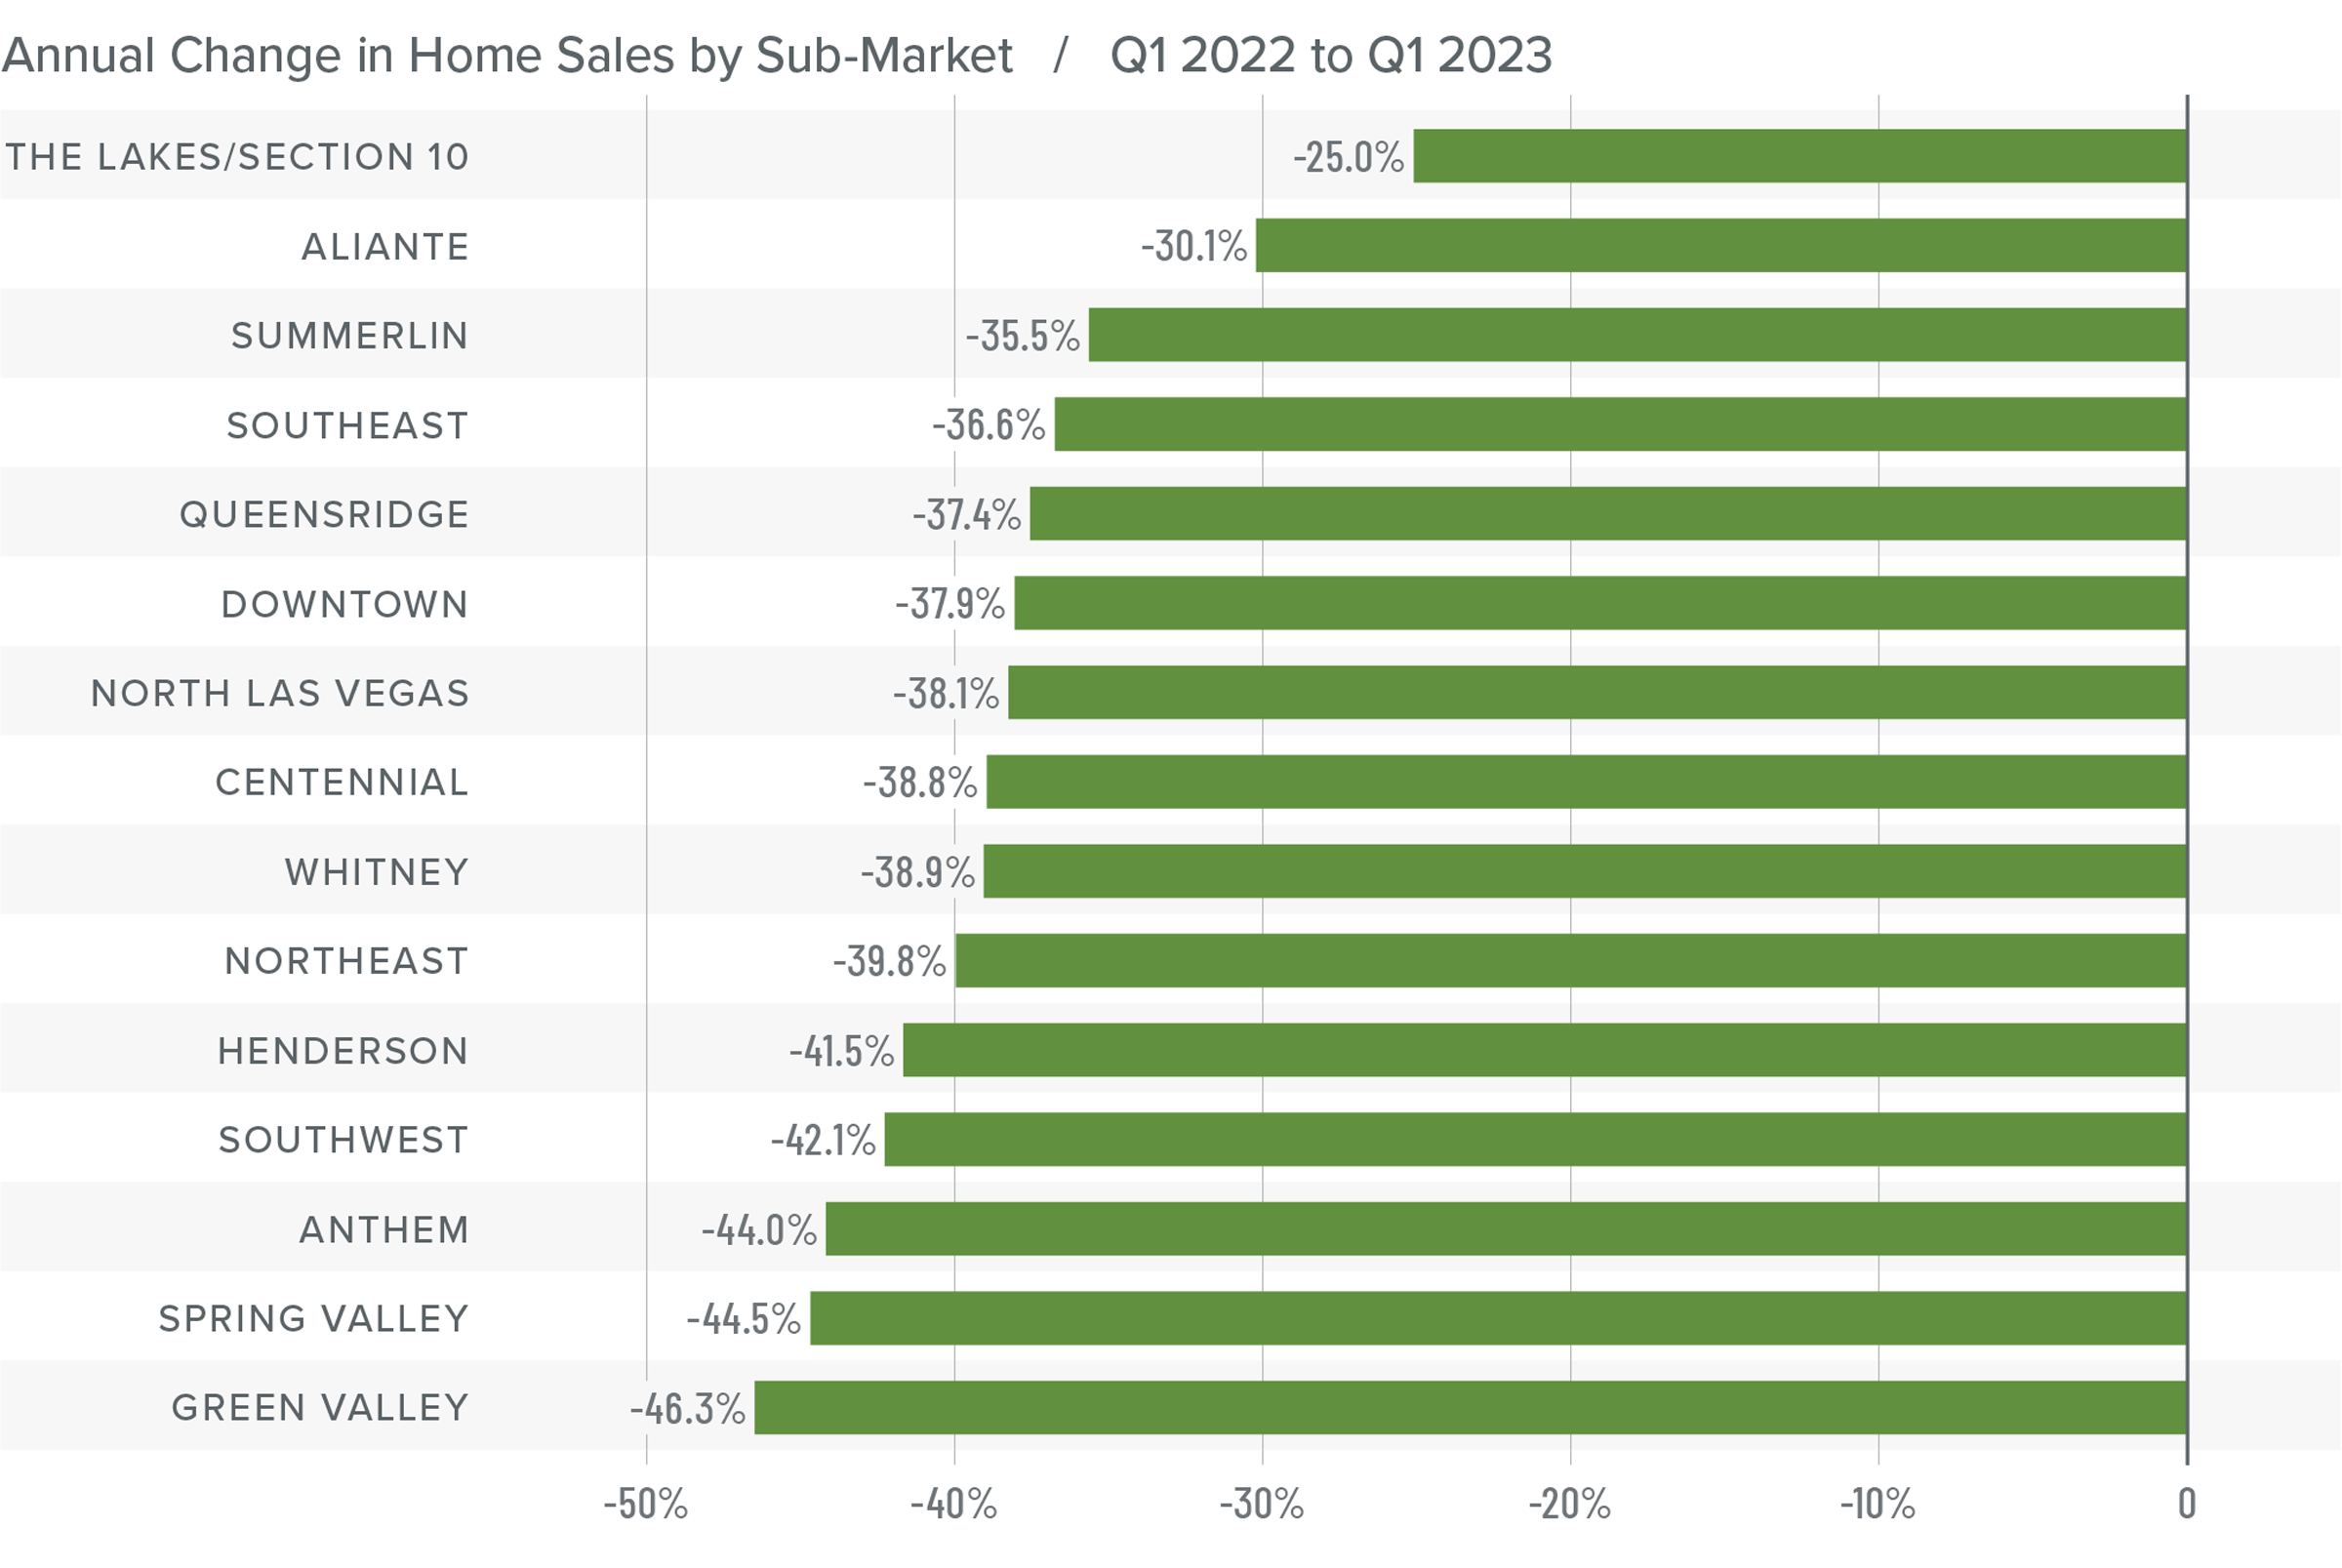
❱ A total of 5,537 homes sold in the first quarter of the year, which was a drop of 39.4% compared to the same period in 2022. Sales were up 12% from the fourth quarter of last year.
❱ Year over year, sales fell significantly in every neighborhood covered by this report. Compared to the fourth quarter of 2022, sales rose in every neighborhood except Green Valley, where there was a very modest decline.
❱ Particularly impressive was the fact that sales rose while the average number of homes for sale fell more than 32%. This can happen given the higher inventory levels we saw in the fourth quarter, but it is impressive all the same.
❱ Pending sales, which are an indicator of future closings, rose 45.4% compared to the fourth quarter, suggesting that the market may see further growth in sales in the second quarter.
Nevada Home Prices
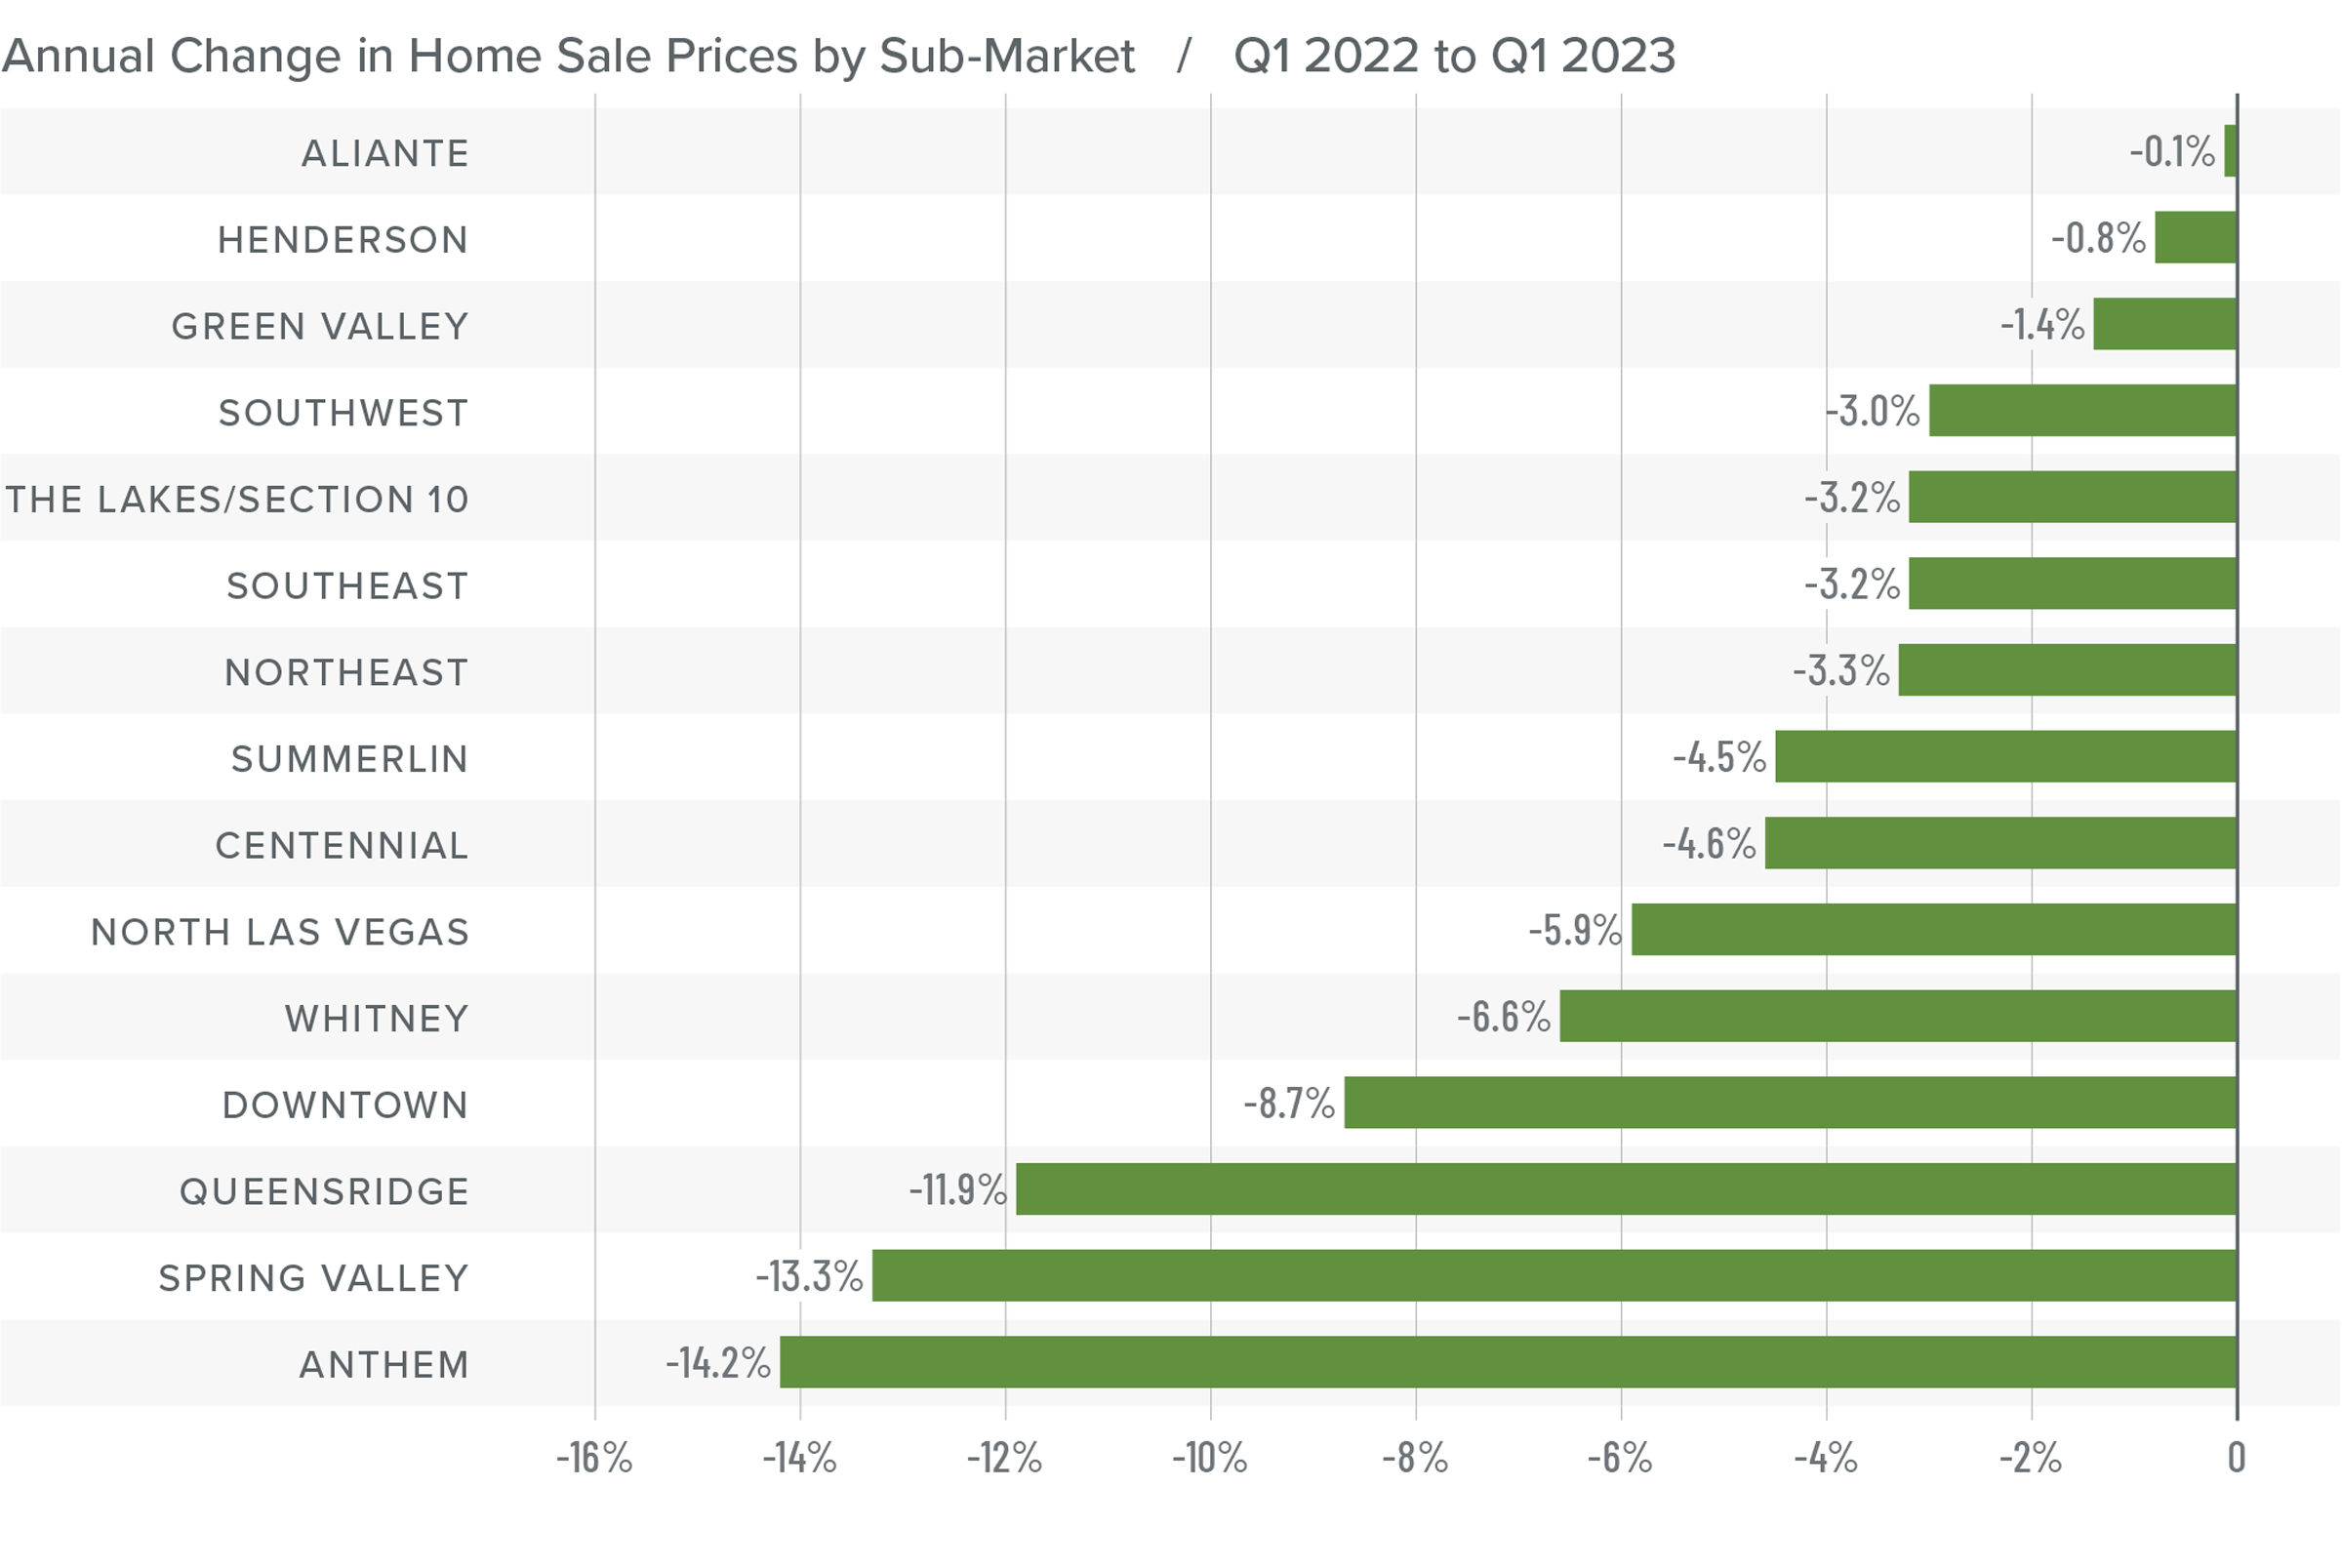
❱ If the level of sales activity was a surprise, prices decreasing by 7.2% from the first quarter of 2022 and 3.9% from the fourth quarter should make things clear: buyers were making deals.
❱ Listing prices, which are a leading indicator of the market, fell 3.9% from the final quarter of 2022. The market is clearly responding to higher financing costs. However, not all markets are the same. In Southwest Las Vegas, Summerlin, Anthem, Henderson, and The Lakes/Section 10, median listing prices rose quite significantly from the fourth quarter of 2022.
❱ Year over year, prices fell across the board. Compared to the fourth quarter of 2022, six neighborhoods saw higher prices. These were Centennial, Green Valley, The Lakes/Section 10, Southeast Las Vegas, Spring Valley, and Whitney.
❱ Nobody should be surprised to see prices fall given the rapid pace of appreciation through the pandemic period. It’s a necessary adjustment that will end later this year, at which point I expect prices to start rising again, though at a significantly slower pace.

Mortgage Rates
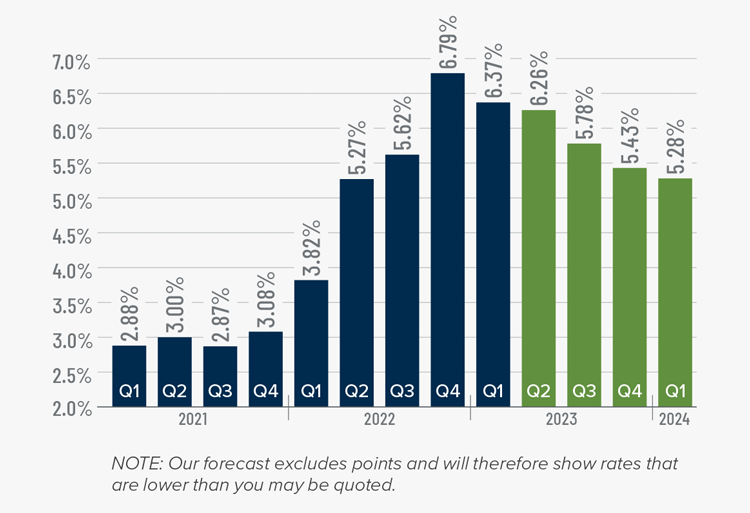
Rates in the first quarter of 2023 were far less volatile than last year, even with the brief but significant impact of early March’s banking crisis. It appears that buyers are jumping in when rates dip, which was the case in mid-January and again in early February.
Even with the March Consumer Price Index report showing inflation slowing, I still expect the Federal Reserve to raise short-term rates one more time following their May meeting before pausing rate increases. This should be the catalyst that allows mortgage rates to start trending lower at a more consistent pace than we have seen so far this year. My current forecast is that rates will continue to move lower with occasional spikes, and that they will hold below 6% in the second half of this year.
Nevada Days on Market
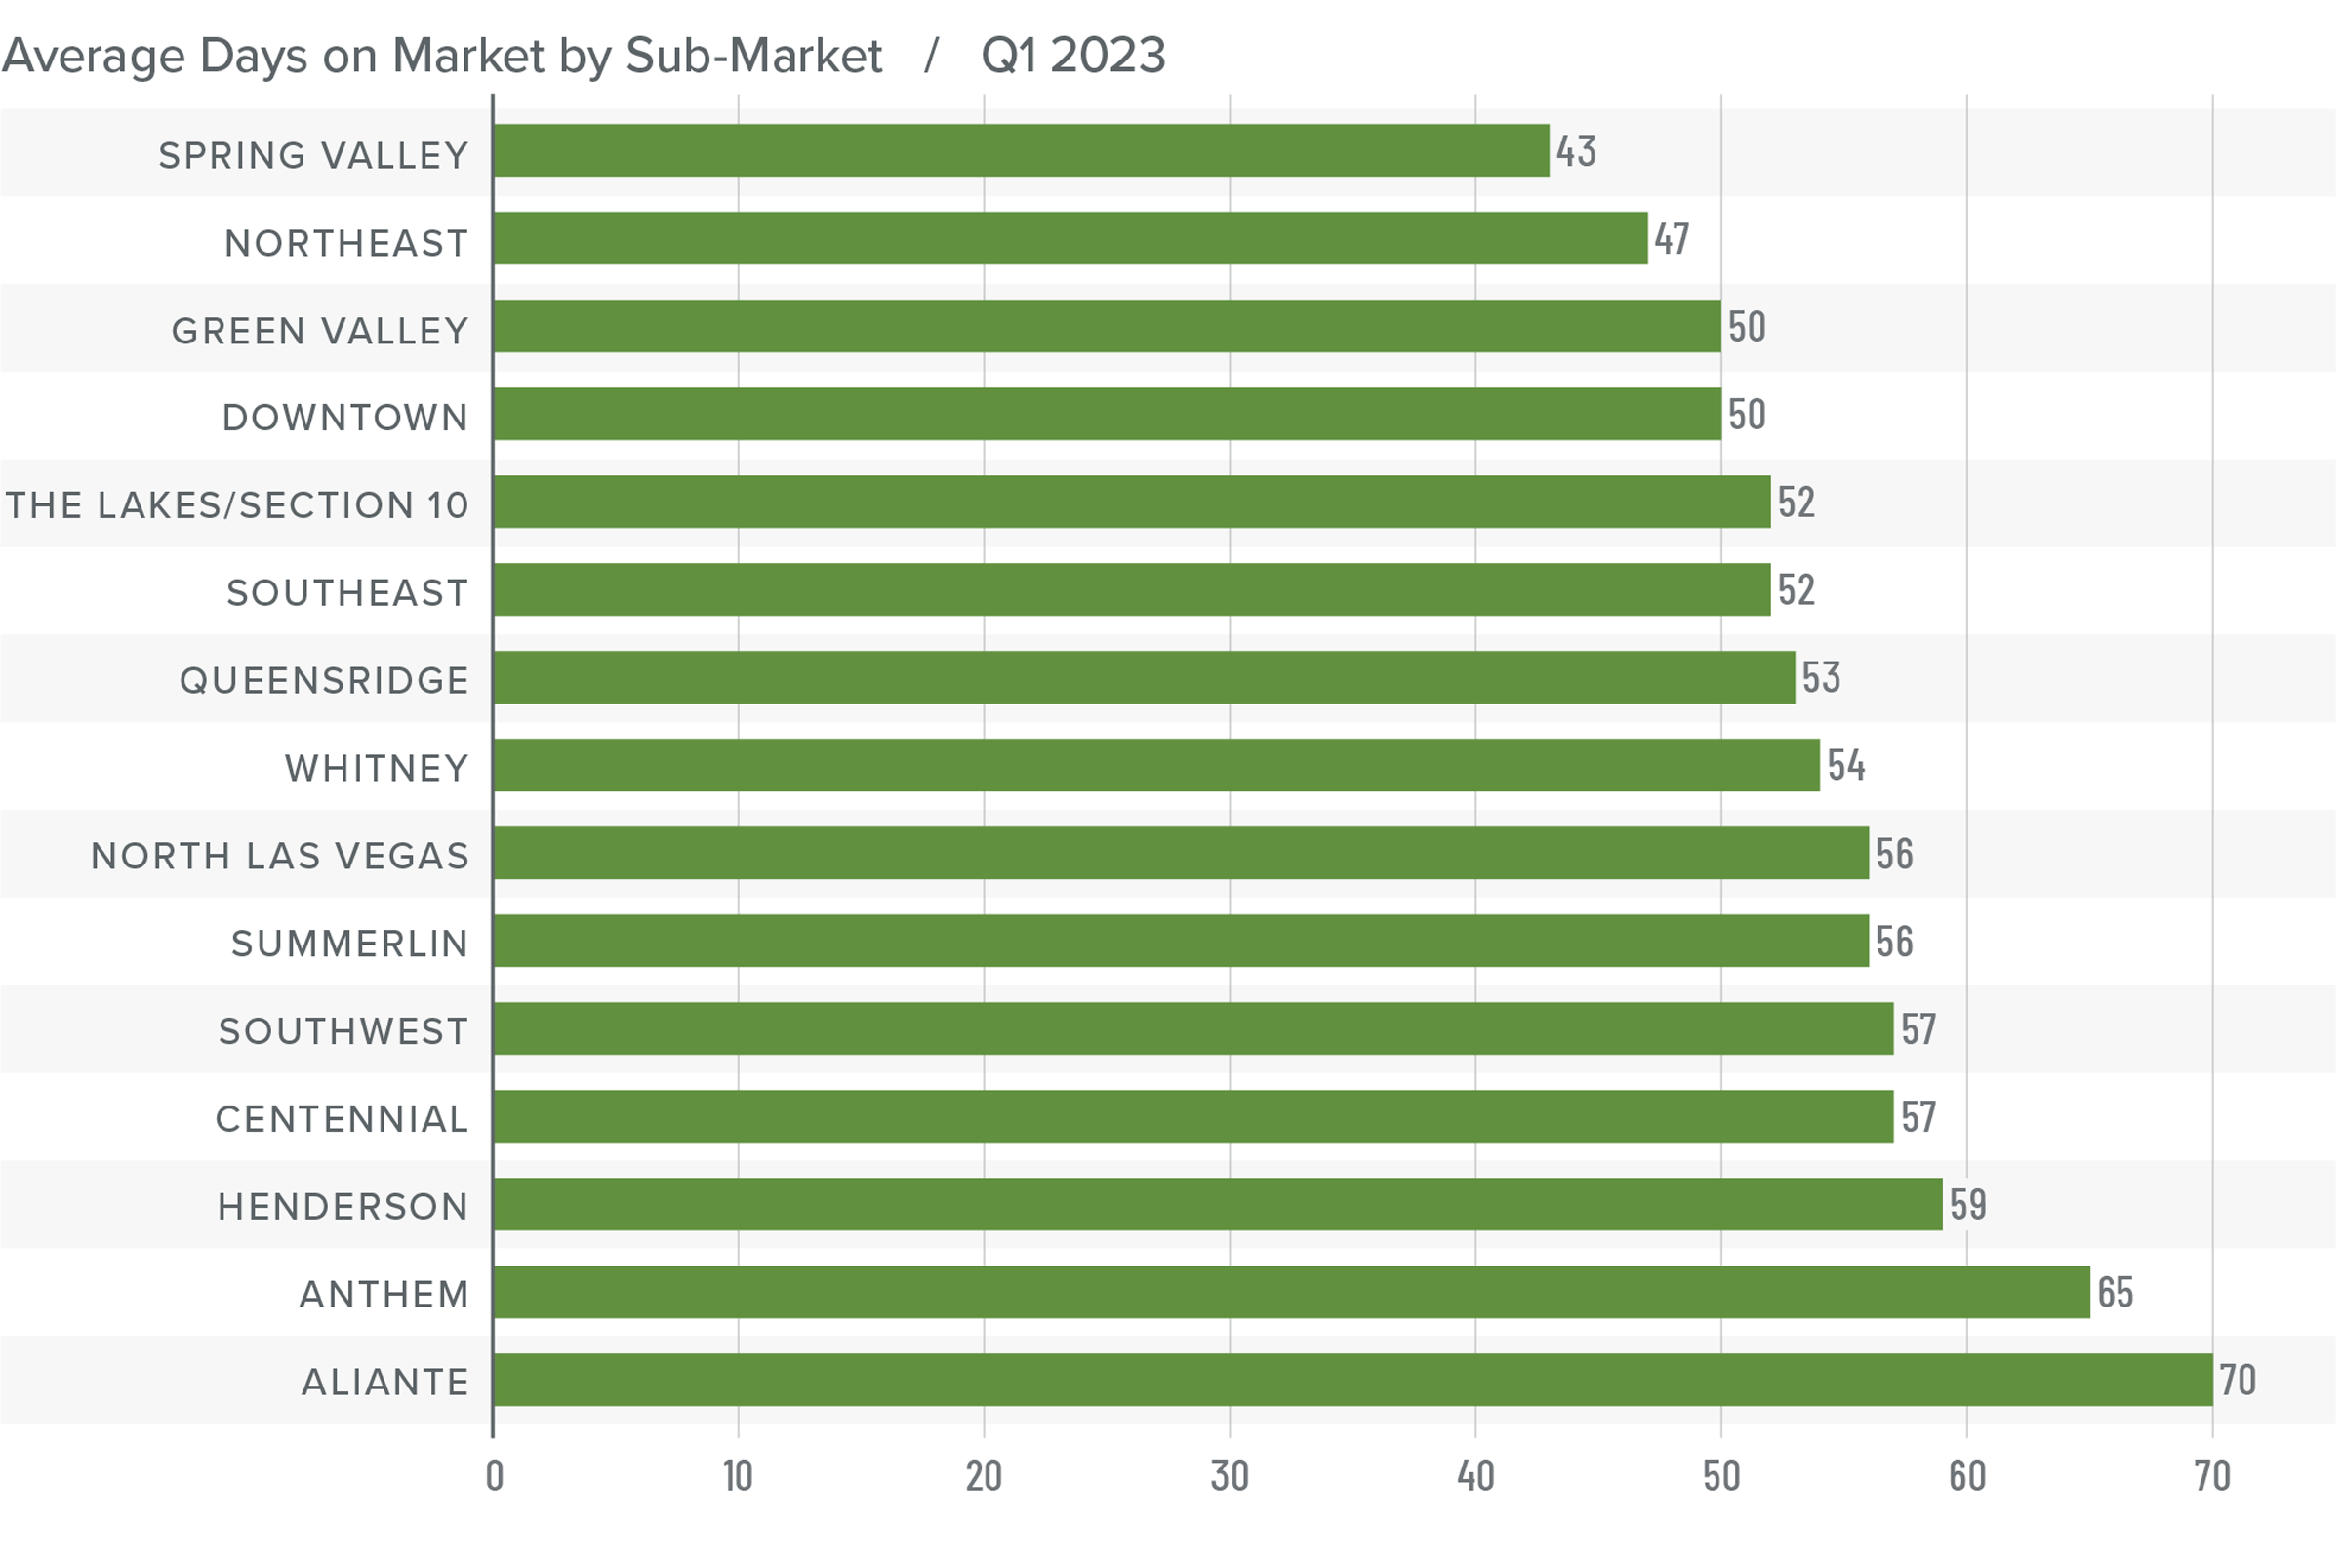
❱ The average time it took to sell a home in the region rose 32 days compared to the first quarter of 2022.
❱ It took an average of 55 days to sell a home in the quarter, which was 12 days longer than it took in the final quarter of 2022.
❱ Days on market rose in all neighborhoods compared to both the same period in 2022 and the fourth quarter.
❱ Even with prices pulling back in many markets, buyers were still taking their time and, possibly, waiting to take advantage of the dips in mortgage rates that occurred in the quarter.
Conclusions
This speedometer reflects the state of the region’s real estate market using housing inventory, price gains, home sales, interest rates, and larger economic factors.
In last quarter’s Gardner Report, I suggested that a price ceiling had been reached in the Las Vegas market. That forecast appears to have been correct. Compared to the fourth quarter of 2022, lower sale prices, longer days on market, and lower listing prices have benefitted home buyers, and it appears they have been taking advantage of the situation. That said, they’re not having it all their own way. Lower inventory levels, higher pending and closed sales, and higher absorption rates of homes that are on the market indicate that home sellers are not completely defeated.
The price correction the market is experiencing was necessary to return to some sense of balance. I expect home prices will pull back a bit further before they start to stabilize this summer. At that point, prices should trend higher again, but at a far more modest pace than during the pandemic period. Given all these factors, I am leaving the needle in neutral territory but leaning a bit toward buyers, who still have a modestly better hand.
About Matthew Gardner
As Chief Economist for Windermere Real Estate, Matthew Gardner is responsible for analyzing and interpreting economic data and its impact on the real estate market on both a local and national level. Matthew has over 30 years of professional experience both in the U.S. and U.K.
In addition to his day-to-day responsibilities, Matthew sits on the Washington State Governors Council of Economic Advisors; chairs the Board of Trustees at the Washington Center for Real Estate Research at the University of Washington; and is an Advisory Board Member at the Runstad Center for Real Estate Studies at the University of Washington where he also lectures in real estate economics.
Q4 2022 Nevada Real Estate Market Update

The following analysis of select counties of the greater Las Vegas real estate market is provided by Windermere Real Estate Chief Economist Matthew Gardner. We hope that this information may assist you with making better-informed real estate decisions. For further information about the housing market in your area, please don’t hesitate to contact your Windermere Real Estate agent.
Regional Economic Overview
The Las Vegas area continues to add new jobs and employment is at its lowest level ever. There are now 1.075 million people working, 50,000 more than a year ago, which represents an annual growth rate of 4.9%. Even with such a robust employment market, the unemployment rate has started to notch just a little higher. This is a function of growth in the labor market as more people look for work. The non-seasonally adjusted unemployment rate in November was 5.6%, up from 5.3% a year ago. The seasonally adjusted rate was 6%, up from 5.7% a year ago.
Nevada Home Sales
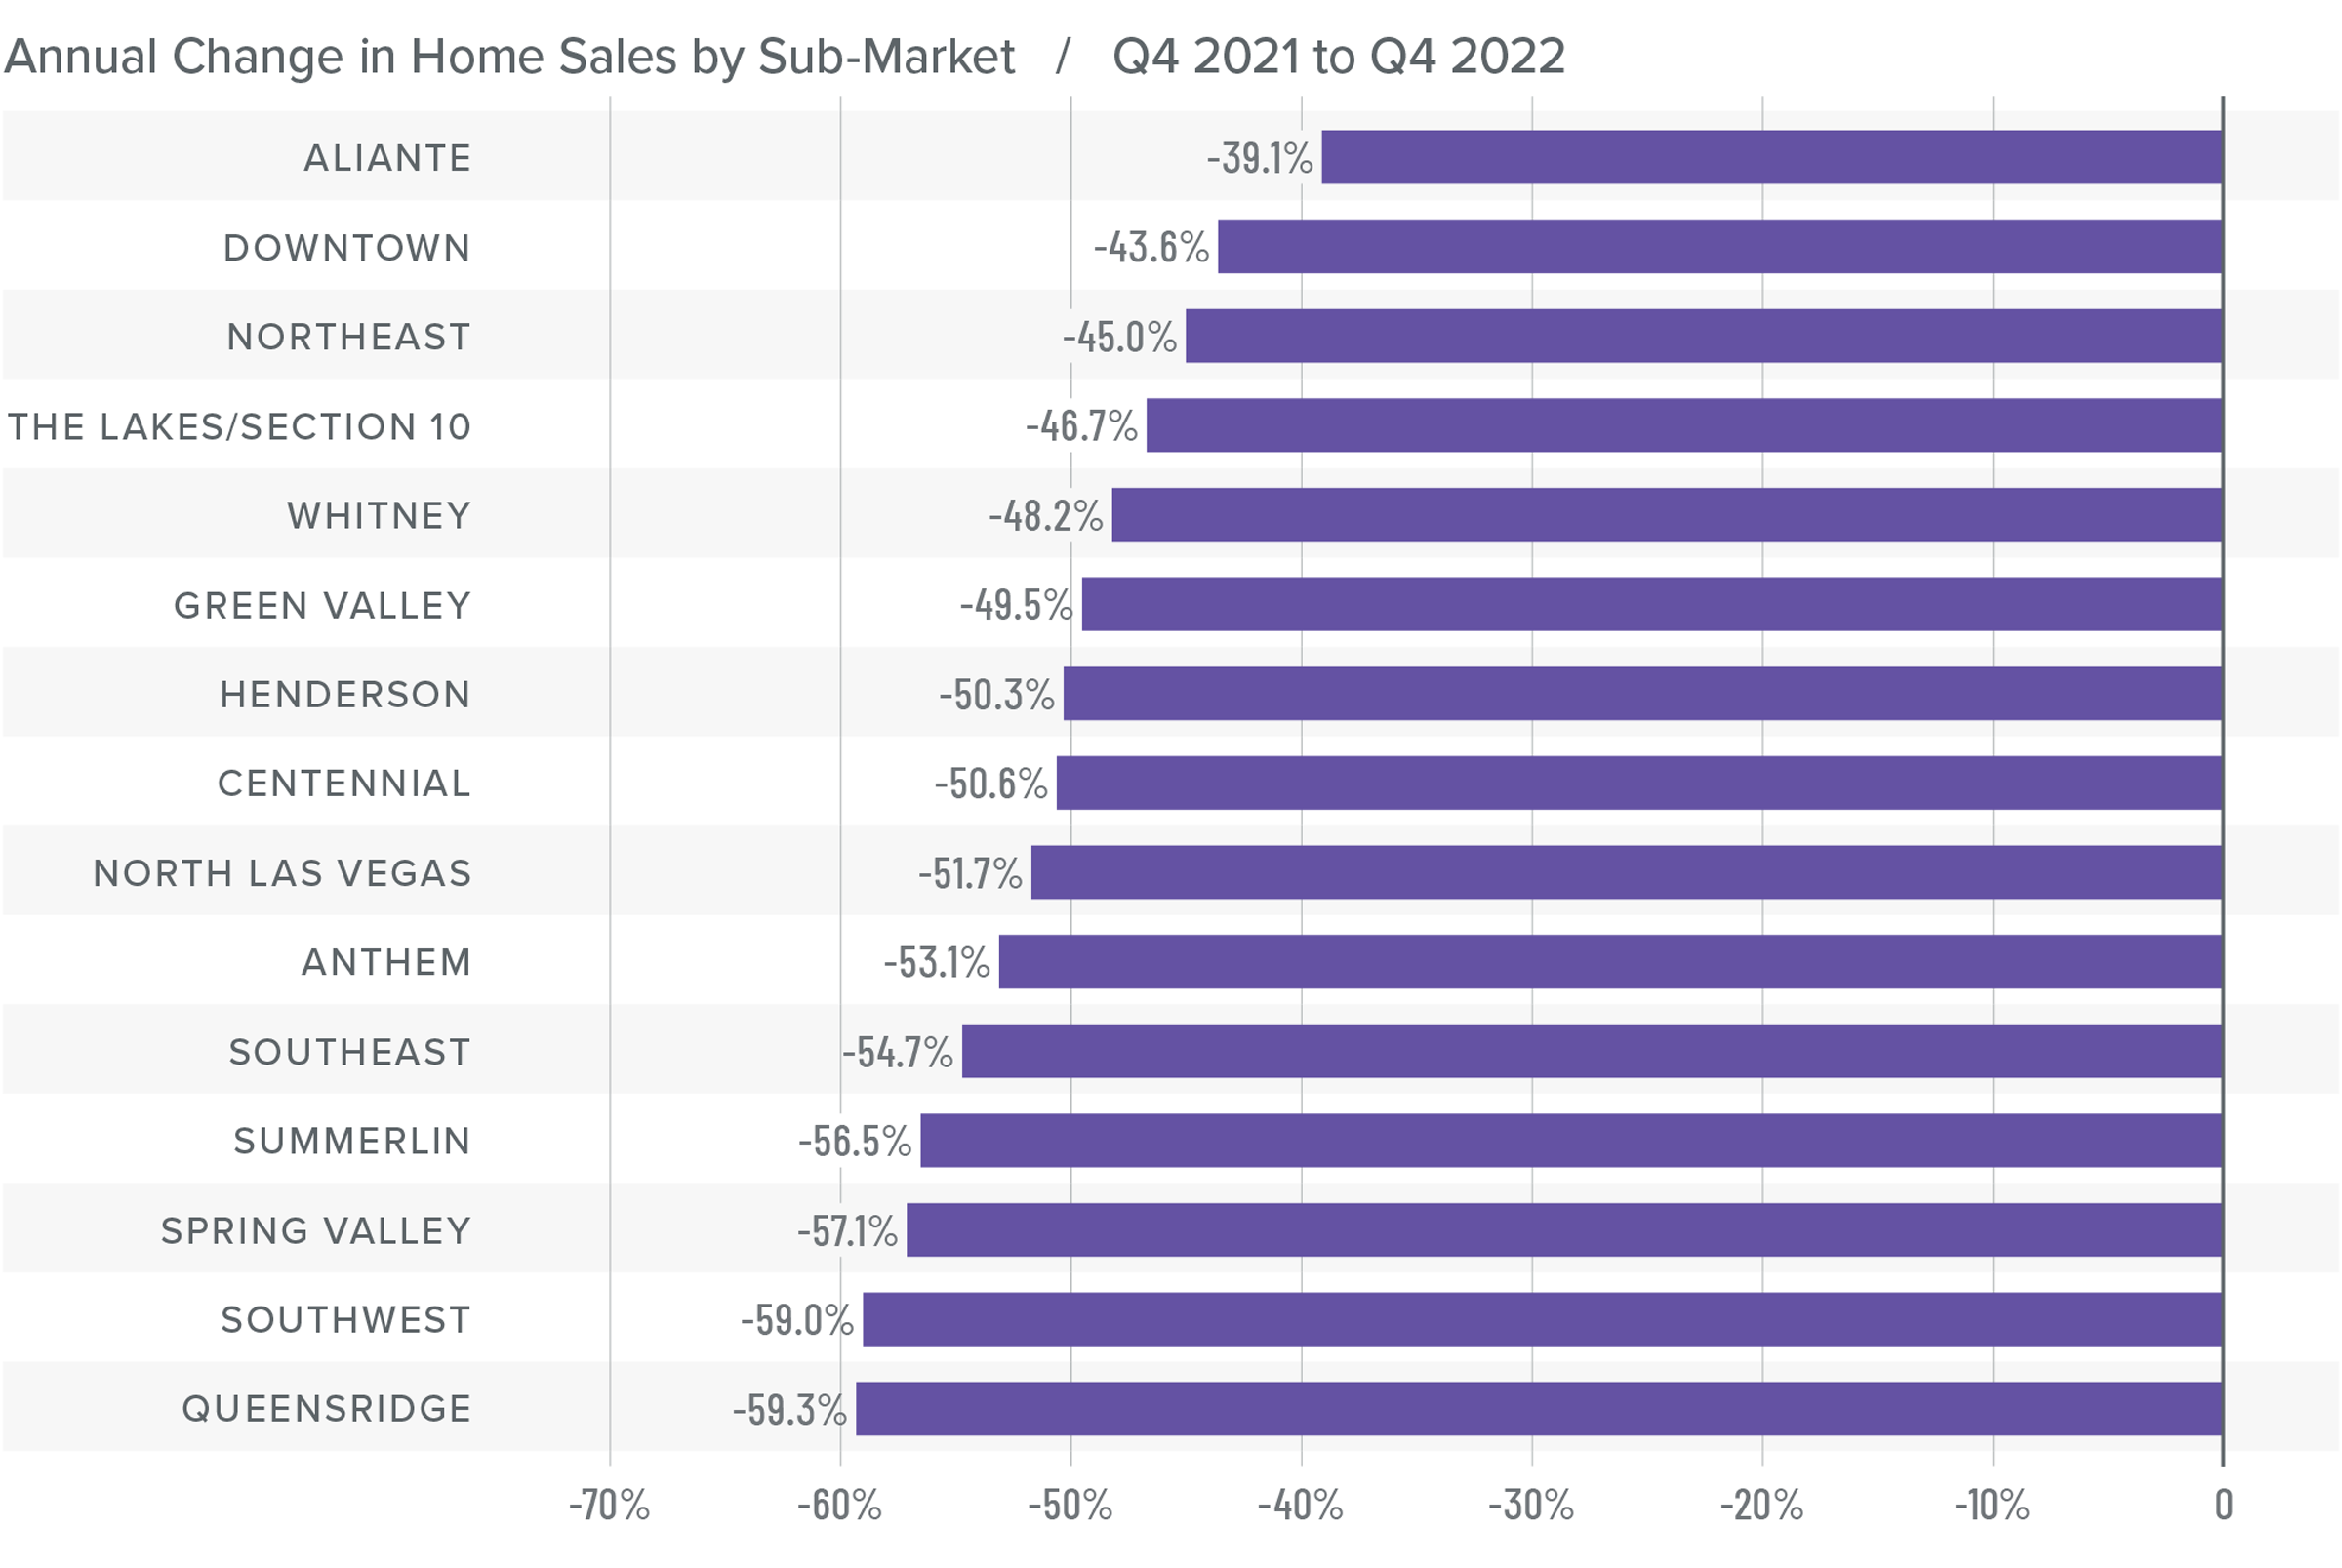
❱ A total of 4,945 homes sold in the final quarter of 2022, which was a drop of 52.4% compared to the fourth quarter of 2021 and down 24.3% from the third quarter of 2022.
❱ Sales fell significantly in every neighborhood covered by this report compared to the same period in 2021. All areas also reported fewer sales than in the third quarter of 2022.
❱ Listing activity continues to grow significantly. The number of homes for sale was up 151% year over year but was down 7.2% from the third quarter of the year.
❱ Pending sales, which are an indicator of future closings, fell 25.3% from the third quarter, suggesting that the market may not see much improvement in the first quarter of 2023.
Nevada Home Prices
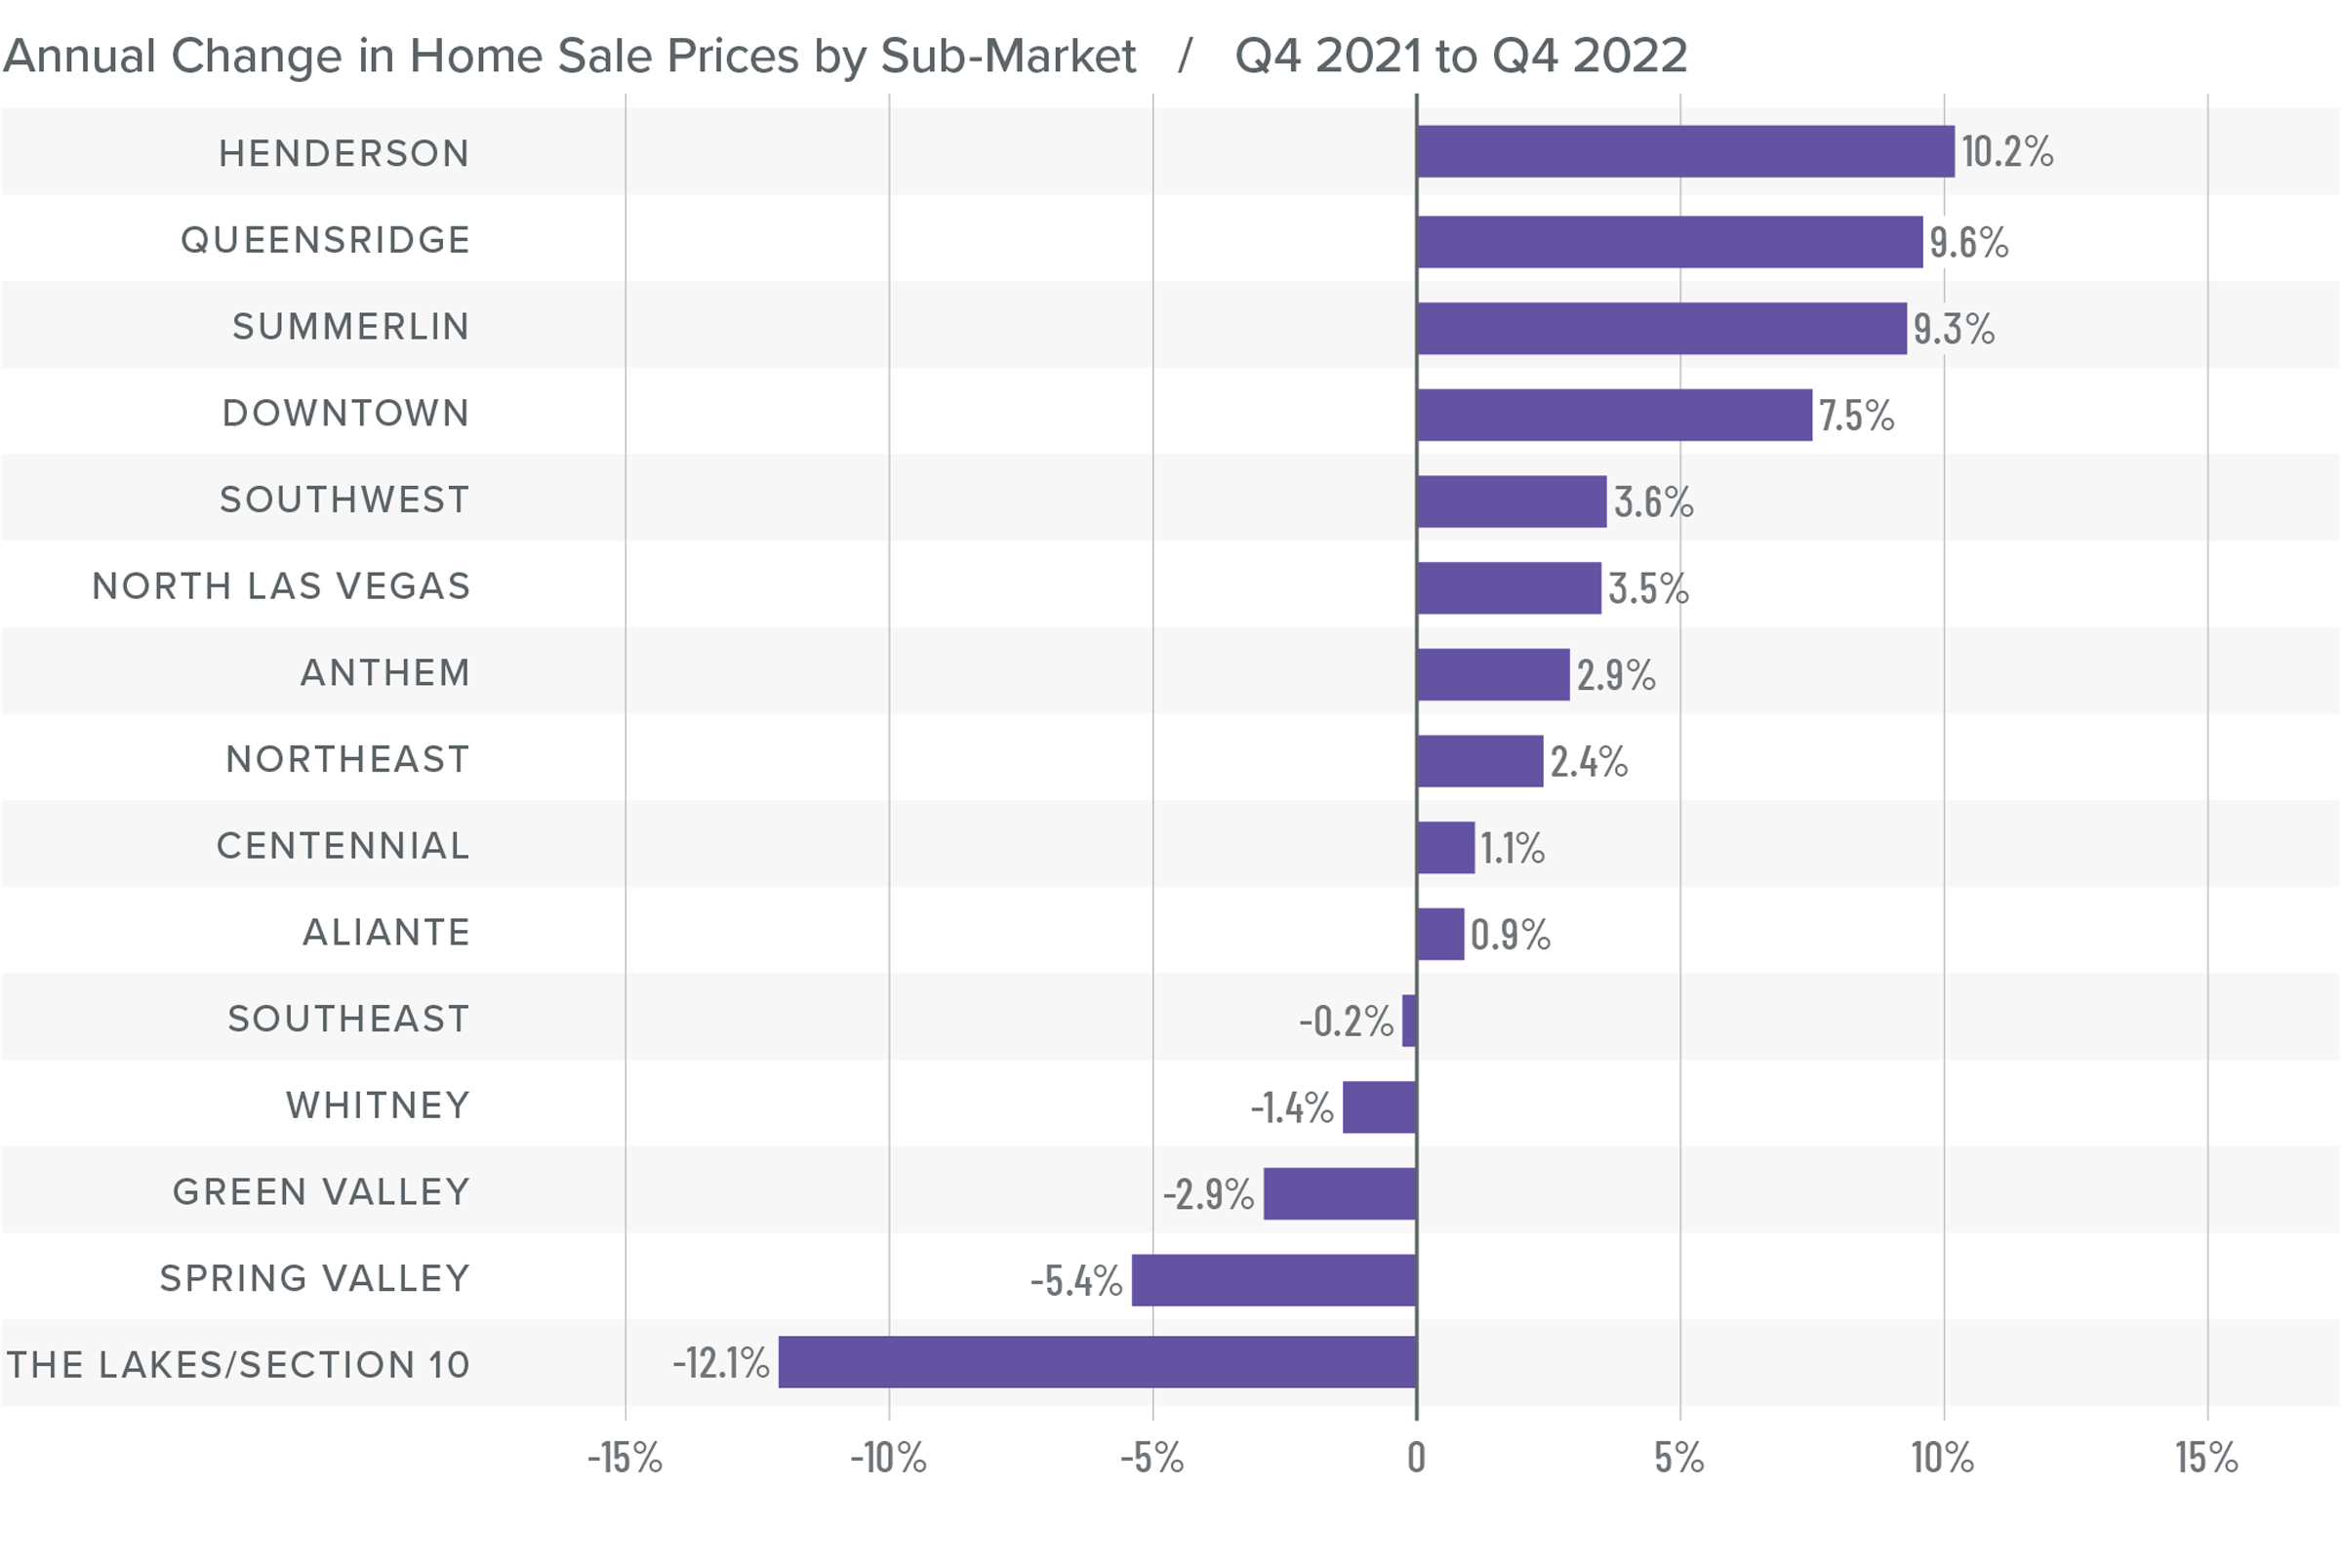
❱ Though there were fewer home sales than during the fourth quarter of 2021, the average sale price was up 2% to $467,794. However, sale prices were down 2.3% from the third quarter of 2022.
❱ Higher financing costs are impacting the number of sales as well as sale prices. Sellers are starting to adjust to this new market reality, as demonstrated by lower median listing prices in all neighborhoods except Aliante when compared to third quarter of 2022.
❱ Year over year, prices rose in ten neighborhoods but fell in the remaining five. Compared to the third quarter of 2022, prices increased in the Henderson, Queens Ridge, and Summerlin neighborhoods, but fell in all other market areas.
❱ The Las Vegas market will likely see home prices fall given higher supply levels and higher mortgage rates, but I don’t think this will result in systemic price declines. Rather, prices will pull back to account for higher mortgage rates before they will then resume growing again, but at a far more modest pace.

Mortgage Rates
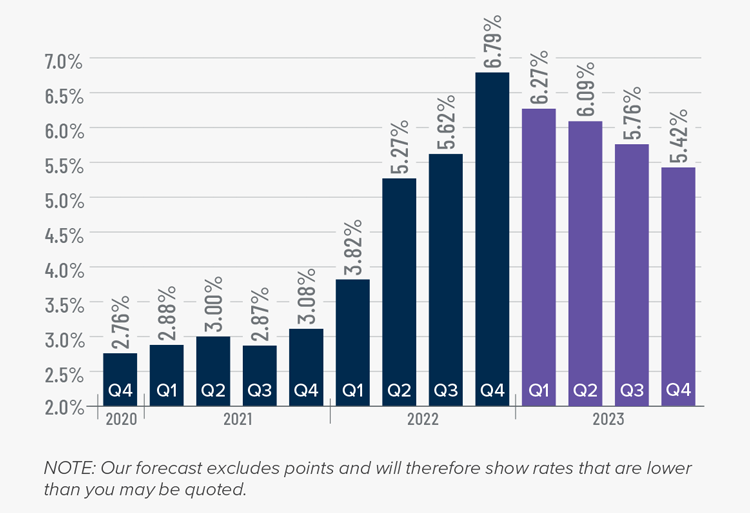
Rates rose dramatically in 2022, but I believe that they have now peaked. Mortgage rates are primarily based on the prices and yields of bonds, and while bonds take cues from several places, they are always impacted by inflation and the economy at large. If inflation continues to fall, as I expect it will, rates will continue to drop.
My current forecast is that mortgage rates will trend lower as we move through the year. While this may be good news for home buyers, rates will still be higher than they have become accustomed to. Even as the cost of borrowing falls, home prices in expensive markets will probably fall a bit more to compensate for rates that will likely hold above 6% until early summer.
Nevada Days on Market
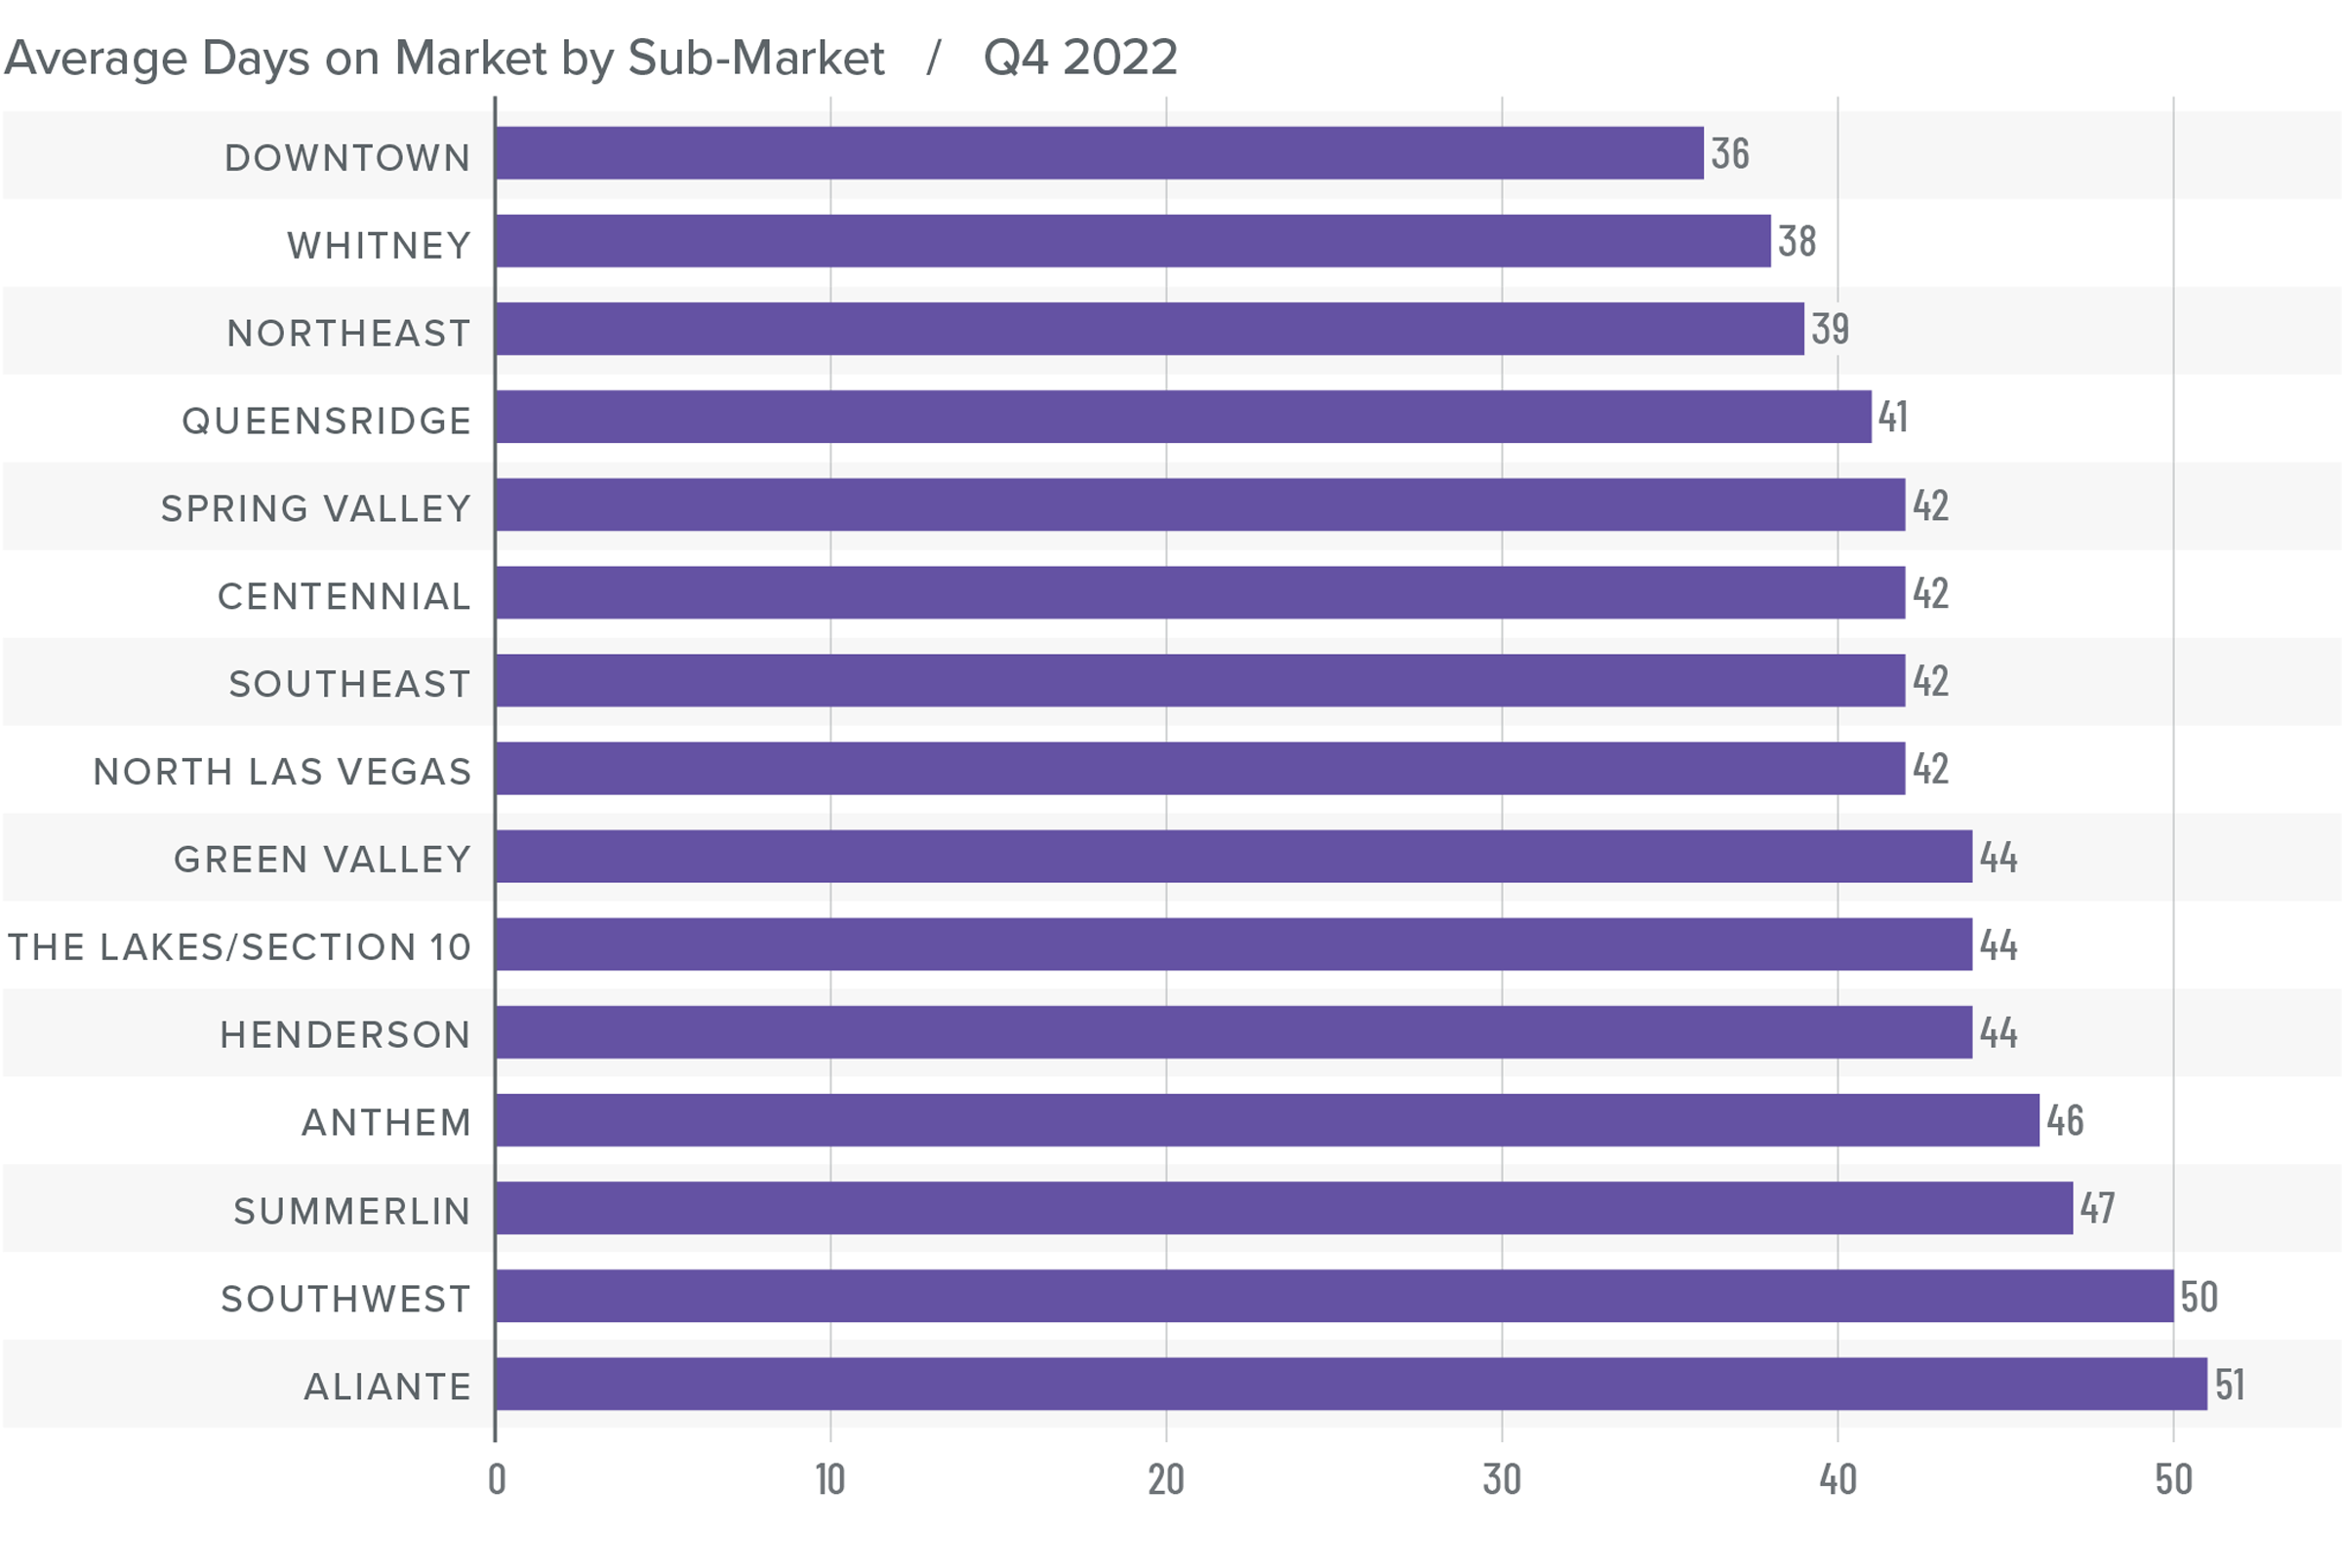
❱ The average time it took to sell a home in the region rose 20 days relative to the fourth quarter of 2021.
❱ It took an average of 43 days to sell a home in the fourth quarter, which was 18 days longer than it took in the third quarter of the year.
❱ Days on market rose in all neighborhoods compared to the same period in 2021 and the third quarter of 2022.
❱ The combination of more choice and fewer buyers is causing the market to slow down from the frantic pace of 2021 and most of 2022.
Conclusions
This speedometer reflects the state of the region’s real estate market using housing inventory, price gains, home sales, interest rates, and larger economic factors.
It is likely that a price ceiling has been reached in the Las Vegas market. Home sales are still occurring, but the frenzied nature we experienced during the pandemic has worn off. Higher financing costs have started to act as a significant headwind. While mortgage rates are likely to pull back in the coming months, they may not fall enough to result in a flood of home buyers. I expect prices to drop further before buyers start to believe that the market has bottomed. When this level is reached, mortgage rates will likely be closer to 5% than 6%, which should encourage more buyers to enter the market.

The bottom line is that the market has to pay the price for the very rapid pace of home-price appreciation in 2021 and part of 2022. Prices have a little further to drop, but I firmly believe that conditions will stabilize this year and then resume the pace of pre-pandemic home-price appreciation. As such, I have moved the needle more in favor of buyers and into neutral territory.
About Matthew Gardner
As Chief Economist for Windermere Real Estate, Matthew Gardner is responsible for analyzing and interpreting economic data and its impact on the real estate market on both a local and national level. Matthew has over 30 years of professional experience both in the U.S. and U.K.
In addition to his day-to-day responsibilities, Matthew sits on the Washington State Governors Council of Economic Advisors; chairs the Board of Trustees at the Washington Center for Real Estate Research at the University of Washington; and is an Advisory Board Member at the Runstad Center for Real Estate Studies at the University of Washington where he also lectures in real estate economics.
Q3 2022 Nevada Real Estate Market Update

The following analysis of the greater Las Vegas real estate market is provided by Windermere Real Estate Chief Economist Matthew Gardner. We hope that this information may assist you with making better-informed real estate decisions. For further information about the housing market in your area, please don’t hesitate to contact your Windermere Real Estate agent.
Regional Economic Overview
After two long years, I can now announce that all the jobs in the Las Vegas metro area that were lost because of the pandemic have returned. Employment levels are now 7,800 jobs above the pre-pandemic peak. With the job market continuing to strengthen, the number of people who have started to look for work has increased. This has led the unemployment rate to rise to 5.7%.
Nevada Home Sales
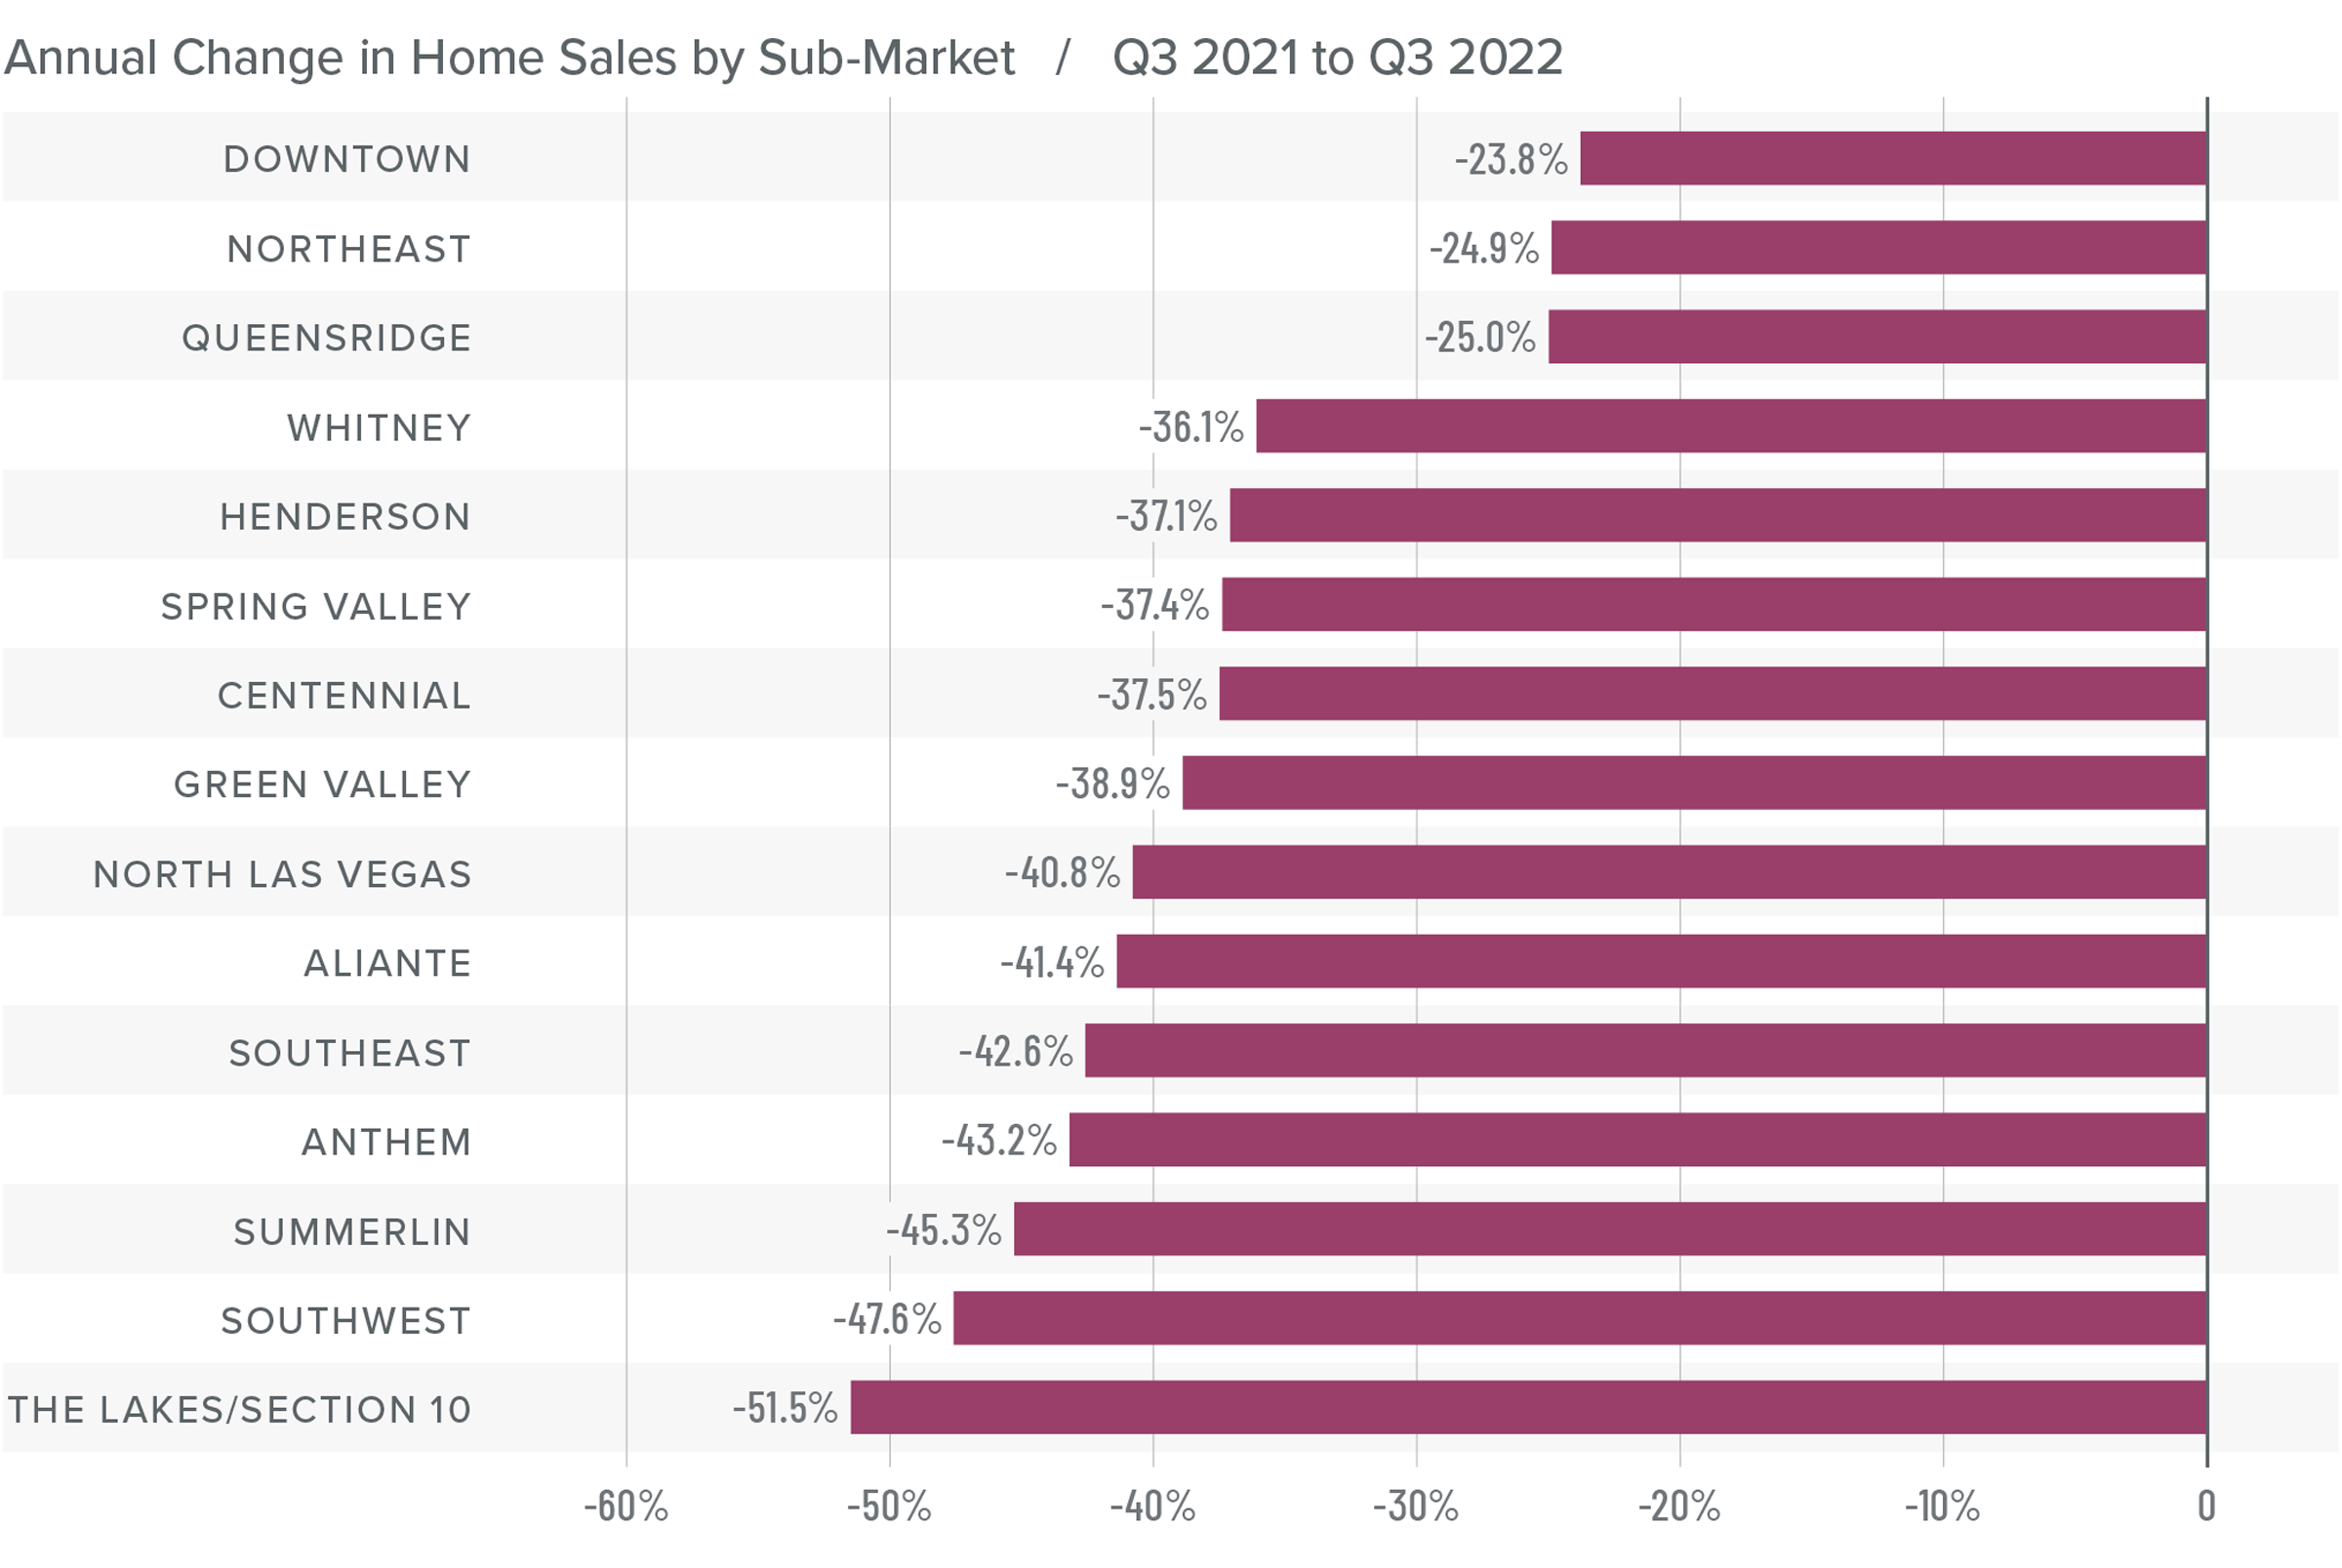
❱ A total of 6,533 homes sold in the third quarter, which was a drop of 39.8% compared to the same period a year ago, and 30.2% lower than in the second quarter of this year.
❱ Sales fell in every neighborhood covered by this report compared to a year ago, and all areas reported fewer sales than in the second quarter of 2022.
❱ Listing activity continues to grow significantly, with the number of homes for sale up 130% year over year and up 97.2% from the second quarter.
❱ Pending sales, which are an indicator of future closings, fell 27.6% compared to the second quarter, suggesting that the market may see sales fall further in the final quarter of this year.
Nevada Home Prices
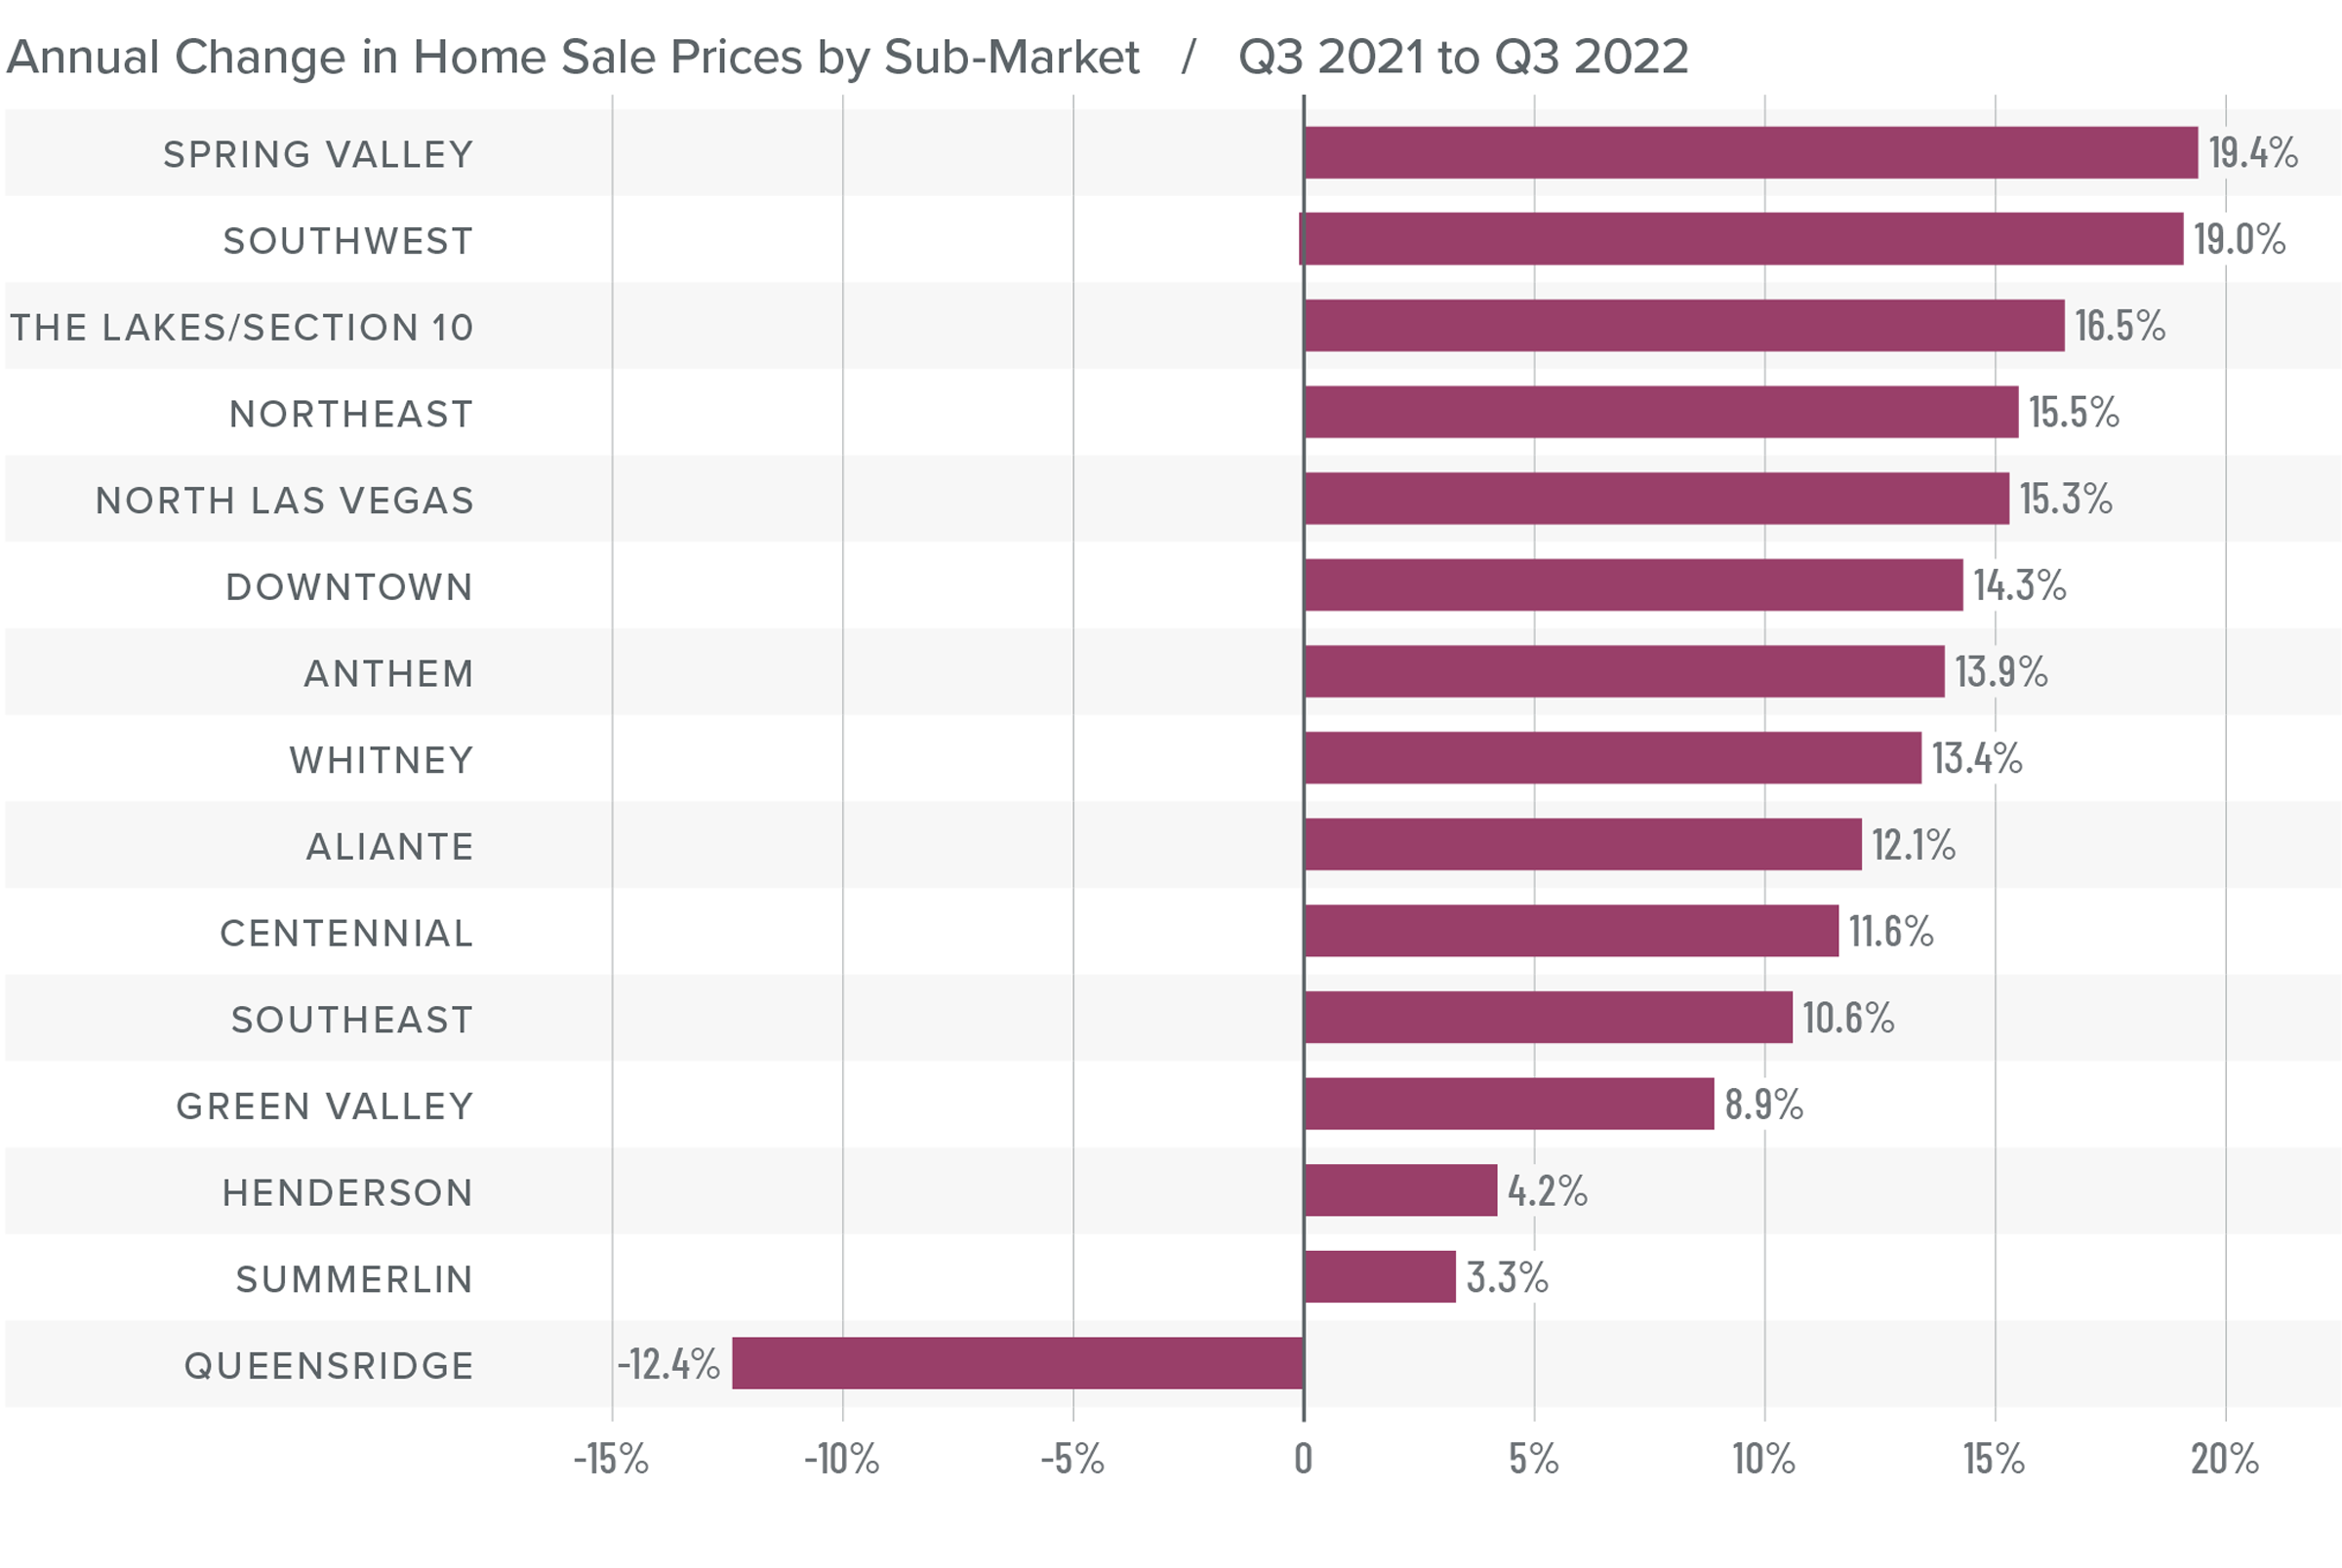
❱ Even with slower sales, home prices still rose 9.4% from a year ago to an average of $479,046. They were 9% lower than in the second quarter of 2022.
❱ The impact of higher mortgage rates has now started to affect both sales and prices. Median listing prices are down from the second quarter in all markets except Spring Valley (+0.3%) and Anthem (+1.4%).
❱ Year over year, prices rose in every neighborhood other than Queens Ridge. They fell in every area compared to the second quarter of 2022.
❱ The market has entered a period of reversion. The impact of mortgage rates rising 2.7% between the third quarter of 2021 and the current quarter has clearly started to have a dampening effect on the market.

Mortgage Rates
This remains an uncertain period for mortgage rates. When the Federal Reserve slowed bond purchases in 2013, investors were accused of having a “taper tantrum,” and we are seeing a similar reaction today. The Fed appears to be content to watch the housing market go through a period of pain as they throw all their tools at reducing inflation.
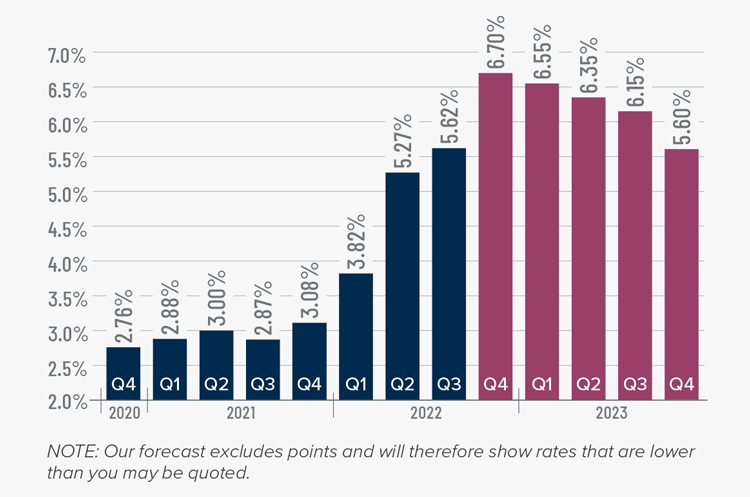
As a result, mortgage rates are out of sync with treasury yields, which not only continues to push rates much higher, but also creates violent swings in both directions. My current forecast calls for rates to peak in the fourth quarter of this year before starting to slowly pull back. That said, they will remain in the 6% range until the end of 2023.
Nevada Days on Market
❱ The average time it took to sell a home in the region rose seven days compared to the third quarter of 2021.
❱ It took an average of 25 days to sell a home in the quarter, which is nine days longer than it took in the second quarter of this year.
❱ Days on market rose in all neighborhoods compared to the same period a year ago. Market time also rose in all neighborhoods compared to the second quarter of 2022.
❱ Although these numbers may appear to be very bleak, it is worth remembering that the average days on market in the current quarter was 19 fewer than in the same quarter in 2019.
Conclusions
This speedometer reflects the state of the region’s real estate market using housing inventory, price gains, home sales, interest rates, and larger economic factors.
The third quarter was one of transition as the market started to feel the impact of higher financing costs and more homes for sale. I expect the market to continue underperforming through the end of this year. However, as we enter 2023 mortgage rates should start stabilizing and moving modestly lower, leading to a more sustainable pace of sales and price growth. Although sellers may feel that the value of their homes is collapsing, that is not the case. Over 56% of Clark County homeowners with a mortgage have over 50% equity in their homes. Though any price correction might be painful to watch, it will not cause a major jump in foreclosure activity. Owners will see values return, but only after this period of reversion is complete, which will occur in 2023.
Given all the data discussed here, I have moved the needle more in favor of home buyers. However, they still do not have the upper hand.
About Matthew Gardner
As Chief Economist for Windermere Real Estate, Matthew Gardner is responsible for analyzing and interpreting economic data and its impact on the real estate market on both a local and national level. Matthew has over 30 years of professional experience both in the U.S. and U.K.
In addition to his day-to-day responsibilities, Matthew sits on the Washington State Governors Council of Economic Advisors; chairs the Board of Trustees at the Washington Center for Real Estate Research at the University of Washington; and is an Advisory Board Member at the Runstad Center for Real Estate Studies at the University of Washington where he also lectures in real estate economics.
Q2 2022 Nevada Real Estate Market Update

The following analysis of the greater Las Vegas real estate market is provided by Windermere Real Estate Chief Economist Matthew Gardner. We hope that this information may assist you with making better-informed real estate decisions. For further information about the housing market in your area, please don’t hesitate to contact your Windermere Real Estate agent.
Regional Economic Overview
Though employment growth in the Las Vegas area continues, the pace has been frenetic. The average monthly growth so far in 2022 has been about half as fast as 2021’s pace. That said, the market has recovered all but 6,800 of the 287,000 jobs that were lost during the pandemic. In the first quarter Gardner Report, I predicted that the area would return to pre-COVID employment levels by the spring. I am optimistic that when the June data is released, the region will have seen a full recovery. With rising employment, more residents started to look for work, which has grown the labor force quite significantly. That said, even though the unemployment rate remains higher than the U.S., it was still measured at a respectable 5.2%.
Nevada Home Sales
❱ A total of 9,365 homes sold in the second quarter, which was a drop of 17.4% compared to the same period a year ago. Sales rose 2.7% compared to the first quarter of this year.
❱ Year over year, fewer transactions occurred in every neighborhood contained in this report, but rose in all but five areas compared to the first quarter of 2022. The Aliante, Queens Ridge, and Centennial areas all saw solid growth.
❱ Supply constraints have subsided, with the average number of listings almost doubling between the first and second quarters. This is good news for prospective home buyers.
❱ Pending sales, which are an indicator of future closings, fell 11.2% compared to the prior quarter, suggesting that growth in closings in the third quarter may be modest.
Nevada Home Prices
❱ Home prices rose 22.8% from a year ago to an average of $526,289. They were 8.3% higher than in the first quarter of 2022.
❱ With the jump in interest rates, I have been closely monitoring list prices to see if higher financing costs are having an impact on them. So far, they appear not to be. Median list prices rose by more than 13% compared to the first quarter. Only Spring Valley saw list prices fall.
❱ Year over year, prices rose by double digits in every neighborhood other than Anthem, and rose in all markets other than Spring Valley compared to the first quarter of this year.
❱ The market appears to still be fairly bullish, but I sense that it will start to move back toward equilibrium as financing costs and affordability become greater headwinds.

Mortgage Rates
Although mortgage rates did drop in June, the quarterly trend was still moving higher. Inflation—the bane of bonds and, therefore, mortgage rates—has yet to slow, which is putting upward pressure on financing costs.
That said, there are some signs that inflation is starting to soften and if this starts to show in upcoming Consumer Price Index numbers then rates will likely find a ceiling. I am hopeful this will be the case at some point in the third quarter, which is reflected in my forecast.
Nevada Days on Market
❱ The average time it took to sell a home in the region dropped seven days compared to the second quarter of 2021.
❱ It took an average of 16 days to sell a home in the quarter, which was down 7 days compared to the first quarter of this year.
❱ Days on market dropped in all neighborhoods except Anthem compared to the same period a year ago. Market time dropped in all neighborhoods other than Northeast Las Vegas (where it remained static) compared to the first quarter of the year.
❱ The greatest drop in market time was in the Spring Valley neighborhood, where the length of time it took to sell a home fell 15 days compared to a year ago.
Conclusions
This speedometer reflects the state of the region’s real estate market using housing inventory, price gains, home sales, interest rates, and larger economic factors.
Although listing activity and financing costs have risen, this has yet to negatively impact home sales or price growth. The growing number of homes for sale would normally cause asking prices to settle, which would favor home buyers, but so far this is not the case.

I expect the market to start moving somewhat toward balance, but for the time being sellers are still in the driver’s seat. Given all the data discussed here, I have left the needle in the same position as the last quarter. There are still too many unknowns preventing me from moving it one way or another. Hopefully, I will get more clarity once the summer winds down.
About Matthew Gardner
As Chief Economist for Windermere Real Estate, Matthew Gardner is responsible for analyzing and interpreting economic data and its impact on the real estate market on both a local and national level. Matthew has over 30 years of professional experience both in the U.S. and U.K.
In addition to his day-to-day responsibilities, Matthew sits on the Washington State Governors Council of Economic Advisors; chairs the Board of Trustees at the Washington Center for Real Estate Research at the University of Washington; and is an Advisory Board Member at the Runstad Center for Real Estate Studies at the University of Washington where he also lectures in real estate economics.
Q1 2022 Nevada Real Estate Market Update
The following analysis of select counties of the greater Las Vegas real estate market is provided by Windermere Real Estate Chief Economist Matthew Gardner. We hope that this information may assist you with making better-informed real estate decisions. For further information about the housing market in your area, please don’t hesitate to contact your Windermere Real Estate agent.
Regional Economic Overview
Jobs continue to return to the Las Vegas market and the area has now recovered all but 13,100 of the 287,000 jobs that were lost during the pandemic. With almost 10,000 jobs added per month over the past year, I am hopeful that the area will return to preCOVID employment levels by spring. With rising employment, the jobless rate continues to drop. The latest data shows an unemployment rate of 5.3%, which is well below the pandemic-induced rate of 31.1%. If there is cause for concern, it is that the labor force remains at pre-pandemic levels. If employers are unable to find qualified workers, the pace of the job recovery may start to slow. As the country moves toward “post-COVID” life, I expect that leisure travel will continue to increase, which would be very good for a hospitality-driven market such as Las Vegas. This will certainly aid in the overall economic recovery in the region.
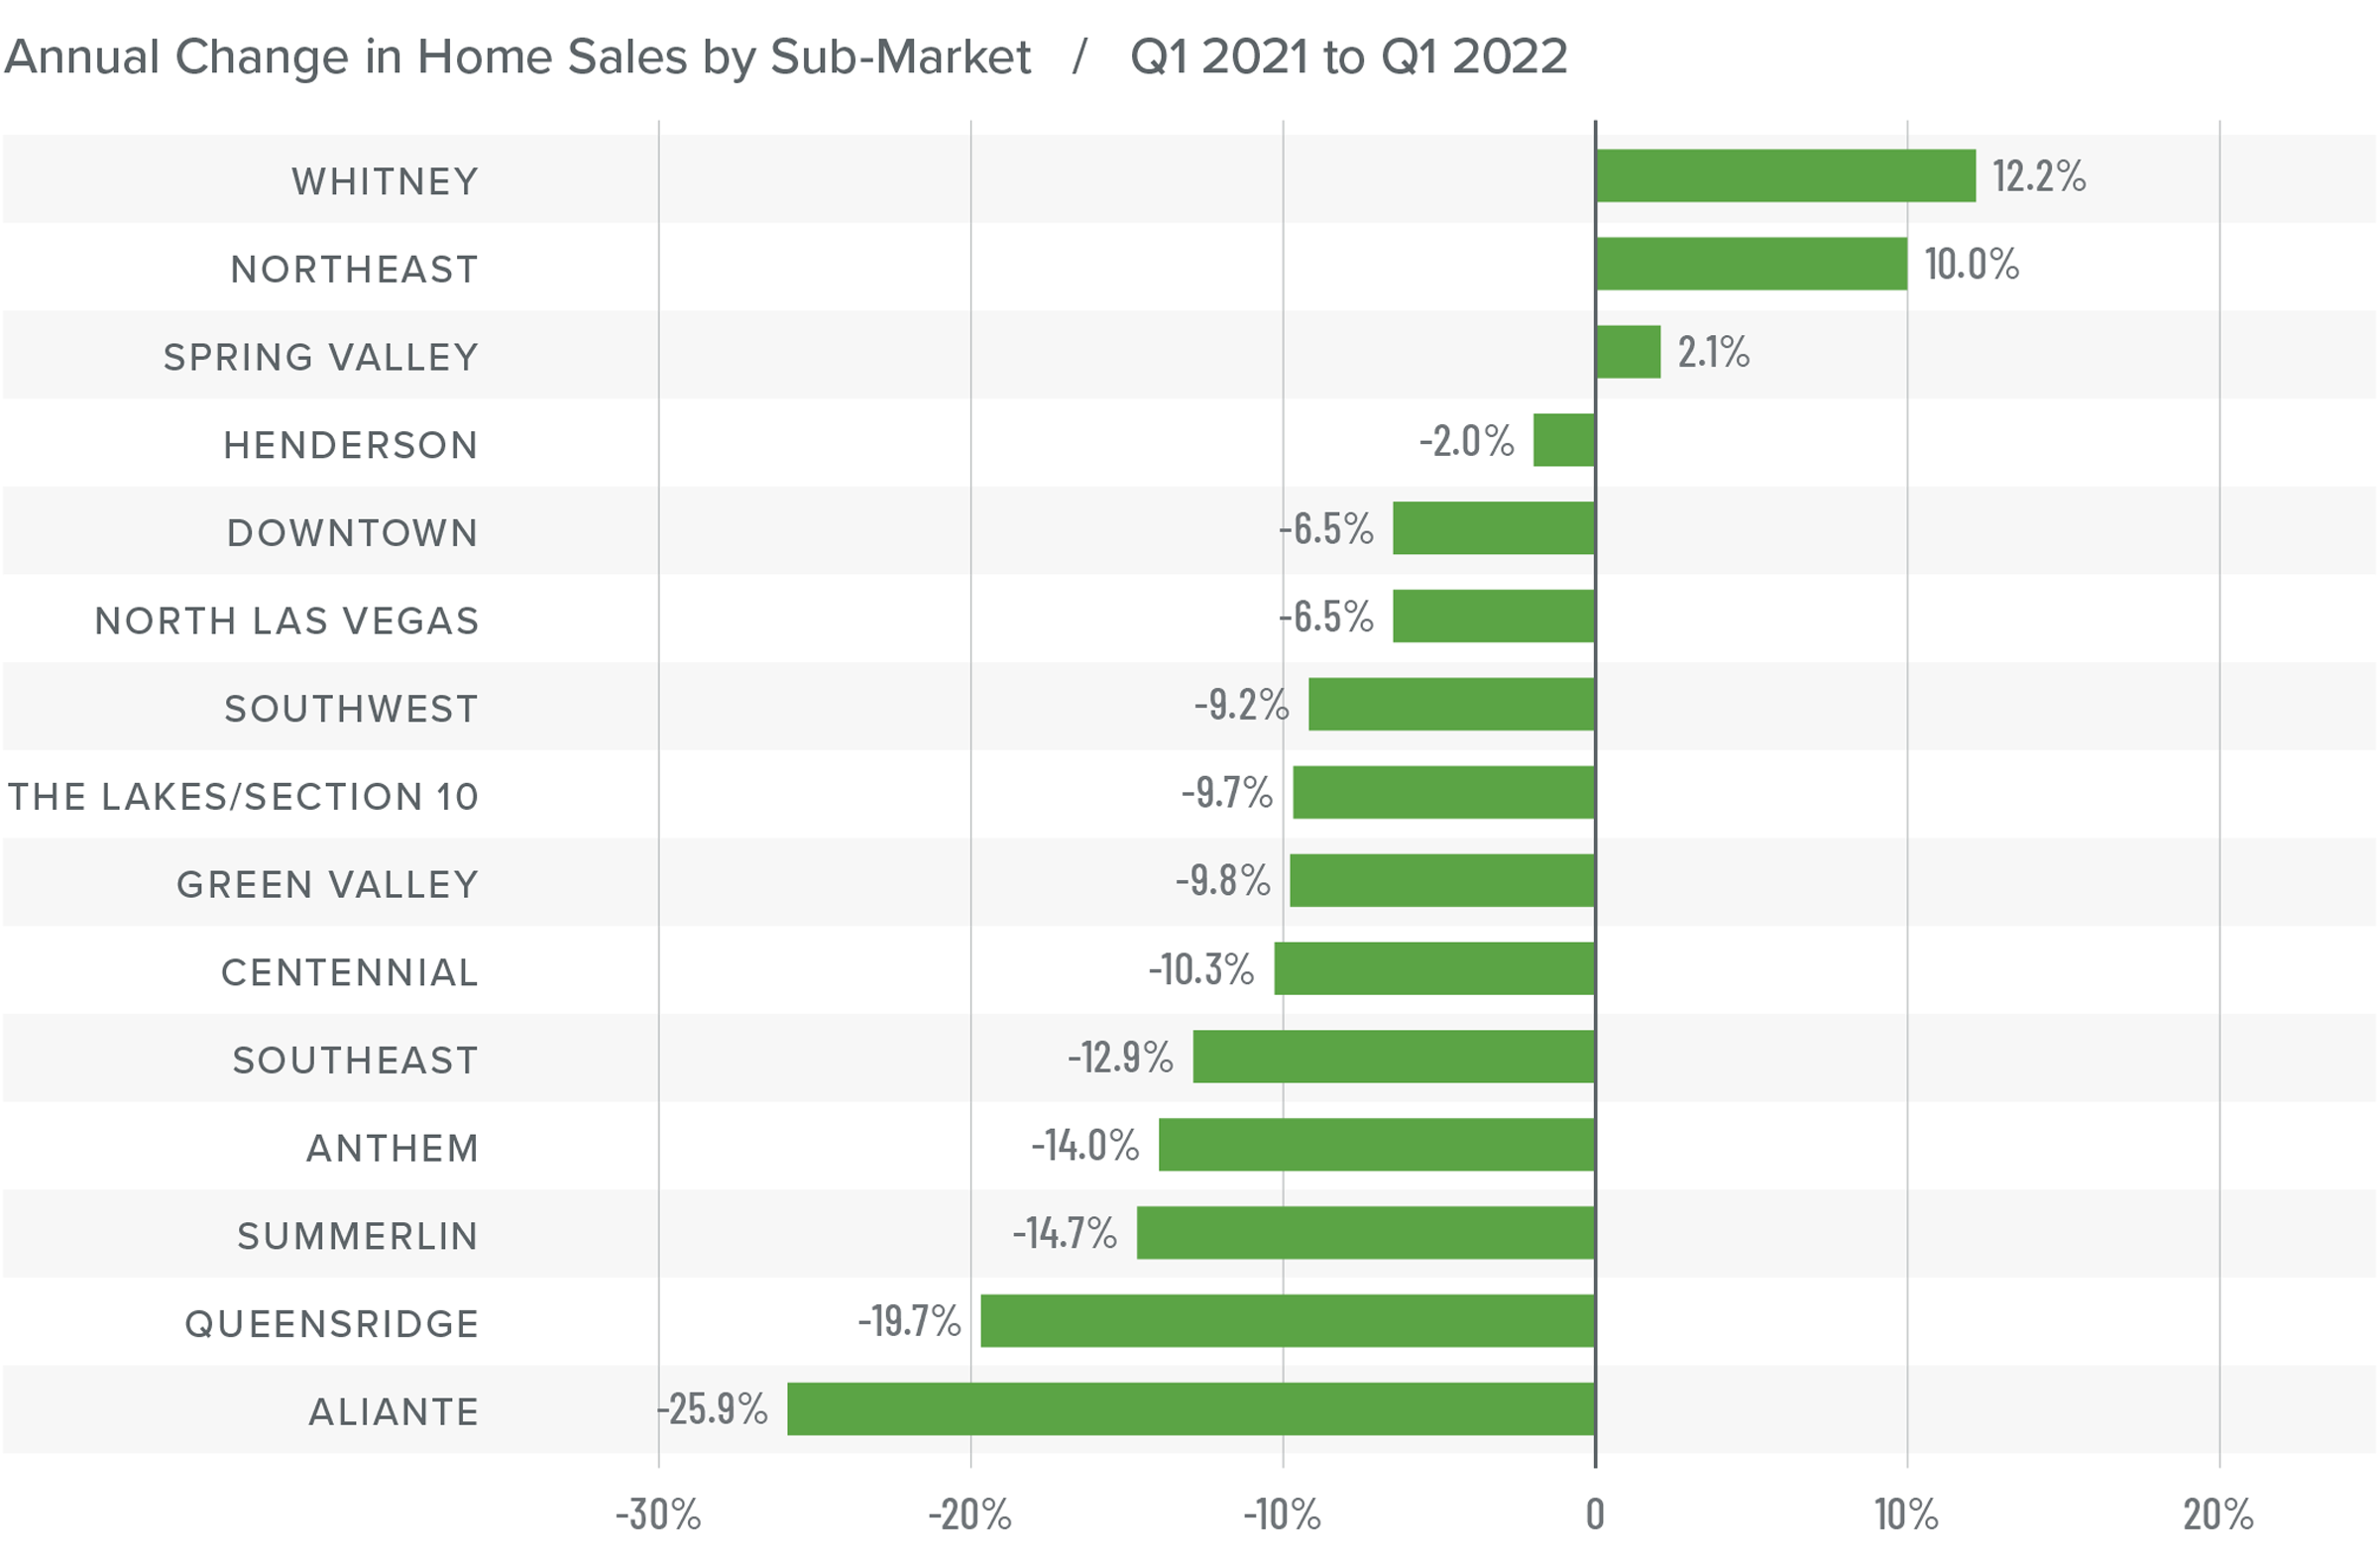
Nevada Home Sales
❱ A total of 9,122 homes sold in the first quarter of the year—a drop of 7.3% compared to the same period a year ago. Sales were 10.8% lower than in the fourth quarter of 2021.
❱ Sales rose in three of the neighborhoods contained in this report but dropped in all other areas compared to the first quarter of 2021. Compared to the previous quarter, all neighborhoods saw fewer sales.
❱ Supply constraints persist, which is limiting sales. The average number of homes for sale was down 20% year over year and down an even more substantial 31% compared to the final quarter of 2021.
❱ Pending sales, which are an indicator of future closings, increased 1.6% compared to the prior quarter, suggesting that closings in the second quarter of 2022 may show very slight improvement from the current numbers.
Nevada Home Prices
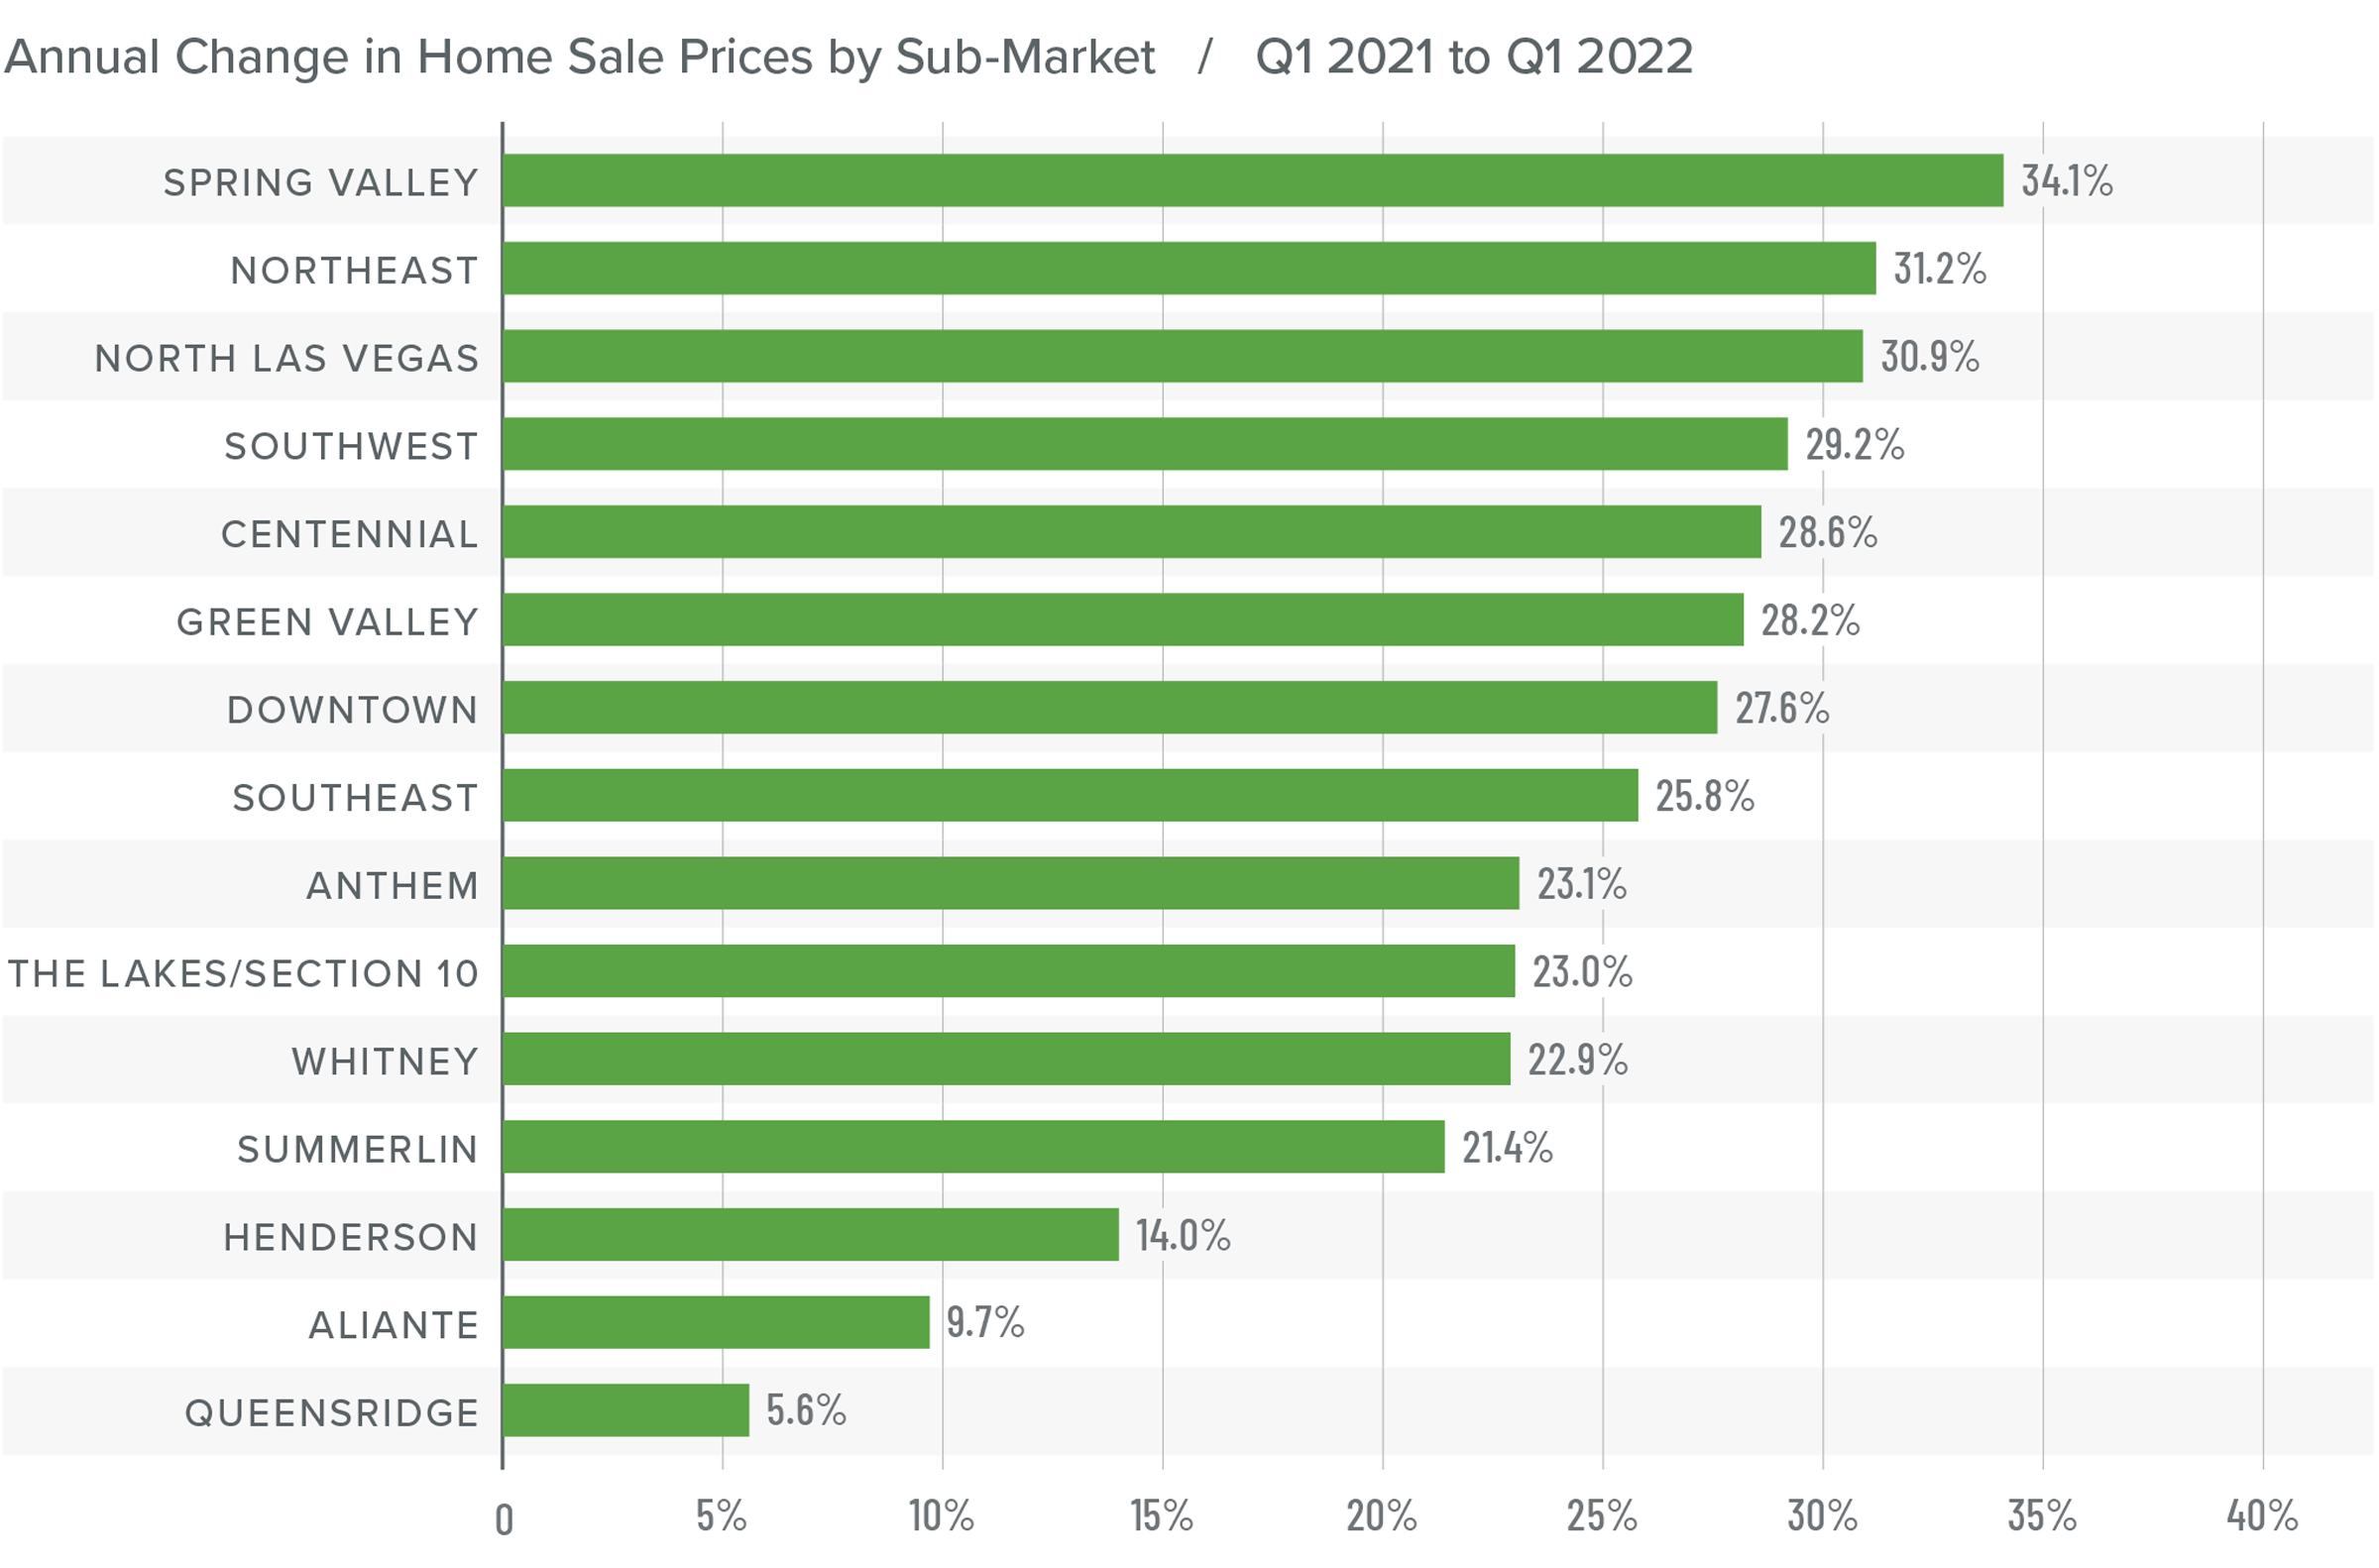
❱ Home prices rose 23% from a year ago to an average of $485,820 and were 5.8% higher than in the fourth quarter of 2021.
❱ I consider listing prices to be a leading indicator for shifts in the market. That they continue to trend higher suggests that sellers remain very confident that the market will be able to accommodate the higher financing costs buyers are facing.
❱ Prices rose by double digits in all but two neighborhoods compared to the same quarter last year and rose in all markets other than Aliante compared to the fourth quarter of 2021.
❱ The data suggests that rising mortgage rates have not impacted the market yet, but there is normally a lag between rising rates and any effect on prices or demand. The market clearly has more buyers than sellers, but it will be interesting to see if prices continue to rise at their current pace in the face of higher financing costs.

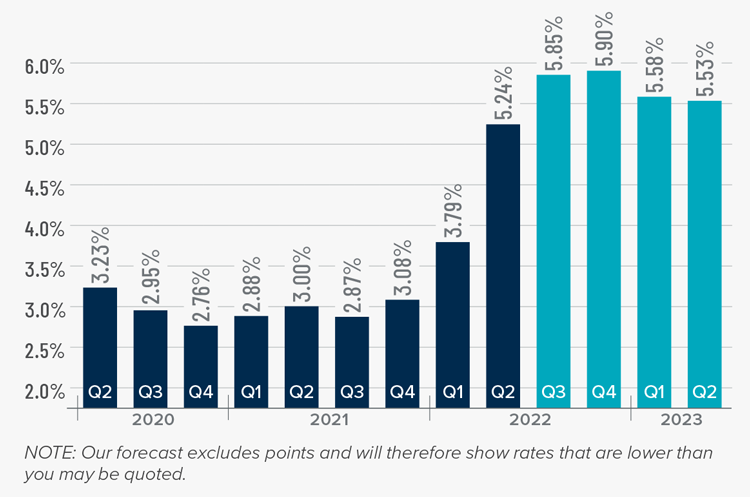
Mortgage Rates
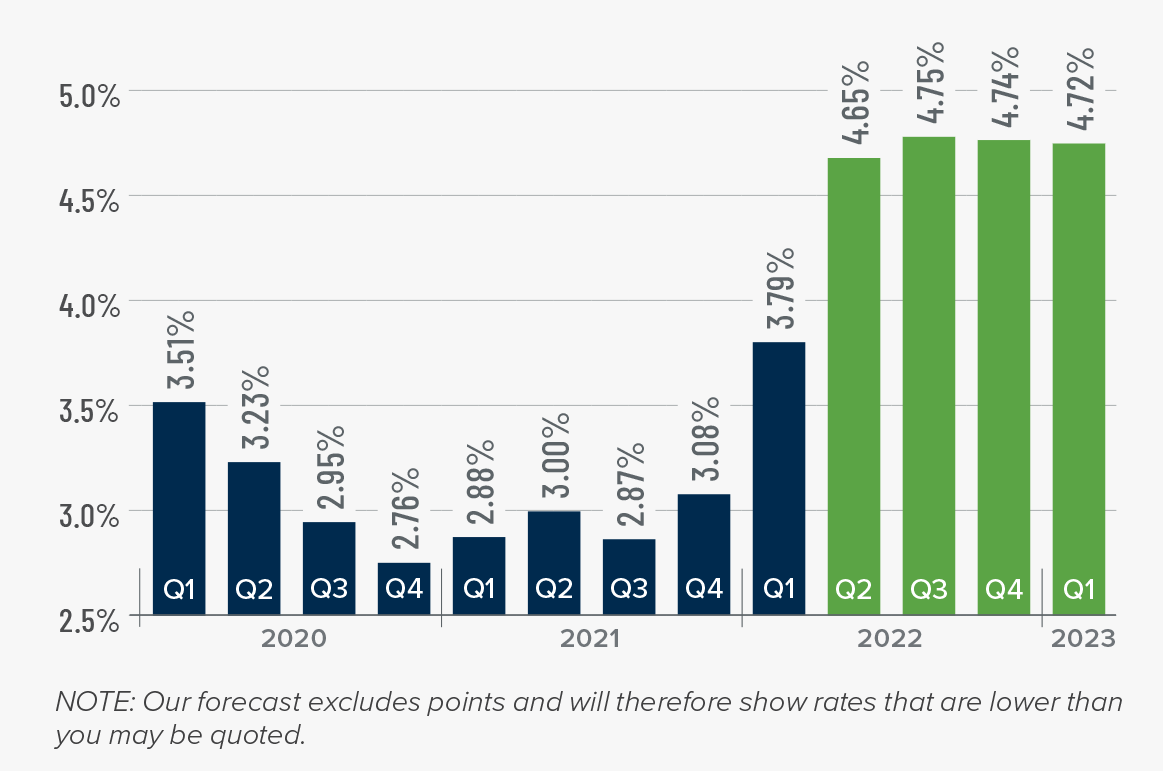
Average rates for a 30-year conforming mortgage were 3.11% at the end of 2021, but since then have jumped over 1.5%—the largest increase since 1987. The speed of the surge in rates is due to the market having quickly priced in the seven-to-eight rate increase that the Fed is expected to implement this year.
Because the mortgage market has priced this into the rates they are offering today, my forecast suggests that we are getting close to a ceiling in rates, and it is my belief that they will rise modestly in the second quarter before stabilizing for the balance of the year.
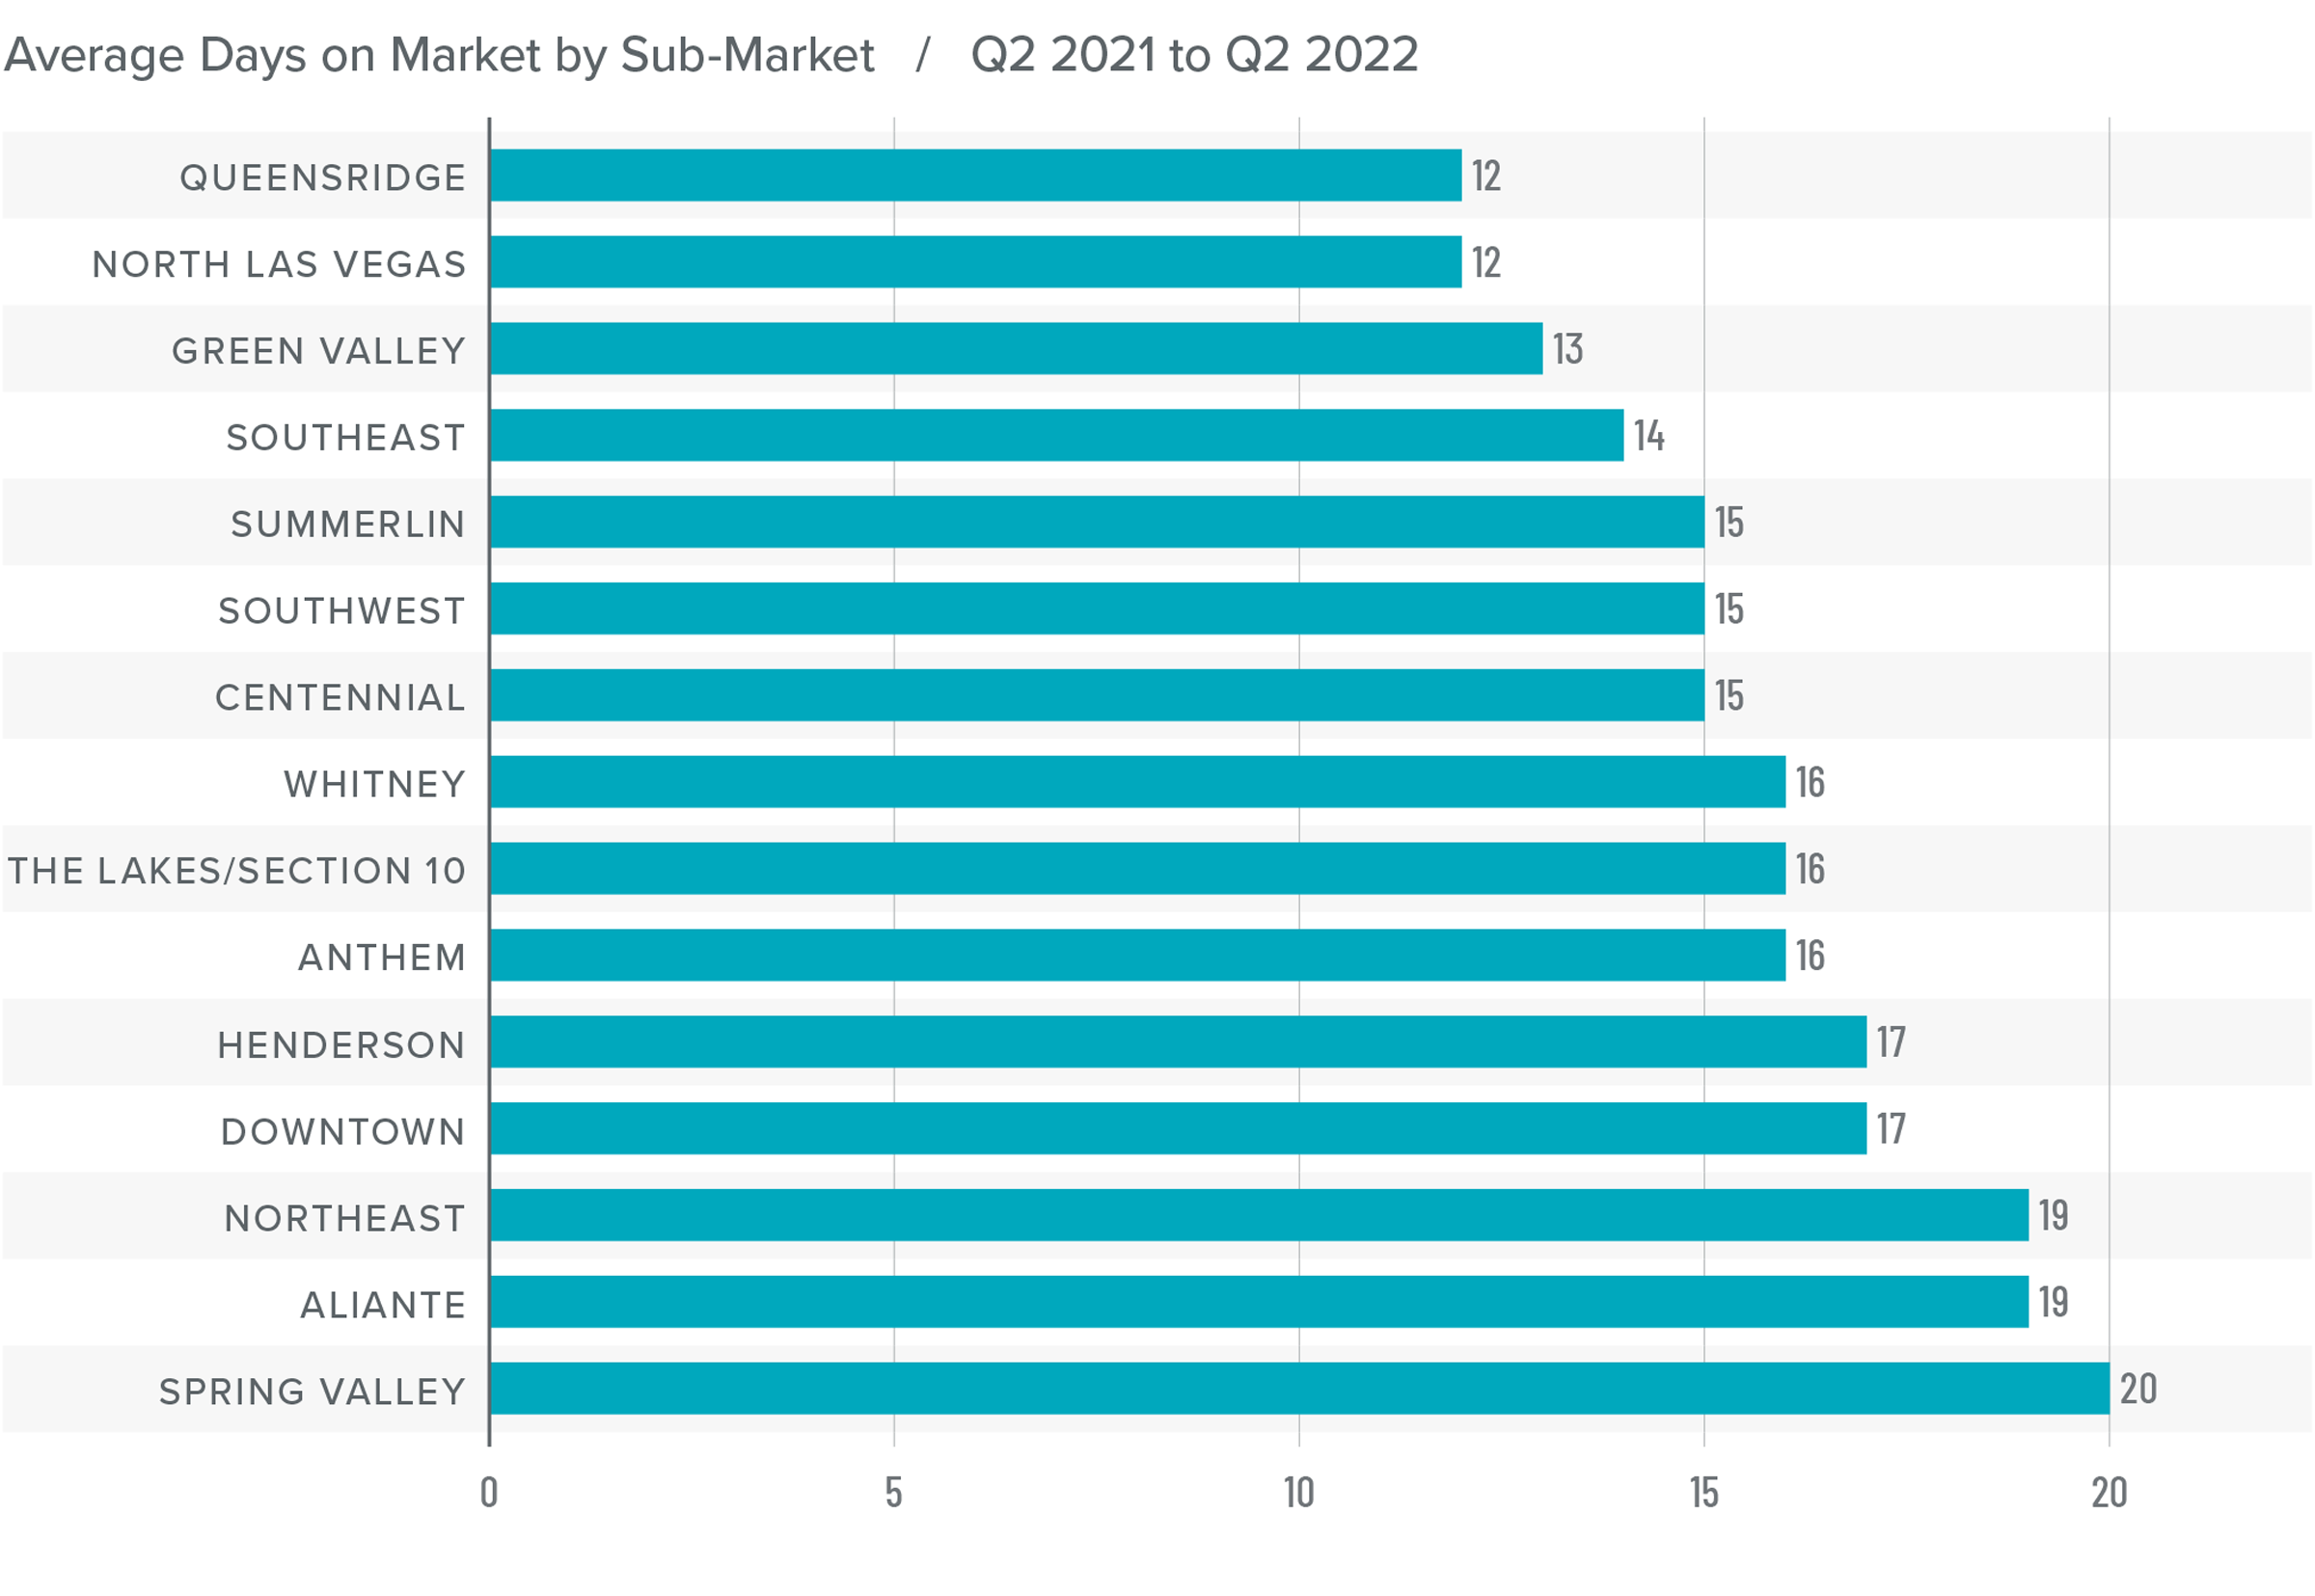
Nevada Days on Market
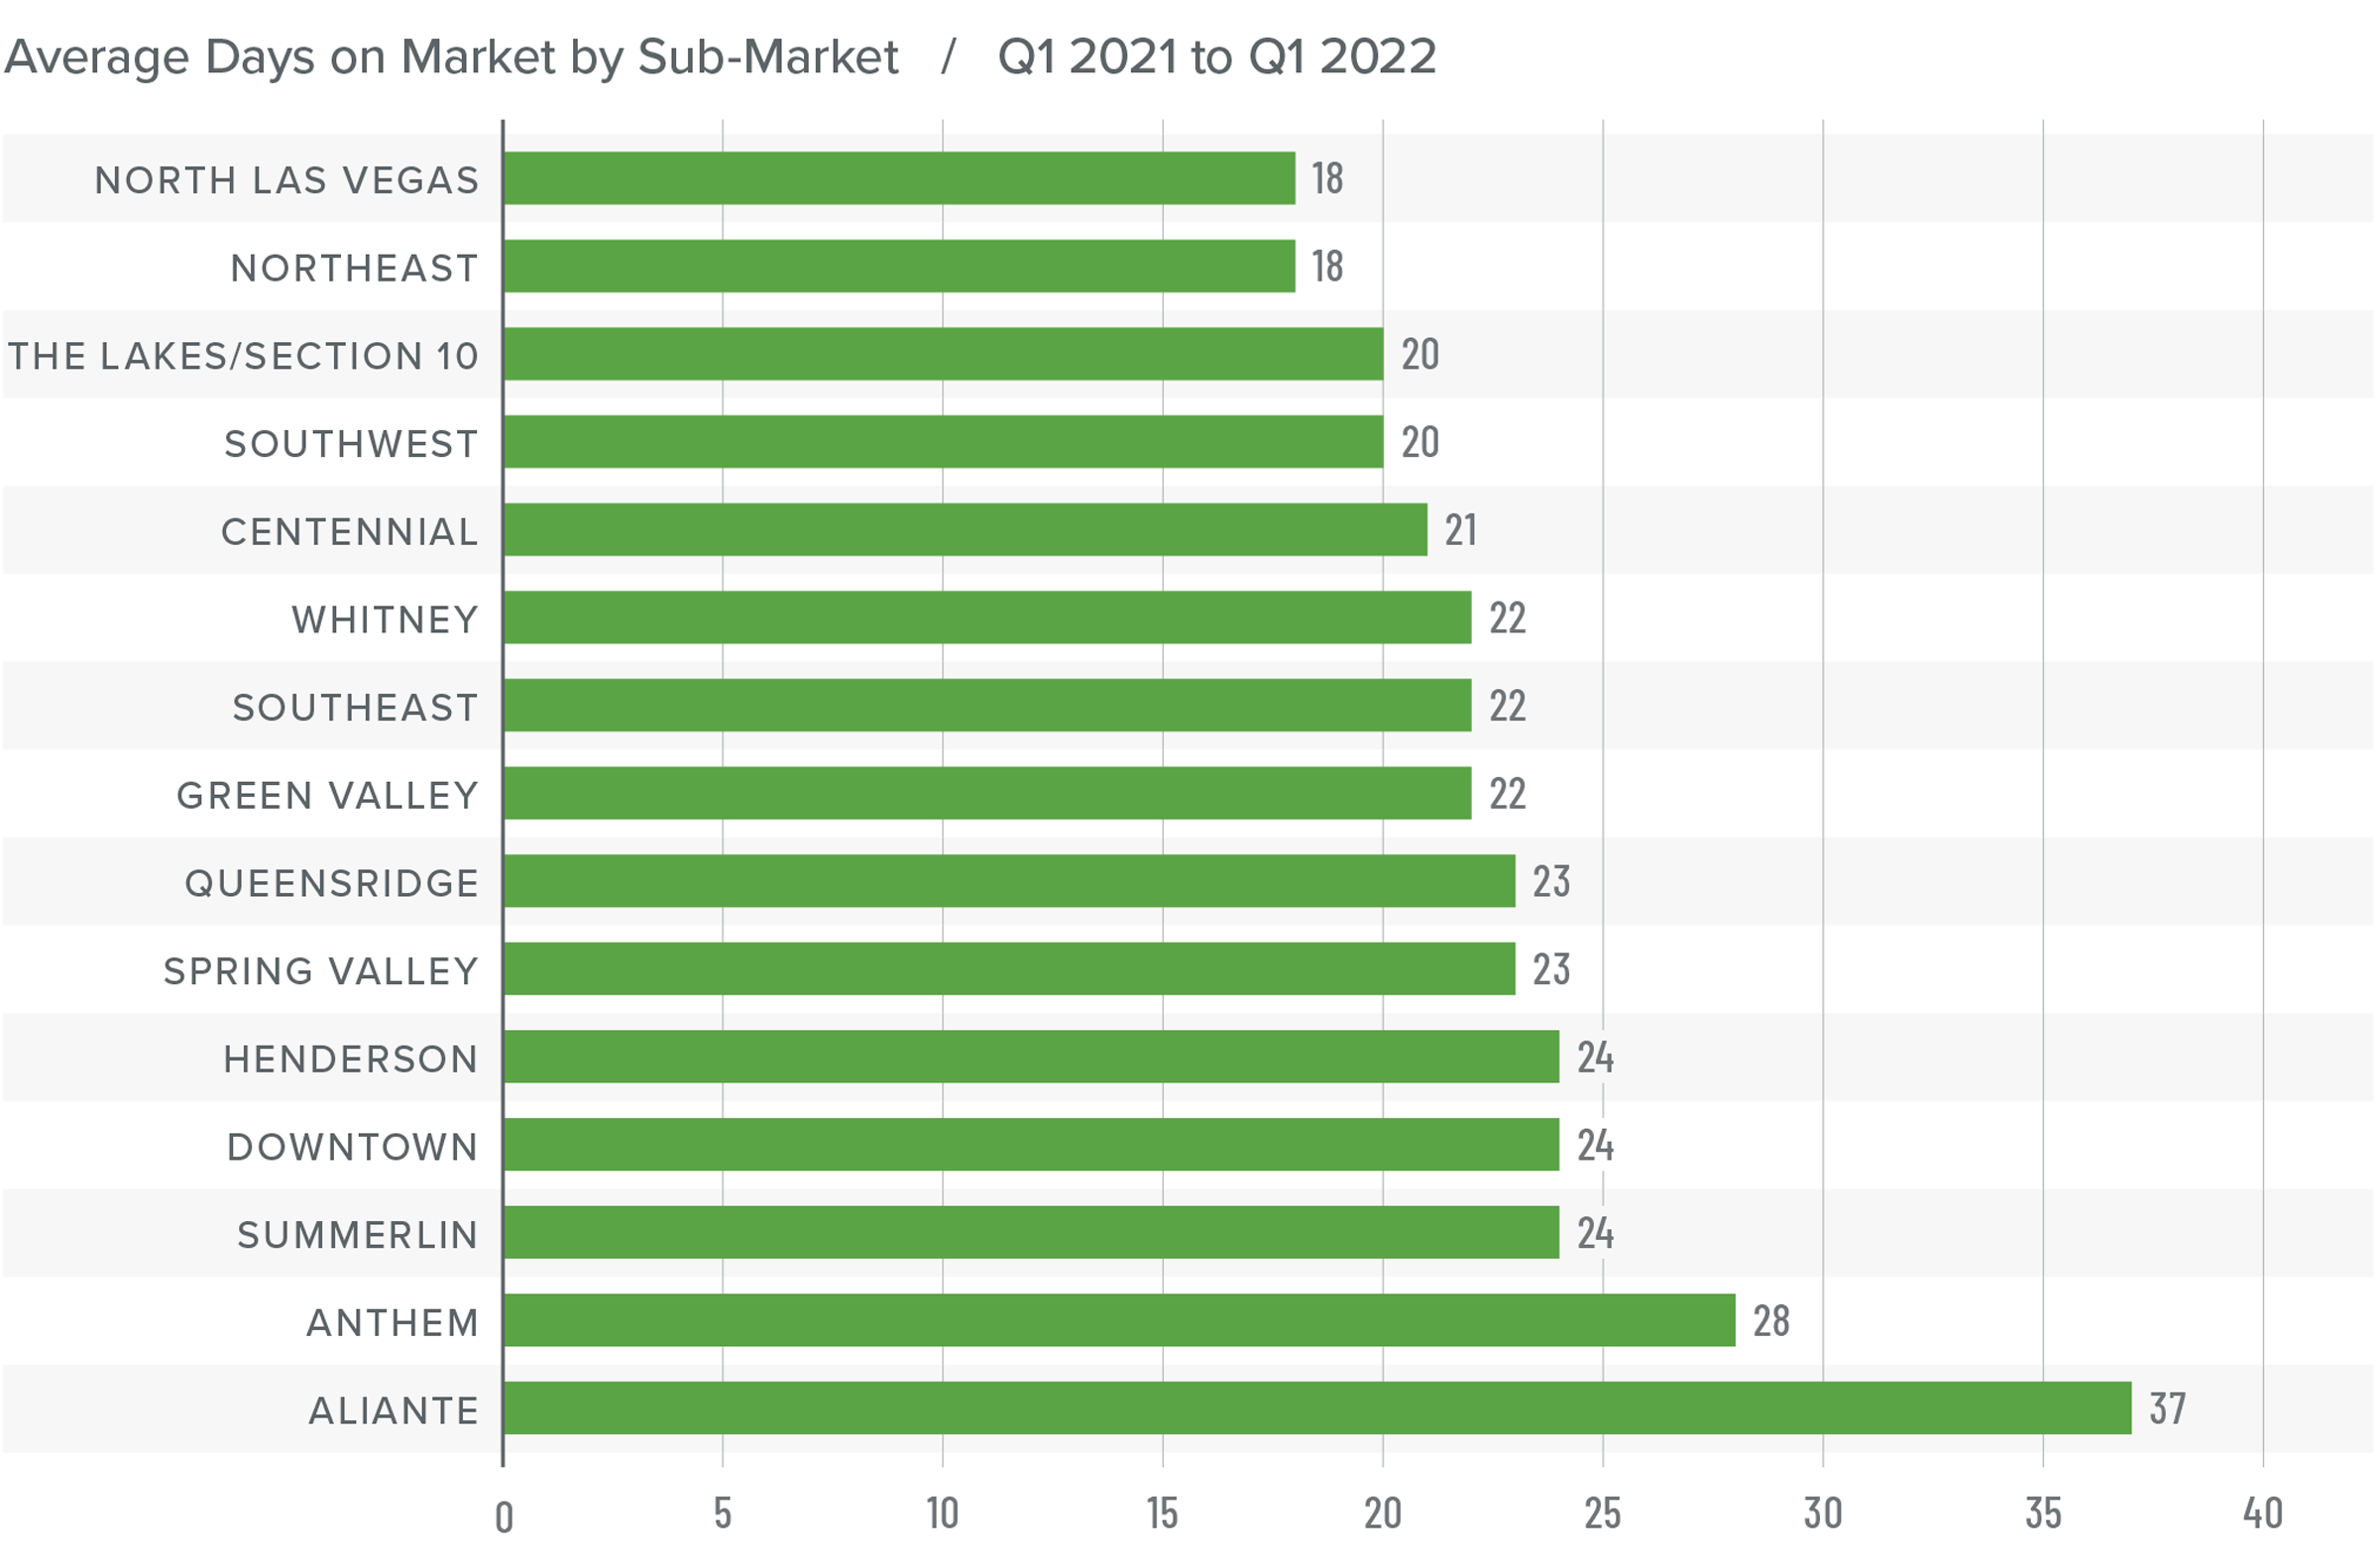
❱ The average time it took to sell a home in the region dropped 16 days compared to the first quarter of 2021.
❱ It took an average of 23 days to sell a home in the quarter, which matched the average market time in the fourth quarter of 2021.
❱ Days-on-market dropped across the board compared to a year ago, but rose in Aliante, The Lakes/Section 10, Southeast and Southwest Las Vegas, Spring Valley, and Northeast Las Vegas compared to the prior quarter.
❱ The greatest drop in market time was in The Lakes/ Section 10 neighborhood, where the length of time it took to sell a home fell 33 days compared to a year ago.
Conclusions
This speedometer reflects the state of the region’s real estate market using housing inventory, price gains, home sales, interest rates, and larger economic factors.
The local economy appears to be picking up momentum, which typically translates into demand for housing. As mentioned earlier, if there are impacts to sales or prices from rising mortgage rates, we will likely see signs of this in the next two quarters. With supply levels as low as they are, rising financing costs may not slow the market significantly. Housing affordability continues to fall as price growth rises. This, combined with higher mortgage rates, should temper the market, though it hasn’t yet. It might seem intuitive to move the needle a little toward home buyers, but the numbers don’t justify it.

All things considered, I have left the needle in the same position as the last quarter. There are too many uncertainties that preclude me from moving it one way or another. Hopefully the spring will provide more clarity.
About Matthew Gardner
As Chief Economist for Windermere Real Estate, Matthew Gardner is responsible for analyzing and interpreting economic data and its impact on the real estate market on both a local and national level. Matthew has over 30 years of professional experience both in the U.S. and U.K.
In addition to his day-to-day responsibilities, Matthew sits on the Washington State Governors Council of Economic Advisors; chairs the Board of Trustees at the Washington Center for Real Estate Research at the University of Washington; and is an Advisory Board Member at the Runstad Center for Real Estate Studies at the University of Washington where he also lectures in real estate economics.
Q4 2021 Nevada Real Estate Market Update

The following analysis of the greater Las Vegas real estate market is provided by Windermere Real Estate Chief Economist Matthew Gardner. We hope that this information may assist you with making better-informed real estate decisions. For further information about the housing market in your area, please don’t hesitate to contact your Windermere Real Estate agent.
Regional Economic Overview
The Las Vegas labor market continues to recover from the pandemic, but the question is whether the latest variant of COVID-19 will slow the job recovery. The area has recovered over 204,000 of the more than 280,000 jobs that were lost in early 2020, which means Las Vegas is still 76,000 jobs shy of pre-pandemic levels. As jobs return, the unemployment level drops. The latest data shows that 6.3% of the workforce is still unemployed. This is a high number given that the pandemic started over 22 months ago, but it is still a significant improvement over the pandemic peak of 33.3%. The employment picture is one of a somewhat slow, but steady, recovery. The question remains as to what impacts, if any, the rise of the Omicron variant of COVID-19 will have.
nevada Home Sales
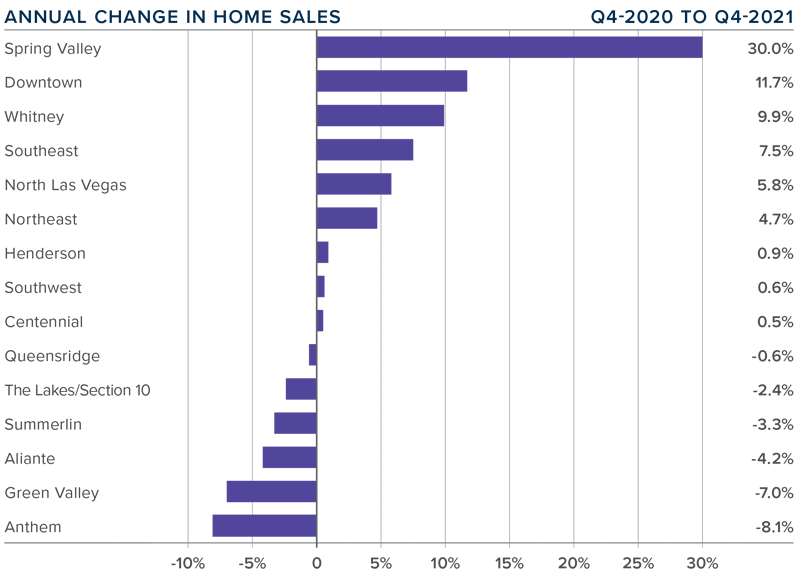
❱ A total of 10,222 homes sold in the final quarter of 2021—an increase of 2.1% compared to the same period a year ago, but 4.4% lower than the previous quarter.
❱ Pending sales, which are an indicator of future closings, fell 11.3% compared to the third quarter of the year, suggesting that closings in the first quarter of 2022 may not be robust.
❱ Sales were a mixed bag, rising in nine neighborhoods but falling in six. Spring Valley and Downtown saw significant increases. Where sales fell, the drop was modest. Compared to the third quarter, sales fell in all markets other than Northeast Las Vegas, Spring Valley, and Queens Ridge, but this can be attributed to seasonality as well as remarkably low supply levels.
❱ There were 34.9% fewer homes for sale in the quarter compared to the previous year, which likely impacted closed and pending sales.
nevada Home Prices
❱ Home prices rose 19.7% from a year ago to an average of $459,151. Prices were also 4.6% higher than in the third quarter of 2021.
❱ Mortgage rates notched up last fall, but the impact was not enough to significantly slow price growth. Additionally, fewer homes for sale meant that the market remained hot.
❱ Prices rose by double digits in every sub-market compared to the same quarter last year and rose in all markets other than Henderson and Queens Ridge compared to the third quarter.
❱ The labor market continues to improve, and mortgage rates have yet to get to a point where they could have a tangible impact on prices. That said, I expect them to rise as we move through 2022, which will likely act as somewhat of a headwind to price appreciation.
Days on Market
❱ The average time it took to sell a home in the region dropped 14 days compared to the fourth quarter of 2020.
❱ It took an average of 23 days to sell a home in the quarter, which was 5 more days than in the third quarter of the year.
❱ Days-on-market dropped across the board compared to a year ago but rose in all areas other than Downtown and Queens Ridge compared to the prior quarter.
❱ The greatest drop in market time was in the Aliante market, where the length of time it took to sell a home fell 31 days compared to a year ago.

Conclusions
This speedometer reflects the state of the region’s real estate market using housing inventory, price gains, home sales, interest rates, and larger economic factors.
The job market continues to improve and, despite rising mortgage rates, there appears to still be significant demand from home buyers. Listing prices leveled off last summer, which might have led some to believe that the market was cooling off, but they started rising again in the fall. This was probably disappointing for home buyers who have been in a highly competitive market for quite some time.
Given all the data, and even in the face of mortgage rates that will continue rising for the foreseeable future, I have moved the needle a little more toward sellers as they are still in control.
About Matthew Gardner

As Chief Economist for Windermere Real Estate, Matthew Gardner is responsible for analyzing and interpreting economic data and its impact on the real estate market on both a local and national level. Matthew has over 30 years of professional experience both in the U.S. and U.K.
In addition to his day-to-day responsibilities, Matthew sits on the Washington State Governors Council of Economic Advisors; chairs the Board of Trustees at the Washington Center for Real Estate Research at the University of Washington; and is an Advisory Board Member at the Runstad Center for Real Estate Studies at the University of Washington where he also lectures in real estate economics.
Q3 2021 Nevada Real Estate Market Update

The following analysis of the greater Las Vegas real estate market is provided by Windermere Real Estate Chief Economist Matthew Gardner. We hope that this information may assist you with making better-informed real estate decisions. For further information about the housing market in your area, please don’t hesitate to contact your Windermere Real Estate agent.
Regional Economic Overview
The Las Vegas economy continues to recover following the major loss of jobs that resulted from the pandemic. Over the past three months, the area returned a respectable 23,300 jobs of which almost half were in the hard-hit Leisure and Hospitality industry. Although jobs are returning at a fairly decent pace, it is worth noting that the current employment level is still down 89,000 jobs from the peak prior to COVID-19. The unemployment level in Las Vegas has dropped to 8.2%, significantly lower than the pandemic peak of 33.3%, and I am optimistic the area will return to full employment by the end of next summer.
nevada Home Sales
❱ A total of 10,690 homes sold in the third quarter, which was an increase of 12.3% compared to the same period a year ago. Sales were 4.9% lower than during the second quarter.
❱ Pending sales, which are an indicator of future closings, fell 4.5% compared to the second quarter of the year.
❱ Sales rose in every neighborhood other than Centennial, but the drop there was minor. Transactions rose the most in the Whitney and Southeast Las Vegas market areas, but six additional neighborhoods also experienced double-digit growth.
❱ The drop in pending sales may be a function of rising inventory levels which are giving buyers more choice and allowing them to take more time deciding which home they want to buy.
nevada Home Prices

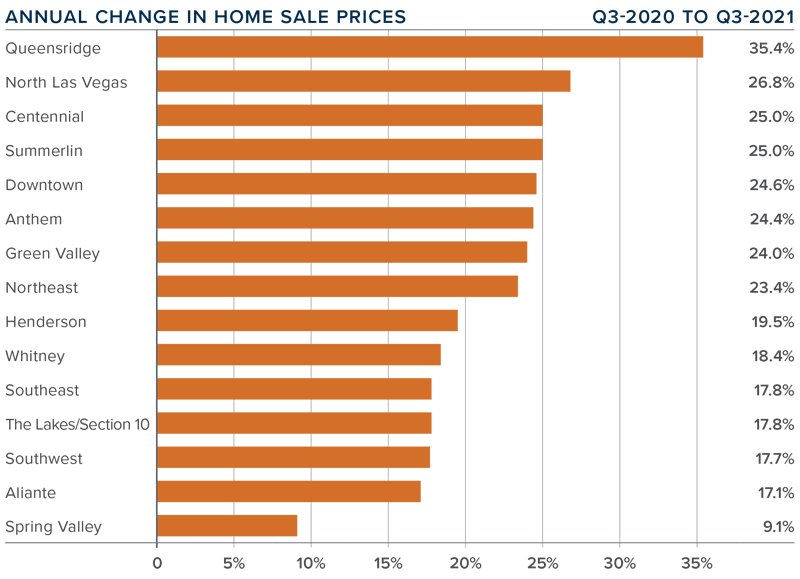
❱ Home prices rose 20.7% from a year ago to an average of $438,994. Prices were also 2.3% higher than in the second quarter of this year. The rise of prices over the past few years is certainly impacting affordability, which is the lowest it has been since 2018.
❱ Mortgage rates remain competitive, which is causing prices to continue trending higher even as affordability constraints emerge.
❱ Prices rose by double digits in every sub-market other than Spring Valley compared to the same quarter last year. Compared to the second quarter of this year, prices were also higher in every area other than Anthem and Henderson.
❱ Although the economy is improving, affordability will act as a headwind to significant price growth moving forward. When mortgage rates start to tick higher, this too will have a slowing effect on the pace of appreciation.
Days on Market
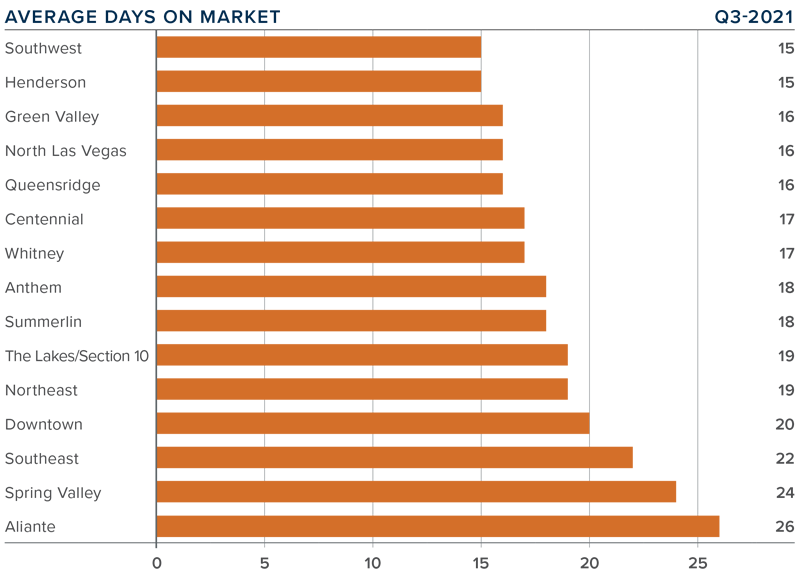
❱ The average time it took to sell a home in the region fell 24 days compared to the third quarter of 2020.
❱ It took an average of 18 days to sell a home in the third quarter, which was 4 fewer days than in the second quarter of 2021.
❱ Days on market dropped across the board compared to a year ago, and all areas other than Anthem and Queensridge saw market time fall compared to the second quarter of this year.
❱ The greatest drop in market time was in the Aliante market, where the length of time it took to sell a home fell 43 days compared to a year ago.
Conclusions
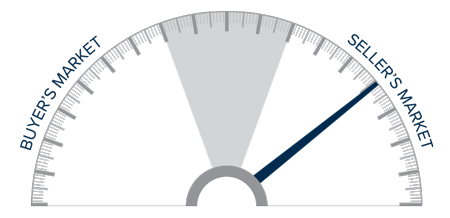
This speedometer reflects the state of the region’s real estate market using housing inventory, price gains, home sales, interest rates, and larger economic factors.
Jobs in Las Vegas continue to recover, and this should be a stimulant to the housing market. However, higher inventory levels combined with slower sales tells me that we need to look at the impact of rising home prices. Listing prices shot up earlier this year but levelled off and then dropped during the summer. This suggests that sellers realized there is a limit to what their homes are really worth.
As a result, the market may have lost some momentum, but it’s nothing more than a move back to a more realistic pace of home-price appreciation. All things considered, with rising inventory levels and slower price growth, I am moving the needle a little toward buyers. However, it remains a seller’s market.
About Matthew Gardner
As Chief Economist for Windermere Real Estate, Matthew Gardner is responsible for analyzing and interpreting economic data and its impact on the real estate market on both a local and national level. Matthew has over 30 years of professional experience both in the U.S. and U.K.
In addition to his day-to-day responsibilities, Matthew sits on the Washington State Governors Council of Economic Advisors; chairs the Board of Trustees at the Washington Center for Real Estate Research at the University of Washington; and is an Advisory Board Member at the Runstad Center for Real Estate Studies at the University of Washington where he also lectures in real estate economics.
Q2 2021 Nevada Real Estate Market Update

The following analysis of the greater Las Vegas real estate market is provided by Windermere Real Estate Chief Economist Matthew Gardner. We hope that this information may assist you with making better-informed real estate decisions. For further information about the housing market in your area, please don’t hesitate to contact your Windermere Real Estate agent.
Regional Economic Overview
The job market in Las Vegas continues to recover from the significant impacts of COVID-19, with the pace of jobs returning picking up a little steam in recent months. In the second quarter 30,100 jobs returned, which is up from 12,800 in the first quarter. That said, total employment in the area is still down by more than 105,000 jobs from its pre-pandemic peak. Even as jobs return, the unemployment level remains elevated at 8.9%. However, this is still significantly lower than the pandemic-induced peak of 33.3%. Although the region continues its job recovery, I am concerned that the rise in new COVID-19 cases, which started to trend higher in June, may slow the pace of recovery.
nevada Home Sales
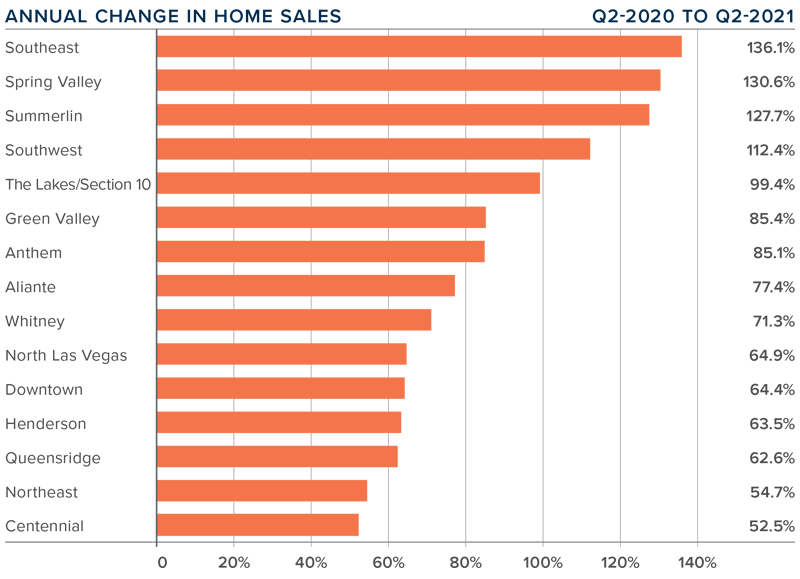
❱ A total of 11,243 homes sold in the second quarter, a massive increase of more than 84% compared to the same period a year ago, and 15.8% higher than in the first quarter of this year.
❱ Pending sales—an indicator of future closings— rose 3.3% compared to the first quarter of the year. I would have liked to see a higher number, but I put the relatively low level down to supply-side constraints.
❱ Compared to second quarter of last year, sales rose over 50% in every market and more than doubled in four. Although these statistics sound amazing, we should not forget that the pandemic was in full swing a year ago, which had a significant impact on home sales.
❱ Lower pending sales can be attributed to the fact that the average number of homes on the market in the quarter was down 3.4% relative to the first quarter of the year, and down more than 60% from the same period a year ago. The market remains supply starved.
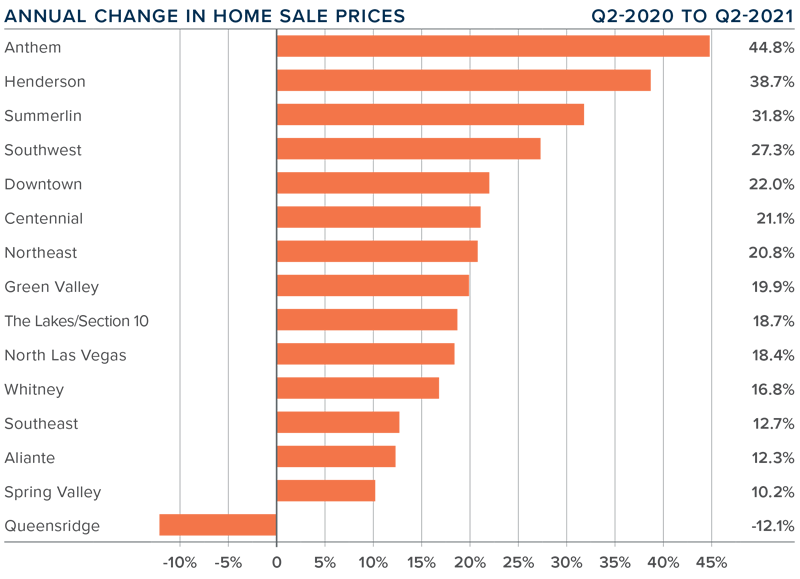
nevada Home Prices

❱ With sales up and listings down, it should come as no surprise that home prices continued their upward trend. Year over year, average prices were up 27.1% to $429,049. Sale prices were also 8.3% higher than in the first quarter of this year.
❱ Mortgage rates rose in the first quarter but have again pulled back, which has increased interest from buyers and is pushing prices higher.
❱ Prices rose in every sub-market other than Queensridge compared to the same quarter last year, with double-digit gains in all neighborhoods. When compared to the first quarter of 2021, prices were also higher in every area other than Queensridge, with double-digit appreciation in Anthem, The Lakes/Section 10, Southwest, and Northeast Las Vegas.
❱ The takeaway is that demand still exceeds supply, and this is causing prices to continue to rise at a significant pace. That said, the rate of appreciation is unsustainable, and will start to slow; the question is when.
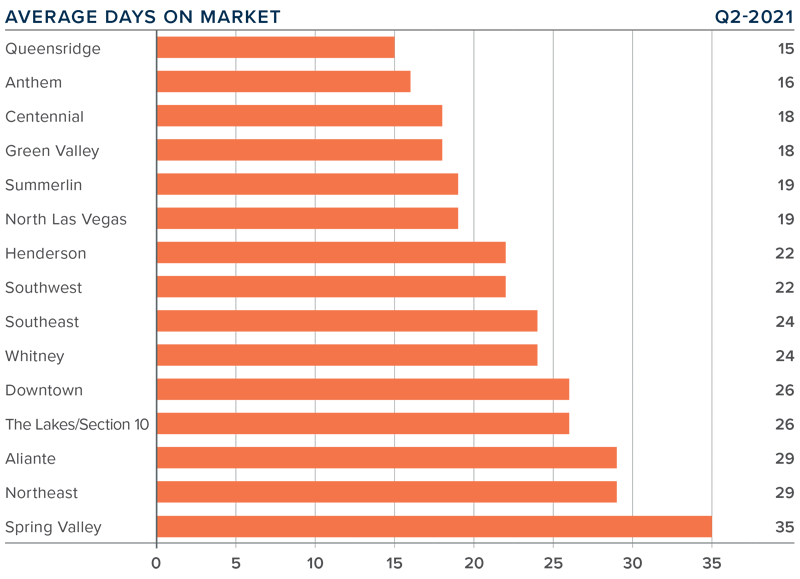
Days on Market
❱ The average time it took to sell a home in the region dropped 15 days compared to the second quarter of 2020.
❱ It took an average of 23 days to sell a home in the second quarter, which was 16 fewer days than in the first quarter of 2021.
❱ Days-on-market dropped across the board compared to a year ago, and all areas saw market time fall compared to the first quarter of this year.
❱ The greatest decline in market time was in the Aliante market, where the length of time it took to sell a home dropped 29 days compared to a year ago.
Conclusions
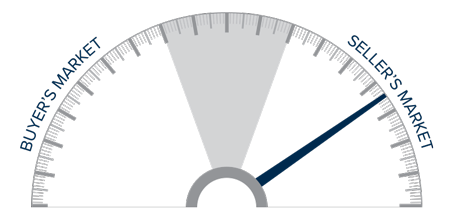
This speedometer reflects the state of the region’s real estate market using housing inventory, price gains, home sales, interest rates, and larger economic factors.
Even though jobs are returning, rising COVID-19 cases may slow the area’s economic recovery. I suspect that some home sellers will choose to wait to list their homes until infection rates start to drop. If this is the case, the supply-demand imbalance we see today will only be exacerbated. While this is bad news for home buyers, it will bode well for sellers. As such, I am moving the needle a little more in their favor.
About Matthew Gardner
As Chief Economist for Windermere Real Estate, Matthew Gardner is responsible for analyzing and interpreting economic data and its impact on the real estate market on both a local and national level. Matthew has over 30 years of professional experience both in the U.S. and U.K.
In addition to his day-to-day responsibilities, Matthew sits on the Washington State Governors Council of Economic Advisors; chairs the Board of Trustees at the Washington Center for Real Estate Research at the University of Washington; and is an Advisory Board Member at the Runstad Center for Real Estate Studies at the University of Washington where he also lectures in real estate economics.
")


