
 Facebook
 X
X
 Pinterest
 Copy Link

The following analysis of the Metro Denver & Northern Colorado real estate market is provided by Windermere Real Estate Chief Economist Matthew Gardner. We hope that this information may assist you with making better-informed real estate decisions. For further information about the housing market in your area, please don’t hesitate to contact me.
ECONOMIC OVERVIEW
It’s good news for the state of Colorado, which saw annual employment grow in all of the metropolitan markets included in this report. The state added 63,400 non-agricultural jobs over the past 12 months, an impressive growth rate of 2.4%. Colorado has been adding an average of 5,300 new jobs per month for the past year, and I anticipate that this growth rate will continue through the balance of 2018.
In February, the unemployment rate in Colorado was 3.0%—a level that has held steady for the past six months. Unemployment has dropped in all the markets contained in this report, with the lowest reported rates in Fort Collins and Denver, where 3.1% of the labor force was actively looking for work. The highest unemployment rate was in Grand Junction, which came in at 4.6%.
HOME SALES ACTIVITY
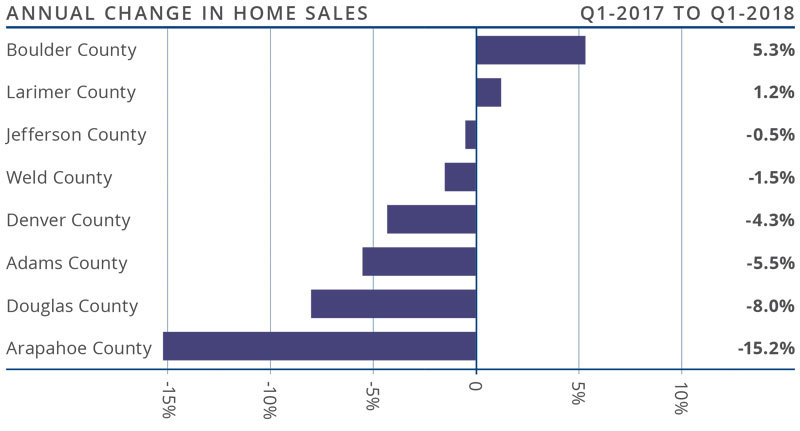
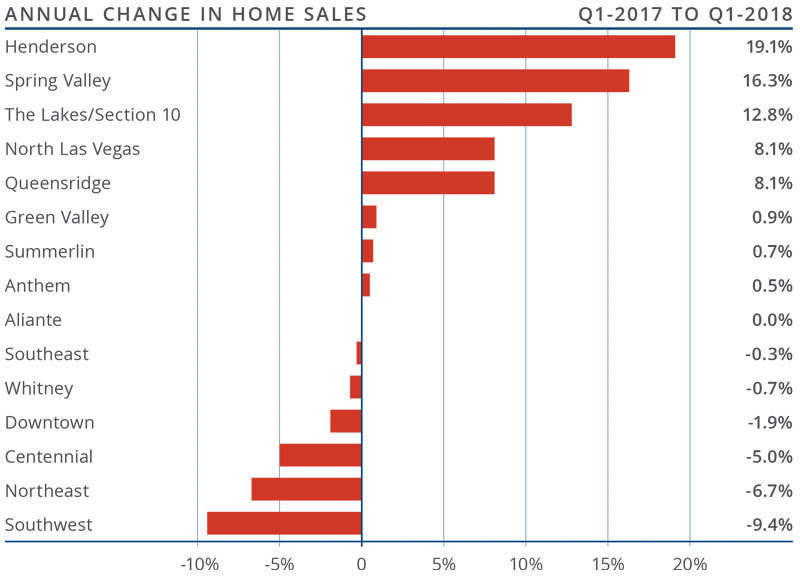
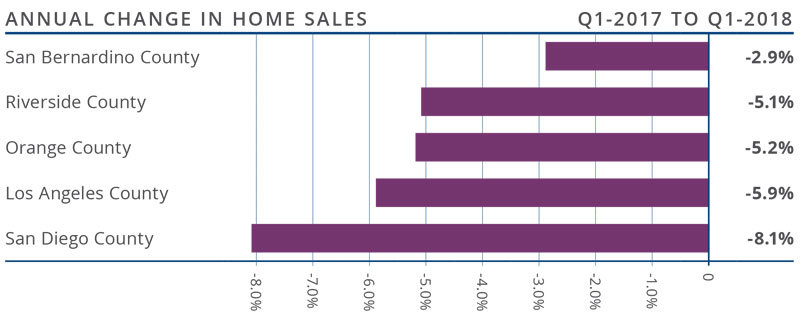
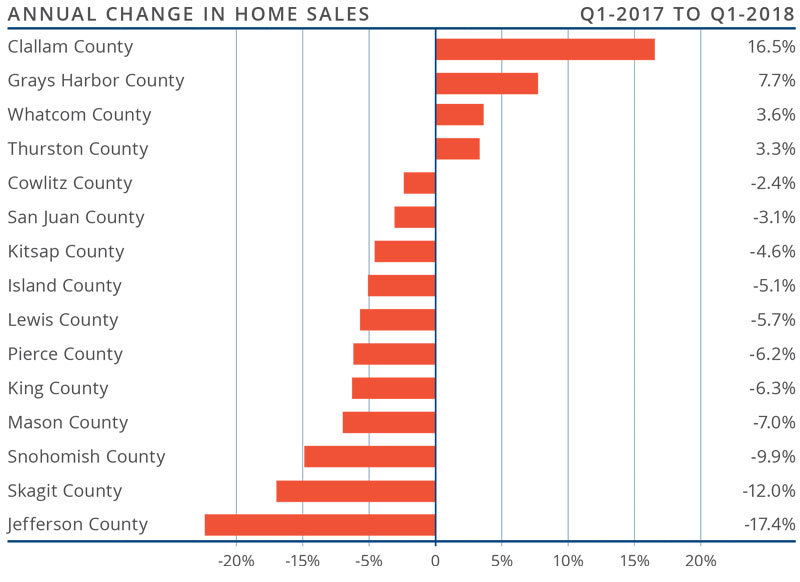
- In the first quarter of 2018, there were 11,173 home sales—a drop of 5.6% when compared to the first quarter of 2017.
- With an increase of 5.3%, home sales rose the fastest in Boulder County, as compared to first quarter of last year. There was also a modest sales increase of 1.2% in Larimer County. Sales fell in all the other counties contained within this report.
- Home sales continue to slow due to low inventory levels, which were down 5.7% compared to a year ago.
- The takeaway here is that sales growth continues to stagnate due to the lack of homes for sale.
HOME PRICES
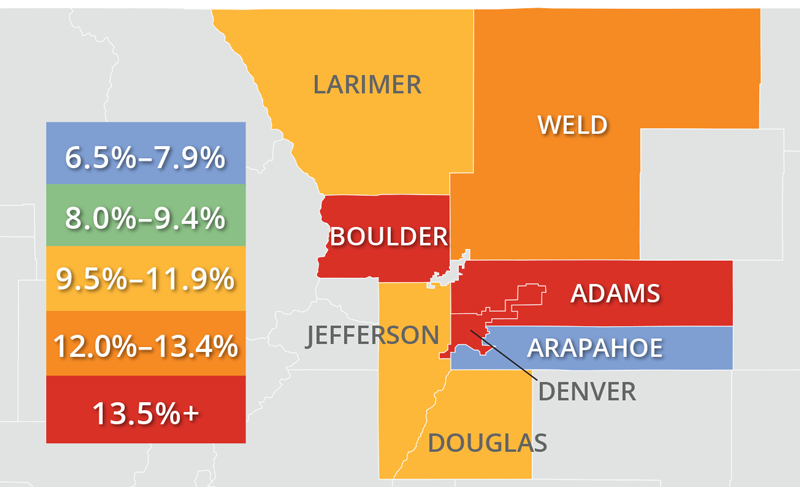
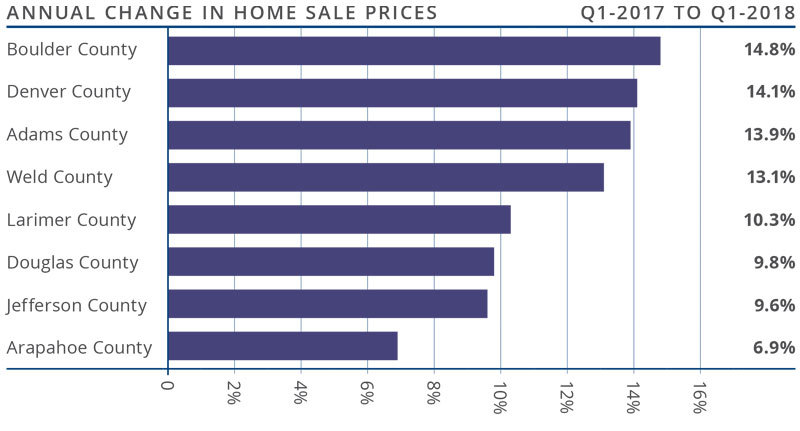
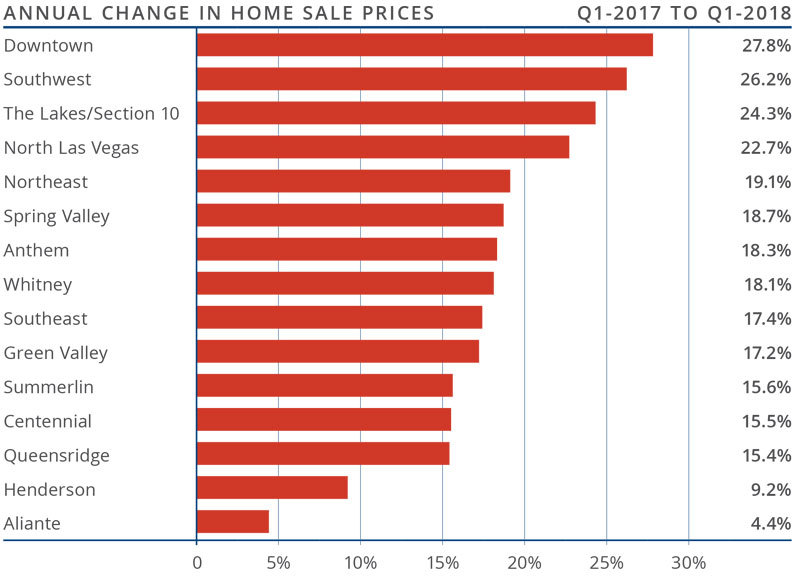
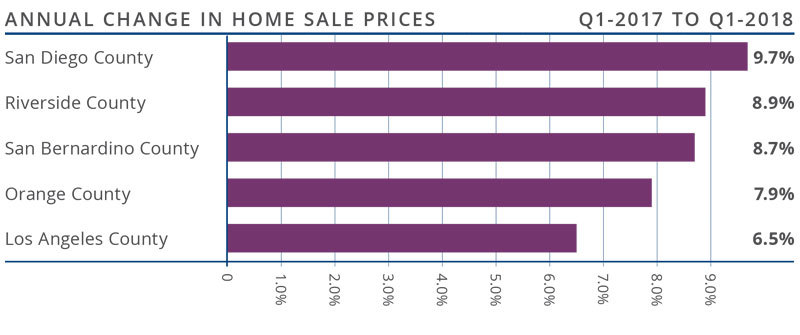
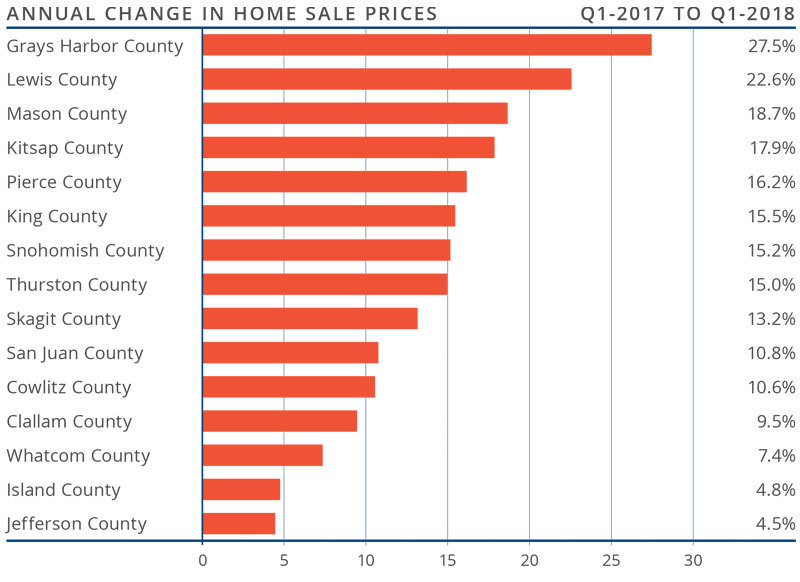
![]() Strong economic growth, combined with limited inventory, continued to push prices higher. The average home price in the markets covered by this report was up by 11.7% year-over-year to $448,687.
Strong economic growth, combined with limited inventory, continued to push prices higher. The average home price in the markets covered by this report was up by 11.7% year-over-year to $448,687.- Arapahoe County saw slower appreciation in home values, but the trend is still positiveand above its long-term average.
- Appreciation was strongest in Boulder County, which saw prices rise 14.8%. Almost all other counties in this report experienced solid gains.
- The ongoing imbalance between supply and demand persists and home prices continue to appreciate at above-average rates.
 Strong economic growth, combined with limited inventory, continued to push prices higher. The average home price in the markets covered by this report was up by 11.7% year-over-year to $448,687.
DAYS ON MARKET
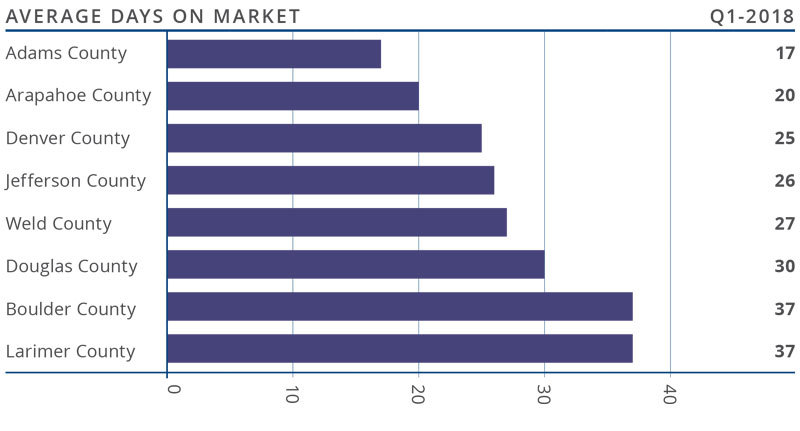
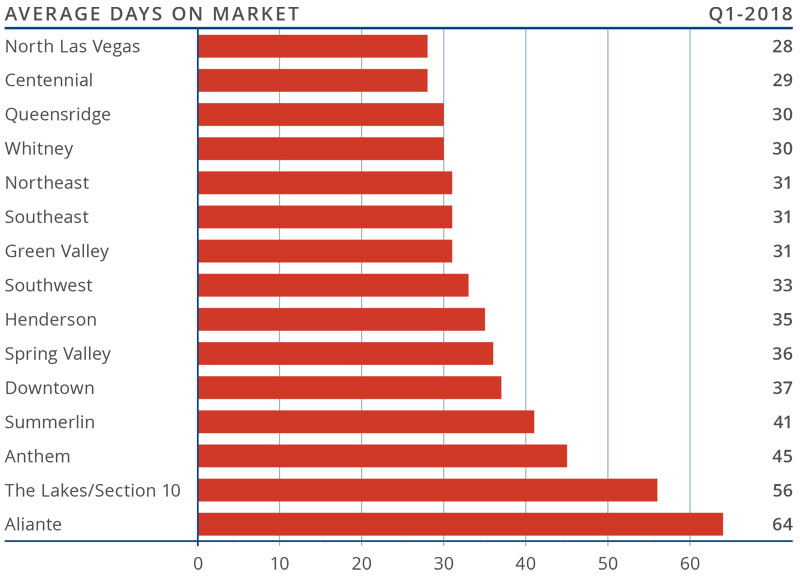
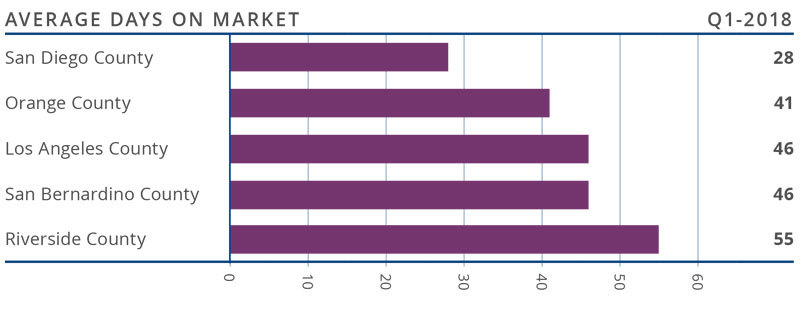
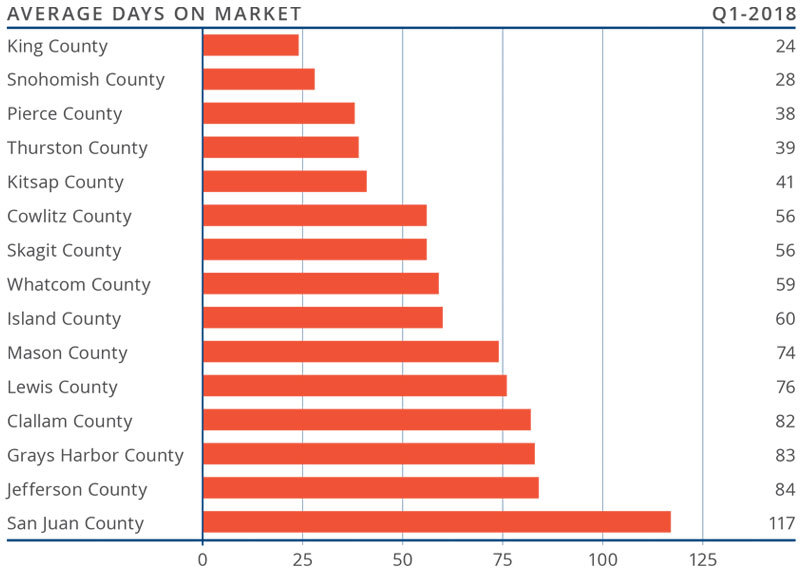
- The average number of days it took to sell a home dropped by three days when compared to the first quarter of 2017.
- Homes in all but two counties contained in this report took less than a month to sell. Adams County continues to stand out where it took an average of just 17 days to sell a home.
- During the first quarter, it took an average of 27 days to sell a home. That rate is down 2 days from the fourth quarter of 2017.
- Housing demand remains strong and would-be buyers should expect to see stiff competition for well-positioned, well-priced homes.
CONCLUSIONS
 This speedometer reflects the state of the region’s housing market using housing inventory, price gains, home sales, interest rates, and larger economic factors. In the first quarter of 2018, I have left the needle where it was in the fourth quarter of last year. Even as interest rates trend higher, it appears as if demand will continue to outweigh supply. As we head into the spring months, I had hoped to see an increase in the number of homes for sale, but so far that has not happened. As a result, the housing market continues to heavily favor sellers.

Matthew Gardner is the Chief Economist for Windermere Real Estate, specializing in residential market analysis, commercial/industrial market analysis, financial analysis, and land use and regional economics. He is the former Principal of Gardner Economics, and has more than 30 years of professional experience both in the U.S. and U.K.


")


