
 Facebook
 X
X
 Pinterest
 Copy Link

The following analysis of the Eastern Washington real estate market is provided by Windermere Real Estate Chief Economist Matthew Gardner. We hope that this information may assist you with making better-informed real estate decisions. For further information about the housing market in your area, please don’t hesitate to contact your Windermere agent.
ECONOMIC OVERVIEW
Employment in Washington State continues to soften; it is currently at an annual growth rate of 1.7%. I believe this is a temporary slowdown and we will see the pace of employment growth improve as we move further into the new year. It’s clear that businesses are continuing to feel the effects of the trade war with China and this is impacting hiring practices. This is, of course, in addition to the issues that Boeing currently faces regarding the 737 MAX.
My most recent economic forecast suggests that statewide job growth in 2020 will rise 2.2%, with a total of 76,300 new jobs created. The Eastern Washington market added 17,800 total jobs over the past 12 months, representing an annual growth rate of a very impressive 3.8%. That said, and even as the region added jobs, the unemployment rate rose to 5.2% from 4.9% a year ago. This does not worry me, though, as the county data is not seasonally adjusted, and the areas covered by this report tend to see unemployment rates rise during the winter months. Additionally, the labor force grew by almost 20,000 persons, which likely added to the unemployment rolls.
HOME SALES
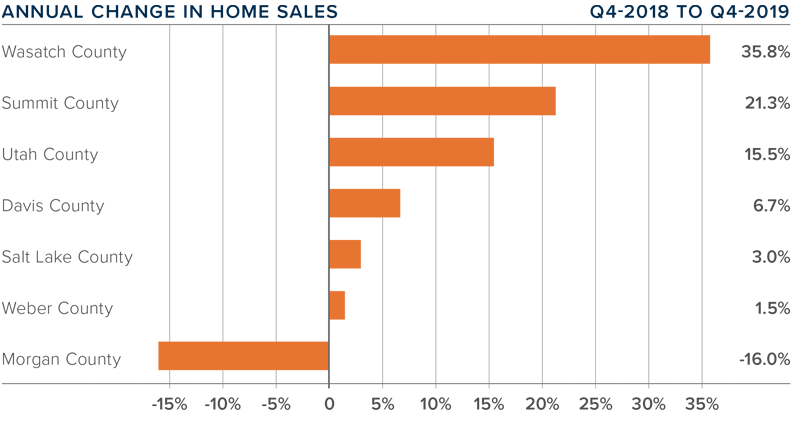
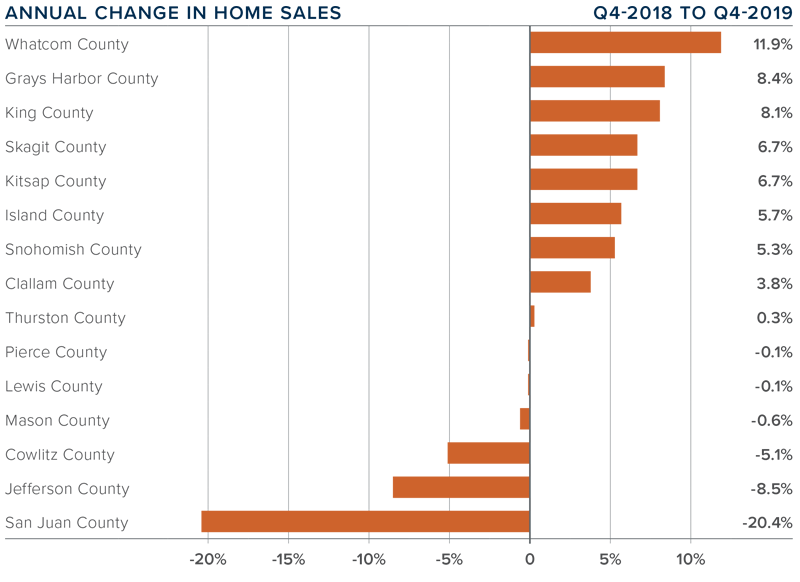
- Home sales throughout Eastern Washington were up 5.8% compared to the same quarter in 2018, with a total of 3,405 closed sales.
- Pending home sales in the region were 1.8% lower than a year ago and 41% lower than in the third quarter of 2019, suggesting that first-quarter closings will likely be lower.
- Sales activity dropped in Lincoln and Grant counties, but the total contraction amounted to only 21 fewer sales, so there is nothing to be concerned about.
- The average number of homes for sale in the quarter was 22.6% lower than a year ago, suggesting that the market remains very tight. I do not expect any significant increases in listing activity until the second half of 2020.

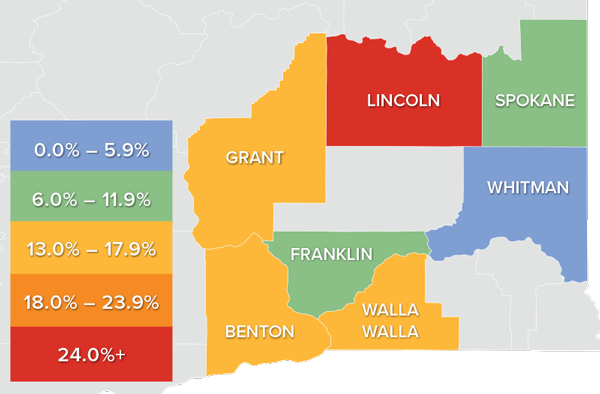
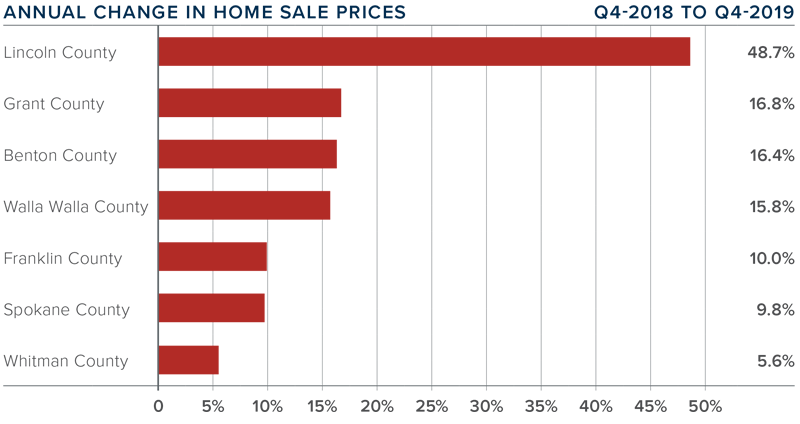
HOME PRICES
![]() Year-over-year, the average home price in Eastern Washington rose by a significant 12.3% to $297,048. That said, prices were 2.2% lower than in the third quarter.
Year-over-year, the average home price in Eastern Washington rose by a significant 12.3% to $297,048. That said, prices were 2.2% lower than in the third quarter.- As mentioned in the previous section, low inventory levels are pervasive and are likely the most significant hurdle to many home buyers. Low inventory continues to put upward pressure on prices.
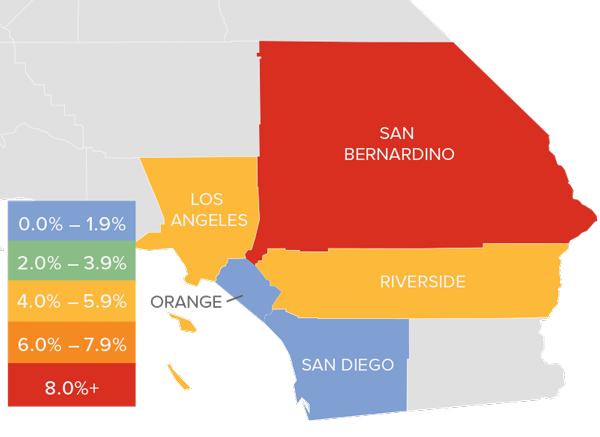
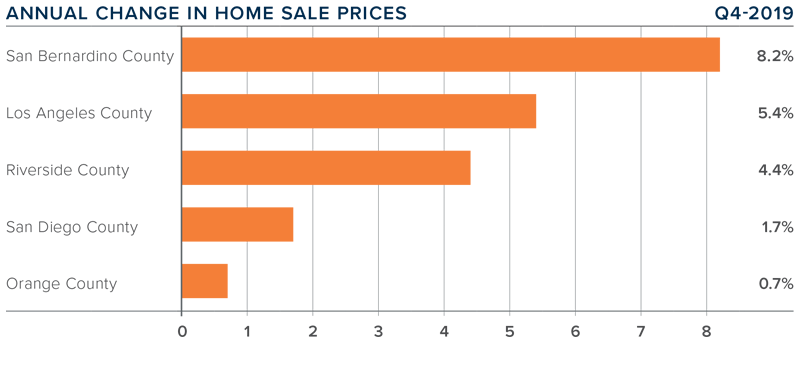
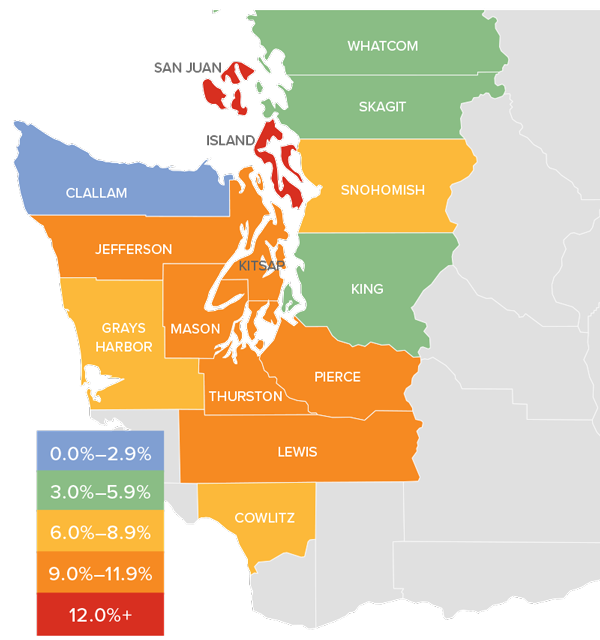
- Prices rose in all of the counties contained in this report, with double-digit gains in all but two counties.
- The takeaway is that average home-price growth in Eastern Washington remains well above the long-term average.
 Year-over-year, the average home price in Eastern Washington rose by a significant 12.3% to $297,048. That said, prices were 2.2% lower than in the third quarter.
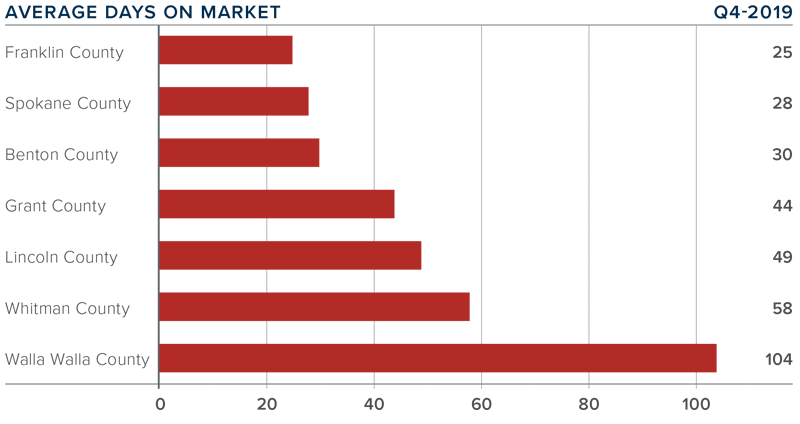
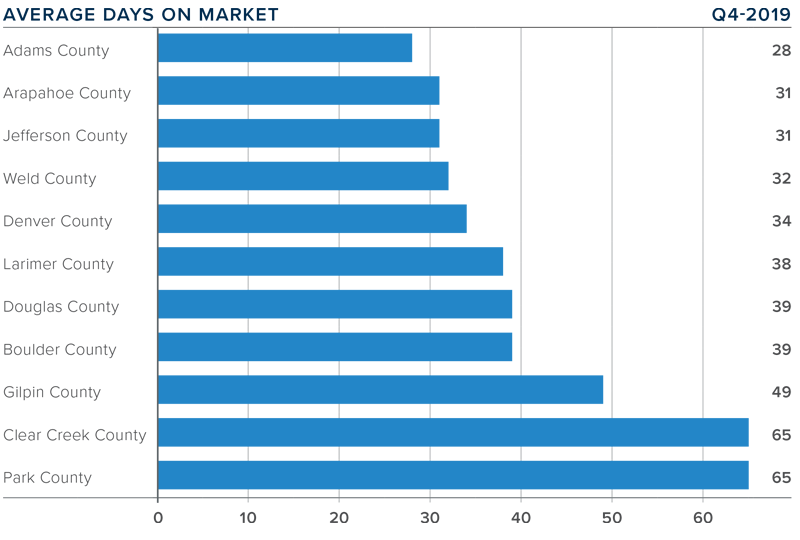
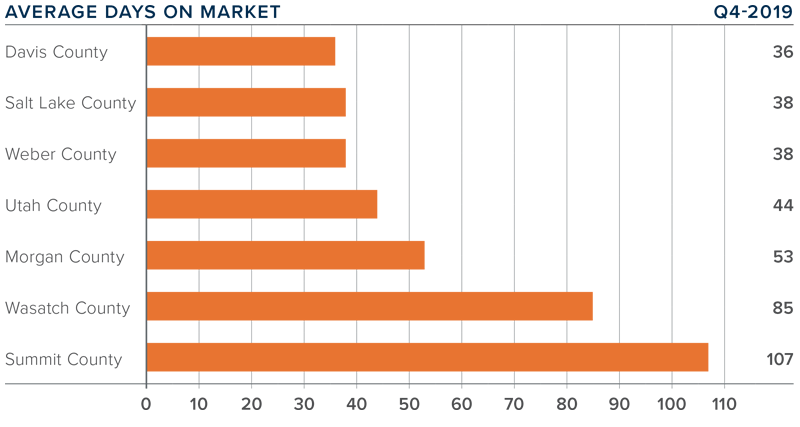
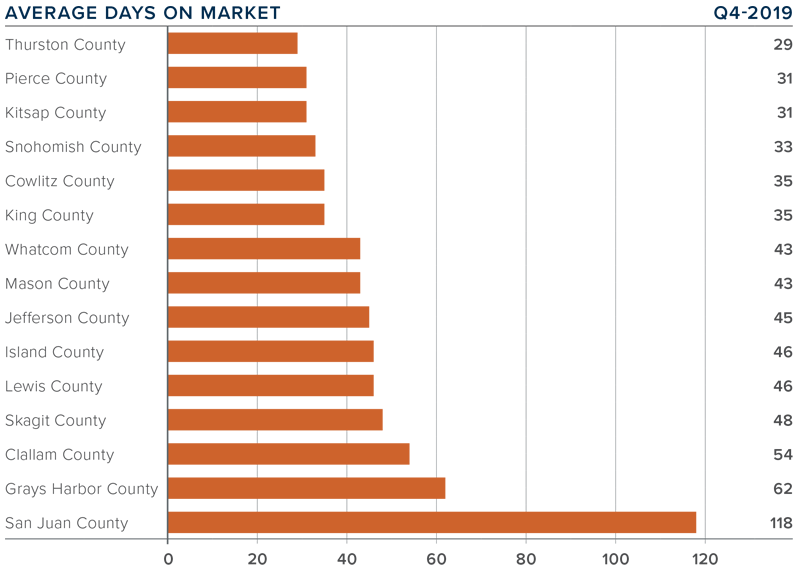
DAYS ON MARKET
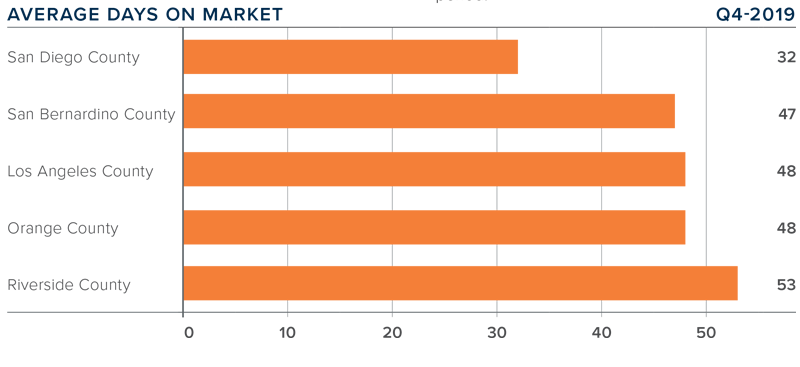
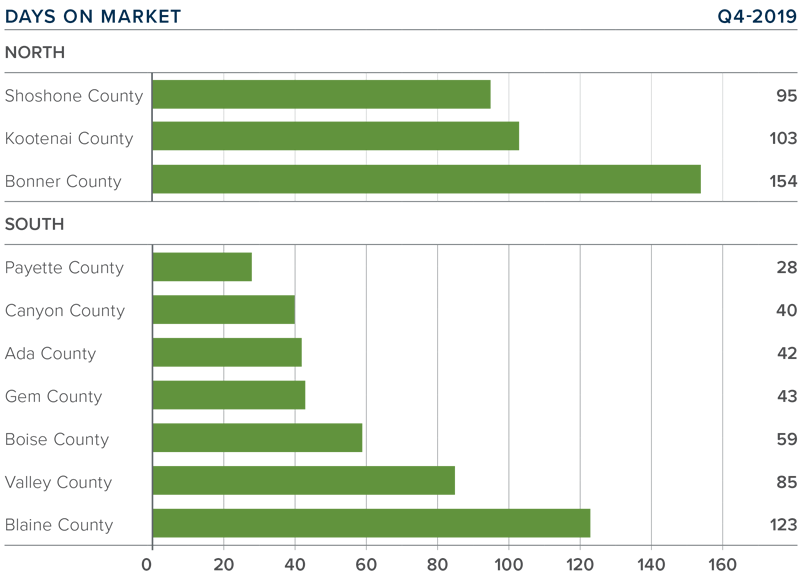
- The average time it took to sell a home in Eastern Washington in the final quarter of 2019 was 48 days.
- During the fourth quarter, it took 15 fewer days to sell a home in Eastern Washington than it did a year ago.
- Across the region the market was split: it took longer to sell homes in Whitman and Walla Walla counties but days on market dropped in the rest of the region.
- It took two days longer to sell a home in the fourth quarter than it did in the third quarter of 2019.
CONCLUSIONS
 This speedometer reflects the state of the region’s real estate market using housing inventory, price gains, home sales, interest rates, and larger economic factors.
Home sales are up and so are prices, which certainly favors sellers. Mortgage rates remain remarkably competitive and this is allowing buyers to afford more house for their money. Inventory levels are still well below what I would like to see and, therefore, the Eastern Washington housing market remains very tight. As such, I am moving the needle just a little more in favor of home sellers.
ABOUT MATTHEW GARDNER

As Chief Economist for Windermere Real Estate, Matthew Gardner is responsible for analyzing and interpreting economic data and its impact on the real estate market on both a local and national level. Matthew has over 30 years of professional experience both in the U.S. and U.K.
In addition to his day-to-day responsibilities, Matthew sits on the Washington State Governors Council of Economic Advisors; chairs the Board of Trustees at the Washington Center for Real Estate Research at the University of Washington; and is an Advisory Board Member at the Runstad Center for Real Estate Studies at the University of Washington where he also lectures in real estate economics.


 Home prices continue to trend higher, with the average home price in the region rising 4.3% year-over-year to $473,264.
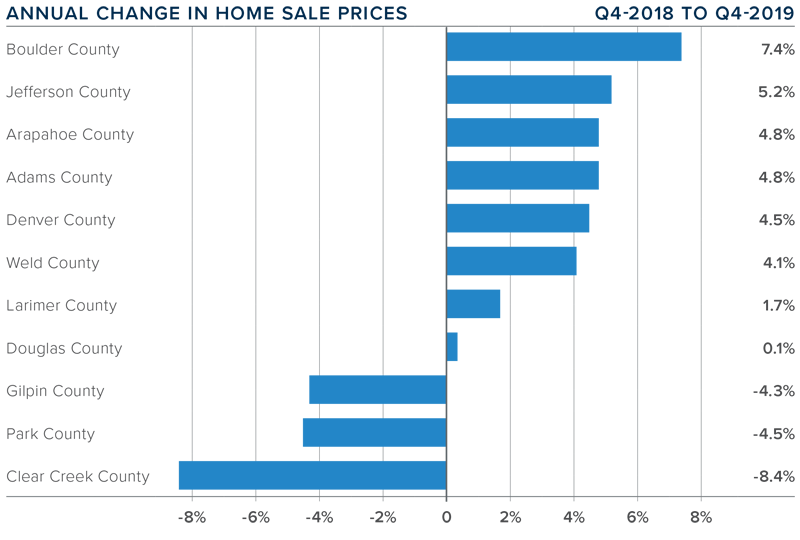
 This speedometer reflects the state of the region’s real estate market using housing inventory, price gains, home sales, interest rates, and larger economic factors.
 As Chief Economist for Windermere Real Estate, Matthew Gardner is responsible for analyzing and interpreting economic data and its impact on the real estate market on both a local and national level. Matthew has over 30 years of professional experience both in the U.S. and U.K.
 The average home price in the region continued to rise in the fourth quarter, with a year-over-year increase of 9.5% to an average of $403,186. Home prices were 0.4% higher than in the third quarter of 2019.
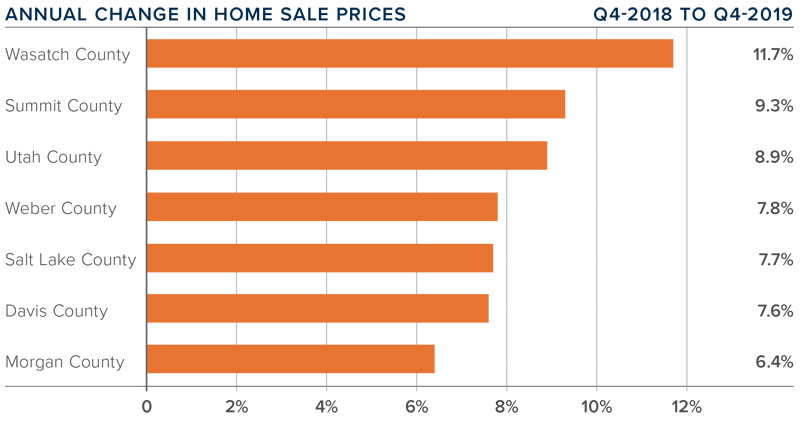
 This speedometer reflects the state of the region’s real estate market using housing inventory, price gains, home sales, interest rates, and larger economic factors.

 The speedometer reflects the state of the region’s real estate market using housing inventory, price gains, home sales, interest rates, and larger economic factors. Inventory levels and affordability concerns persist, but there still appears to be demand from home buyers. Pending sales have risen, which suggests the market still has legs to grow, thanks in no small part to competitive mortgage rates. Given the tight inventory levels and decent demand, I have moved the needle a little more toward sellers.
 The average home price in the region rose 11.7% year-over-year to $377,011 and sale prices were 2.5% higher than in the third quarter of 2019.
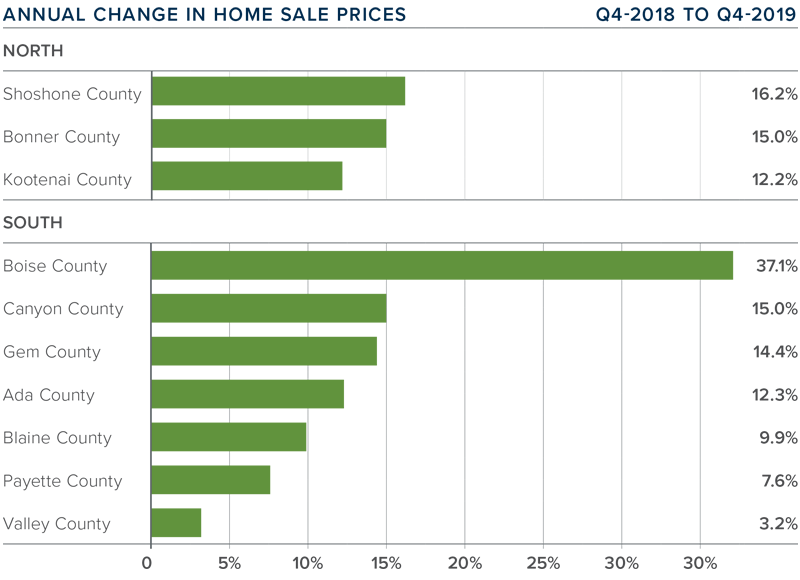
 The speedometer reflects the state of the region’s housing market using housing inventory, price gains, home sales, interest rates, and larger economic factors.
 Home price growth in Western Washington spiked during fourth quarter, with average prices 8.3% higher than a year ago. The average sale price in Western Washington was $526,564, 0.7% higher than in the third quarter of 2019.
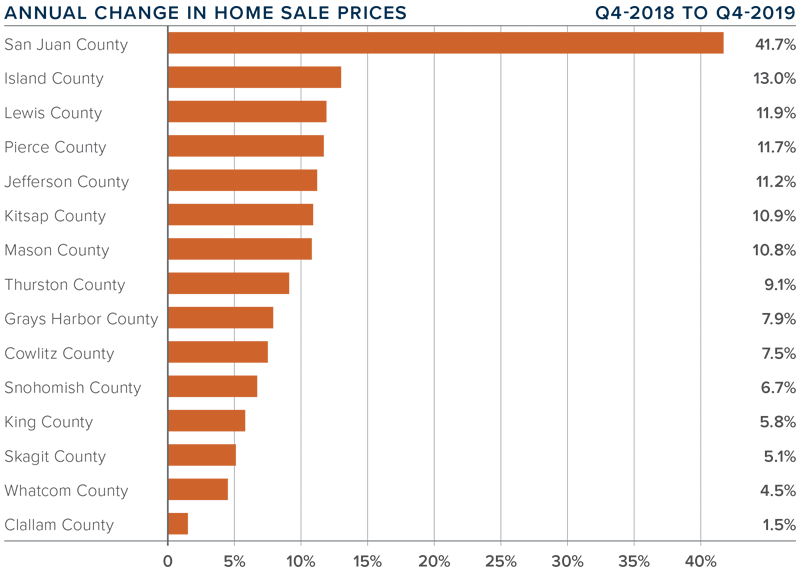
 This speedometer reflects the state of the region’s real estate market using housing inventory, price gains, home sales, interest rates, and larger economic factors.


")


