
 Facebook
 X
X
 Pinterest
 Copy Link

The Federal Housing Finance Authority recently put a hold on raising upfront mortgage fees given pushback that suggested home buyers with good credit were being penalized. Windermere Chief Economist Matthew Gardner looks at Loan Level Price Adjustments (LLPAs) to explain why some headlines were misleading.
This video on the proposed FHFA mortgage fee changes is the latest in our Monday with Matthew series with Windermere Chief Economist Matthew Gardner. Each month, he analyzes the most up-to-date U.S. housing data to keep you well-informed about what’s going on in the real estate market.
FHFA Mortgage Fee Changes
Hello there, I’m Windermere Real Estate’s Chief Economist Matthew Gardner, and welcome to this month’s episode of Monday with Matthew. As most of you are aware, the Federal Housing Finance Authority announced that they were going to raise the upfront fees for mortgages backed by Fannie Mae and Freddie Mac, and that led to significant backlash from some suggesting that borrowers with good credit would now be paying more than borrowers with bad credit.
And as these voices grew louder, Congress stepped in with House Financial Services Committee Chair Patrick McHenry and Housing and Insurance subcommittee Chair Warren Davidson announcing a plan to repeal these fee increases if they were introduced. Well, this did not go unnoticed, and the FHFA announced on May 10th that they were putting a hold on a new fee structure in order to engage industry stakeholders and better understand their concerns.
So, for now nothing has changed, but I still think it’s a subject worth discussing because we will see another proposal from the FHFA at some point in the future. So, what’s going on?
Well, periodically the FHFA raises the upfront fees that the Agencies charge borrowers for the purchase and refinance of mortgages that they guarantee, and these fees are called Loan Level Price Adjustments, or LLPAs.
In April of 2022, these fees went up for several types of loans including ones in expensive markets that have a higher conforming loan limit than seen nationally, and they also raised fees on second home mortgages. But to support affordable housing, the lower rates for certain programs including HomeReady, Home Possible, and HFA Advantage weren’t increased. And they didn’t raise fees for loans to first-time home buyers in high-cost areas if they earned at or below the area median income.
And the new round of fee increases that was scheduled to start in May of this year has many believing that it was just another subsidy given to households with lower credit that’s being paid for by households with better credit. But is that really an accurate statement? I don’t necessarily think so.
First off, the FHFA had to increase fees this year simply because they needed the money to cover higher capital requirements that went into effect last year, but that’s a topic for another day. For now, let’s take a look at the changes that would have been made.
Changes to LLPAs

The matrix you see here shows you the difference between the fee that was in place and the one that was proposed. Remember, this is not the actual fee itself, but the spread between the old and new pricing. And, as you can see, on face value it really does look to benefit borrowers with lower credit scores and penalize households with better credit. For example…
Changes to LLPAs: Credit Score 640 – 659
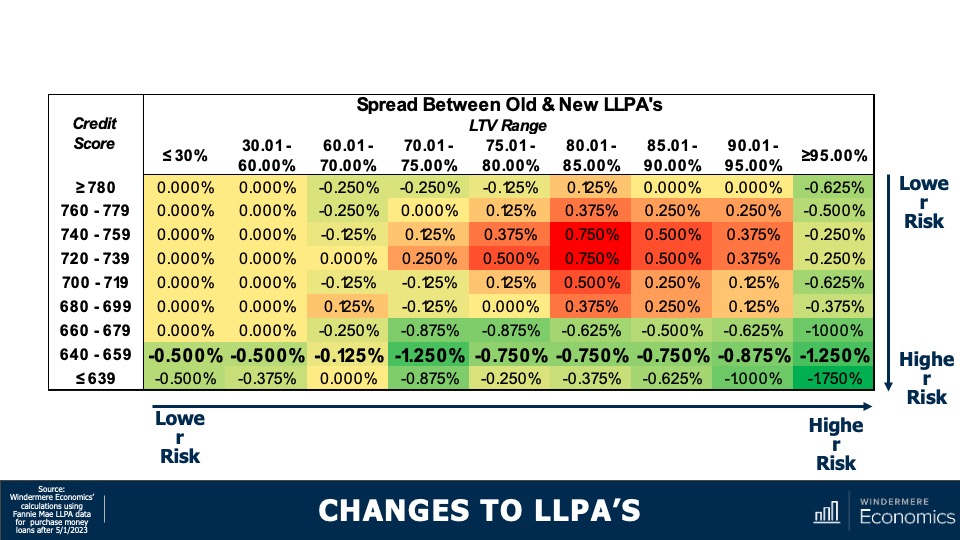
A household with a credit score of between 640 and 659 would see savings across all loan-to-value ranges versus the following:
Changes to LLPAs: Credit Score 740 – 759

A household with a credit rating of 740 to 759 who would be paying the same or more in all bar two scenarios with fees increasing between 0.125% and three quarters of a percent.
But is this really something to be worried about?
There are two things that stand out to me. The first is that a household putting down less than 20% has to buy private mortgage insurance. So, in reality, these households are actually less of a risk to the agencies than those who don’t, so isn’t it right that they should pay less in fees? Secondly, although I can’t disagree with anyone who states that families with lower credit will see fees go down and, generally speaking, they will go up for those with better credit, but people are confusing the CHANGE in the fee with the ACTUAL fee itself.
What I am saying is that low credit borrowers aren’t paying less than high credit borrowers. It’s just the spread in the rates between households with lower credit and those with higher credit has simply gotten smaller.
There is absolutely no scenario where someone with lower credit gets a lower fee. Let me show you.
Loan Level Pricing as of March 1, 2023
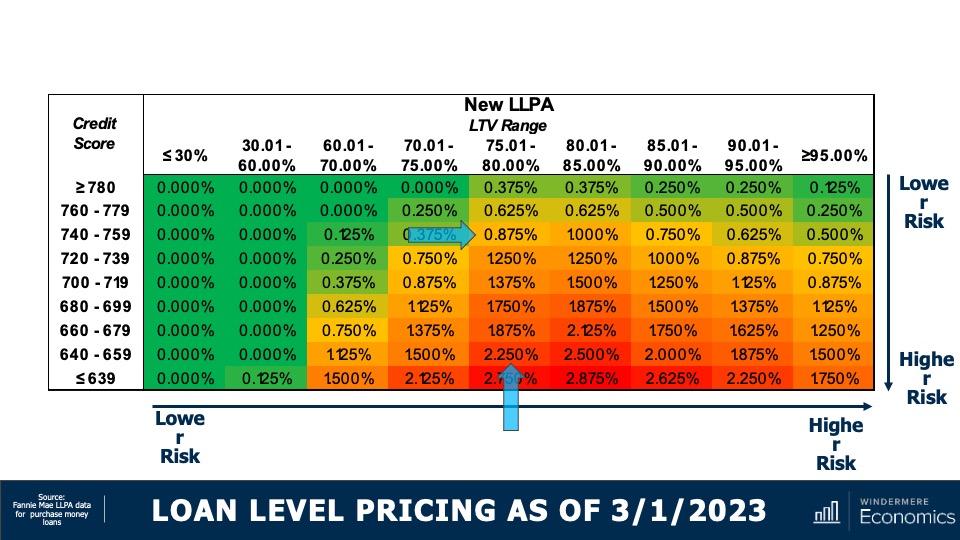
This was the new pricing schedule had it actually come into effect. Now let’s say there are two households wanting to buy houses for $500,000 and both looking to borrow 80% of the purchase price.
One buyer has a credit score of 640, so their LLPA would be 2.25% of the loan amount, or $9,000. The other buyer had a credit score of 740 so their fee would be 0.875%. That means the household with higher credit would be paying $5,500 less than the household with lower credit on a $400k loan.
No one is arguing that households with lower credit scores would have paid less in upfront fees, but I actually don’t see a problem with that. Remember, Fannie and Freddie’s mission is, in part, to facilitate access to affordable housing. Moreover, these fees don’t even apply to non-conforming or jumbo loans and they don’t impact FHA or VA loans either.
Although I certainly don’t know where the FHFA will end up regarding fee changes, they will have to do something at some point. I just hope that any modified plan is presented in a way that fully describes the situation and isn’t one that’s able to be interpreted in a manner which allows for headlines that don’t describe the full picture.
As always, I’d love to hear your thoughts on this subject but, in the meantime, stay safe out there and I’ll see you all next month. Bye now.
To see the latest housing data for your area, visit our quarterly Market Updates page.
About Matthew Gardner
As Chief Economist for Windermere Real Estate, Matthew Gardner is responsible for analyzing and interpreting economic data and its impact on the real estate market on both a local and national level. Matthew has over 30 years of professional experience both in the U.S. and U.K.
In addition to his day-to-day responsibilities, Matthew sits on the Washington State Governors Council of Economic Advisors; chairs the Board of Trustees at the Washington Center for Real Estate Research at the University of Washington; and is an Advisory Board Member at the Runstad Center for Real Estate Studies at the University of Washington where he also lectures in real estate economics.


")


