
 Facebook
 X
X
 Pinterest
 Copy Link

What keeps Windermere’s Chief Economist, Matthew Gardner, up at night? Housing affordability. As the U.S. Population moves towards both coasts and the Southwest, putting upward pressure on land prices and the value of homes, we will see a greater cost of living, which could directly impact the work force and economies in those areas. Gardner weighs in on how West Coast cities can improve housing affordability through policy and infrastructure changes.
More •
November 15, 2016
Helping Fight Holiday Hunger in Our Communities

The holiday season is a time in which Windermere offices across our network come together to help those in need in their communities. Here are just a few of the events that our offices are involved in this month to help fight hunger.
The Windermere office in El Sobrante, CA is hosting an in-house Holiday Food Drive this season. They held their kick-off event on October 1 and will continue to collect food donations through the month of December. They are accepting nominations from the local community to help select families to receive the donations. Monetary donations are also being collected and will be used to buy food items before delivering to the recipient families at Thanksgiving and Christmas. Any extra food items will be donated to the Richmond Rescue Mission.
 The Windermere Real Estate Professionals office in Boise, ID participated in their third annual “Pick a Pumpkin Feed a Family” event that took place October 12 through November 1. Pumpkins purchased for the office “pumpkin patch” were given to those who donated food during the event. Donations benefitted The Idaho Foodbank, the largest distributor of free food assistance in Idaho.
The Windermere office in Kingston, WA is holding its annual holiday food drive for local families in need. Donations are being accepted at the office now through November 21. Donations can be dropped off Monday through Friday from 9am to 5pm, and weekends from 10am to 4pm.
The Windermere Stellar offices in Portland (Portland-NW Johnson, Lake Oswego, Portland-Lloyd Tower NE, Portland Heights, Portland-Raleigh Hills, West Linn, and Portland-Moreland), are holding a food drive from November 7-28 to benefit Take Action, INC. Take Action INC provides backpacks full of food to low-income children in the Portland metropolitan area schools each weekend during the school year. They pack and distribute backpacks of food to low-income children so that they don’t have to go hungry over the weekend. Last year, they served 620 low-income families. On November 29, Take Action, INC will receive the food items collected during the drive, along with a $2,000 donation from Windermere Stellar and the Windermere Foundation.
The Windermere office on Vashon Island, WA is coordinating a food drive on November 20. The Basket Brigade, an annual event that they have sponsored since 2000, provides Thanksgiving meals to families in need. The Sunday before Thanksgiving, agents from the office stand in front of a local grocery store to collect food (or cash) donations for these meals. The Vashon Thriftway and Vashon IGA help provide the turkeys and pies, but the rest of the meal items are donated to the office by members of the community. Agents fill and decorate the baskets, which are then delivered by Saint Vincent de Paul volunteers to the families in time for them to cook Thanksgiving dinner.
The Windermere Sequim-East and Windermere Sequim-Sunland offices are holding a food drive now through November 30 to benefit the Sequim Food Bank. Non-perishable food items can be dropped off at 842 E Washington St or 137 Fairway Drive. Proteins like canned meats, dried beans, and peanut butter are always needed. The food bank serves individuals and families living within the Sequim School District.
Thanks to events like these food drives, as well as a variety of other fundraisers held by our offices throughout the year, the Windermere Foundation is able to continue to support non-profit organizations that provide services to low-income and homeless families throughout the Western U.S.

If you’d like to help, please consider donating to the Windermere Foundation. To learn more about the Windermere Foundation, visit http://www.windermere.com/foundation.
Market News •
November 9, 2016
The Trump effect. How will it impact the US economy and housing?


The American people have spoken and they have elected Donald J. Trump as the 45th president of the United States. Change was clearly demanded, and change is what we will have.
The election was a shock for many, especially on the West Coast where we have not been overly affected by the long-term loss in US manufacturing or stagnant wage growth of the past decade. But the votes are in and a new era is ahead of us. So, what does this mean for the housing market?
First and foremost I would say that we should all take a deep breath. In a similar fashion to the UK’s “Brexit”, there will be a “whiplash” effect, as was seen in overnight trading across the globe. However, at least in the US, equity markets have calmed as they start to take a closer look at what a Trump presidency will mean.
On a macro level, I would start by stating that political rhetoric and hyperbole do not necessarily translate into policy. That is the most important message that I want to get across. I consider it highly unlikely that many of the statements regarding trade protectionism will actually go into effect. It will be very important for President Trump to tone down his platform on renegotiating trade agreements and imposing tariffs on China. I also deem it highly unlikely that a 1,000-mile wall will actually get built.
It is crucial that some of the more inflammatory statements that President-Elect Trump has made be toned down or markets will react negatively. However, what is of greater concern to me is that neither candidate really approached questions regarding housing with any granularity. There was little-to-no-discussion regarding housing finance reform, so I will be watching this topic very closely over the coming months.
As far as the housing market is concerned, it is really too early to make any definitive comment. That said, Trump ran on a platform of deregulation and this could actually bode well for real estate. It might allow banks the freedom to lend more, which in turn, could further energize the market as more buyers may qualify for home loans.
Concerns over rising interest rates may also be overstated. As history tells us, during times of uncertainty we tend to put more money into bonds. If this holds true, then we may see a longer-than-expected period of below-average rates. Today’s uptick in bond yields is likely just temporary.
Proposed infrastructure spending could boost employment and wages, which again, would be a positive for housing markets. Furthermore, easing land use regulations has the potential to begin addressing the problem of housing affordability across many of our nation’s housing markets – specifically on the West Coast.
Economies do not like uncertainty. In the near-term we may see a temporary lull in the US economy, as well as the housing market, as we analyze what a Trump presidency really means. But at the present time, I do not see any substantive cause for panic in the housing sector.
We are a resilient nation, and as long as we continue to have checks-and balances, I have confidence that we will endure any period of uncertainty and come out stronger.
 Matthew Gardner is the Chief Economist for Windermere Real Estate, specializing in residential market analysis, commercial/industrial market analysis, financial analysis, and land use and regional economics. He is the former Principal of Gardner Economics, and has over 25 years of professional experience both in the U.S. and U.K.
Market News •
November 7, 2016
Oregon and South West Washington Real Estate Market Update

ECONOMIC OVERVIEW
The labor market in Oregon/Southwest Washington continues to remain robust. During third quarter, the region added 13,800 new jobs, up from the 9,500 jobs that were created in the same period in 2015. Year-over-year, the region has grown at an impressive rate of 3.5%—well above the U.S. rate of 1.7%—and has one of the fastest rates of job creation in the nation. In September the unemployment rate was 5.5%, which is modestly below a year ago when it was 5.7%. I’m not surprised to see the unemployment rate trended lower given the growth in both the labor force as well as the participation rate (the number of people in the economy who are either employed or who are actively looking for work).
HOME SALES ACTIVITY
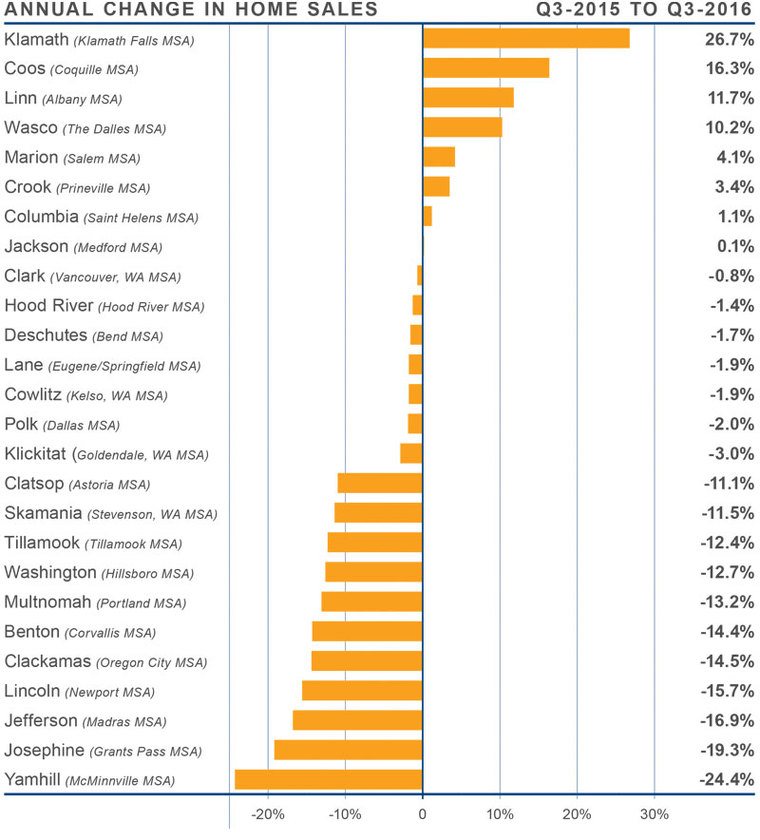
- Continuing the trend seen in the second quarter, home sales are down by 7% compared the same quarter in 2016. In total, there were 18,100 home sales.
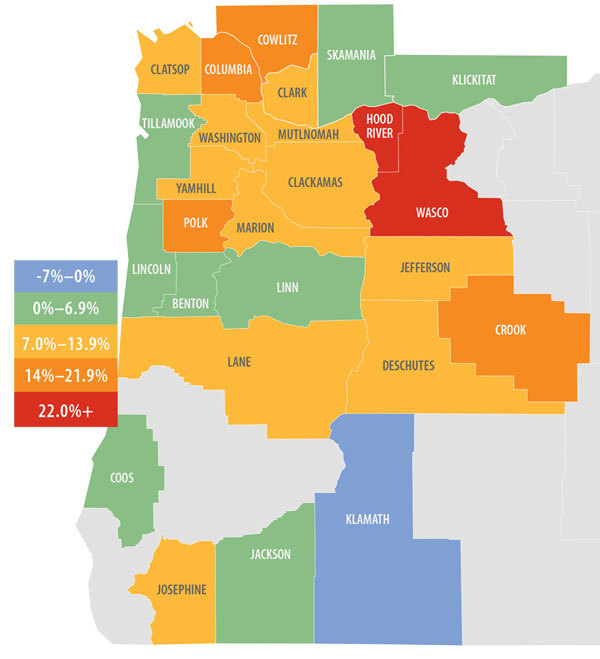
- Sales rose at the fastest rate in Klamath County, which saw a 26.7% increase over the second quarter of 2015. There were also noticeable increases in transactions seen in Coos, Linn and Wasco Counties. The greatest decline was seen in Yamhill, Josephine, and Jefferson Counties.
- While there were eight counties where sales rose, 18 counties actually saw fewer sales than last year.
- Housing inventory continues to have a negative impact on sales, but it appears that sellers’ expectations of home prices may also be playing a role in slowing sales.
HOME PRICES
![]() Average home prices over the past year rose by 8.1% to $335,000. This is down from 10.5% seen in the second quarter of the year. This may be an indicator that home price growth is beginning to revert toward historic averages.
Average home prices over the past year rose by 8.1% to $335,000. This is down from 10.5% seen in the second quarter of the year. This may be an indicator that home price growth is beginning to revert toward historic averages.- When compared to the third quarter of 2015, Hood River took over as the market with the greatest price growth, with homes selling for 29% above that seen a year ago.
- All but one county saw an annual increase in prices, with some counties seeing significant increases in average sale prices. That said, the number of areas where home price appreciation rose by double-digit percentages dropped from 18 to 11.
- The key takeaway here is that home price appreciation is starting to slow but remains well above the historic average.
 Average home prices over the past year rose by 8.1% to $335,000. This is down from 10.5% seen in the second quarter of the year. This may be an indicator that home price growth is beginning to revert toward historic averages.
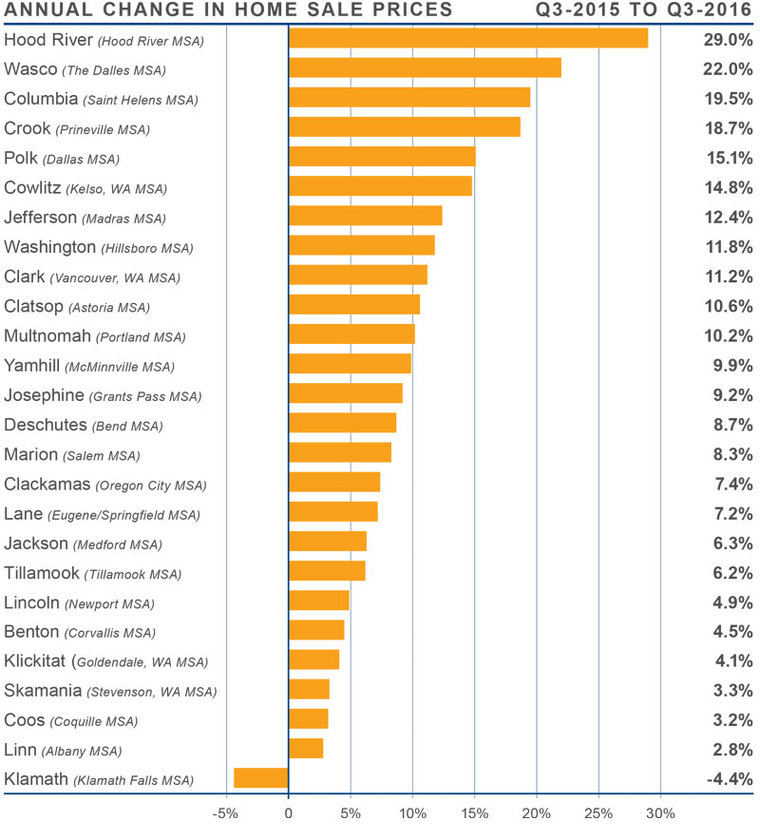
DAYS ON MARKET
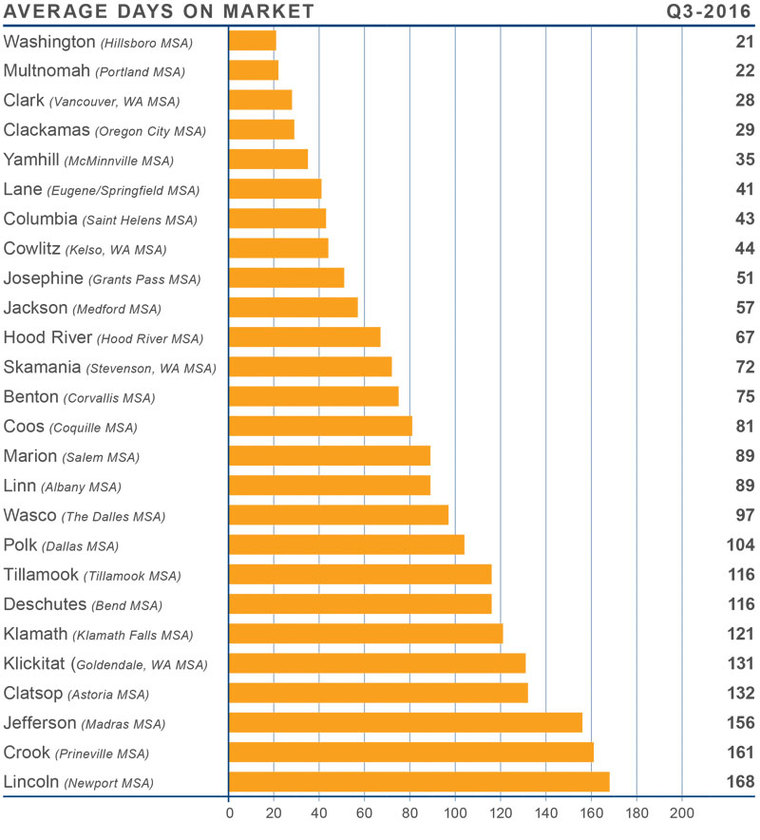
- The average days it took to sell a home dropped by 14 when compared to the third quarter of 2015, and is 5 days less than last quarter.
- The average time it took to sell a home in the region was 83 days.
- Wasco County was the only area where the average time it takes to sell a home rose (from 88 to 97 days).
- Homes sold fastest in Washington and Multnomah Counties, where it took 21 and 22 days respectively on average for homes to sell.
CONCLUSIONS
 The speedometer reflects the state of the region’s housing market using housing inventory, price gains, sales velocities, interest rates, and larger economics factors. Economic growth continues to trend well above the nation, and this region is one of the fastest growing in the country. The housing market continues to benefit greatly from this economic vitality. That said, the modest decline in home sales and prices is worthy of note. This suggests that peak price growth is now behind us and that we will start to see a slowing in the upward trend of home values. This actually is not a bad thing because tapering home prices will ultimately lead to a rise in the number of home sales, which still remain below historic averages. As such, I have moved the needle a little toward buyers, however, it certainly remains a seller’s market.
 Matthew Gardner is the Chief Economist for Windermere Real Estate, specializing in residential market analysis, commercial/industrial market analysis, financial analysis, and land use and regional economics. He is the former Principal of Gardner Economics, and has over 25 years of professional experience both in the U.S. and U.K.
Market News •
November 1, 2016
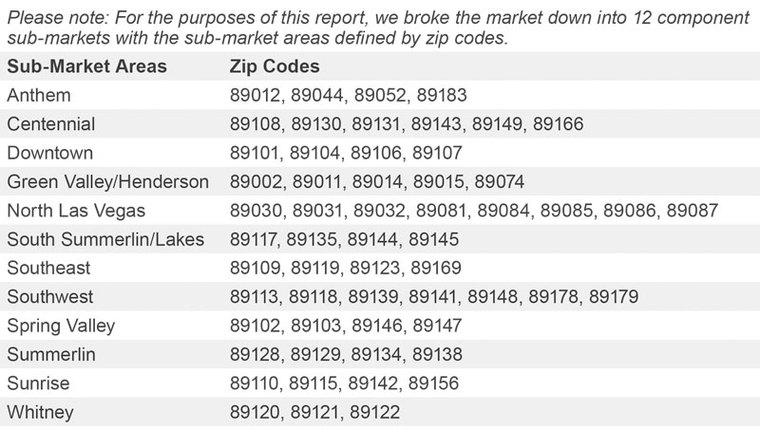
Nevada Real Estate Market Update

ECONOMIC OVERVIEW
Employment in the Las Vegas market saw quite a nice bump during the summer after having taken a bit of a pause earlier in the year. August data showed that there were just shy of 950,000 non-agricultural employees in the area, up by 5,300 from the prior month, and 26,400 higher than seen a year ago. The local unemployment rate dropped from 6.9% at the end of June to 6.0% in August. This is, in part, a result of the data not being seasonally adjusted, but also because we saw the workforce drop by 6,600 people. Employment sectors were a mixed bag, with sizable improvement seen in casinos and related hotel industries, but a decline in professional services, finance, insurance, and the information technology sectors.
HOME SALES ACTIVITY
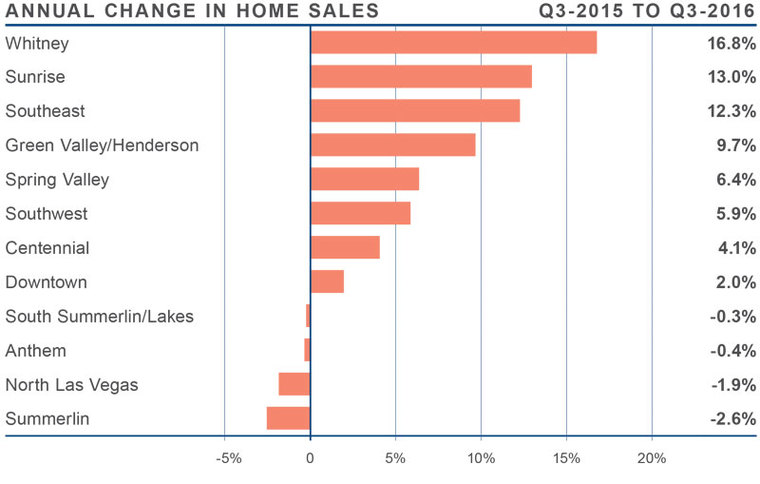
- There were a total of 10,126 home sales, which was an increase of 4.5% when compared to the third quarter of 2015. This was also 4.2% higher than seen during the second quarter of this year.
- Sub-markets where sales activity was either slow or negative were limited to South Summerlin/Lakes, Anthem, North Las Vegas and Summerlin sub-markets; however the drop in sales was modest.
- The fastest rate of growth in sales came in the Whitney sub-market, which saw a 16.8% increase compared to a year ago. There were also sizable increases in sales in the Sunrise and Southeast sub-markets.
- Inventory levels are still well below where I would like them to be, with 10.9% fewer listings than seen a year ago. That said, overall listing activity in the quarter was up by 21.9% from the second quarter of this year. The fastest pace of growth in listings was seen in the Southwest and South Summerlin/ Lakes sub-markets, where listings were 7.0% and 5.8% higher, respectively.
HOME PRICES
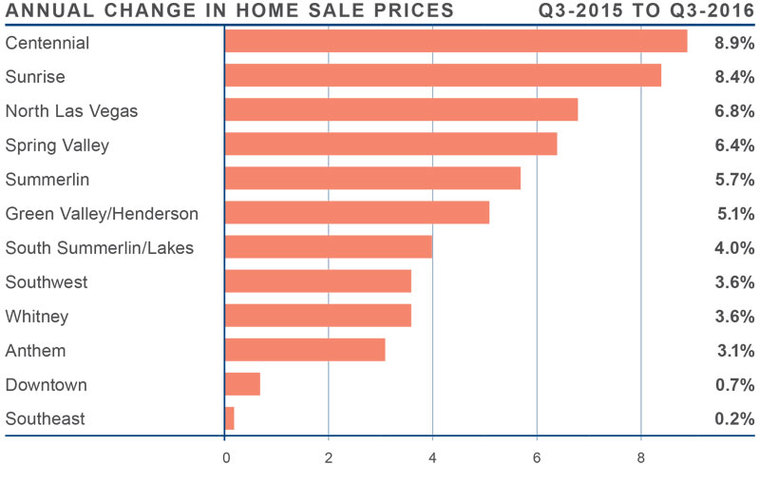
- Average prices in the region rose by 4.6% year-over-year to $232,750. This is also 1.0% higher than seen in the second quarter of this year.
- The Centennial sub-market saw the strongest annual growth, with average home prices rising by 8.9% to $240,300. We also saw notable gains in the Sunrise neighborhood, where sale prices were up by 8.4% to $151,000.
- All sub-markets saw prices rise compared to the third quarter of 2015, with several above the region-wide average.
- As mentioned earlier, prices were higher across the board, but the Southeast and Downtown areas were essentially at the same level as seen a year ago.
DAYS ON MARKET
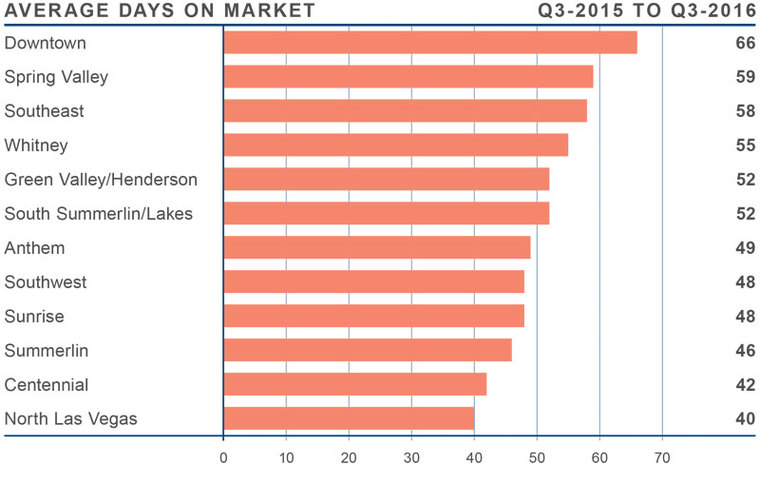
- The average number of days it takes to sell a home in the region dropped by eleven when compared to the third quarter of 2015.
- The average time it took to sell a home in the region was 52 days—one day less than seen in the second quarter of this year.
- All component sub-markets saw the length of time it took to sell a home drop when compared to a year ago.
- The greatest drop in days-on-market was again seen in the Sunrise sub-market, which dropped by 23 days to 48.
CONCLUSIONS
 The speedometer reflects the state of the region’s housing market using housing inventory, price gains, sales velocities, interest rates and larger economics factors. Employment growth in Clark County has resumed and I believe that it is this growth that is continuing to drive home sales. Inventory levels have risen substantially over the past six months and, while they are below the levels of a balanced market, they are headed in the right direction. Home prices are increasing at a reasonable pace but there are some sub-markets that are over-performing at the present time. This is not a concern, as I think buyers will start to be more selective regarding the neighborhoods that they want to move to. This process will allow some markets to appreciate at levels higher than the regional averages. I have moved the speedometer a little more in favor of sellers, as price growth is higher across the board and, even with the rise in listing activity, sellers still have the upper hand.
Matthew Gardner is the Chief Economist for Windermere Real Estate, specializing in residential market analysis, commercial/industrial market analysis, financial analysis, and land use and regional economics. He is the former Principal of Gardner Economics, and has over 25 years of professional experience both in the U.S. and U.K.
More •
November 1, 2016
Windermere Launches New Ultra-Luxury Brand: W Collection

Anyone who has spent time in the Seattle area in recent years has likely seen for themselves how much the city has changed. Thanks in large part to the booming economy, growing tech sector, and increasing international appeal, Seattle is no longer a sleepy little city tucked away in the far corner of the United States. With this changing landscape has come an infusion of wealth that has seen the area’s high-net-worth population explode. And with it, so too has the ultra-high-end real estate market.
In order to meet the specialized needs of this burgeoning market, Windermere has launched W Collection, a new ultra-luxury brand specifically designed for homes priced at $3 million and above in Western Washington. OB Jacobi, President of Windermere Real Estate, says that Seattle’s population of “global affluent” is on the rise and they greatly value real estate. The proof is in the numbers.
Over the past five years there has been a significant increase in the number of home sales in the $3 million+ market. In 2011 there were only 45 such sales in King County, while in 2015 there were 131. “Windermere agents represent anywhere from 40-60 percent of the $3 million+ sales in the Seattle area, so we felt we were in the ideal position to build a brand that could provide enhanced marketing support to the growing number of ultra-luxury homes,” said Jacobi.
W Collection is its own standalone brand with a separate website, WByWindermere.com, signage, presentation materials, and specialized advertising opportunities. When developing W Collection, Jacobi said that the goal was to create a sophisticated, yet humble, brand that evokes the understated expression of wealth that is unique to the Pacific Northwest. “Our clients are not largely drawn to the shows of excessive wealth that you see at other companies and in other parts of the country. This is reflected in the W Collection brand,” said Jacobi.
The development of W Collection began a little over a year ago, and according to Jacobi, was a highly collaborative process with Windermere agents playing an integral role in every step, “Over the past 44 years some of Windermere’s best ideas have come from our agents who are totally in tune with the needs of their clients and the shifting demands of the market; W Collection was born from this same agent ingenuity.”
Market News •
October 31, 2016
Southern California Real Estate Market Update

ECONOMIC OVERVIEW
Over the past 12 months (through August 2016), the markets covered by this report added 273,200 new jobs and the total number of people claiming unemployment insurance dropped by over 100,000. With these shifts toward full employment, the area’s unemployment rate dropped from 6.2% to 5.1% during the past year. Some might note that unemployment was only 4.3% in second quarter and wonder why the rate has increased; however, the reason for this is that there was a substantial increase in the civilian labor force which rose by over 200,000 people.
HOME SALES ACTIVITY
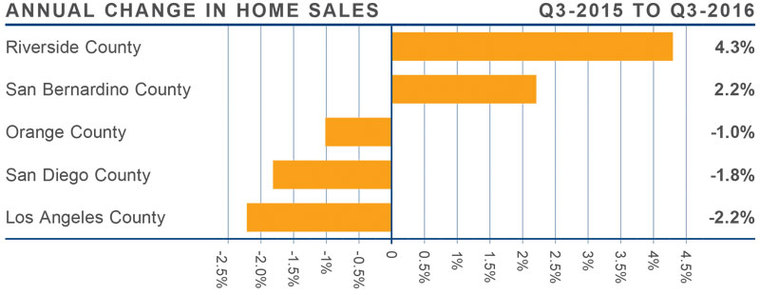
- There were a total of 52,550 home sales in third quarter of 2016. This was 0.6% lower than the same period in 2015, and 3.1% lower than seen in the second quarter of this year.
- The drop in sales is likely a result of inventory levels which remain well below historic averages. It’s worth noting that, while the number of listings in the third quarter was 4.2% lower than the same quarter a year ago, it increased by 5.9% relative to the second quarter of this year.
- Home sales continue to be a mixed bag with transactions higher in Riverside and San Bernardino Counties, but lower in L.A., Orange, and San Diego Counties.
- Even with the recent increase in listings, we are still well below where we need to be for the market to be considered balanced.
HOME PRICES
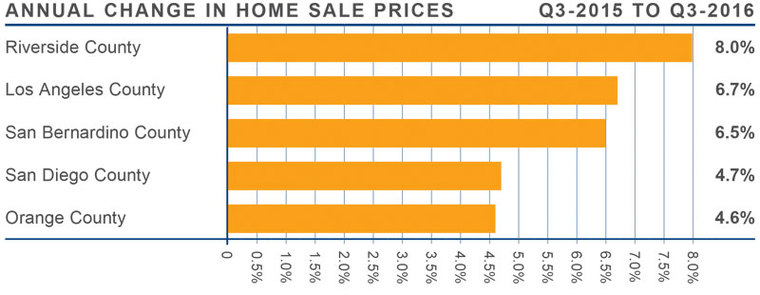
- When compared to third quarter of 2015, average prices in the region rose by 5.8% and are a modest 0.1% higher than seen in the second quarter of 2016.
- When compared to second quarter, San Diego, Riverside, and Los Angeles Counties all saw average home prices decline. While they are all up year-over-year, we may be seeing a small shift in the market in which price growth is expected to slow.
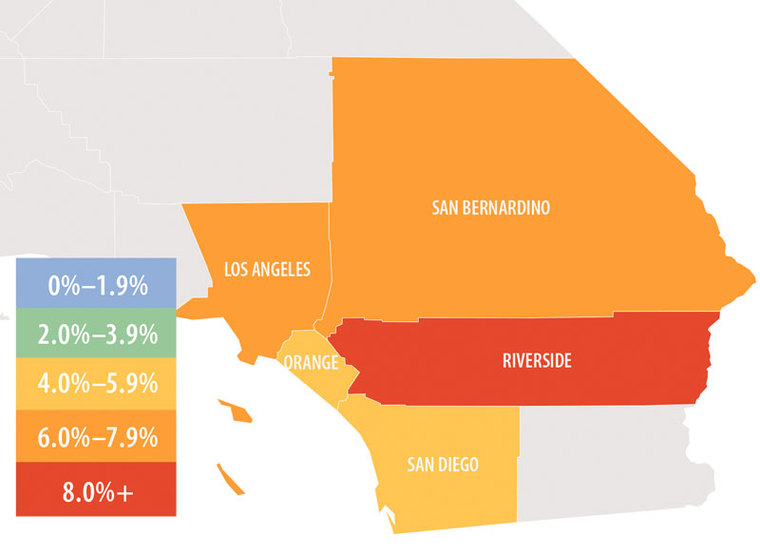
- Riverside County saw the greatest appreciation in home values (+8.0%). This was followed by Los Angeles County, where the average price rose 6.7%.
- Pending sales were up across the board, and it will be interesting to see what effect this jump may have on home prices in the fourth quarter.
DAYS ON MARKET
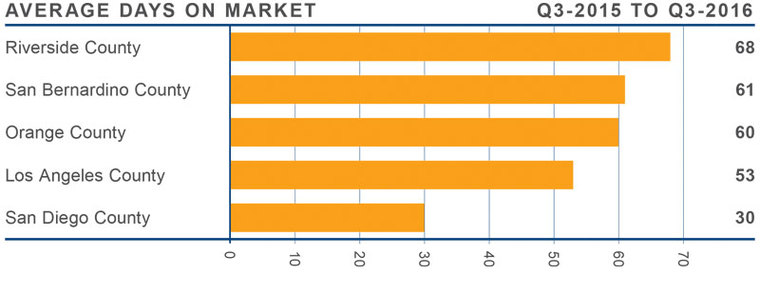
- The average time it took to sell a home in the region was 55 days. This is a drop of 3 days when compared to the third quarter of 2015.
- The drop in days on market is starting to slow. With the jump in new listings that I described earlier, we may see days on market start to rise as we enter the winter months.
- Homes in San Diego County continue to sell at a faster rate than the other markets in the region. In the third quarter, it took an average of 30 days to sell a home there, which is four days less than seen a year ago.
- All five counties saw a drop in the amount of time it took to sell a home between the third quarter of 2015 and the third quarter of 2016.
CONCLUSIONS
 The speedometer reflects the state of the region’s housing market using housing inventory, price gains, sales velocities, interest rates and larger economics factors. The regional economy continues to add jobs and this continues to increase the demand for housing.
That said, price points in some markets are approaching pre-bubble levels and, without sufficient income growth, housing affordability will become an issue. I remain hopeful that additional housing inventory will address this pent-up demand, causing prices to appreciate at more modest rates.
I’ve left the speedometer unchanged from last quarter. Intuitively, I think the market may be headed back to being more balanced, but I want to see a few more quarters of moderating home prices and greater choice for buyers before I make that call.
Matthew Gardner is the Chief Economist for Windermere Real Estate, specializing in residential market analysis, commercial/industrial market analysis, financial analysis, and land use and regional economics. He is the former Principal of Gardner Economics, and has over 25 years of professional experience both in the U.S. and U.K.
Living •
October 31, 2016
Friend or Foe? How to Identify, Trap and Rid your Home of Ghosts

How do you know when you have a ghost hanging out in your home? Signs include unexplained noises and voices, objects disappearing, electronics turning on and off by themselves, lights flickering, unexplained smells, or an uneasy feeling that you’re being watched. But how do you know for sure that it’s paranormal activity – and not the cat – causing these abnormalities? And how do you rid your home of them? Here are some tips.
What is paranormal activity?
If you are experiencing something abnormal that defies logic, you may be dealing with paranormal phenomena. But first you want to rule out anything that is easily explained. So ask yourself, is there a rational explanation for the spooky activity? Could it be the wind, someone playing a prank, or maybe the cat? If it’s none of these things, and you are sure you are dealing with the paranormal, proceed with caution.
Identifying your spirit
Sometimes ghosts don’t realize they’re dead or being bothersome; they just want to remain in their home. But if they become territorial they can do downright scary things. How is your ghost presenting itself? Are you hearing bumps, whispers or screams? Are items levitating, or crashing around? It’s important to understand the motivation of your ghost; this will help you decide if you can work out an arrangement, or if you need to exorcise them from your home.
You may also want to explore if this ghost is familiar to you, a loved one or sworn enemy, or if you are encountering a spirit that is unknown to you. If you have recently moved into a new home with a sordid past, you will want to look up the home’s history to give you insights into what you’re dealing with. The next step is to decide whether or not you are willing to share your home with your ghost. Assess how you feel; you should always listen to your gut. If you are scared, literally to death, then you will definitely want to proceed to the next step.
Ghost busting
If you ain’t afraid of no ghosts, you can attempt to trap the spirit yourself, but you’ll need to invest in some specialized equipment to do so:
- Use a manual (film camera), camcorder and/or tape recorder to identify the ghost (and prove to your friends that you aren’t crazy)
- EMF (Electromagnetic field) detector to track the ghosts presence in real-time
- Infrared thermal scanner to detect cold spots caused by ghosts
- Apps for your smart phone have come a long way and are definitely worth a try
Once you’ve tracked your ghosts, it’s time to get rid of them.
Ask politely:
It sounds silly, but some ghosts mean no harm, especially if they are a family member. You can always nicely ask an unwanted visitor to leave. Or let them haunt a part of your home that you don’t use often, like the attic or the guest room when your mother-in-law sleeps.
Burial Method:
Acquire a metal box and fill the bottom with soil from hallowed ground (from a church or cemetery) and lure your ghost to the box with some chocolate or a lotto ticket. Once he’s inside, secure the box closed, sprinkle with salt and bury.
Candle Method:
Find a glass jar with a secure lid. At midnight, light a candle within the jar at the haunted location. The ghost will be attracted to the candle, and once he or she is inside the jar (which you’ll know because you’ve used your fancy equipment to track it), close and seal it for eternity.
Hire a professional:
Many paranormal seekers are actually volunteers, so you can contact a local organization in your area for advice and help: http://www.paranormalsocieties.com/usa-paranormal-groups.cfm
Move:
You win some, you lose some.
Happy Halloween!
Market News •
October 27, 2016
Western Washington Real Estate Market Update

ECONOMIC OVERVIEW
Annual employment growth in Washington State slowed somewhat in the third quarter of this year, but still remains well above the long-term average. Additionally, the jobs that are being created are primarily quality, high-paying positions, which is important for the health of our economy.
Unemployment in the state remains at levels that are somewhat higher than I would like to see, but this continues to be impacted by a growing labor force and modestly slowing job growth. I still expect to see the rate drop a little further as we move through the final quarter of the year.
HOME SALES ACTIVITY
- There were 24,277 home sales during the third quarter of 2016—up by an impressive 7.9% from the same period in 2015, and 6.8% above the total number of sales seen in the second quarter of this year.
- Skagit County saw sales grow at the fastest rate over the past 12 months, with transactions up by 25.6%. There were also impressive increases in home sales in Thurston, San Juan, Pierce, and Grays Harbor Counties. Sales fell slightly in Jefferson and Kittitas Counties.
- Overall listing activity remains low with the total number of homes for sale at the end of the quarter 11.2% below that seen a year ago. That said, I’m happy to report that listings have been slowly trending higher in 2016.
- I’ve been thinking about how sales can continue to rise while inventory remains so low. I believe this is due to an uptick in first-time buyers. These buyers have no home to sell, so they don’t add to the number of listings; however, they do cause sales to increase when they buy. This is a good trend to see!

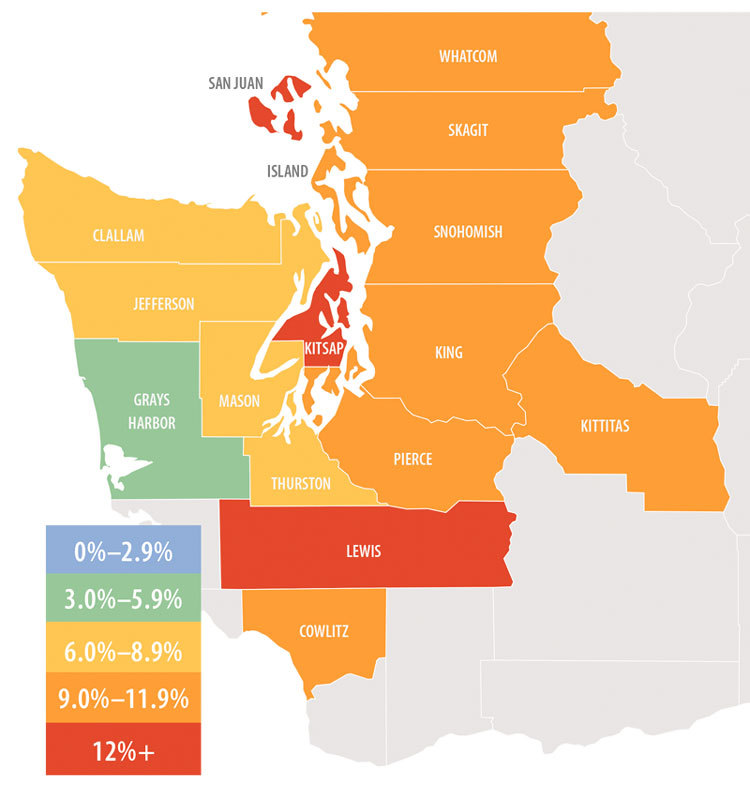
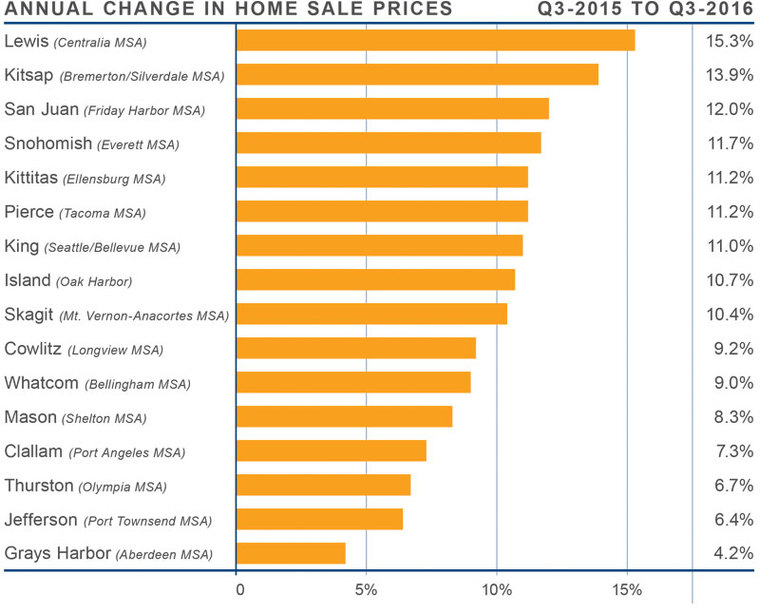
HOME PRICES
![]() As demand continues to exceed supply, we are continuing to see upward pressure on home prices. In the third quarter, average prices rose by a substantial 10.2% and are 3.2% higher than seen in the second quarter of this year.
As demand continues to exceed supply, we are continuing to see upward pressure on home prices. In the third quarter, average prices rose by a substantial 10.2% and are 3.2% higher than seen in the second quarter of this year.- The current rate at which homes are appreciating cannot continue, and I anticipate that we will see a “cooling” start to take place in 2017.
- When compared to the third quarter of 2015, price growth was most pronounced in Lewis County. In total, there were nine counties where annual price growth exceeded 10% and prices were higher across the entire region when compared to a year ago.
- Although supply levels are slowly starting to creep higher, we are still solidly in a seller’s market. Rising inventory levels should start to do a better job of meeting demand next year, which when combined with modestly higher mortgage interest rates, will see the region move closer toward becoming a balanced market.
 As demand continues to exceed supply, we are continuing to see upward pressure on home prices. In the third quarter, average prices rose by a substantial 10.2% and are 3.2% higher than seen in the second quarter of this year.
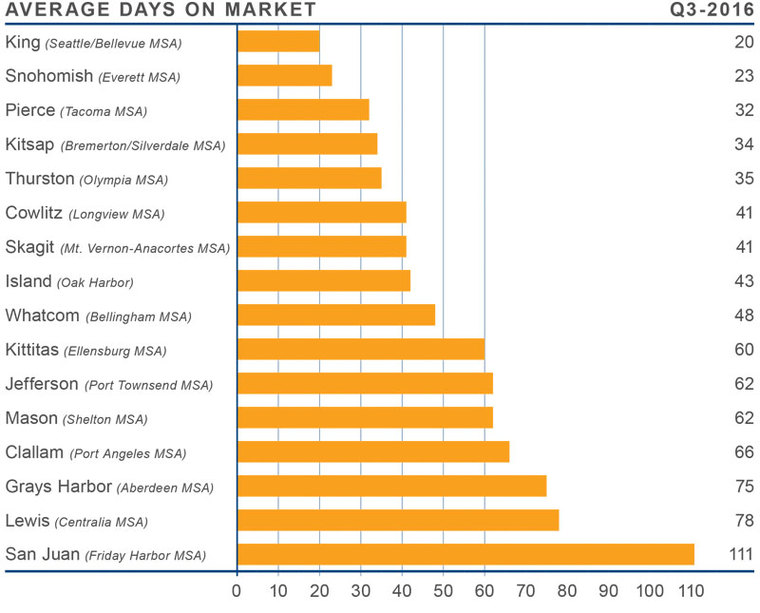
DAYS ON MARKET
- The average number of days it took to sell a home dropped by twenty-two days when compared to the third quarter of 2015.
- All the counties that comprise this report saw the length of time it took to sell a home drop.
- In the third quarter of 2016, it took an average of 52 days to sell a home. This is down from the 74 days it took in the third quarter of 2015, and down from the 67 days it took in the second quarter of this year.
- King and Snohomish Counties remain the only two markets where it took less than a month to sell a home. Even though King County saw days on market rise slightly from 18 to 20, it remains the hottest market in the region.
CONCLUSIONS
 This speedometer reflects the state of the region’s housing market using housing inventory, price gains, sales velocities, interest rates, and larger economics factors. For the third quarter of 2016, I am moving the needle very slightly toward the buyers. This is entirely due to the recent increase in inventory levels that I believe will continue through the rest of the year. That said, the region remains steadfastly a seller’s market.
Matthew Gardner is the Chief Economist for Windermere Real Estate, specializing in residential market analysis, commercial/industrial market analysis, financial analysis, and land use and regional economics. He is the former Principal of Gardner Economics, and has over 25 years of professional experience both in the U.S. and U.K.
More •
October 26, 2016
4 Simple Steps to Painting a Wall Faster

Many books about painting will tell you to paint a small strip along the baseboards, doorways, trim and other edges of the room with a brush before breaking out the paint roller to paint the rest of the wall. But before you do this paintbrush work, called “cutting in,” consider paint expert Shauna Gallagher’s method: Roll paint on the wall and then use a paintbrush for the edge work. To learn more about this technique, watch as she paints the feature wall of a room.

Paint Faster 1: Houzz TV, original photo on Houzz
Watch a video tutorial here
Step 1: Add Paint to the Roller
With a paint roller in hand, Gallagher dips her roller cover into the paint and then rolls it down the cage in the bucket to remove excess paint. She recommends rolling down and not up to avoid splattering paint out of the bucket. If you have excess paint on the edge of the roller, use a chip brush to wipe it off so it doesn’t drip on the wall.
Paint Faster 2: Houzz TV, original photo on Houzz
Step 2: Roll on the Paint
In rolling the paint on the wall, Gallagher uses vertical movements — rolling up and down as she moves across the wall — so she can glide right up against the taped-off edges. The paper-and-tape combo, which she applied to the wall’s edges with a tape gun, gives her extra protection against getting paint on the ceiling and adjacent walls.
Because she is painting a smooth wall with a thin roller cover, she can get closer than if she were painting a textured wall with a fluffy roller. Additionally, she rolls horizontally along the ceiling line to get even closer with the roller. She says she can roll paint within about 1 inch of her taped-off edges. If she would have cut in first, she says she might have painted a strip of 5 to 6 inches with a paintbrush.
“You are looking at a huge time savings if you roll paint first,” she says. “It might be 1½ hours versus 25 minutes.”
As she rolls, she keeps the arm of the roller on the side of the direction she is traveling across the wall. She is going from left to right, so the arm is on her right side. She uses this method because a small line of paint forms on the edge, and she can pick up that extra paint and spread it out as she goes.
Keep a Hamper Nearby for Messy Rags
After she completes a section, Gallagher lightly goes over the wall again, this time rolling only downward, to remove any roller lines and give the paint an even finish.

Paint Faster 3: Houzz TV, original photo on Houzz
Step 3: Paint the Edges
Once you have rolled paint on as much of the wall as possible, fill in the unpainted areas with a paintbrush. Because she rolled paint close to the wall’s edges, Gallagher can make quicker work of the cutting-in step of her project.
For this step, she dips her paintbrush into the paint and then removes paint from one side of the brush by wiping it along the edge of the can. She uses this side of the brush as she paints along the taped edge. Applying less paint to the taped edge keeps the taped line crisper, she says, and prevents paint from squishing up into the corner.

Paint Faster 4: Houzz TV, original photo on Houzz
Step 4: Remove the Tape
After painting, Gallagher waits until the paint is just dry before methodically removing the tape. She recommends putting your hands close to the wall and pulling the tape at a 45-degree angle.
“When you are farther away, you are yanking on the tape a little more,” she says. Her technique helps keep paint from pulling away from the wall.
When you are done, you can step back and admire a wall that you painted in a fraction of time, thanks to the reverse method.
Next Up: How to Paint Kitchen Cabinets Like a Pro
By Brenna Malmberg, Houzz
")


