
 Facebook
 X
X
 Pinterest
 Copy Link

ECONOMIC OVERVIEW
I’m happy to report that Washington State continues to add jobs at a steady rate. While the rate of growth is tapering, this is because many markets are getting close to “full employment”, during which time growth naturally slows. That said, I believe that the state will add around 70,000 jobs in 2017. Washington State, as well as the markets that make up Western Washington, continues to see unemployment fall and I anticipate that we will see this rate drop further as we move through the year. In all, the economy continues to perform at or above average levels and 2017 will be another growth year.
HOME SALES
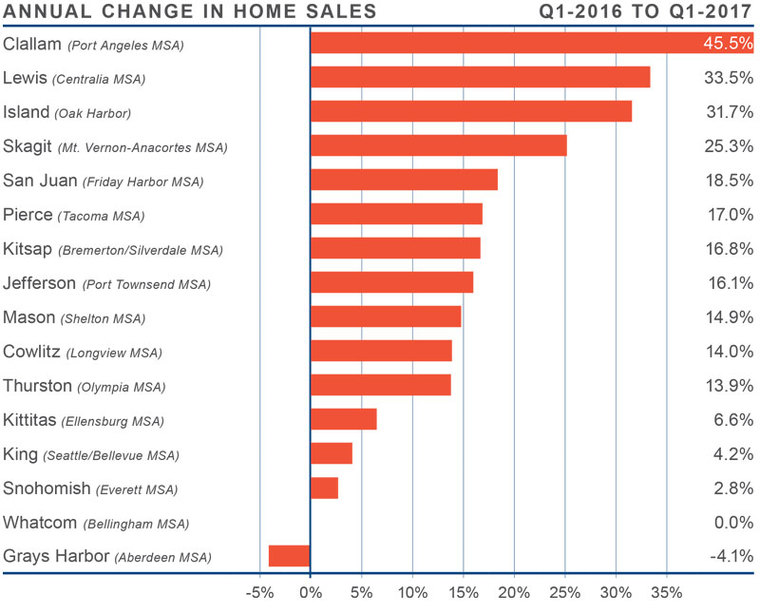
- There were 15,652 home sales during the first quarter of 2017. This is an increase of 9.5% from the same period in 2016, but 20.7% below the total number of sales in the final quarter of 2016.
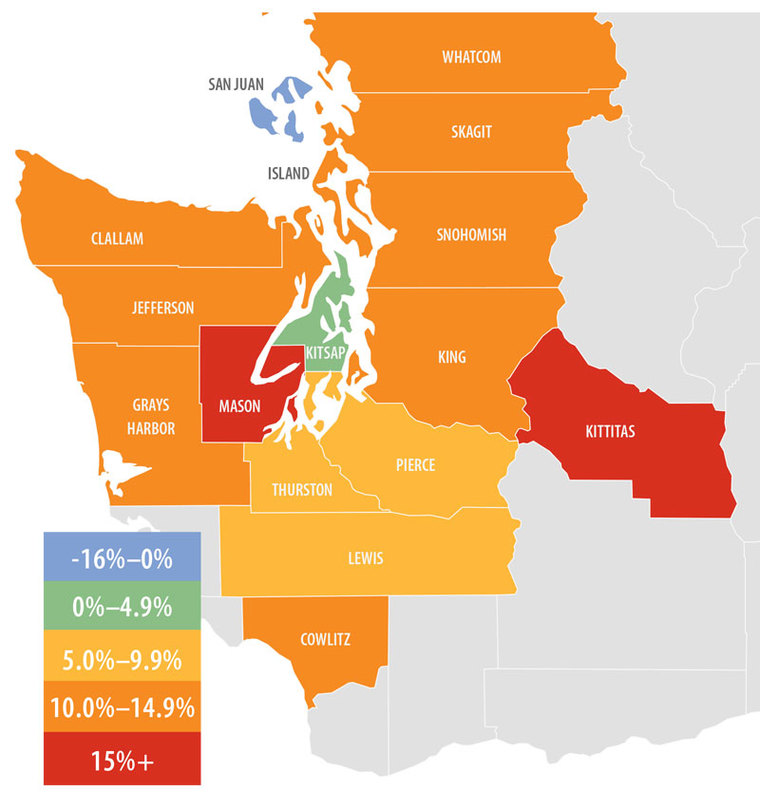
- With an increase of 45.5%, sales in Clallam County grew at the fastest rate over the past 12 months. There were double-digit gains seen in an additional 10 counties, suggesting that demand remains very robust. The only modest decline in sales was seen in Grays Harbor County.
- The number of homes for sale showed no improvement at all, with an average of just 6,893 homes for sale in the quarter, a decline of 33% from the previous quarter and 25% from the first quarter of 2016. Pending sales rose by 2% relative to the same quarter a year ago.
- The key takeaway from this data is that 2017 will offer little relief to would-be home buyers as the housing supply remains severely constrained.
HOME PRICES
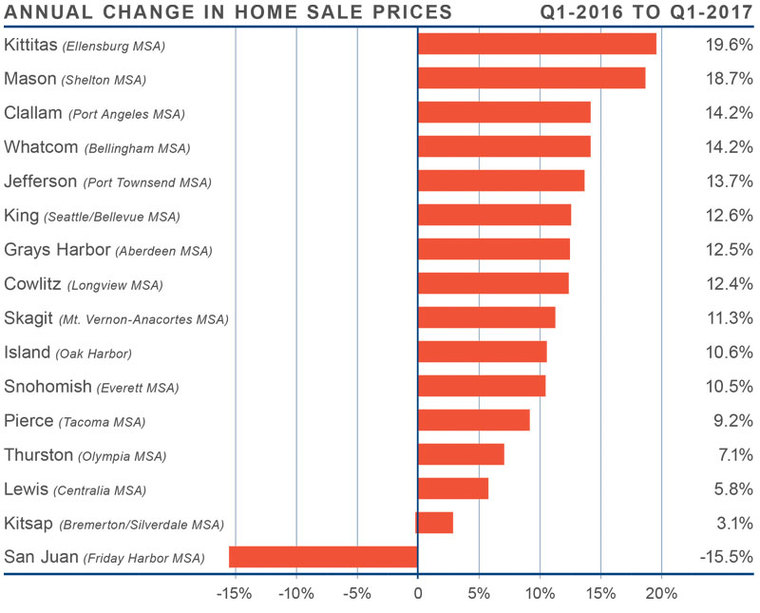
- With demand continuing to exceed supply, home prices continued to rise at above-average rates. Year-over-year, average prices rose by 9.5% but were 1.1% lower than in the final quarter of 2016. The region’s average sales price is now $409,351.
- Price growth in Western Washington is unlikely to taper dramatically in 2017 and many counties will continue to see prices appreciate well above their long-term averages.
- When compared to the same period a year ago, price growth was most pronounced in Kittitas County, which rose by 19.6%. Double-digit price growth was seen in an additional 10 counties. The only market where the average price fell was in the ever-volatile San Juan County.
- It is clear that rising interest rates have not taken much of a sheen off the market.
DAYS ON MARKET
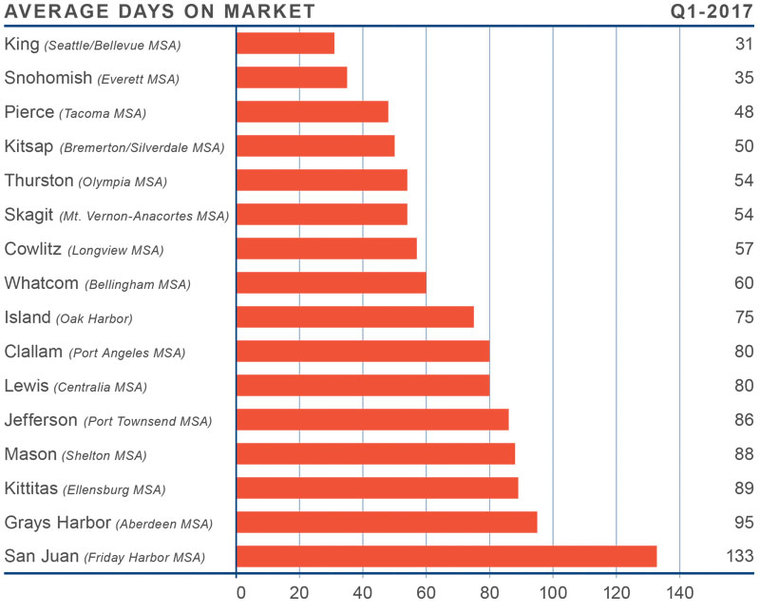
- The average number of days it took to sell a home in the first quarter dropped by 16 days when compared to the first quarter of 2016.
- King County remained the tightest market, with the average time to sell a home at just 31 days. Island County was the only area where it took longer to sell a home than seen a year ago; however, the increase was just one day.
- In the first quarter of the year, it took an average of 70 days to sell a home. This is down from the 86 days it took in the first quarter of 2016, but up from the 64 days it took in the final quarter of last year.
- Given woefully low levels of inventory in all Western Washington markets, I do not expect to see the length of time that it takes to sell a home rising in 2017. In fact, it is likely that it will continue to drop.
CONCLUSIONS
 This speedometer reflects the state of the region’s housing market using housing inventory, price gains, home sales, interest rates, and larger economic factors. For the first quarter of 2017, I moved the needle a little more in favor of sellers. The rapid increase in mortgage rates during the fourth quarter of 2016 has slowed and buyers are clearly out in force.
 Matthew Gardner is the Chief Economist for Windermere Real Estate, specializing in residential market analysis, commercial/industrial market analysis, financial analysis, and land use and regional economics. He is the former Principal of Gardner Economics, and has over 25 years of professional experience both in the U.S. and U.K.


")


