
 Facebook
 X
X
 Pinterest
 Copy Link
Q3 2023 Eastern Washington Real Estate Market Update

The following analysis of select counties of the Eastern Washington real estate market is provided by Windermere Real Estate. We hope that this information may assist you with making better-informed real estate decisions. For further information about the housing market in your area, please don’t hesitate to contact your Windermere Real Estate agent.
Regional Economic Overview
Year over year, Eastern Washington gained 4,515 jobs, representing a significant slowdown from the pace of growth during the post-pandemic recovery. On a percentage basis, the region’s job market grew by only .9%. The fastest growing county was Spokane, where employment rose 2.2%. This was followed by Walla Walla (+1.4%) and Benton (+1.1%) counties. Employment growth was negative in the rest of the markets contained in this report.
Unadjusted for seasonality, the regional unemployment rate was 4.2%, which is down from 5.2% during the same period in 2022. When seasonally adjusted, the jobless rate was 4.4%, which was down from 5.5% at the same time in 2022.
Eastern Washington Home Sales
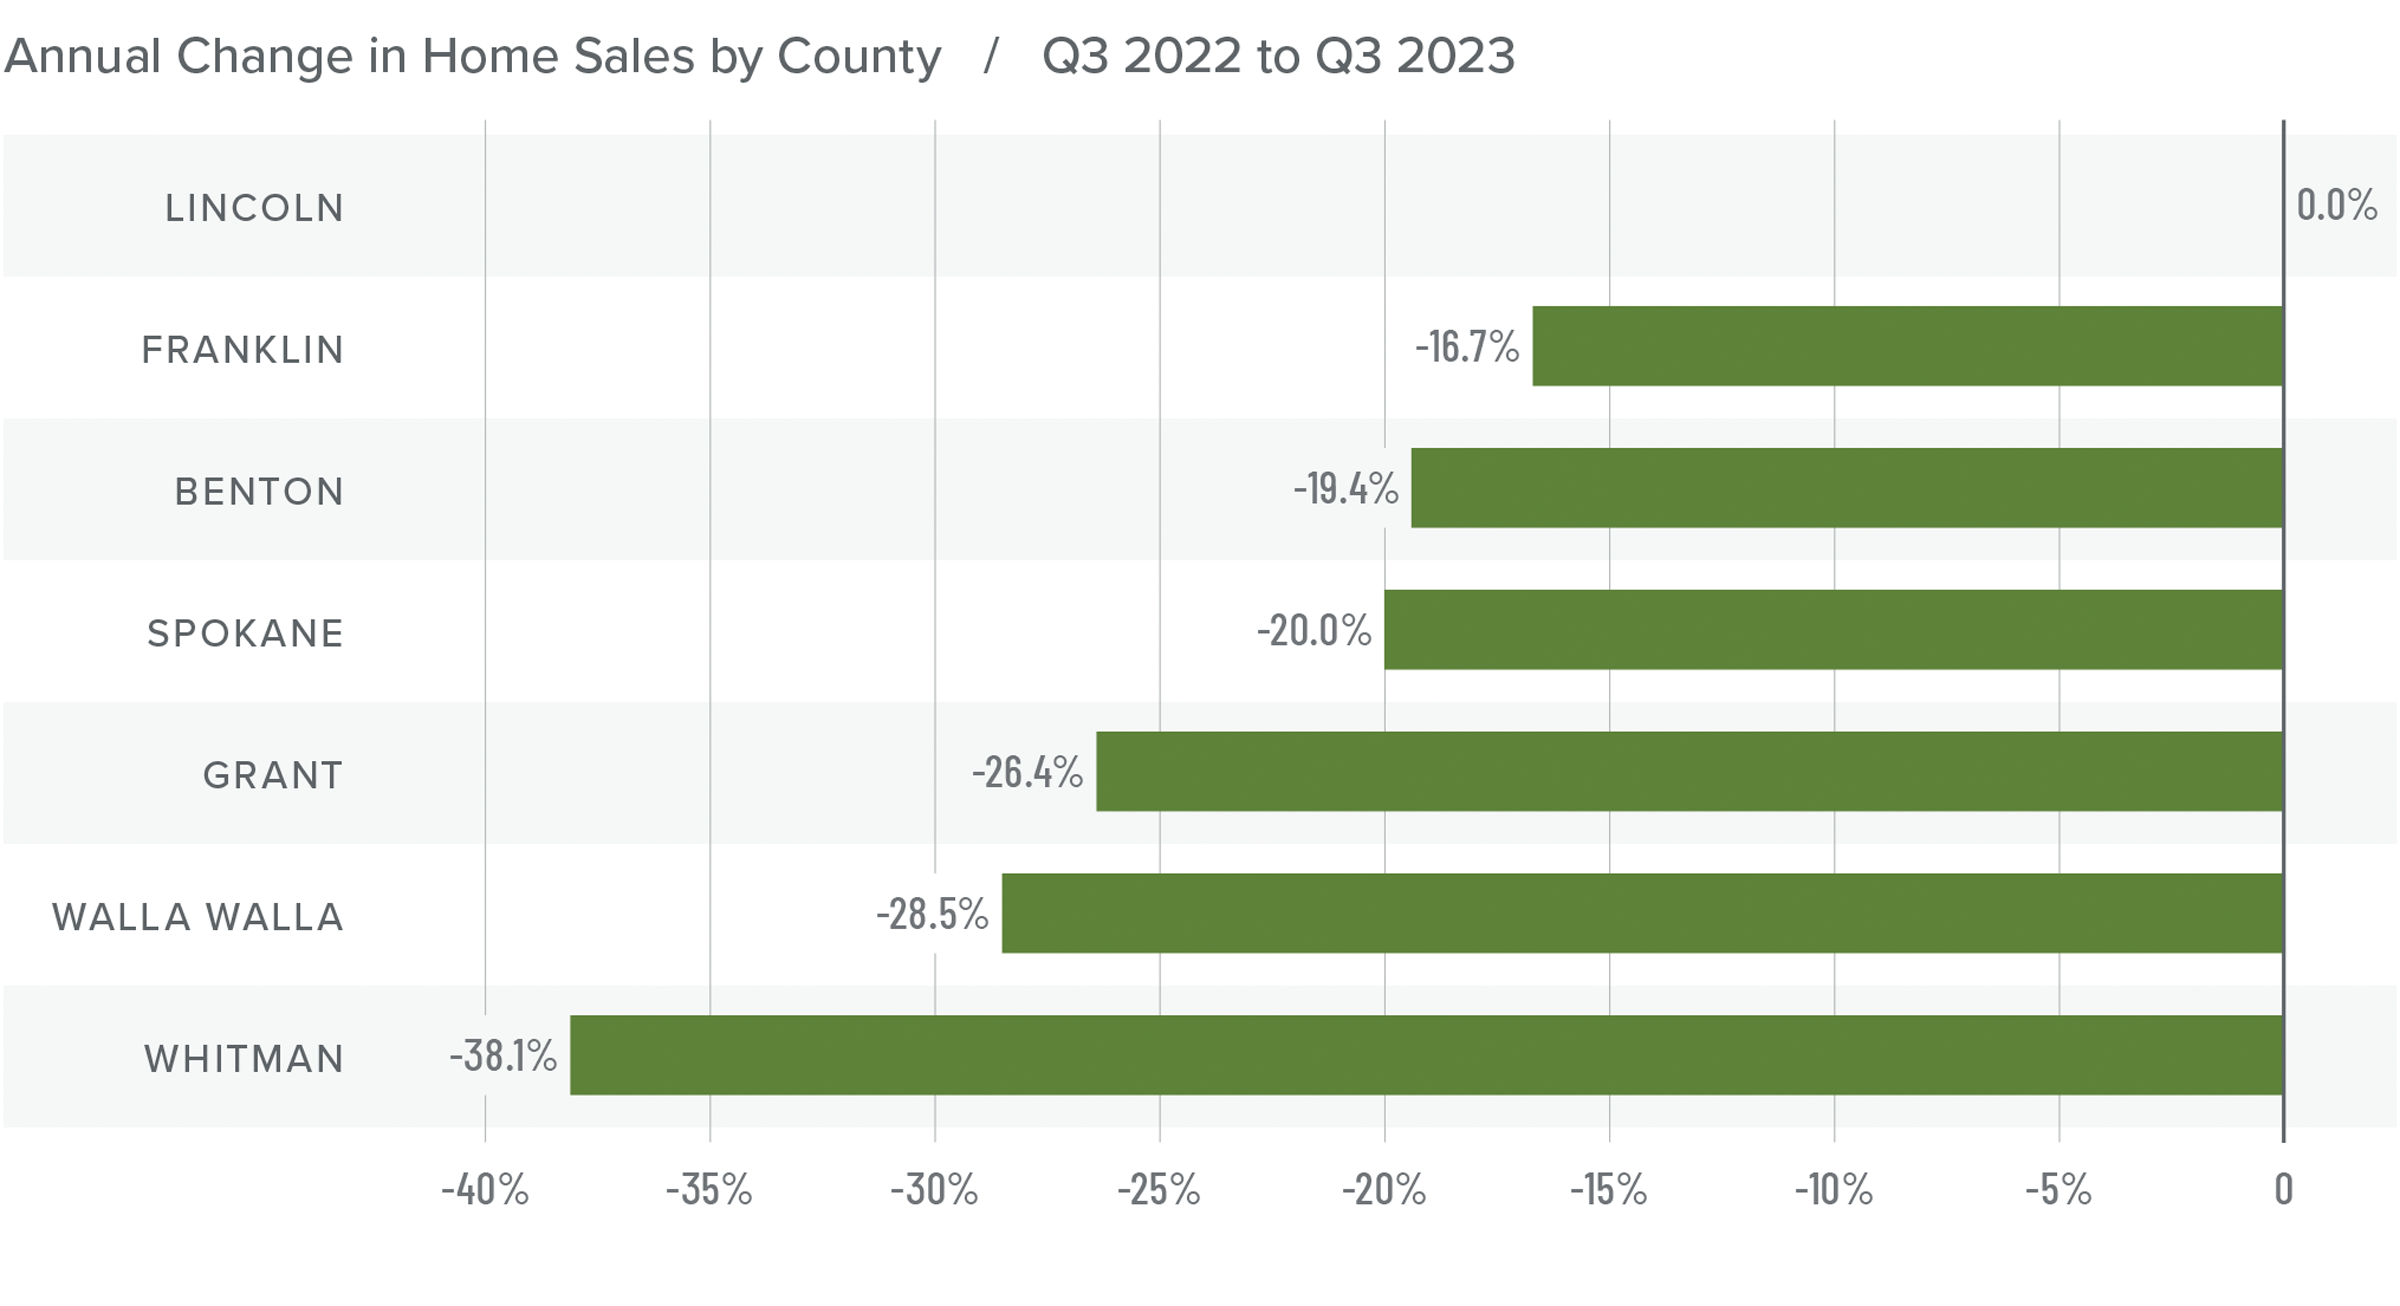
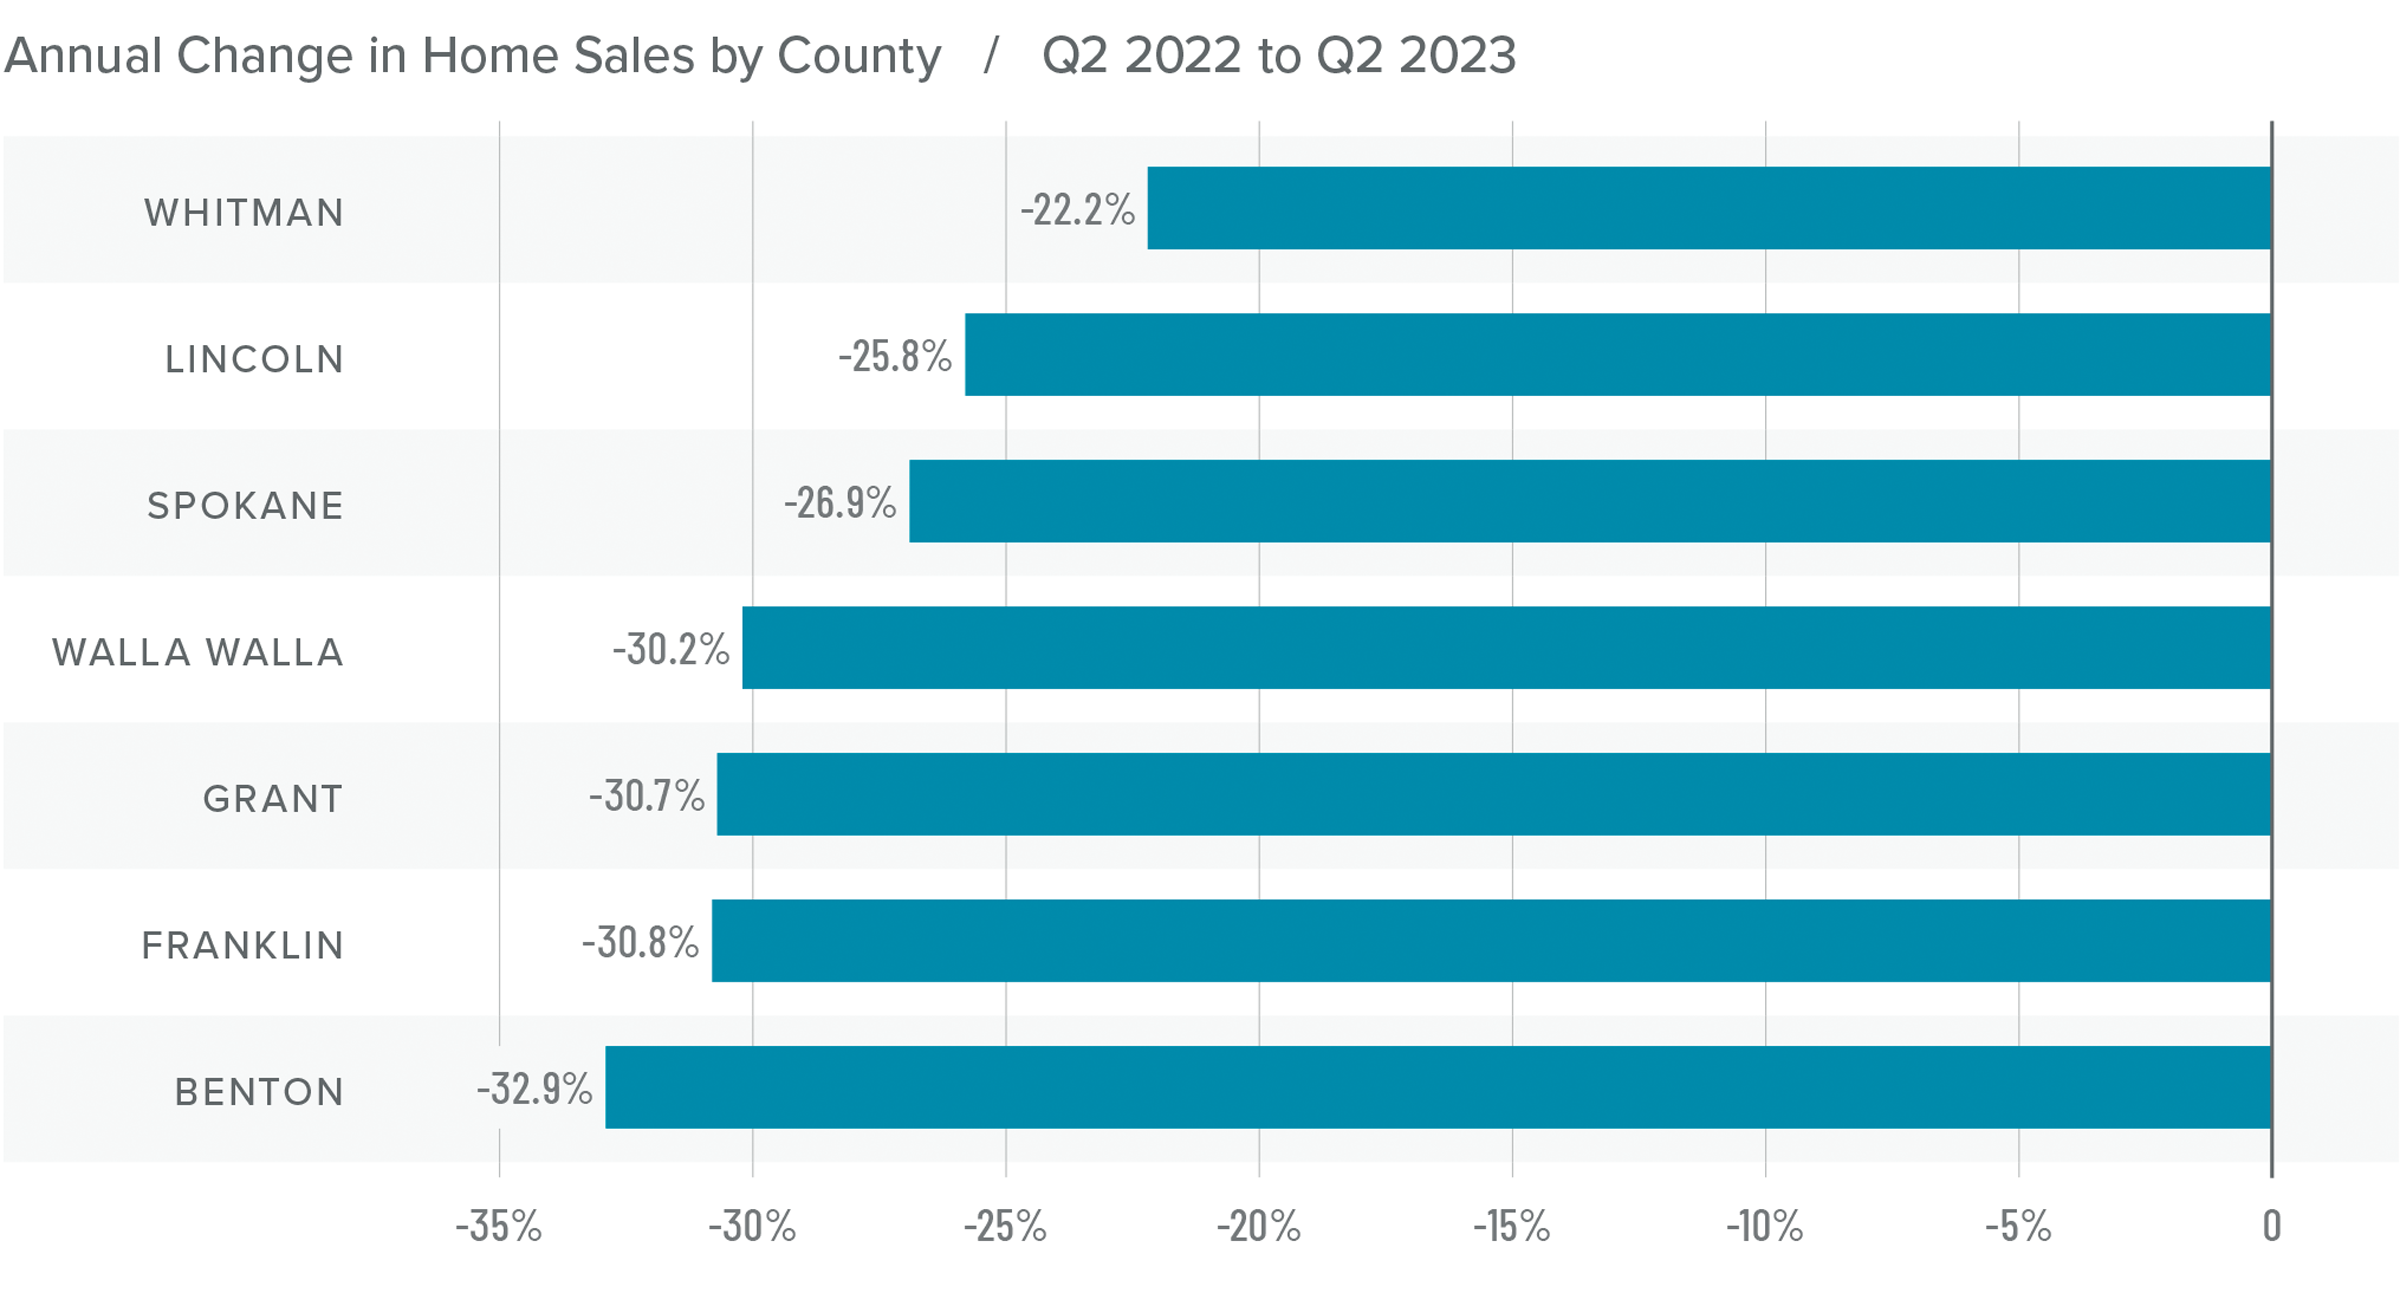
❱ In the third quarter of 2023, 2,647 homes sold. This was 21.2% lower than in the third quarter of 2022 but was up 1.8% compared to the second quarter of this year.
❱ The modest increase in sales may be attributable to the 35% increase in the number of homes for sale. Even more impressive was that sales grew in the face of significantly higher mortgage rates.
❱ Year over year, sales fell across the region except in Lincoln County, where they were flat. However, compared to the second quarter of this year, sales were higher in Spokane, Benton, and Franklin counties.
❱ Pending sales fell 6.8%, which suggests that sales were likely pulled forward due to rising interest rates and that closings in the final quarter of 2023 may also be down.
Eastern Washington Home Prices
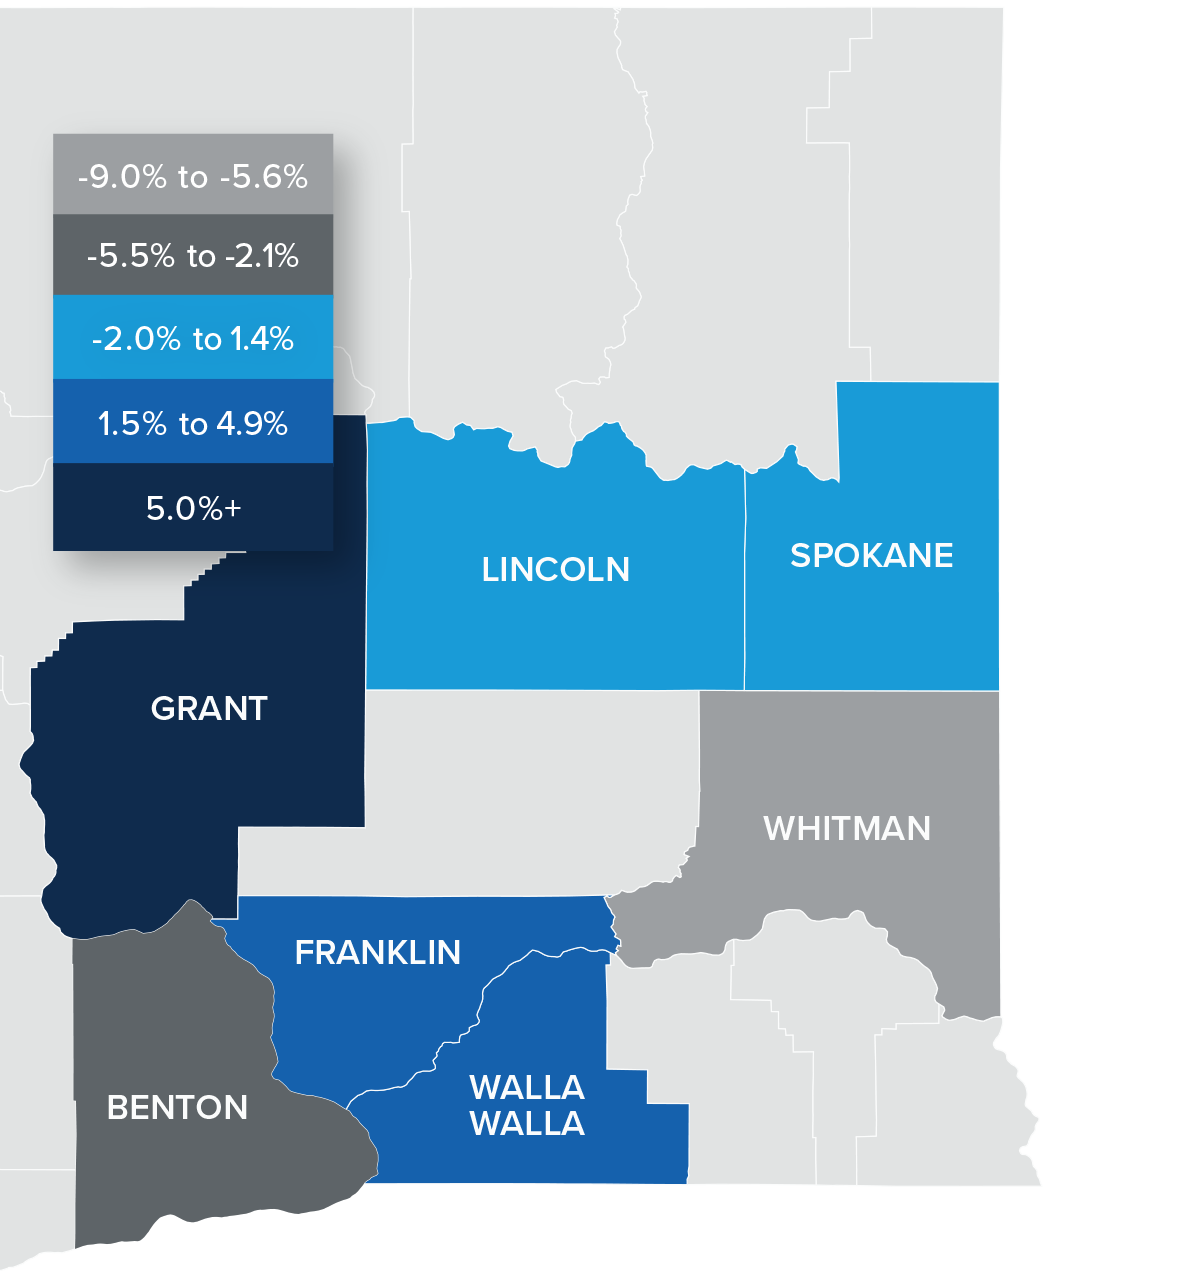
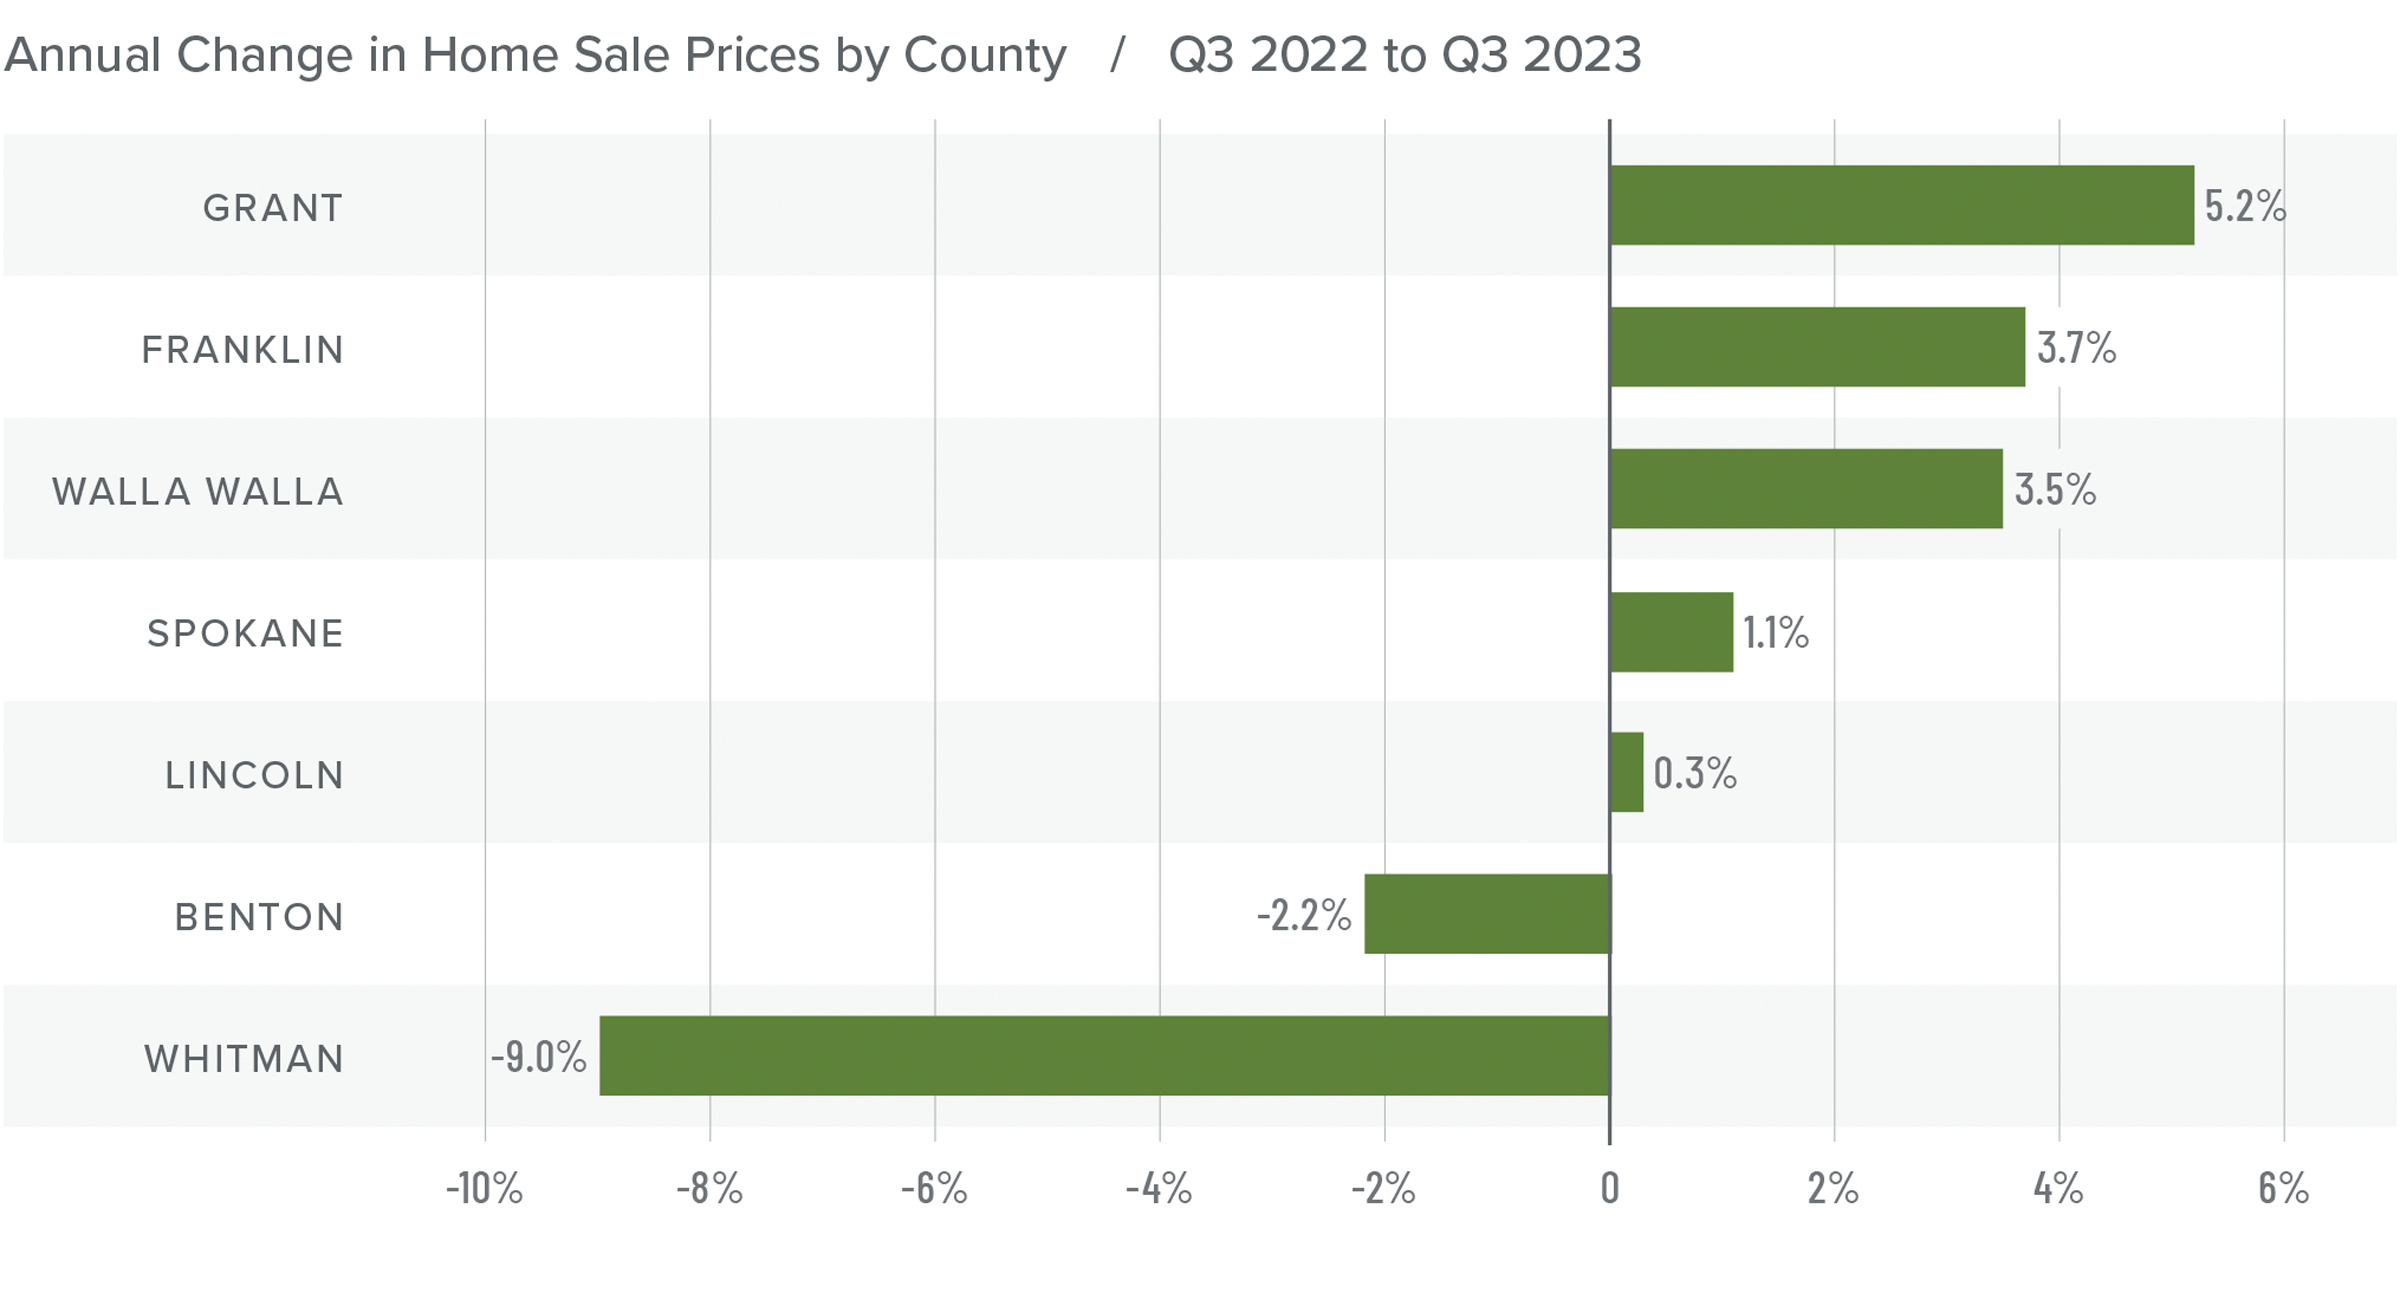
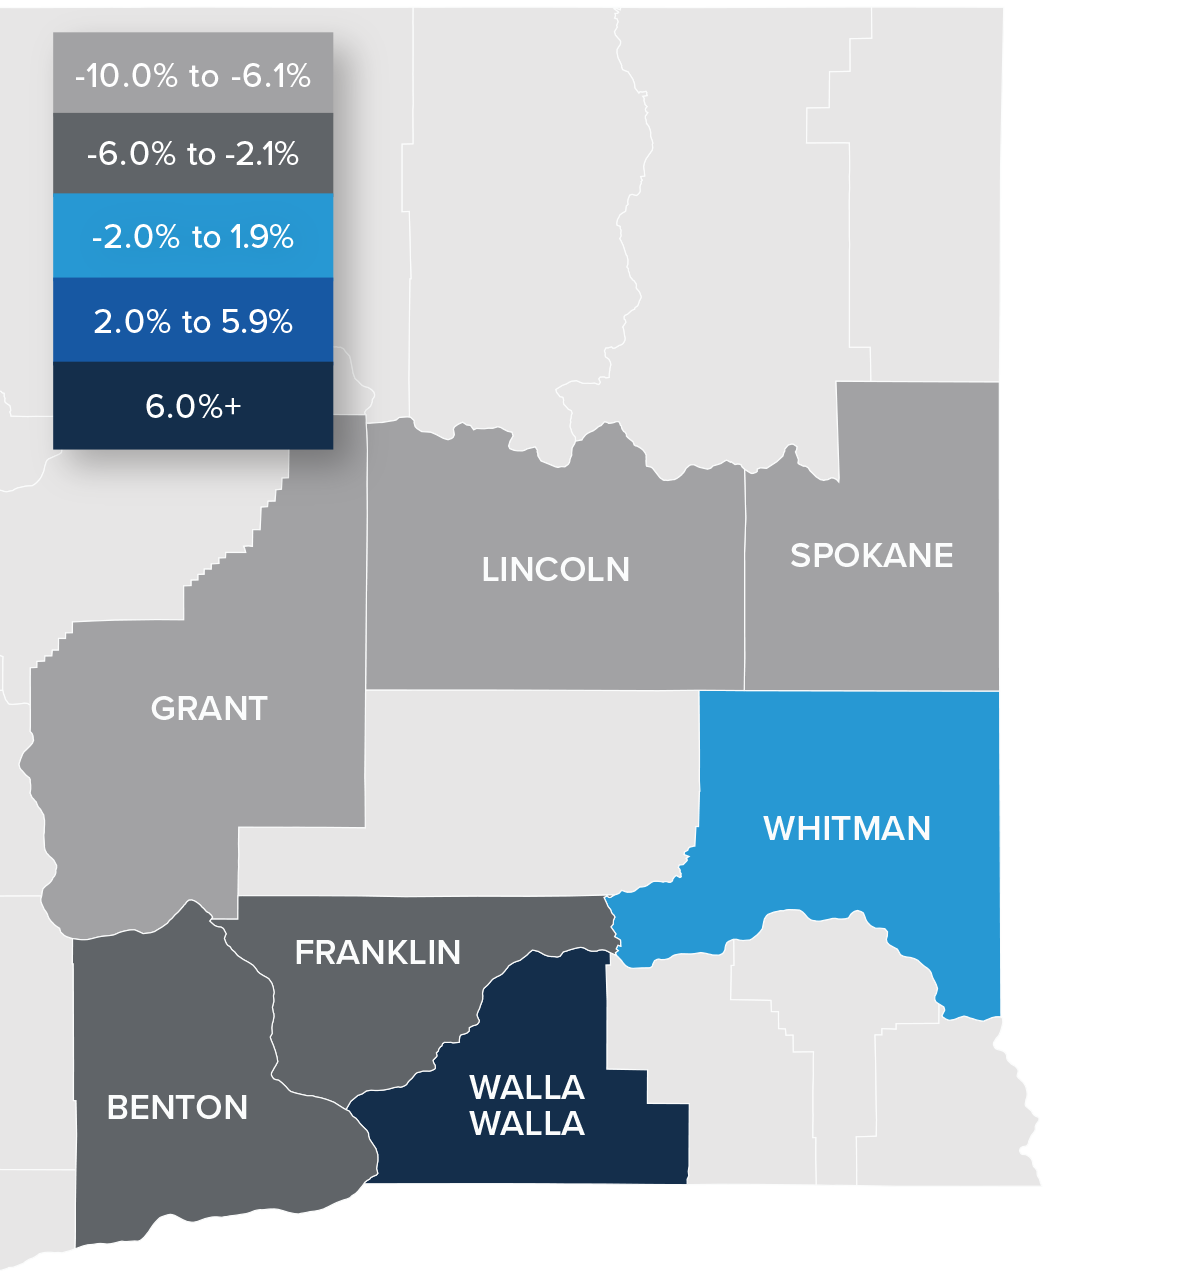
❱ Year over year, the average home price in Eastern Washington rose .8% to $466,007. Prices rose 3.4% compared to the second quarter of 2023.
❱ Of note was that median list prices rose 4.4% between the second and third quarters of this year. Sellers still appear to be confident in the value of their homes despite mortgage rates that are at their highest levels in over two decades.
❱ Prices rose in five of the counties contained in this report but fell in two when compared to the same period in 2022. The same was true for quarterly growth, with average prices rising in every county other than Whitman and Walla Walla.
❱ Though home price growth was positive, it has certainly slowed. Some of this may be attributable to increased supply levels, but I believe that mortgage rates are acting as the most significant headwind. I expect price growth to slow further as we enter the final quarter of the year, and there’s a possibility it will turn negative across the region.
Mortgage Rates
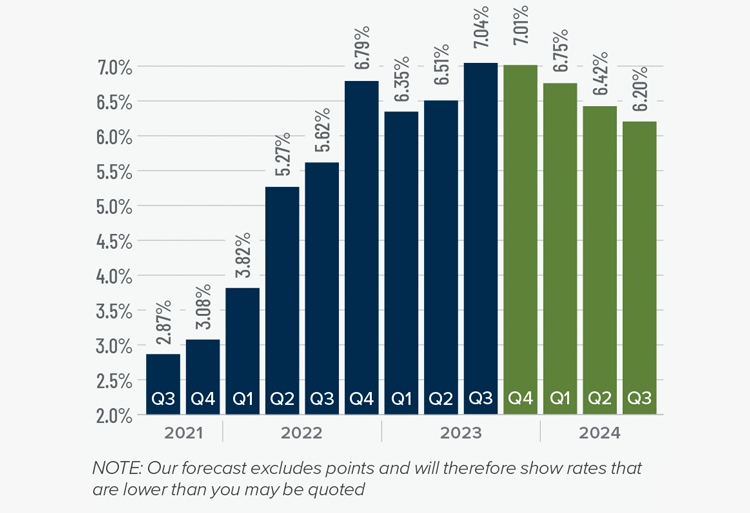
Mortgage rates continued trending higher in the third quarter of 2023 and are now at levels we have not seen since the fall of 2000. Mortgage rates are tied to the interest rate (yield) on 10-year treasuries, and they move in the opposite direction of the economy. Unfortunately for mortgage rates, the economy remains relatively buoyant, and though inflation is down significantly from its high, it is still elevated. These major factors and many minor ones are pushing Treasury yields higher, which is pushing mortgage rates up. Given the current position of the Federal Reserve, which intends to keep rates “higher for longer,” it is unlikely that home buyers will get much reprieve when it comes to borrowing costs any time soon.
With such a persistently positive economy, I have had to revise my forecast yet again. I now believe rates will hold at current levels before starting to trend down in the spring of next year.
Eastern Washington Days on Market
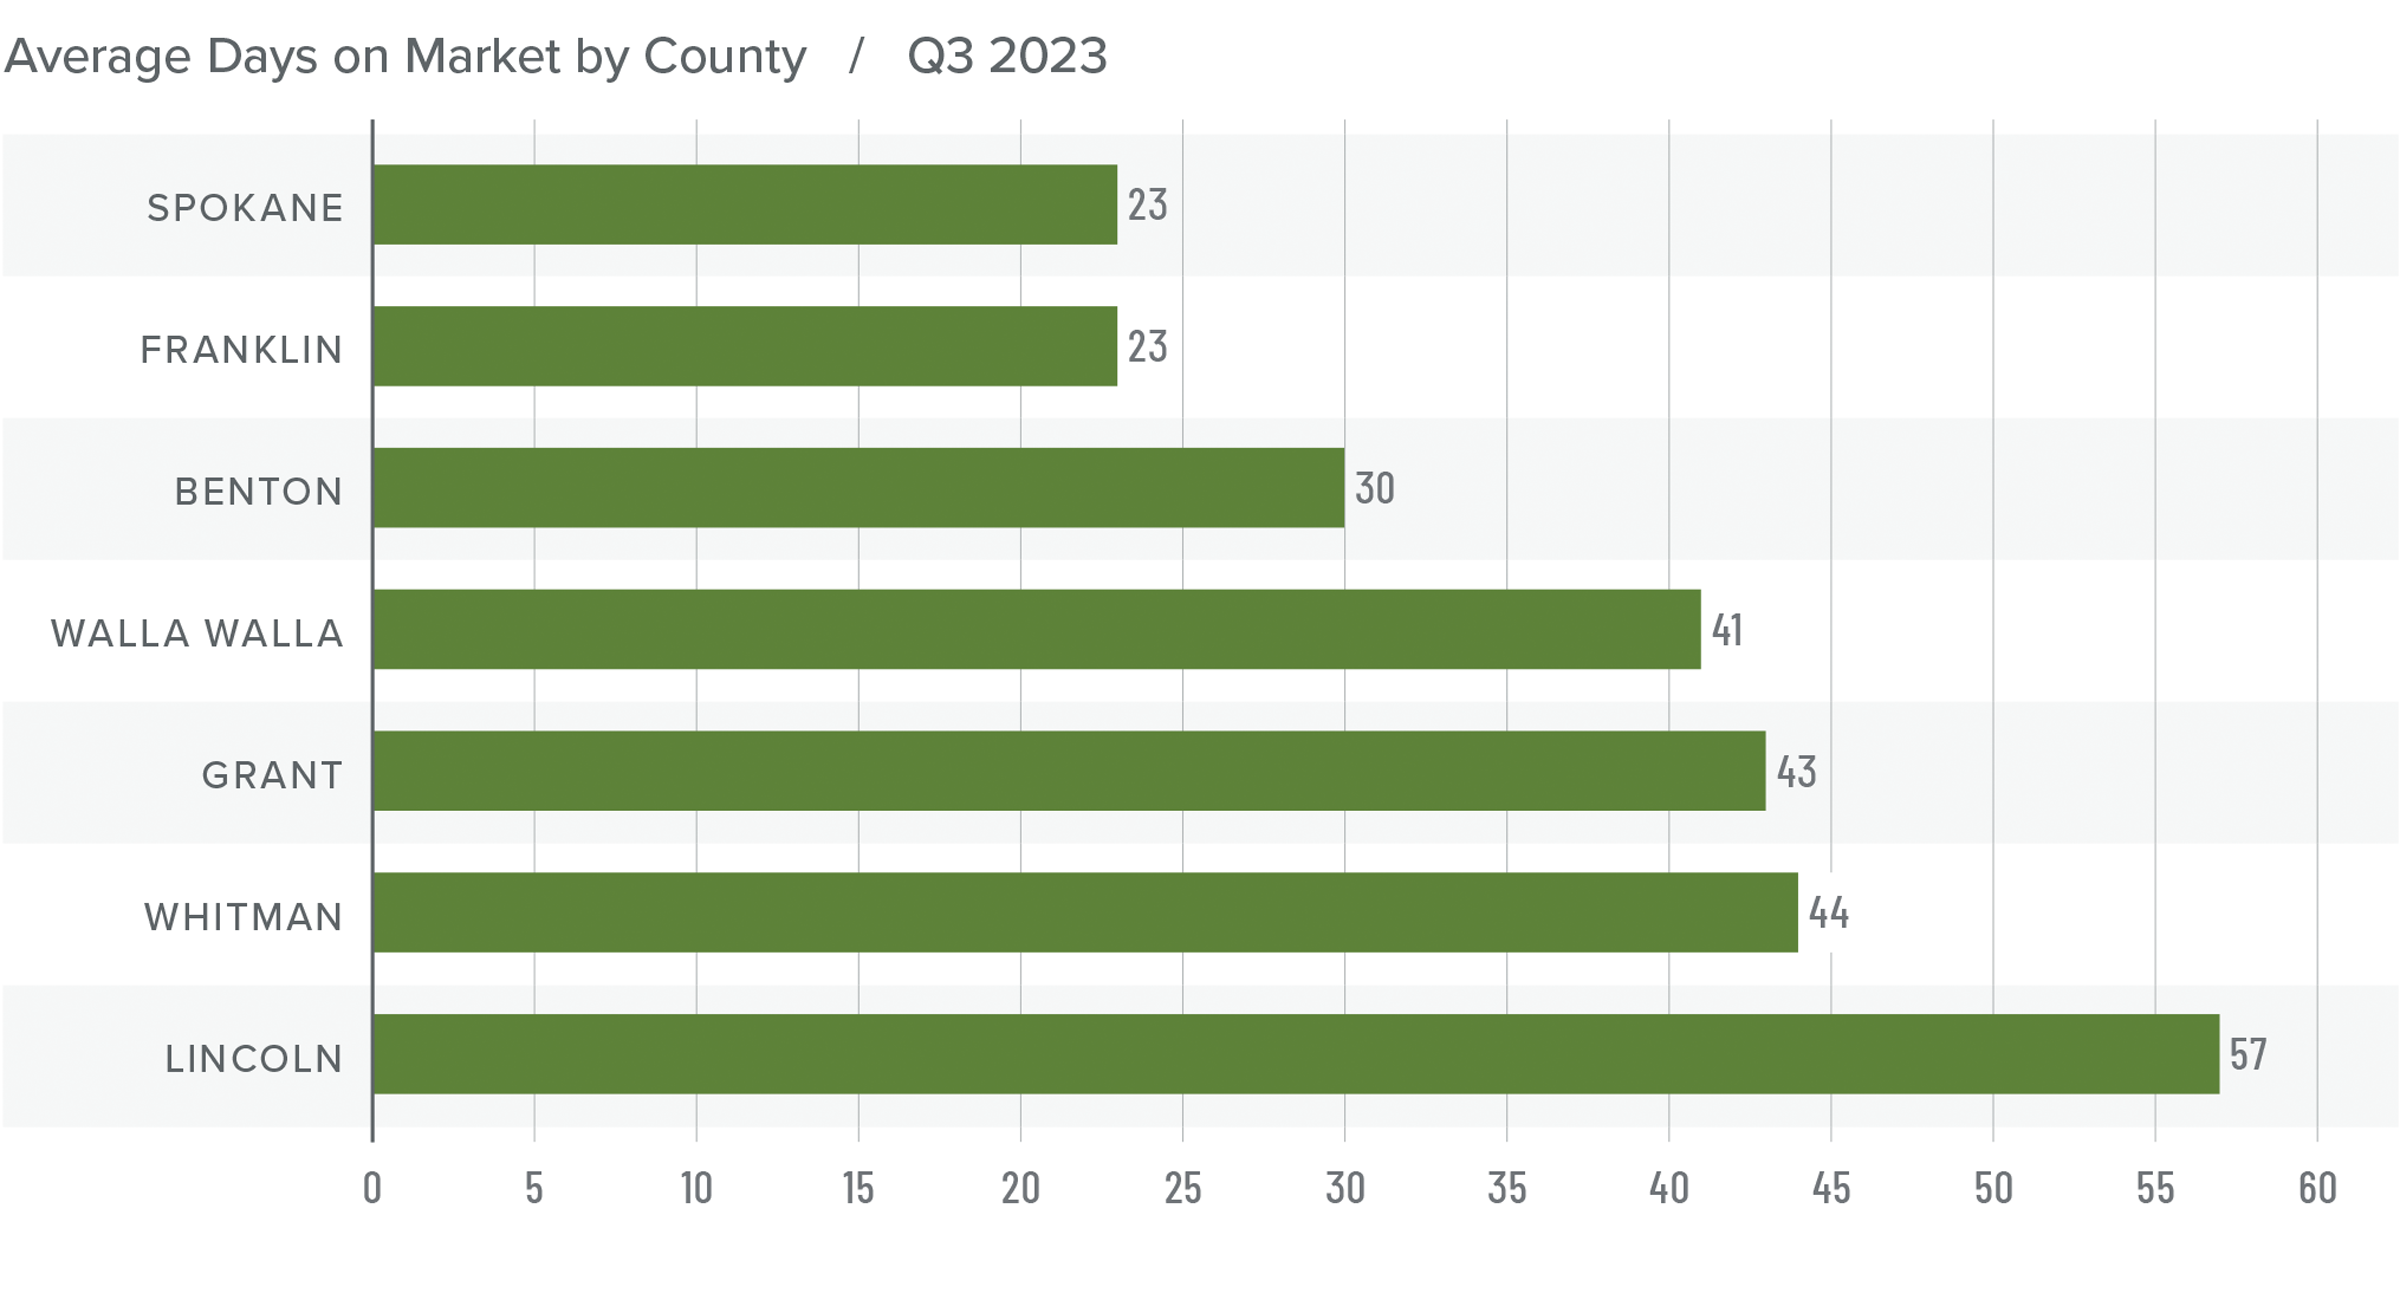
❱ The average time it took to sell a home in Eastern Washington in the third quarter of 2023 was 37 days, which is 13 more days than during the same period of 2022.
❱ Compared to the second quarter of this year, average days on market fell in Grant, Lincoln, Franklin, and Whitman counties but rose in the rest of the markets. In aggregate, market time was down by one day.
❱ All counties saw market time rise compared to the same period in 2022.
❱ Buyers were still actively looking during the quarter, but they were a little choosier than they have been due to there being more homes for sale.
Conclusions
This speedometer reflects the state of the region’s real estate market using housing inventory, price gains, home sales, interest rates, and larger economic factors.
The market appears to be in a period of transition. Although sales were still happening, the pace of growth during the third quarter was modest. Moreover, listing inventory has risen significantly, which favors home buyers who are faced with decades-high mortgage rates.
Home sale prices were higher and asking prices were up significantly, which is a little counterintuitive given where mortgage rates are sitting. Sellers appear to still be confident.
The market is clearly in a state of flux and will likely continue to be in the coming
months. Buyers are hoping that mortgage rates have peaked, and may even come down by the new year, which is leading to a lot of fence-sitters.
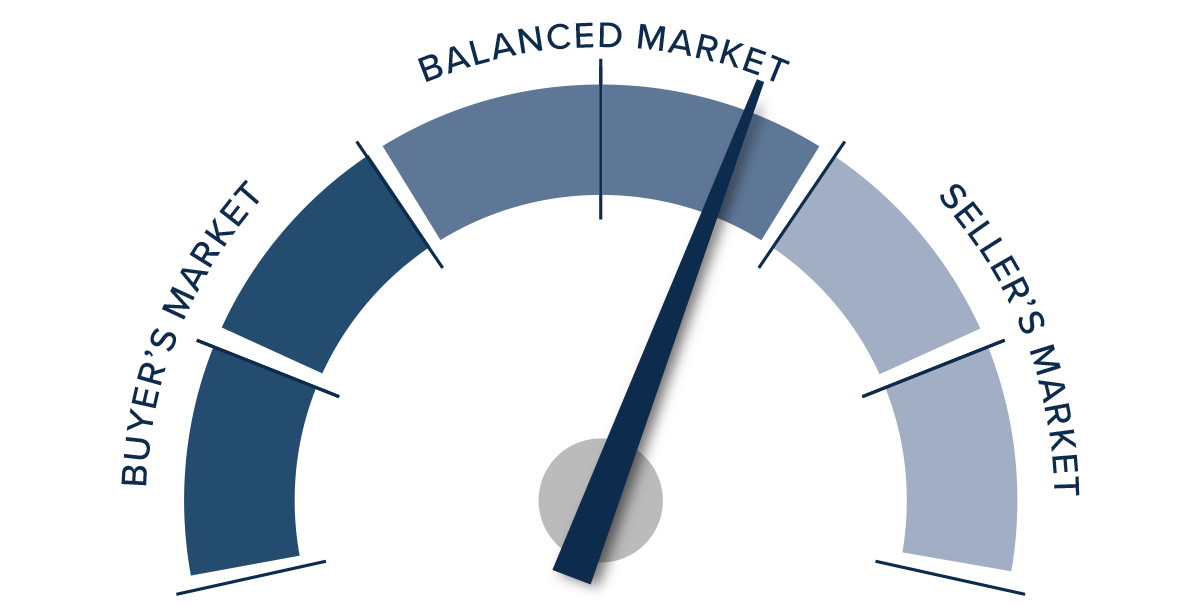
As such, the needle moves back
a little from sellers, but it remains in the
balanced quadrant, as neither side has an
overriding advantage.
Q2 2023 Eastern Washington Real Estate Market Update

The following analysis of select counties of the Eastern Washington real estate market is provided by Windermere Real Estate Chief Economist Matthew Gardner. We hope that this information may assist you with making better-informed real estate decisions. For further information about the housing market in your area, please don’t hesitate to contact your Windermere Real Estate agent.
Regional Economic Overview
Year over year, total employment in Eastern Washington rose by 11,368 jobs, with most markets seeing decent gains. On a percentage basis, the fastest growing market was Lincoln County, where employment rose 4.2%. This was followed by Benton (+3.9%) and Spokane (+2.8%) counties. Franklin and Grant counties had modest job gains, while 185 jobs were lost in Whitman County. In total, the region’s employment base rose 2.4% from the second quarter in 2022. Unadjusted for seasonality, the regional unemployment rate was 3.2%, down from 4.5% during the second quarter of 2022. The seasonally adjusted jobless rate was 3.4%, down from 4.8% during the same period in 2022.
Eastern Washington Home Sales
❱ In the second quarter of 2023, 2,531 homes sold. This was 28.6% lower than in the second quarter of 2022, but 44.3% higher compared to the first quarter of 2023.
❱ It is likely that the rise in sales can be attributed to the 41.9% increase in the number of homes for sale in the quarter.
❱ Year over year, sales fell across the region, but they were up in every county covered by this report compared to the first quarter.
❱ Pending sales also rose by 31.4%, which suggests that the increase in the number of sales in the second quarter could carry over into the second half of the year.
Eastern Washington Home Prices
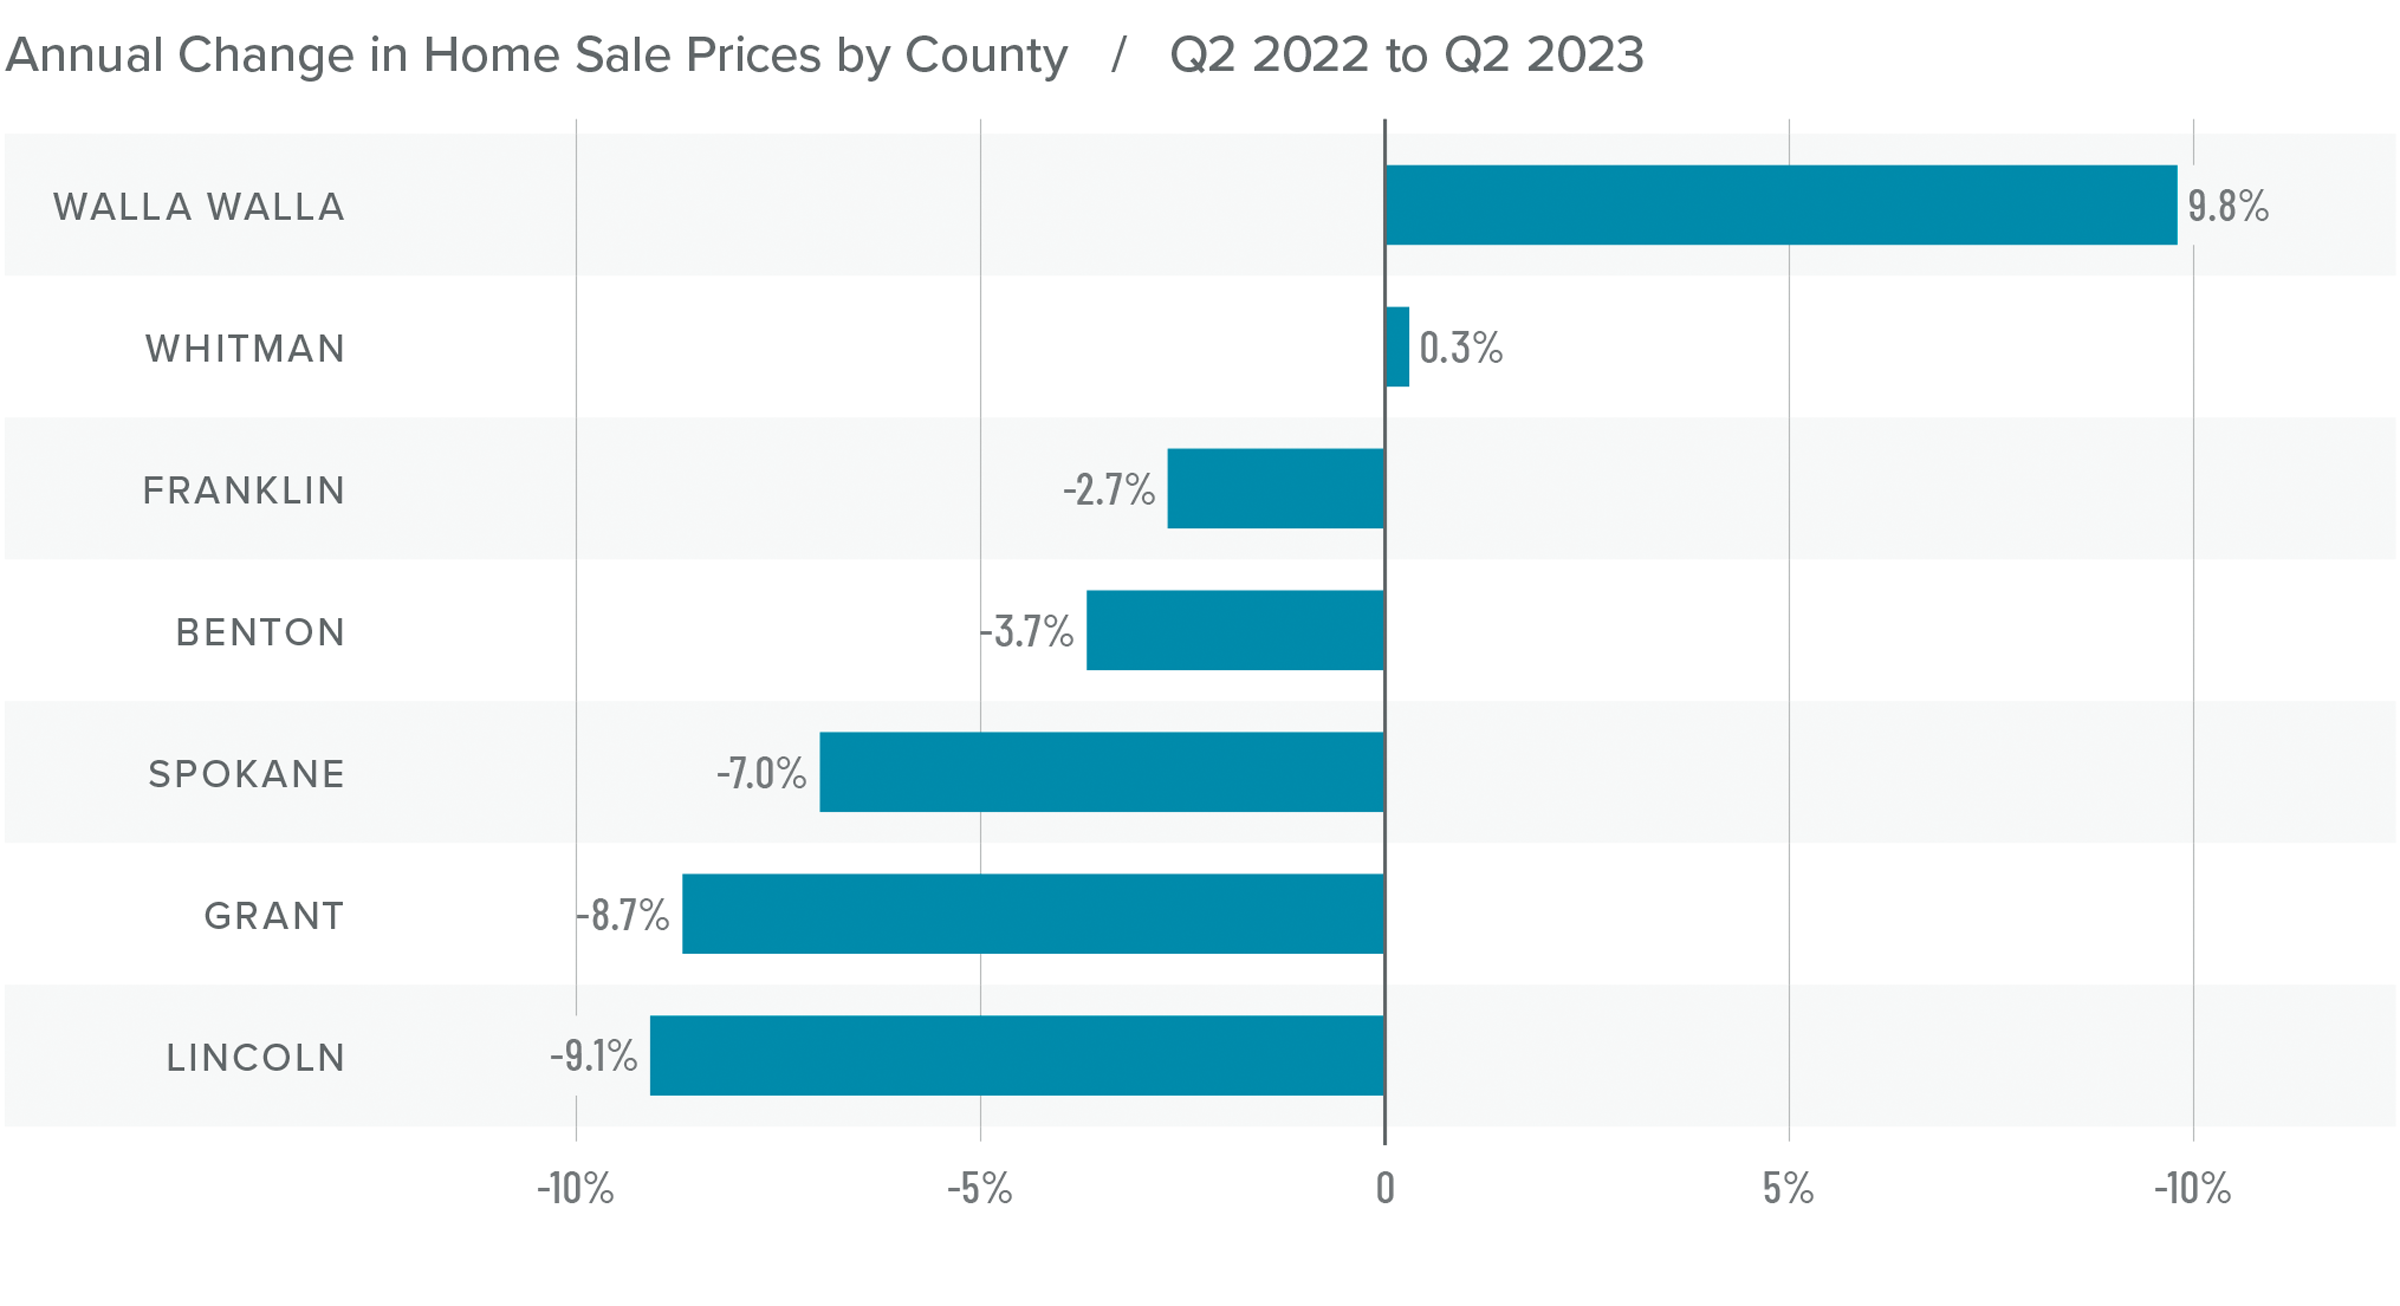
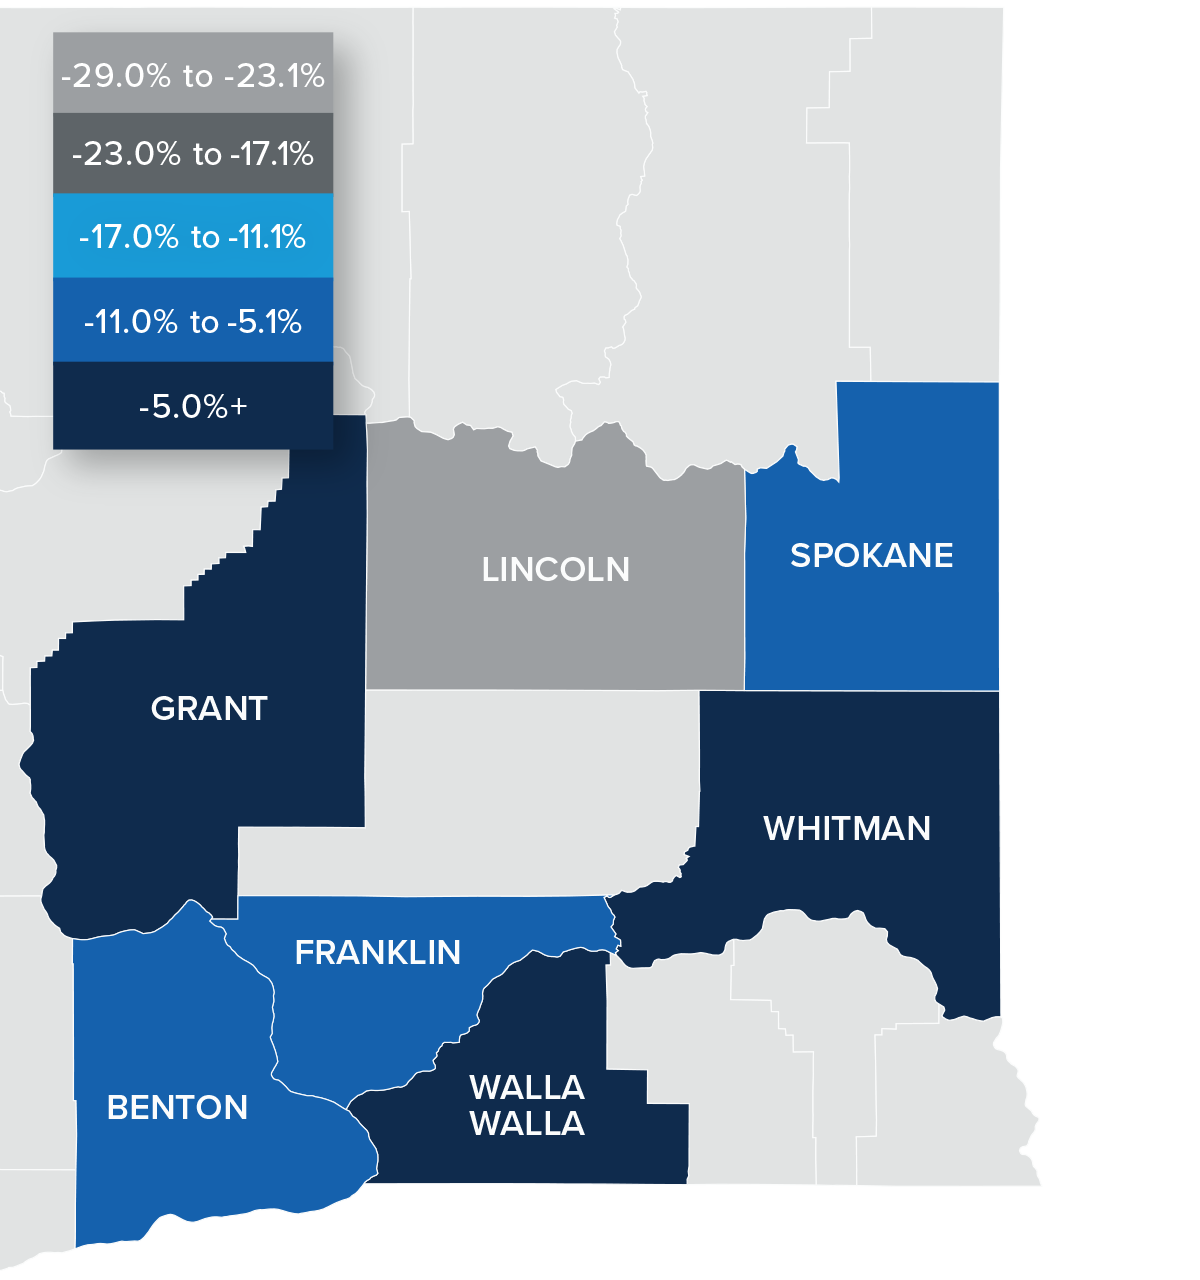
❱ Year over year, the average home price in Eastern Washington fell 5.1% to $450,474. Prices rose 9.9% compared to the first quarter of this year.
❱ Compared to the first quarter, prices rose across the board even as median list prices increased by 8.5%. It appears that sales contractions are now in the rearview mirror, at least for the time being.
❱ Every county except Walla Walla and Whitman saw average sale prices fall compared to the second quarter of 2022. This decline was modest and not surprising given that prices peaked in the second quarter of last year when mortgage rates started to rise.
❱ Higher mortgage rates do not appear to have been a significant obstacle to home buyers or sellers. Whether this can continue remains to be seen, but I’m hopeful that mortgage rates will start to trend lower.
Mortgage Rates
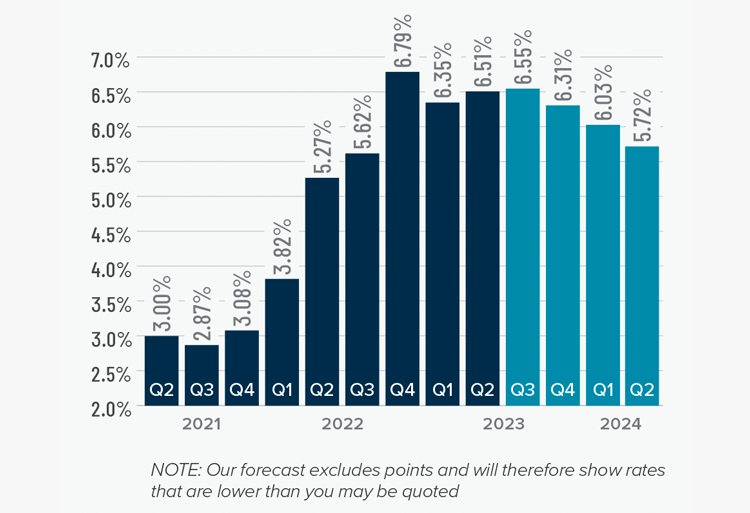
Although they were less erratic than the first quarter, mortgage rates unfortunately trended higher and ended the quarter above 7%. This was due to the short debt ceiling impasse, as well as several economic datasets that suggested the U.S. economy was not slowing at the speed required by the Federal Reserve.
While the June employment report showed fewer jobs created than earlier in the year, as well as downward revisions to prior gains, inflation has not sufficiently slowed. Until it does, rates cannot start to trend consistently lower. With the economy not slowing as fast as expected, I have adjusted my forecast: Rates will hold at current levels in third quarter and then start to trend lower through the fall. Although there are sure to be occasional spikes, my model now shows the 30-year fixed rate breaking below 6% next spring.
Eastern Washington Days on Market
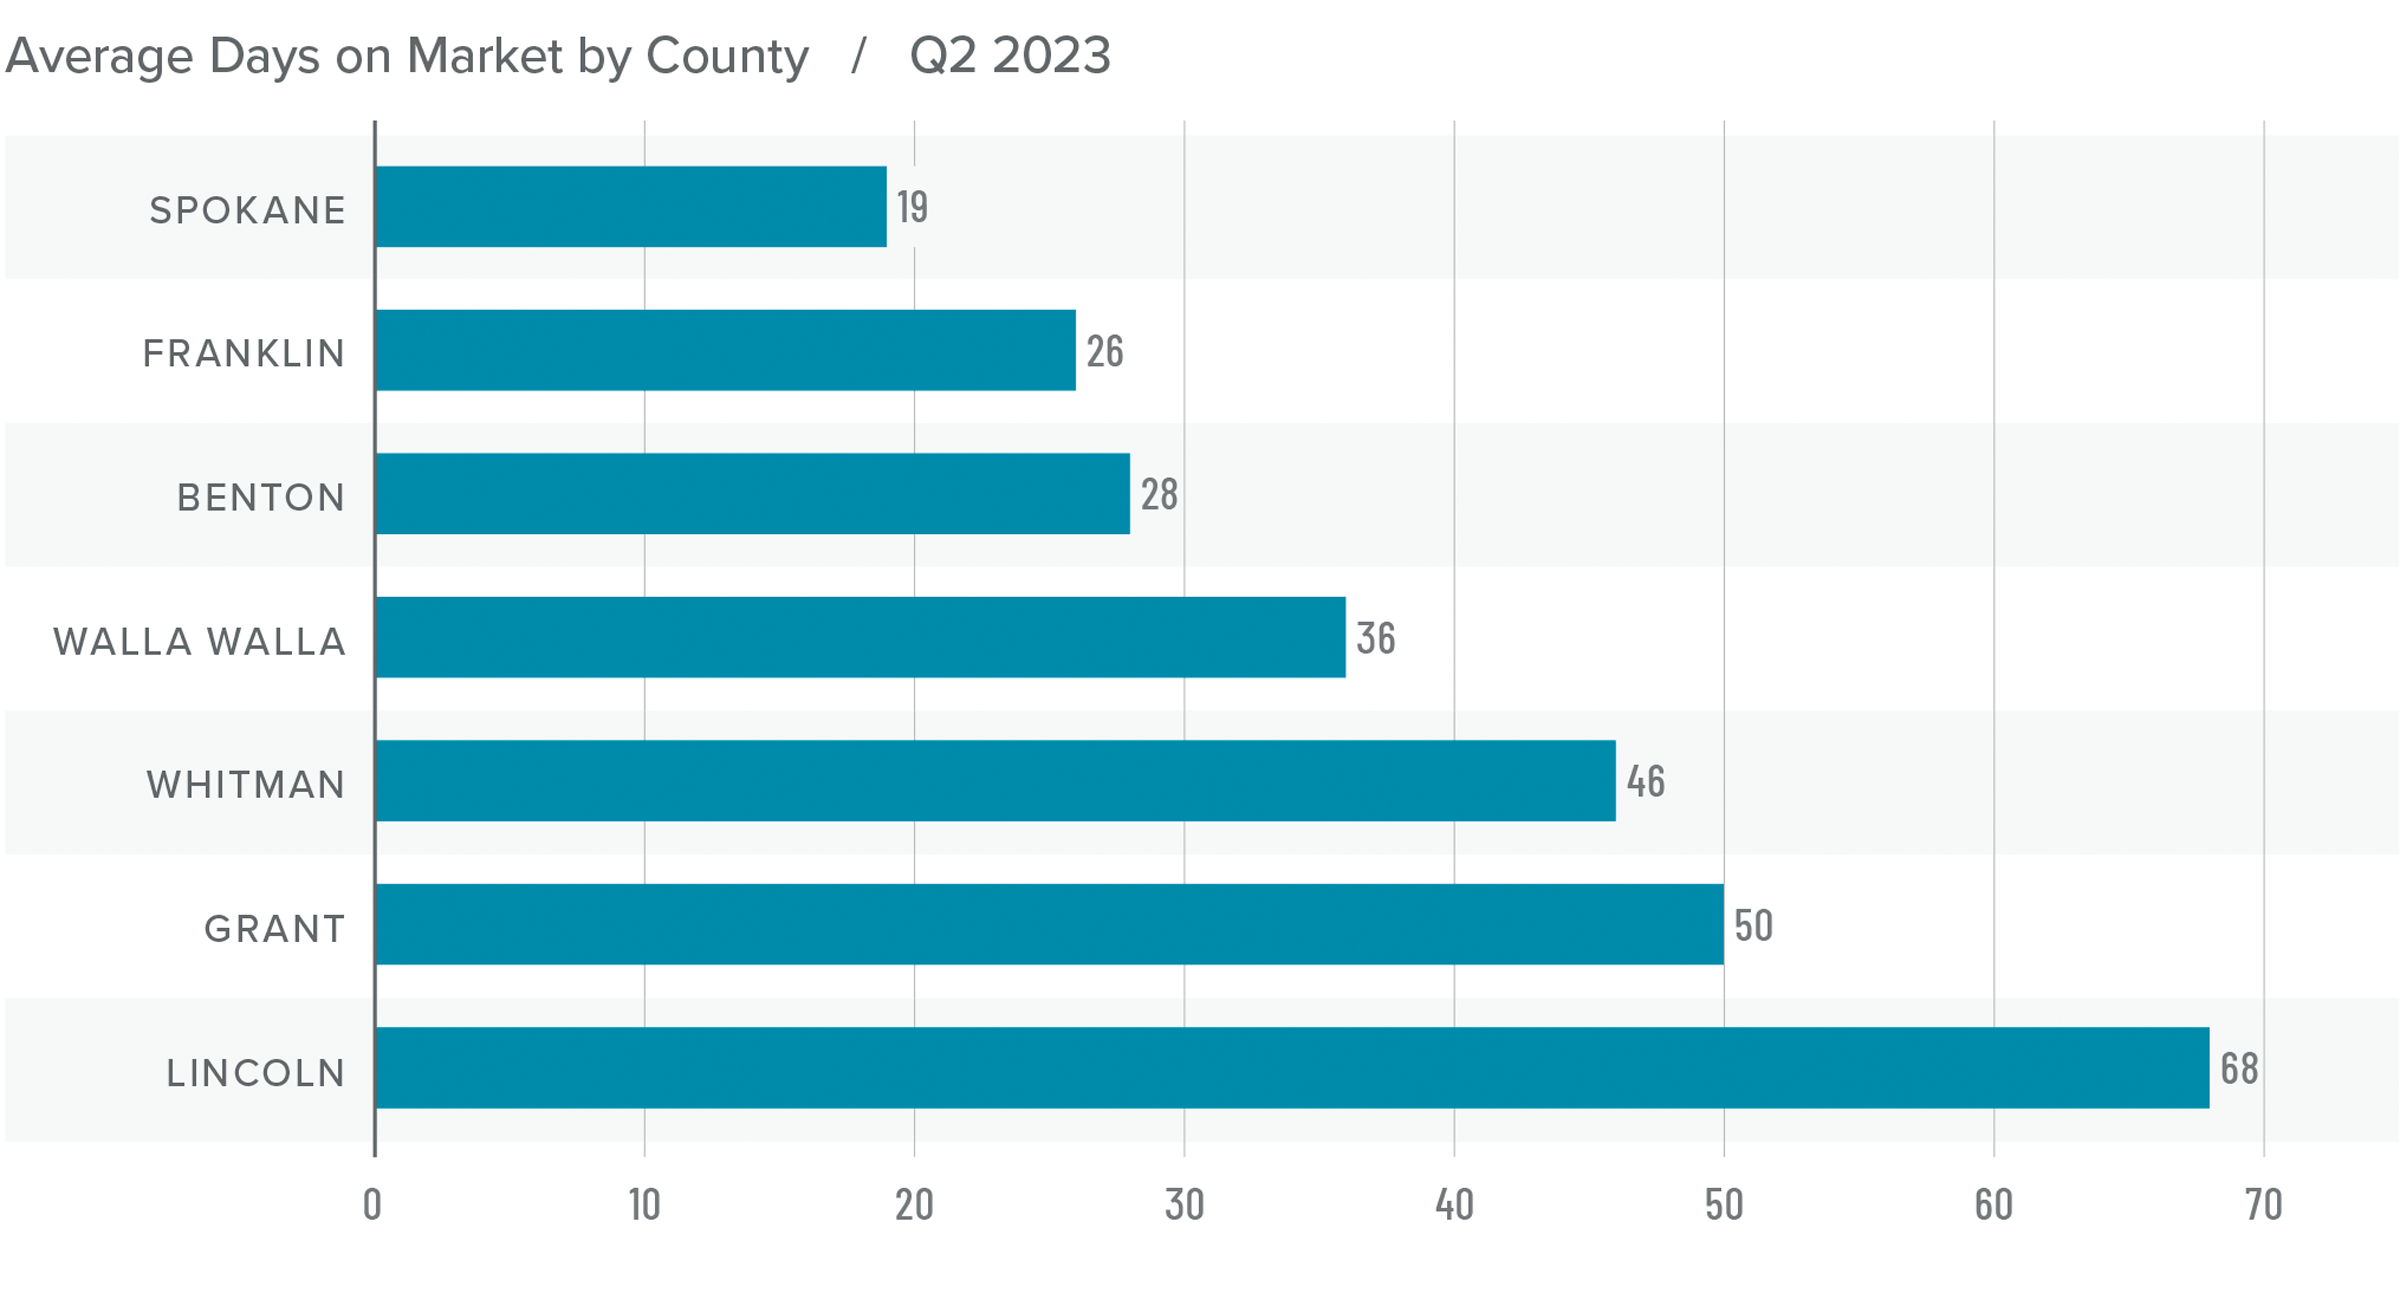
❱ The average time it took to sell a home in Eastern Washington in the second quarter of 2023 was 39 days, which was 22 more than during the same period in 2022.
❱ Compared to the first quarter of this year, average days on market fell in all counties other than Whitman. The regional average fell 15 days.
❱ All counties saw the average number of days it took for a house to sell rise compared to the same period in 2022.
❱ Despite higher mortgage rates and lower affordability, buyers were out in force in the quarter. It’s unknown if this pace of activity will continue, but it’s good to see the market turn around from the year’s dismal start.
Conclusions
This speedometer reflects the state of the region’s real estate market using housing inventory, price gains, home sales, interest rates, and larger economic factors.
This report provided a nice change of pace from the first quarter report when prices, sales, and inventory were all headed lower and the only thing increasing was the length of time it took for homes to sell. I believe the market correction is now complete and I’m optimistic that it will continue to gain traction as we move through the second half of the year.

As it stands today, home buyers are benefitting from more choice in the market, but all other factors favor sellers. As such, I am moving the needle more towards sellers, but not so far as to suggest that they entirely control the market.
About Matthew Gardner

As Chief Economist for Windermere Real Estate, Matthew Gardner is responsible for analyzing and interpreting economic data and its impact on the real estate market on both a local and national level. Matthew has over 30 years of professional experience both in the U.S. and U.K.
In addition to his day-to-day responsibilities, Matthew sits on the Washington State Governors Council of Economic Advisors; chairs the Board of Trustees at the Washington Center for Real Estate Research at the University of Washington; and is an Advisory Board Member at the Runstad Center for Real Estate Studies at the University of Washington where he also lectures in real estate economics.
Q1 2023 Eastern Washington Real Estate Market Update

The following analysis of select counties of the Eastern Washington real estate market is provided by Windermere Real Estate Chief Economist Matthew Gardner. We hope that this information may assist you with making better-informed real estate decisions. For further information about the housing market in your area, please don’t hesitate to contact your Windermere Real Estate agent.
Regional Economic Overview
Total employment in Eastern Washington rose 14,046 jobs year over year, with all markets seeing substantial gains. On a percentage basis, the fastest growing market was Benton County, where employment rose by 4%. The slowest growing market was Whitman, where the number of jobs rose 1.8%. In total, the region’s employment base rose 2.9% over the first quarter of 2022. Unadjusted for seasonality, the regional unemployment rate was 7.1%, which is up from 5.8% a year ago. When seasonally adjusted, however, the jobless rate was a more respectable 6%, which is up from 4.8% a year ago. Although the unemployment rate has risen, it is due to a growing labor force rather than a significant increase in the number of unemployed people. I still expect to see jobs added as we move through the year. However, the pace of growth is likely to slow if the U.S. economy starts to contract later this year, which is possible but not guaranteed.
Eastern Washington Home Sales
❱ In the first quarter of 2023, 1,717 homes sold, which was 28.7% lower than in the same period in 2022 and 22.1% lower than in the final quarter of 2022.
❱ Much of the decline in sales can be attributed to a significant slowdown in the number of homes for sale. Listing activity fell 36.5% compared to the final quarter of last year. A question remains as to whether the market will see its traditional spring bump, or if homeowners will stay put until interest rates get closer to the rate on their current mortgage.
❱ Year over year, sales fell across the region. All counties saw sales fall compared to the fourth quarter of last year as well.
❱ The good news is that pending sales rose 18.2% compared to the previous quarter, giving the market some hope that sales activity will rise in the second quarter of the year.

Eastern Washington Home Prices
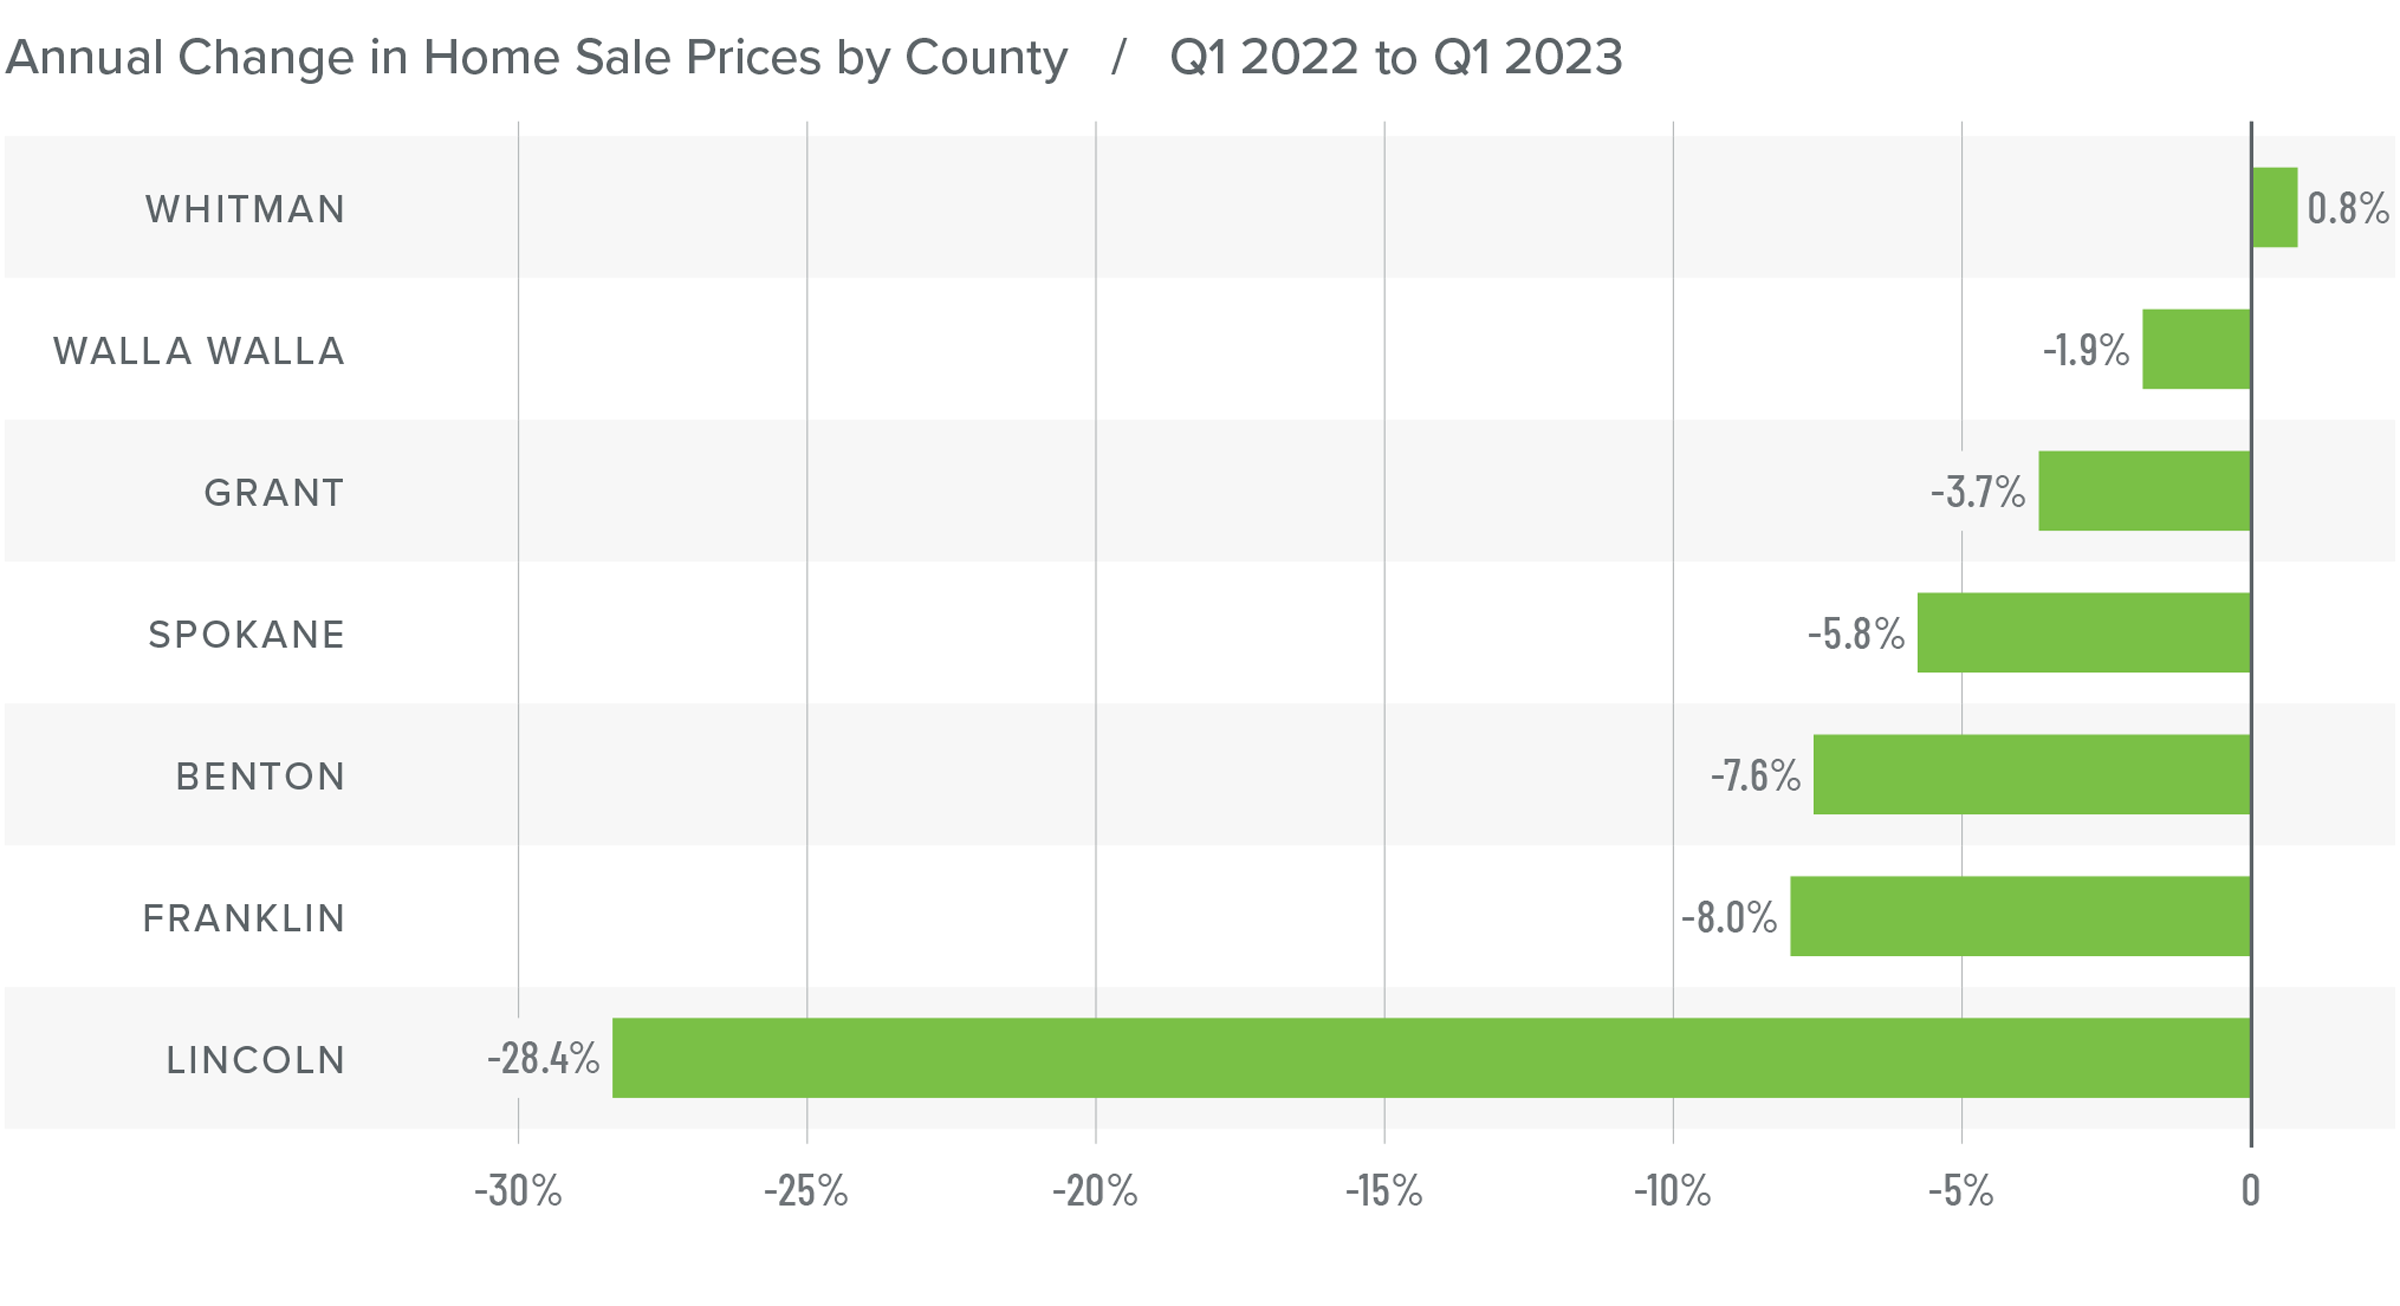
❱ Year over year, the average home price in Eastern Washington fell 5.7% to $410,234. Average prices were down 7% compared to the final quarter of 2022.
❱ Prices also fell across the board compared to the final quarter of 2022. The market appears to be in the middle of a correction, with data showing that the median listing price was 2.8% lower than in the fourth quarter.
❱ Every county except Whitman saw average sale prices fall compared to the first quarter of 2022, with a significant drop in Lincoln County.
❱ Mortgage rates remain elevated, which is putting additional downward pressure on prices. While the market shift is painful to watch, it is necessary. I expect that the region will find a floor in the not-too-distant future, and that prices will start rising again later this summer.
Mortgage Rates
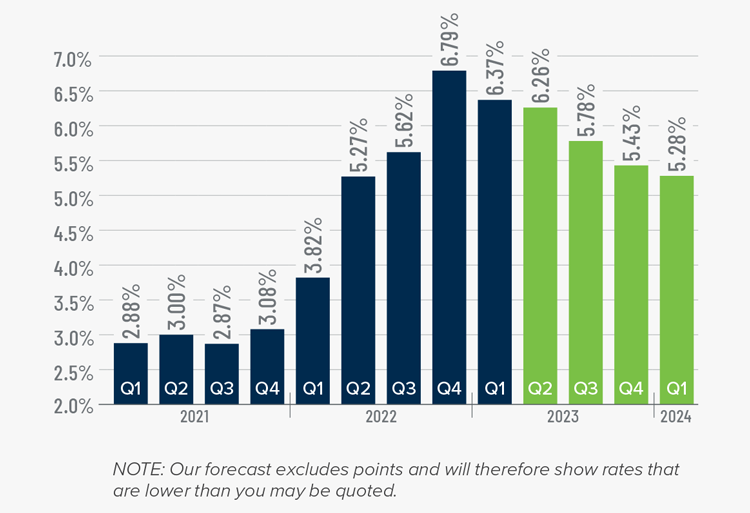
Rates in the first quarter of 2023 were far less volatile than last year, even with the brief but significant impact of early March’s banking crisis. It appears that buyers are jumping in when rates dip, which was the case in mid-January and again in early February.
Even with the March Consumer Price Index report showing inflation slowing, I still expect the Federal Reserve to raise short-term rates one more time following their May meeting before pausing rate increases. This should be the catalyst that allows mortgage rates to start trending lower at a more consistent pace than we have seen so far this year. My current forecast is that rates will continue to move lower with occasional spikes, and that they will hold below 6% in the second half of this year.
Eastern Washington Days on Market
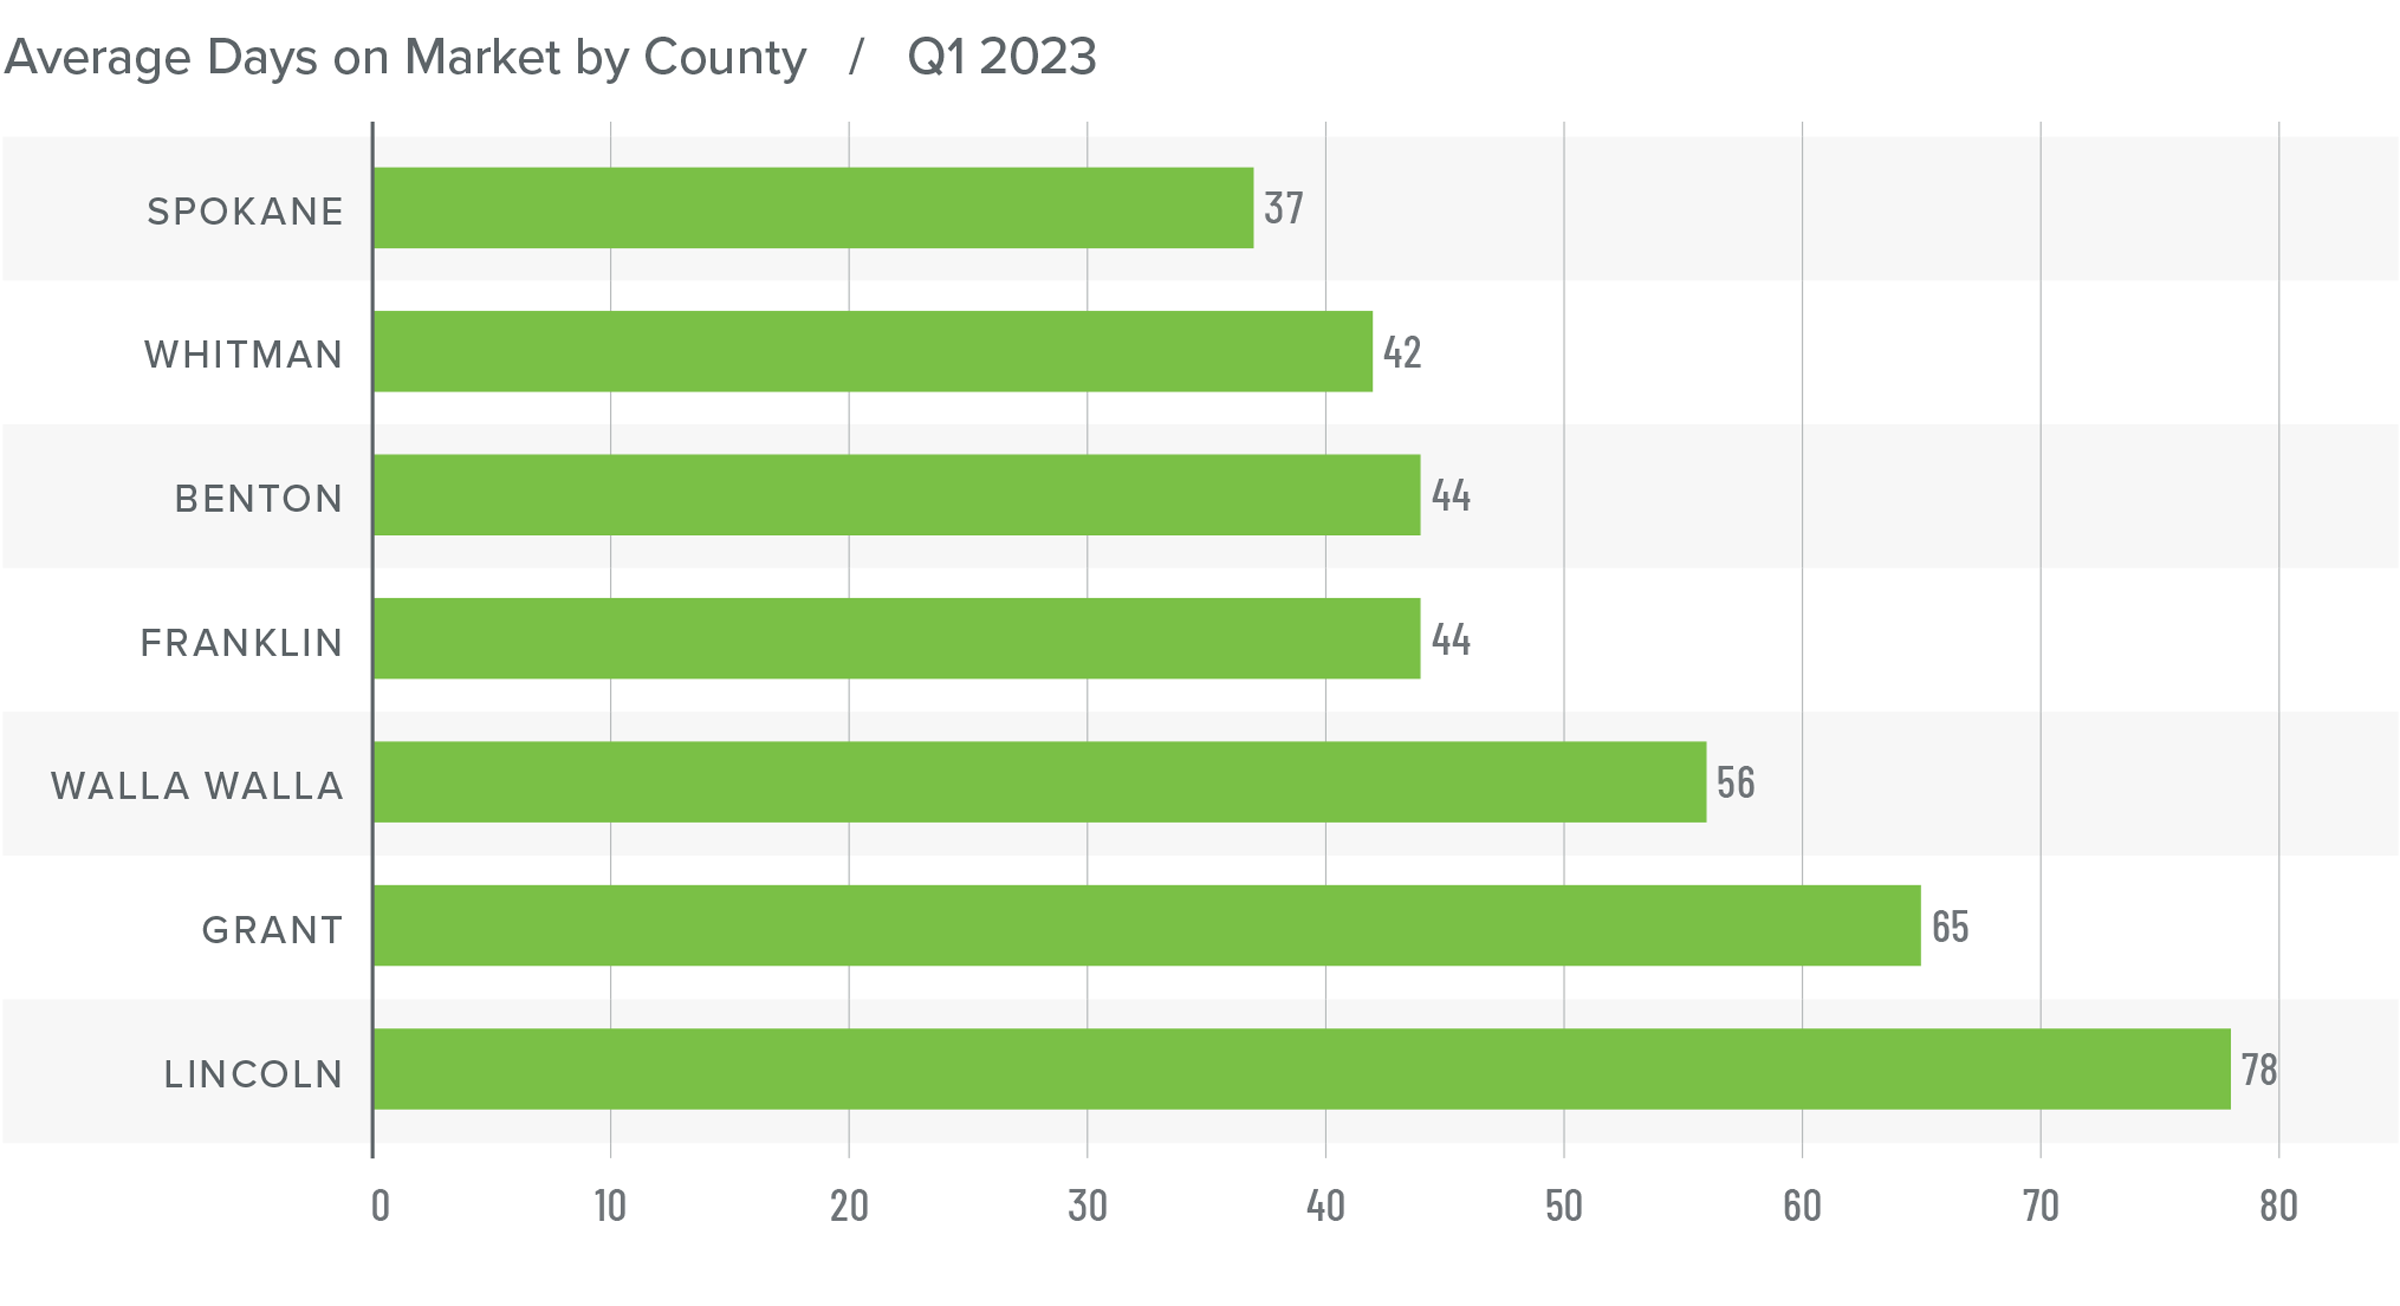
❱ The average time it took to sell a home in Eastern Washington in the first quarter of 2023 was 52 days, which was 27 more days than during the same period in 2022.
❱ Average days on market also rose in every county compared to the fourth quarter of 2022, with the regional average rising 17 days.
❱ All counties saw the average number of days it took for a house to go under contract rise compared to the same period a year ago.
❱ Stubbornly higher mortgage rates, lower affordability, and some amount of economic uncertainty has caused days on market to rise. Increasing numbers of pending sales in the quarter suggest that there are buyers out there. I hope we will see greater activity in the region as we move through the spring months.
Conclusions
This speedometer reflects the state of the region’s real estate market using housing inventory, price gains, home sales, interest rates, and larger economic factors.
Higher financing costs continue to act as a significant headwind in the market. Although listing and sale prices have been falling, I see this as a needed correction, and one that will be over before the summer sets in. I am hopeful that mortgage rates will stabilize and head lower as we enter the summer, which should bring more buyers into the market.

As it stands today, home buyers have the upper hand, but this could only be for a short time—the market can move swiftly when it wants to. For now, buyers should enjoy this likely brief period of dominance.
About Matthew Gardner
As Chief Economist for Windermere Real Estate, Matthew Gardner is responsible for analyzing and interpreting economic data and its impact on the real estate market on both a local and national level. Matthew has over 30 years of professional experience both in the U.S. and U.K.
In addition to his day-to-day responsibilities, Matthew sits on the Washington State Governors Council of Economic Advisors; chairs the Board of Trustees at the Washington Center for Real Estate Research at the University of Washington; and is an Advisory Board Member at the Runstad Center for Real Estate Studies at the University of Washington where he also lectures in real estate economics.
Q4 2022 Eastern Washington Real Estate Market Update

The following analysis of select counties of the Eastern Washington real estate market is provided by Windermere Real Estate Chief Economist Matthew Gardner. We hope that this information may assist you with making better-informed real estate decisions. For further information about the housing market in your area, please don’t hesitate to contact your Windermere Real Estate agent.
Regional Economic Overview
Year over year, total employment in Eastern Washington fell 2,909 jobs. Spokane and Grant counties collectively lost 3,253 jobs. There were minor job losses in Lincoln, Walla Walla, and Whitman counties, but employment rose in Benton and Franklin counties. Unadjusted for seasonality, the regional unemployment rate was 5%, up from 4.2% a year ago. Seasonally adjusted, the jobless rate was 5.3%, up from 4.4% a year ago. Businesses may be looking to consolidate in anticipation of a possible economic slowdown this year. Although I am not particularly worried now, I will be watching to see if job losses continue as we move through the spring, which would be a greater concern.
Eastern Washington Home Sales
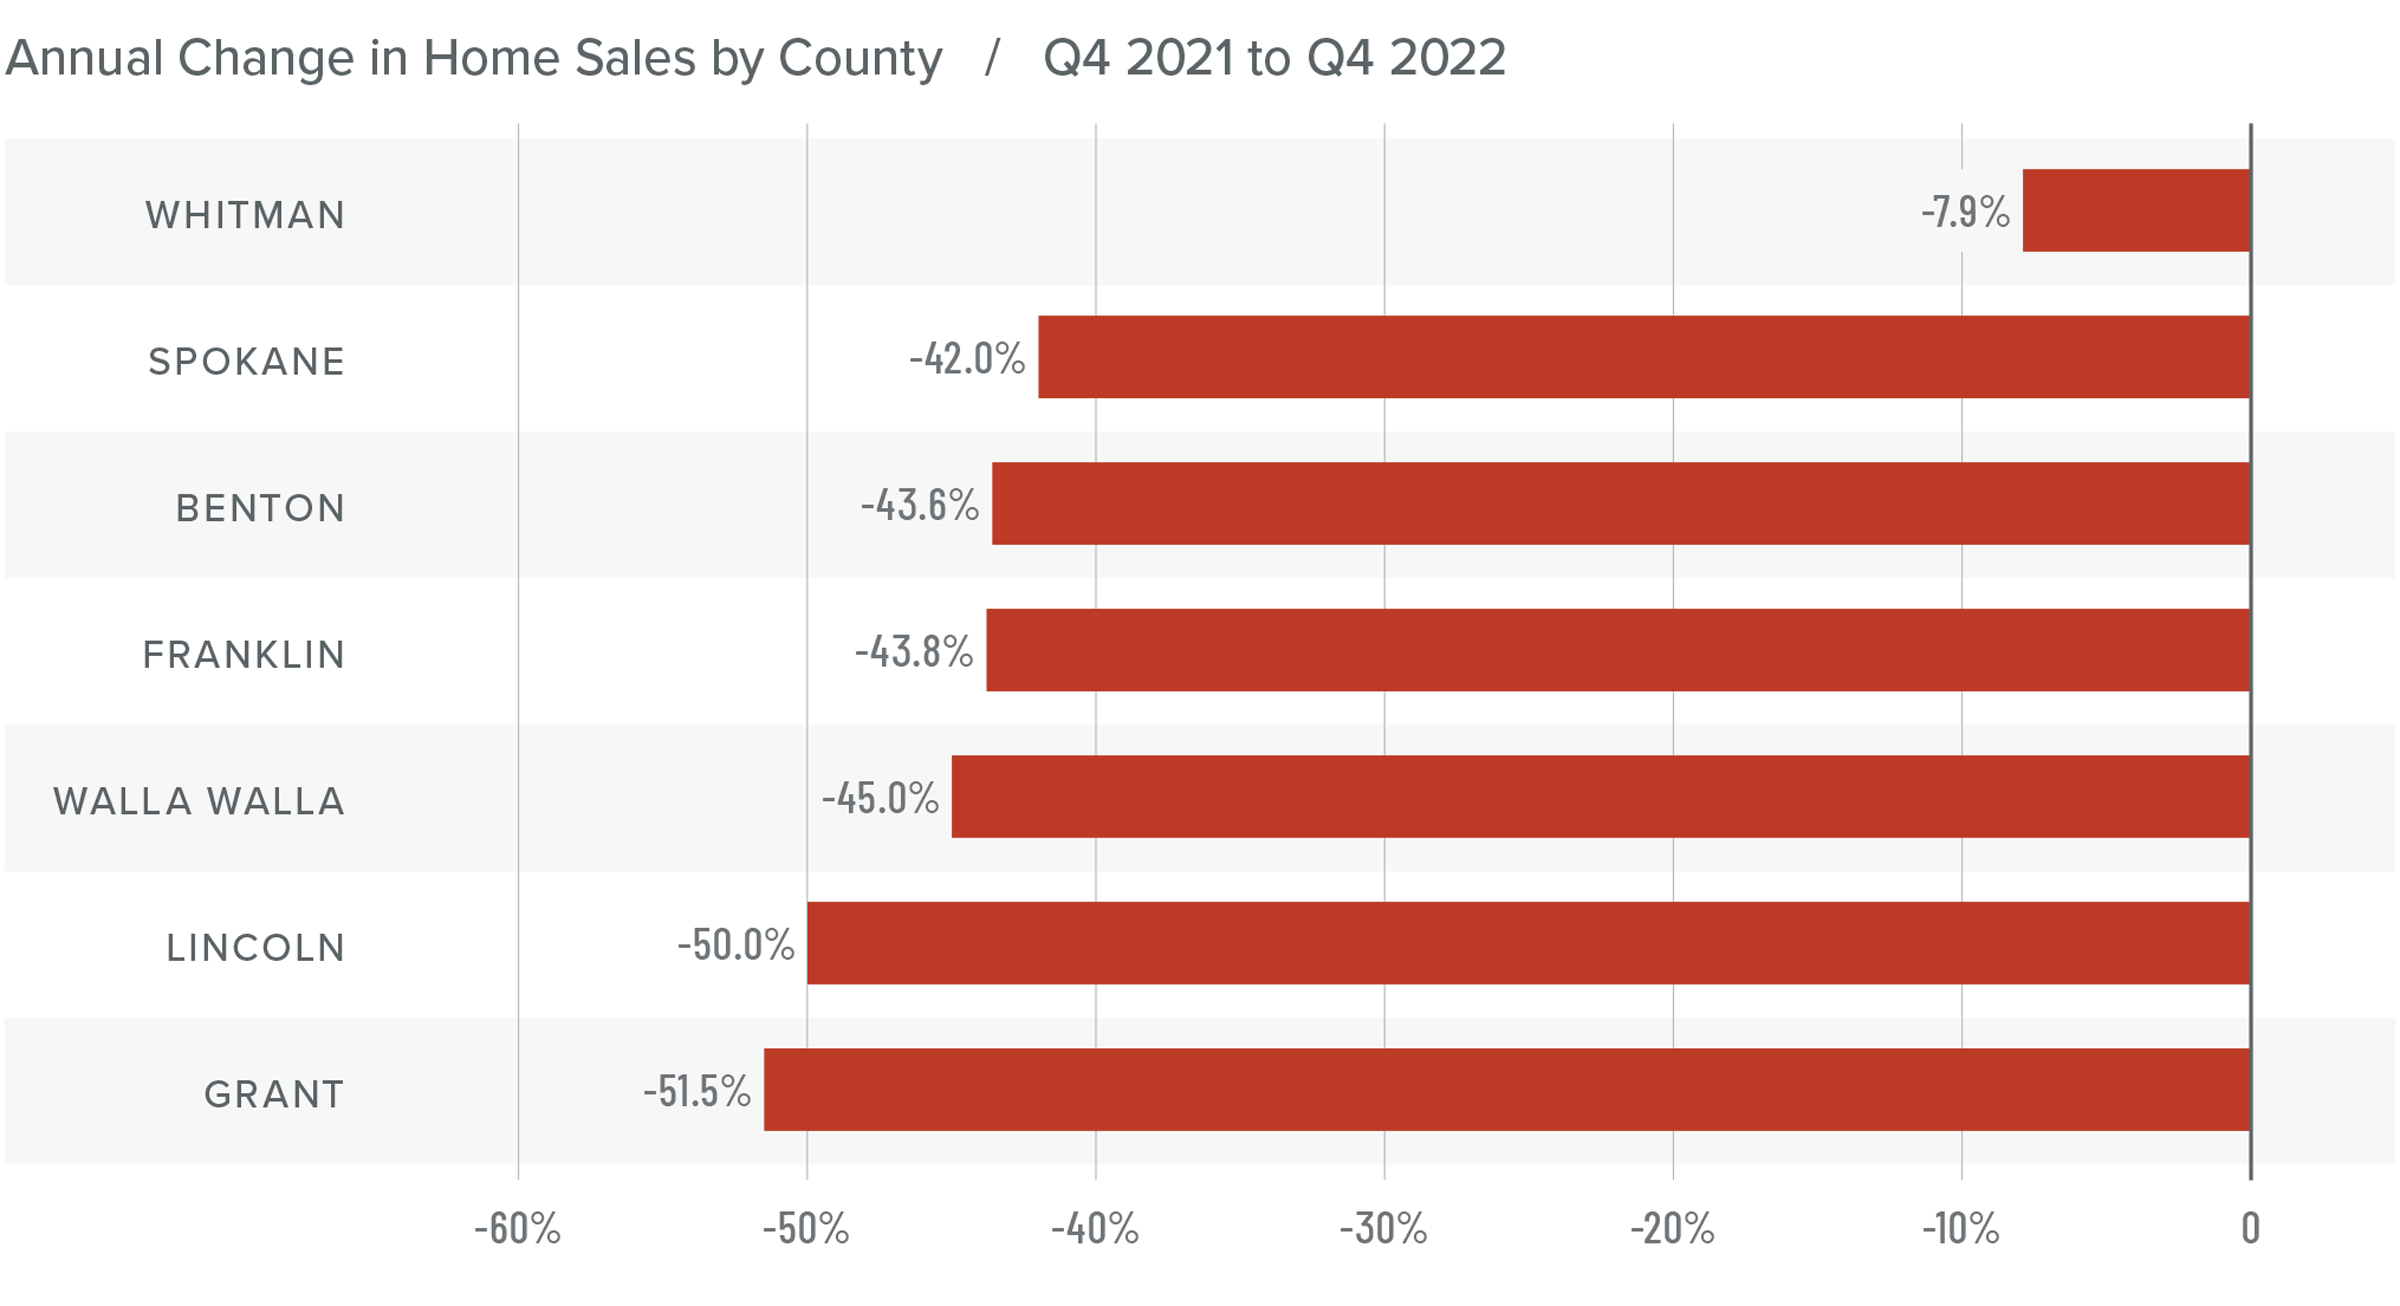
❱ In the fourth quarter of 2022, 2,167 homes sold, which was 42.8% lower than the same period the previous year and 34.4% lower than the third quarter of 2022.
❱ Listing activity rose 111% compared to the fourth quarter of 2021, but the average number of homes for sale was 12.5% lower than in the third quarter of 2022. This is expected given the slowdown that is traditional during the winter months.
❱ Year over year, sales fell across the region. Compared to the third quarter of 2022, sales were flat in Lincoln County but fell everywhere else.
❱ Pending sales fell 39.9% from the prior year, suggesting that the market will likely not see a buoyant early spring.
Eastern Washington Home Prices
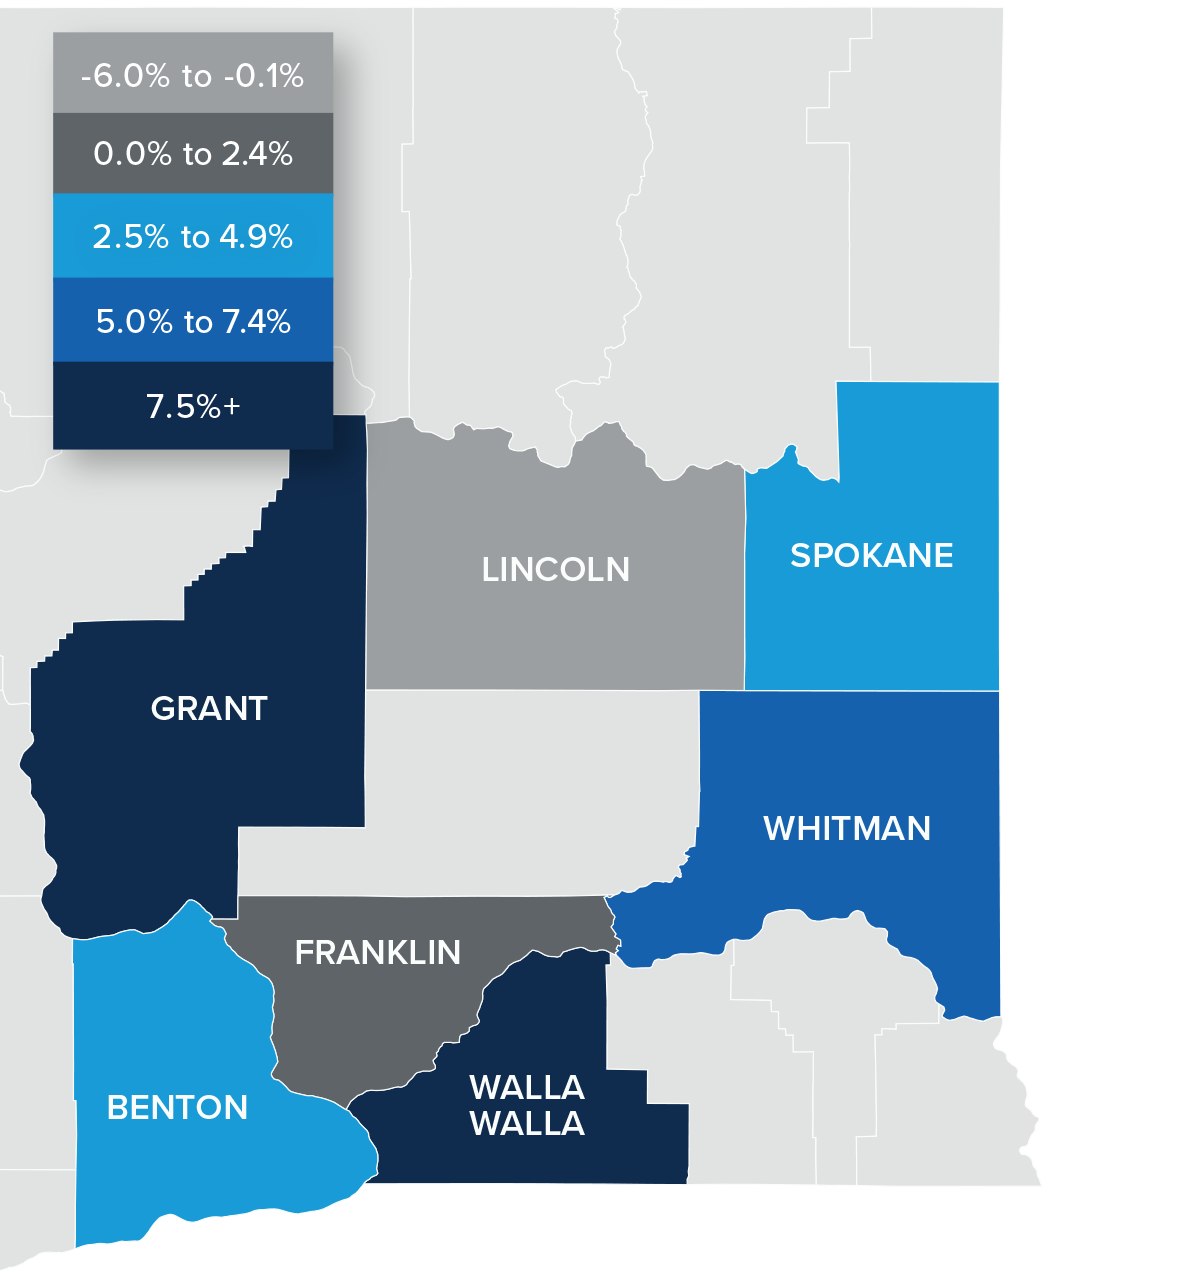
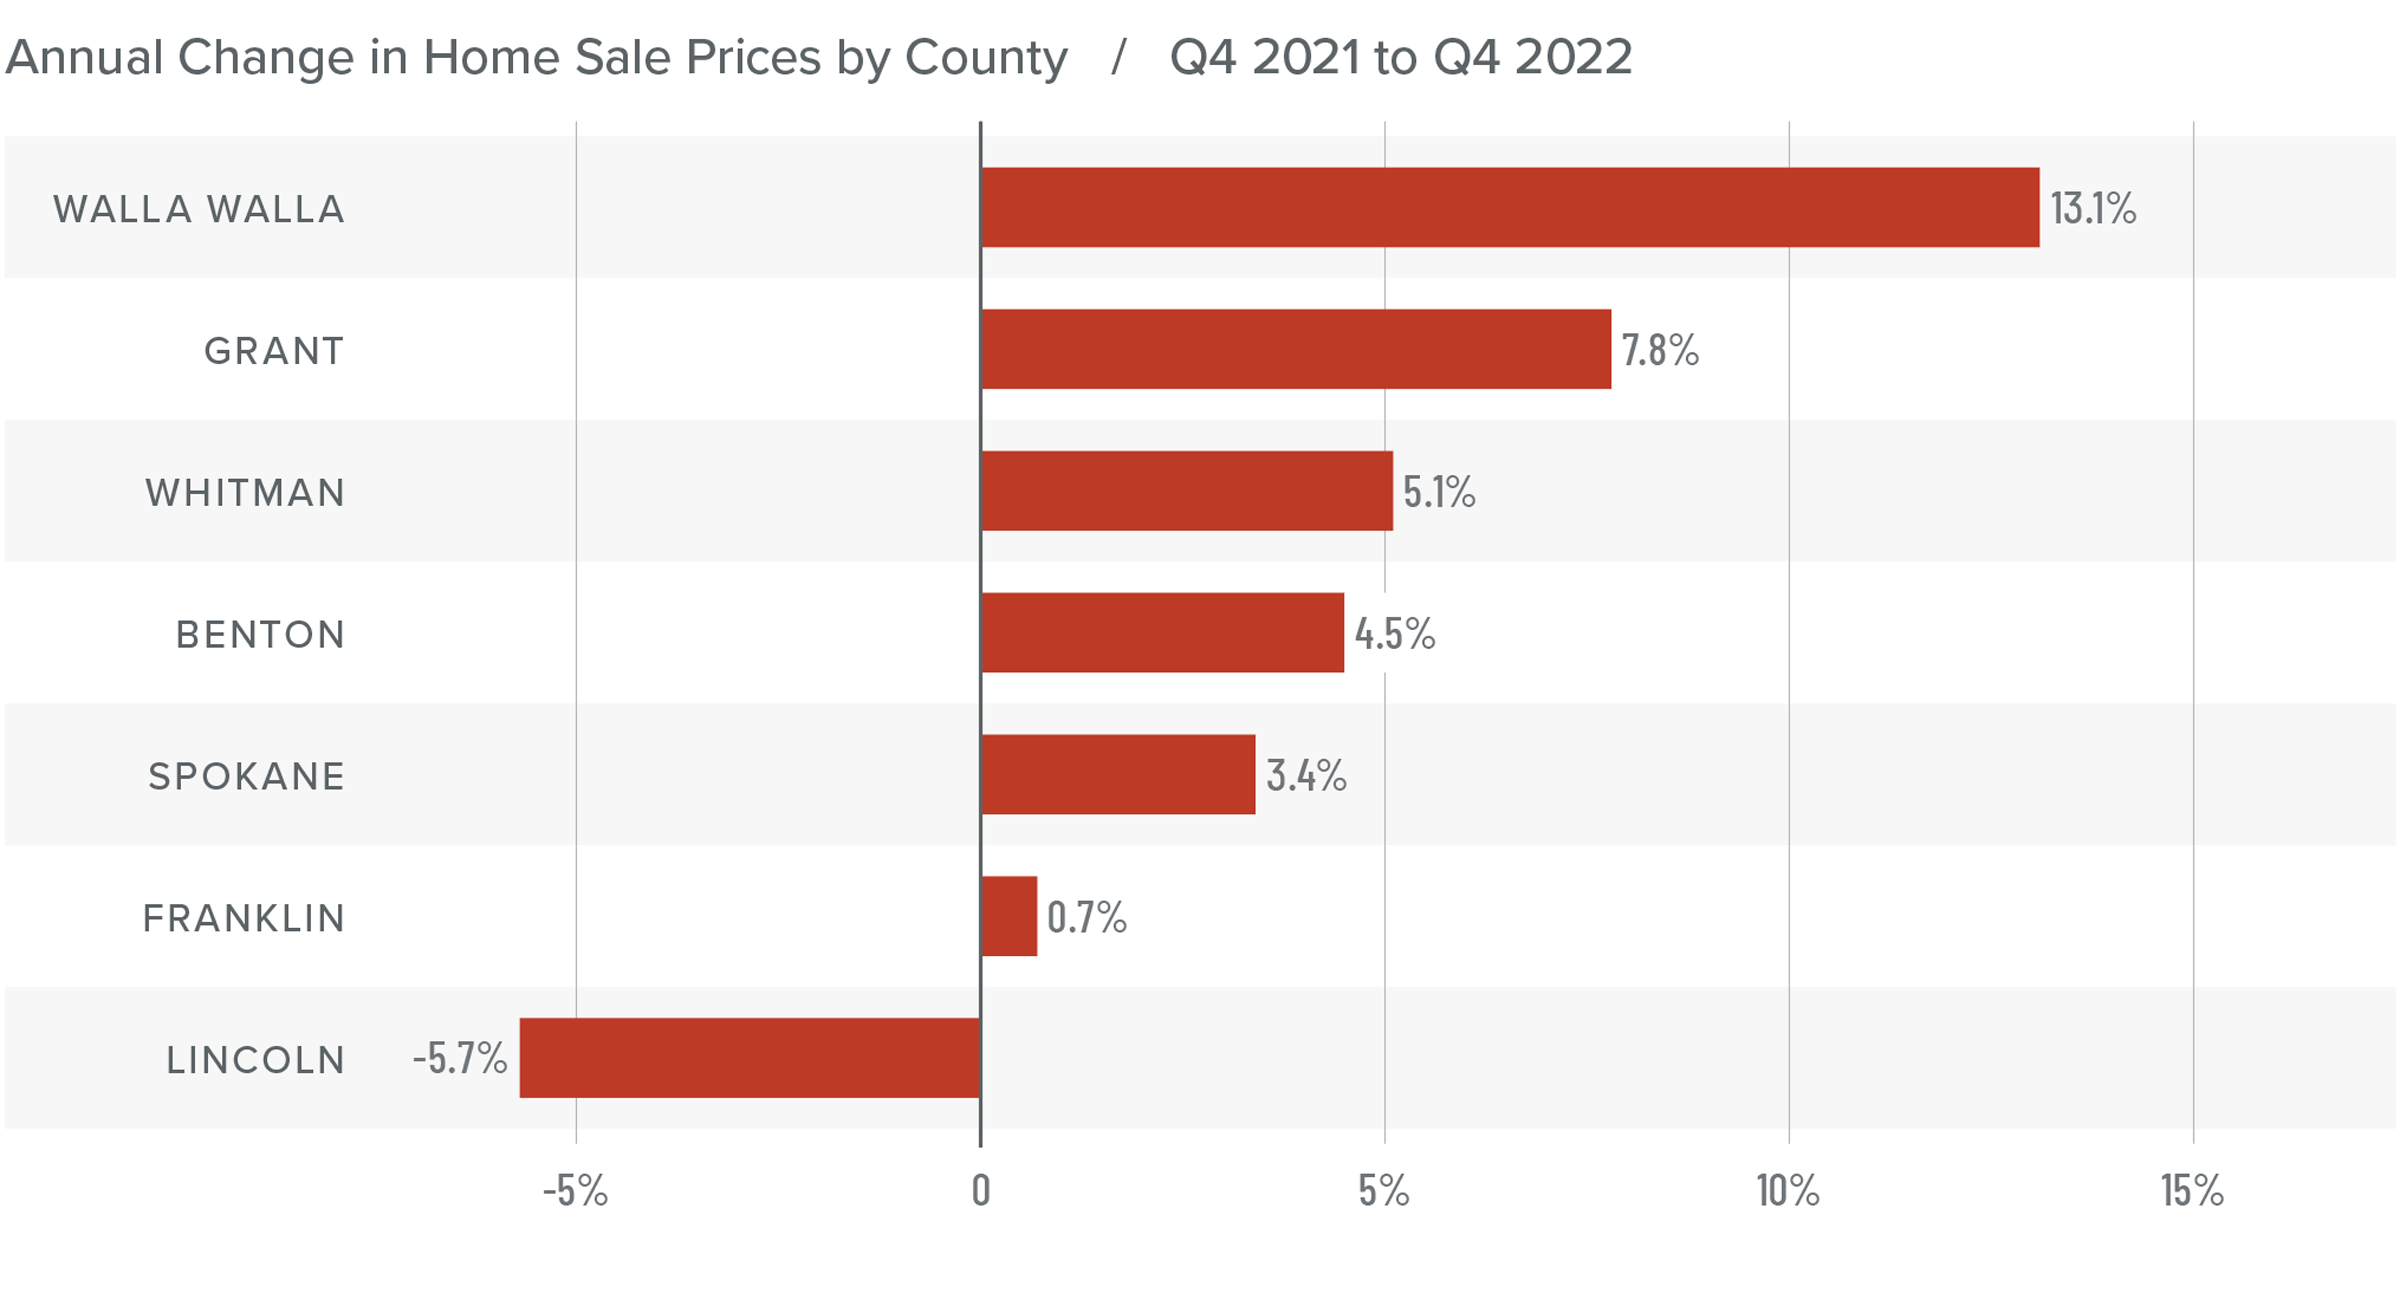
❱ Year over year, the average home price in Eastern Washington rose 4.3% to $442,603. Average prices were down 4.5% from the third quarter.
❱ Compared to the third quarter of 2022, prices fell in all counties with the exception of Franklin (+1.9%) and Walla Walla (+0.7%).
❱ Average sale prices increased year over year in every county but Lincoln. Walla Walla County experienced significant price increases.
❱ Mortgage rates peaked in the quarter, which undoubtedly impacted home prices. Additionally, median listing prices fell in all counties compared to the prior quarter, which also impacted the pace of price growth.
Mortgage Rates
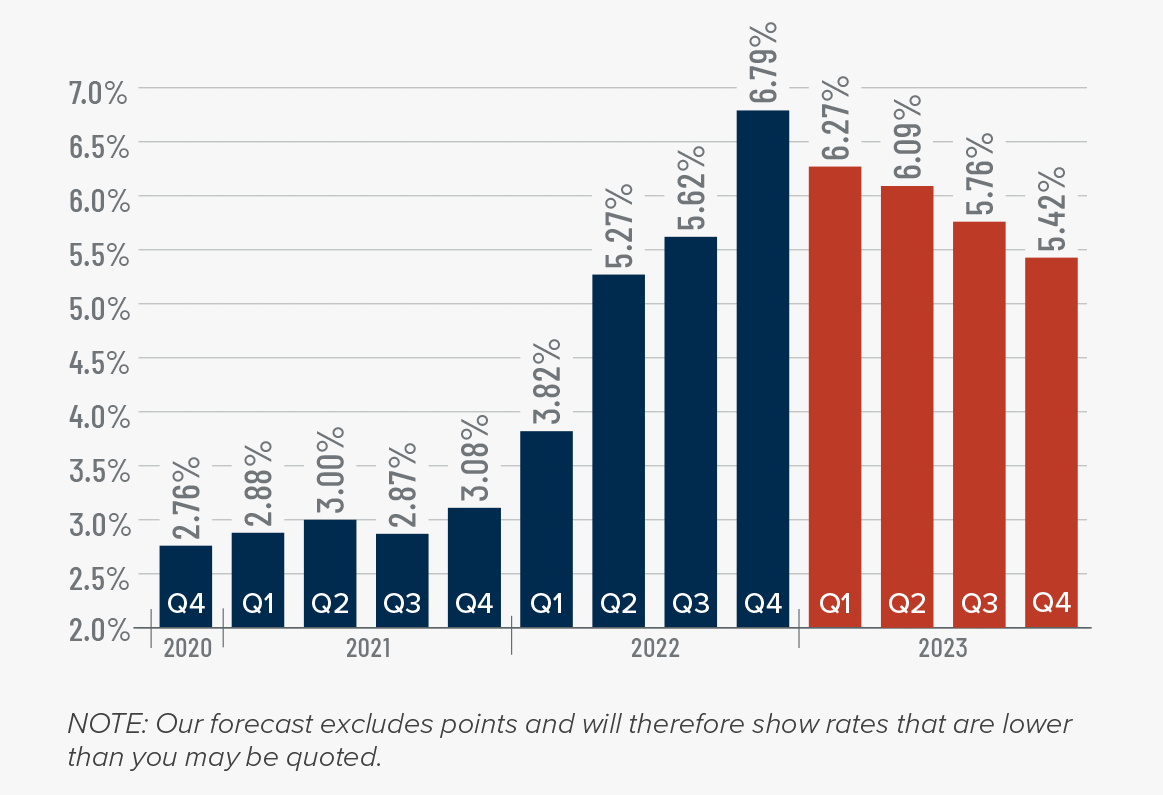
Rates rose dramatically in 2022, but I believe that they have now peaked. Mortgage rates are primarily based on the prices and yields of bonds, and while bonds take cues from several places, they are always impacted by inflation and the economy at large. If inflation continues to fall, as I expect it will, rates will continue to drop.
My current forecast is that mortgage rates will trend lower as we move through the year. While this may be good news for home buyers, rates will still be higher than they have become accustomed to. Even as the cost of borrowing falls, home prices in expensive markets will probably fall a bit more to compensate for rates that will likely hold above 6% until early summer.
Eastern Washington Days on Market
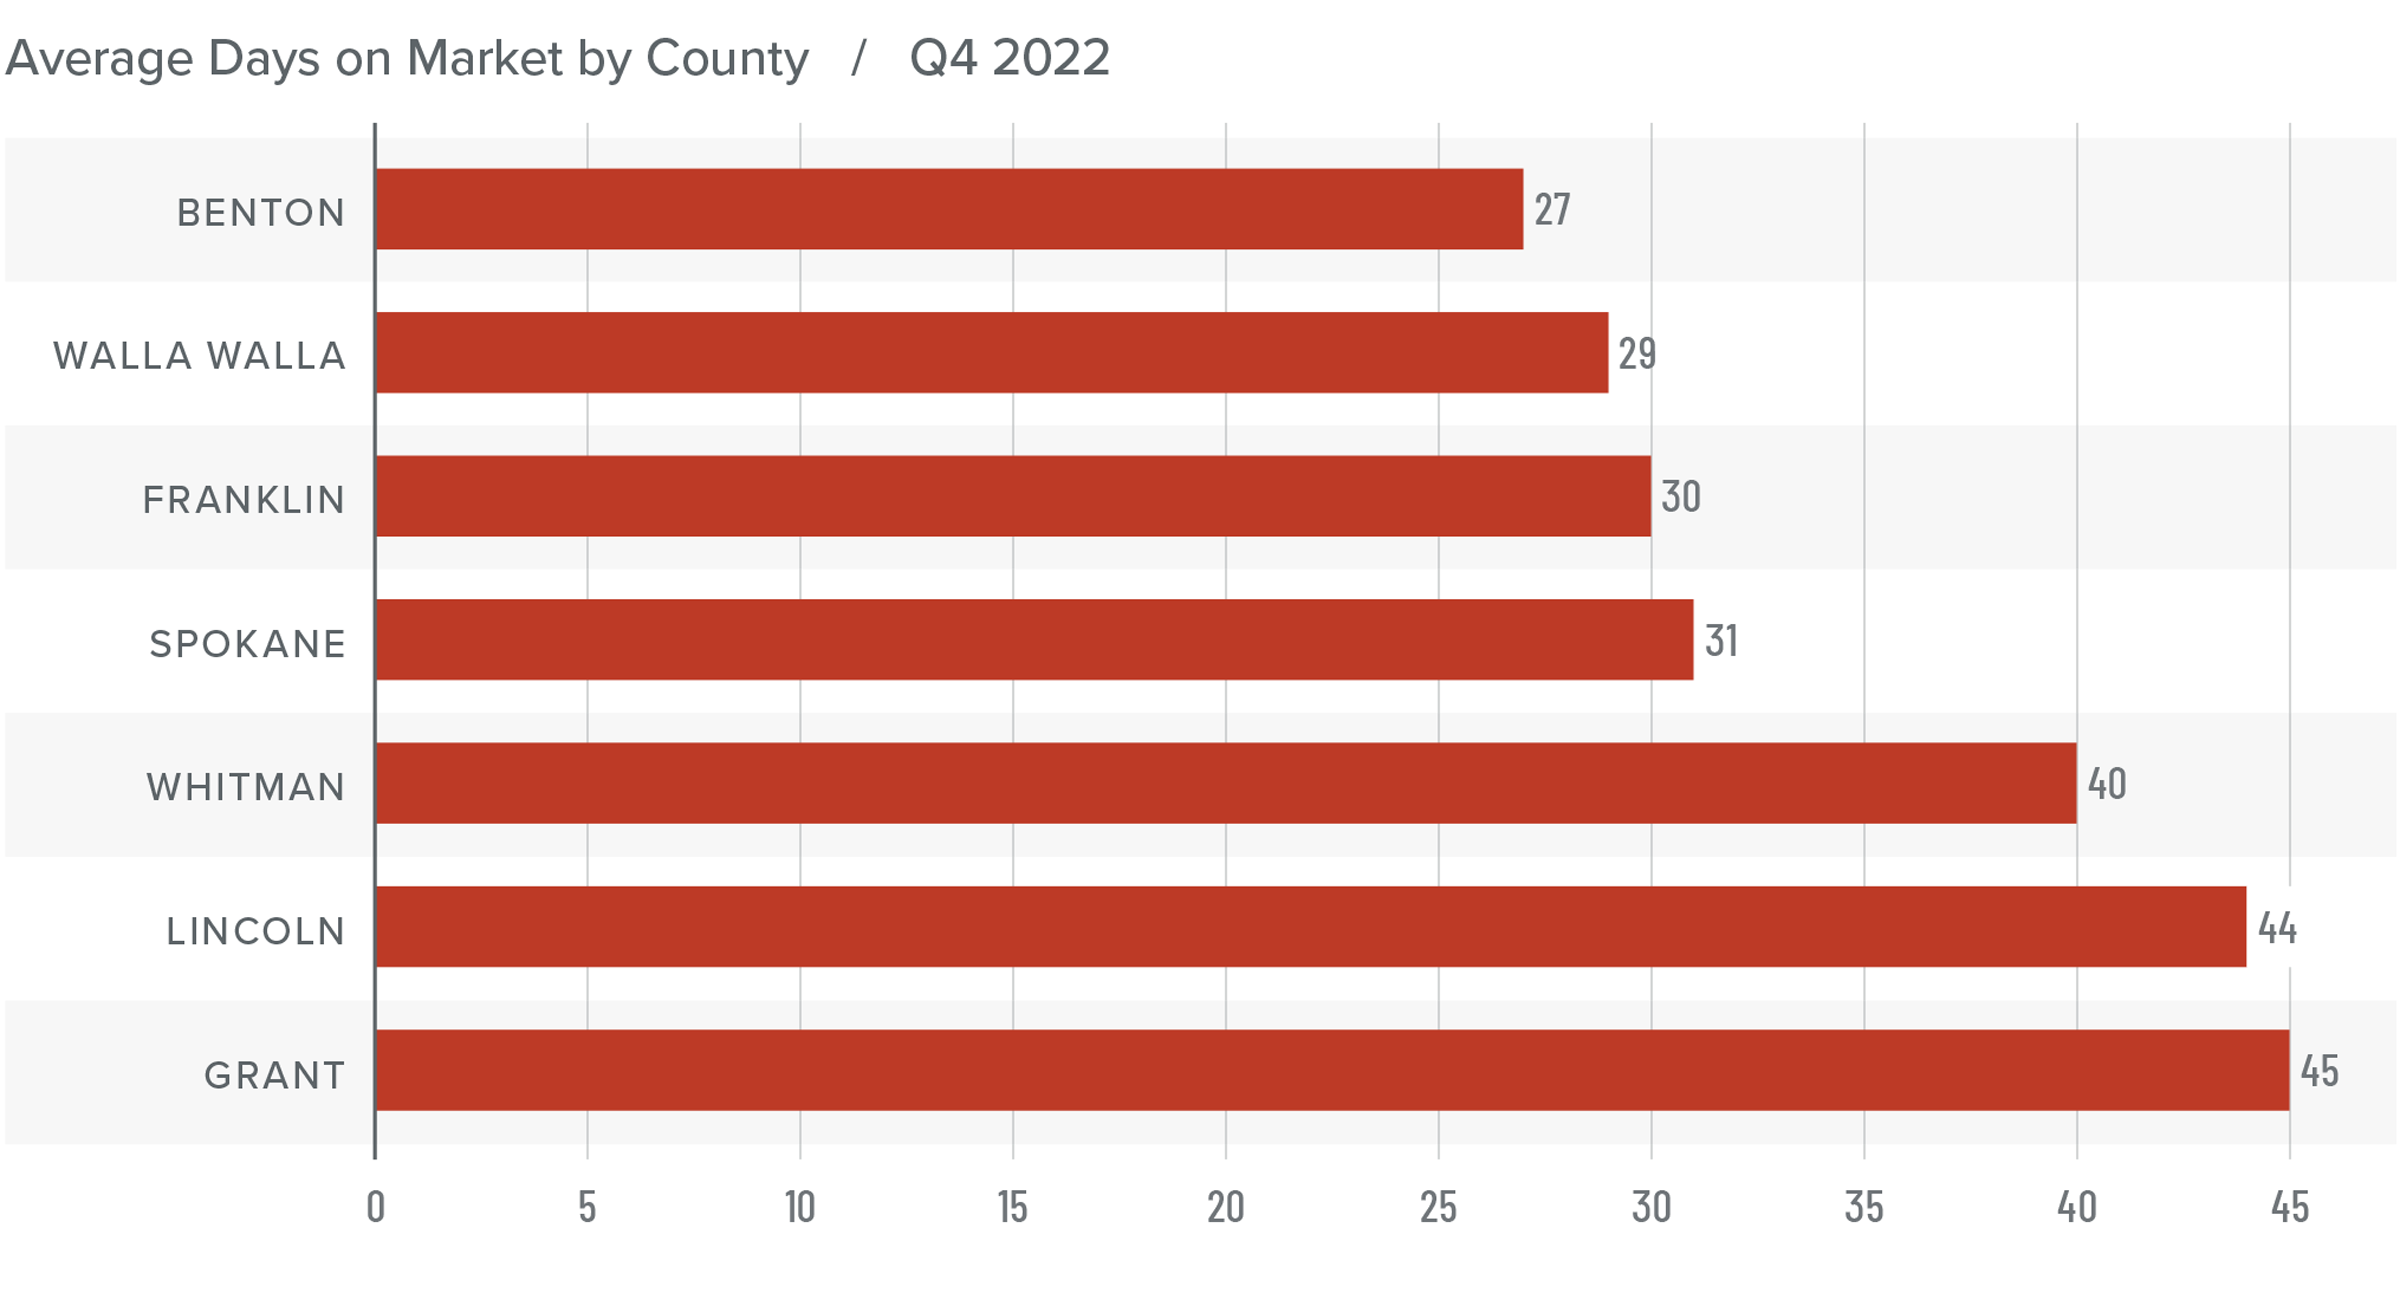
❱ The average time it took to sell a home in Eastern Washington in the final quarter of 2022 was 35 days, which was 11 more days than the same period the previous year.
❱ Compared to the third quarter of 2022, average days on market in the region rose 11 days.
❱ All counties except Lincoln saw the average number of days it took for a house to sell rise compared to the same period the year prior.
❱ Higher financing costs and economic uncertainty have led market time to rise, but it’s possible that buyers are waiting for both mortgage rates and prices to fall further before starting their home search.
Conclusions
This speedometer reflects the state of the region’s real estate market using housing inventory, price gains, home sales, interest rates, and larger economic factors.
I suggested in the last Gardner Report that higher financing costs were starting to act as a significant headwind in the market, and I stand by this statement. That said, seasonality always skews the numbers, so I will see how the spring market performs before I consider the region to be firmly in the hands of home buyers.

I expect prices will fall a little further before stabilizing and then starting to rise again at a significantly slower pace. Because the current market favors neither buyers nor sellers, I have moved the needle to the center.
About Matthew Gardner
As Chief Economist for Windermere Real Estate, Matthew Gardner is responsible for analyzing and interpreting economic data and its impact on the real estate market on both a local and national level. Matthew has over 30 years of professional experience both in the U.S. and U.K.
In addition to his day-to-day responsibilities, Matthew sits on the Washington State Governors Council of Economic Advisors; chairs the Board of Trustees at the Washington Center for Real Estate Research at the University of Washington; and is an Advisory Board Member at the Runstad Center for Real Estate Studies at the University of Washington where he also lectures in real estate economics.
Q3 2022 Eastern Washington Real Estate Market Update

The following analysis of select counties of the Eastern Washington real estate market is provided by Windermere Real Estate Chief Economist Matthew Gardner. We hope that this information may assist you with making better-informed real estate decisions. For further information about the housing market in your area, please don’t hesitate to contact your Windermere Real Estate agent.
Regional Economic Overview
Year over year, total employment in Eastern Washington rose by just under 10,000 jobs, which is an annual growth rate of 2.1%. Benton County had the fastest pace of job growth at 3.8%. Also notable were Spokane and Franklin counties, where job growth rose 2.9%. Annually, employment shrank in Whitman and Lincoln counties. Unadjusted for seasonality, the regional unemployment rate was 4.6%; the seasonally adjusted rate was 5%. The highest jobless rate was in Franklin County at 5.3%. The lowest rate was in Walla Walla County at 4%.
Eastern Washington Home Sales
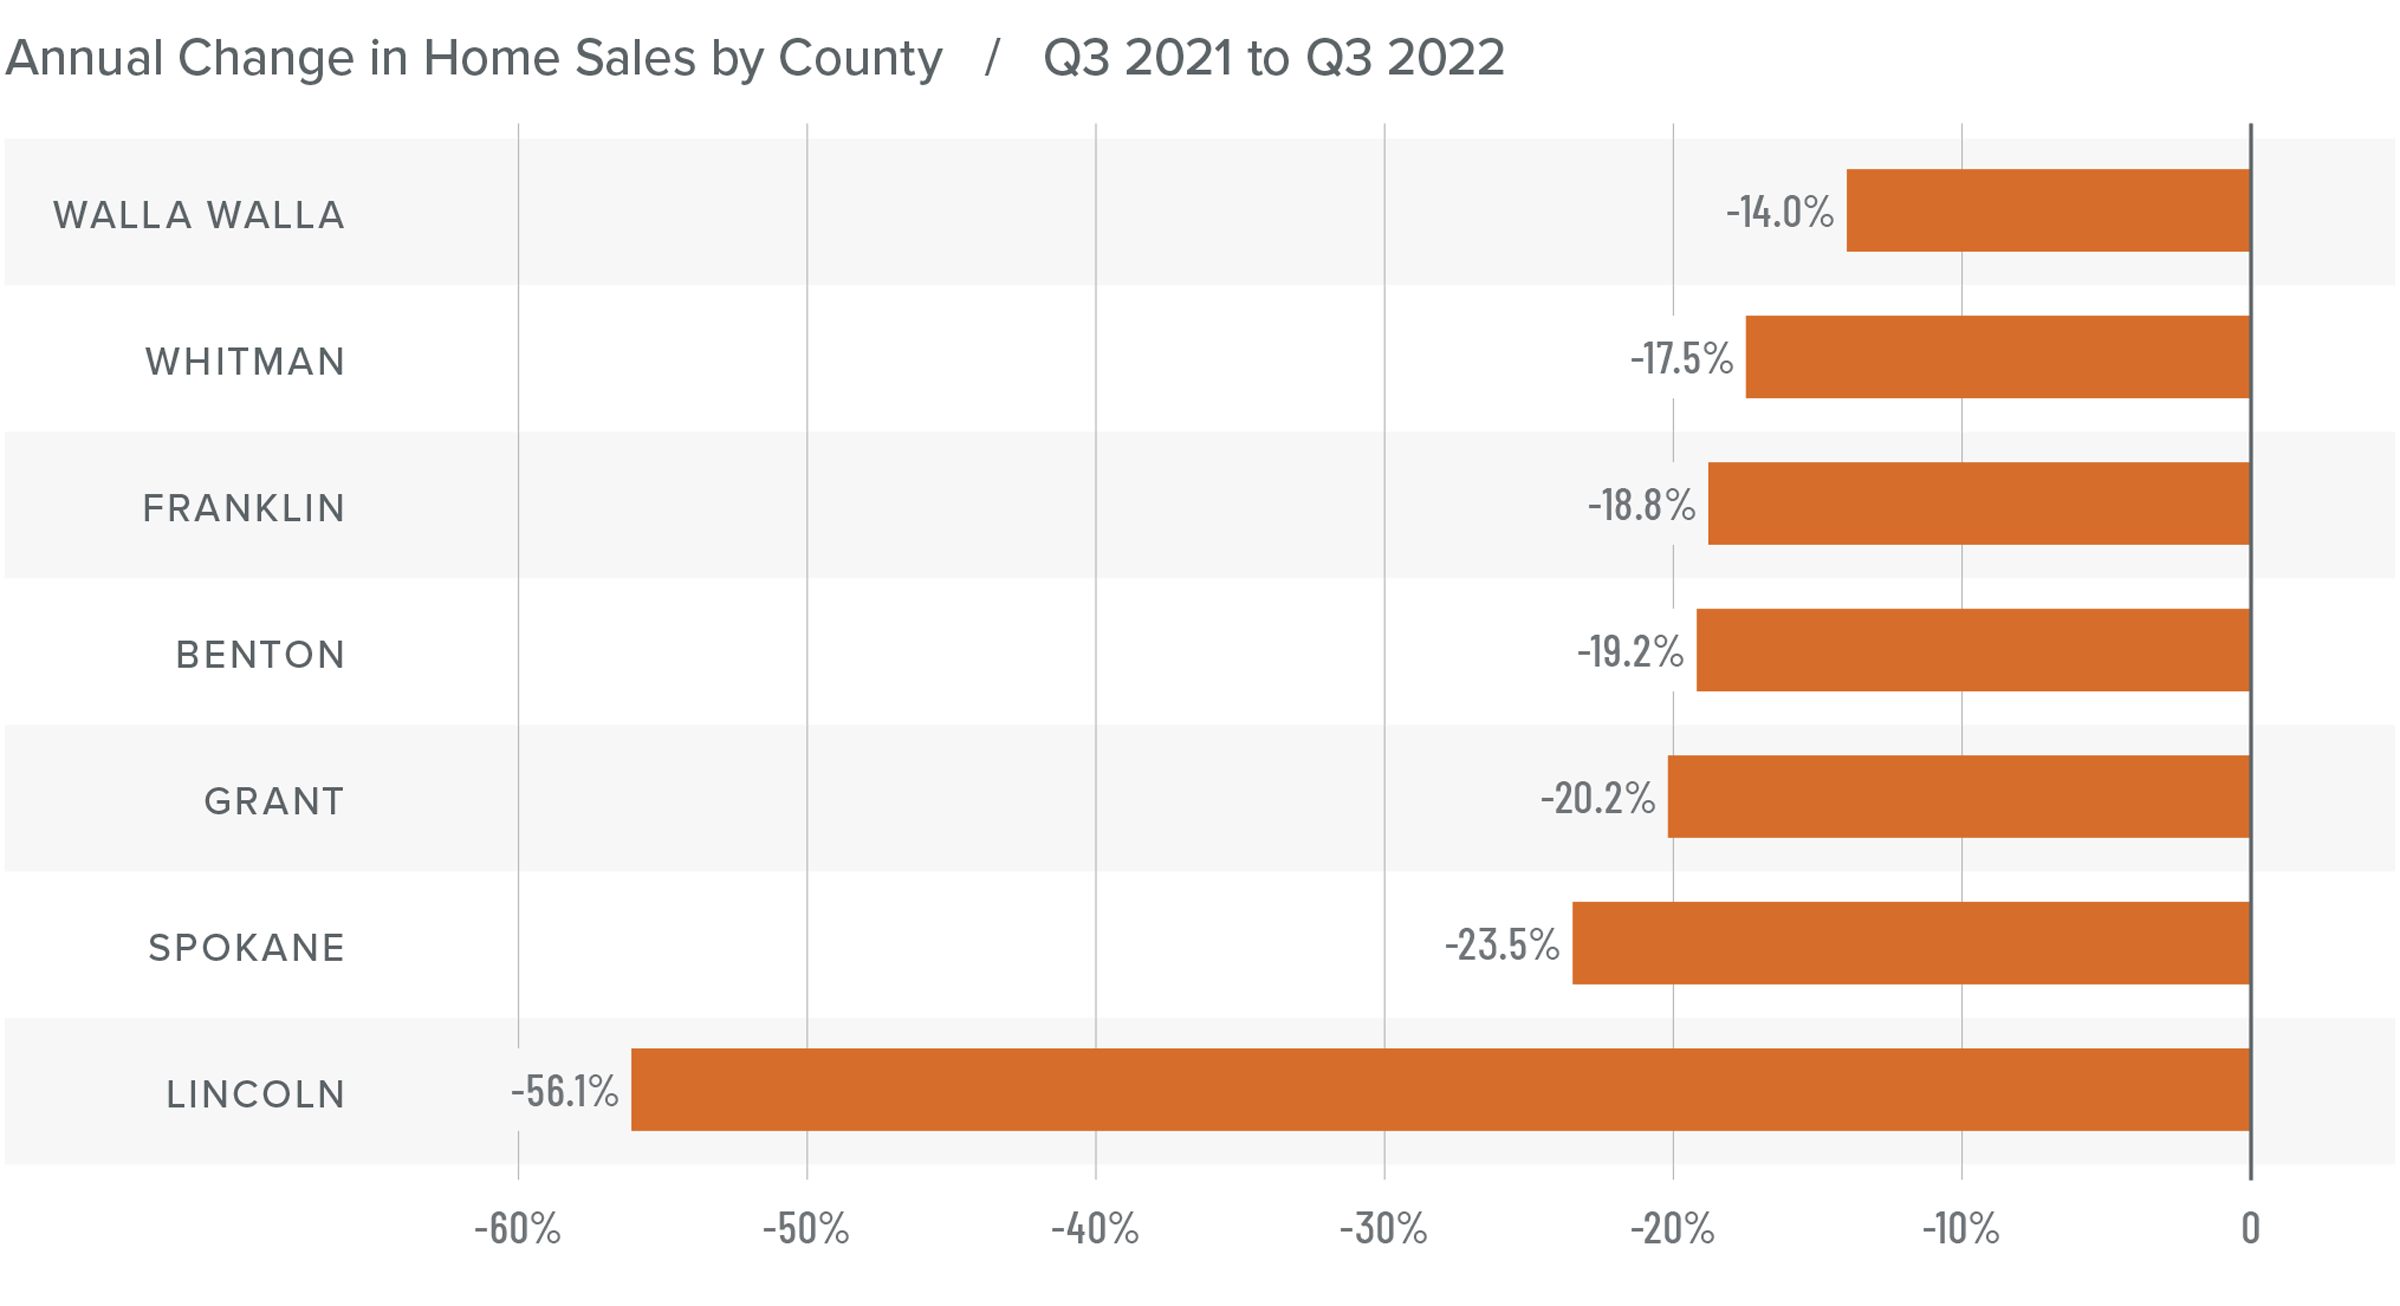
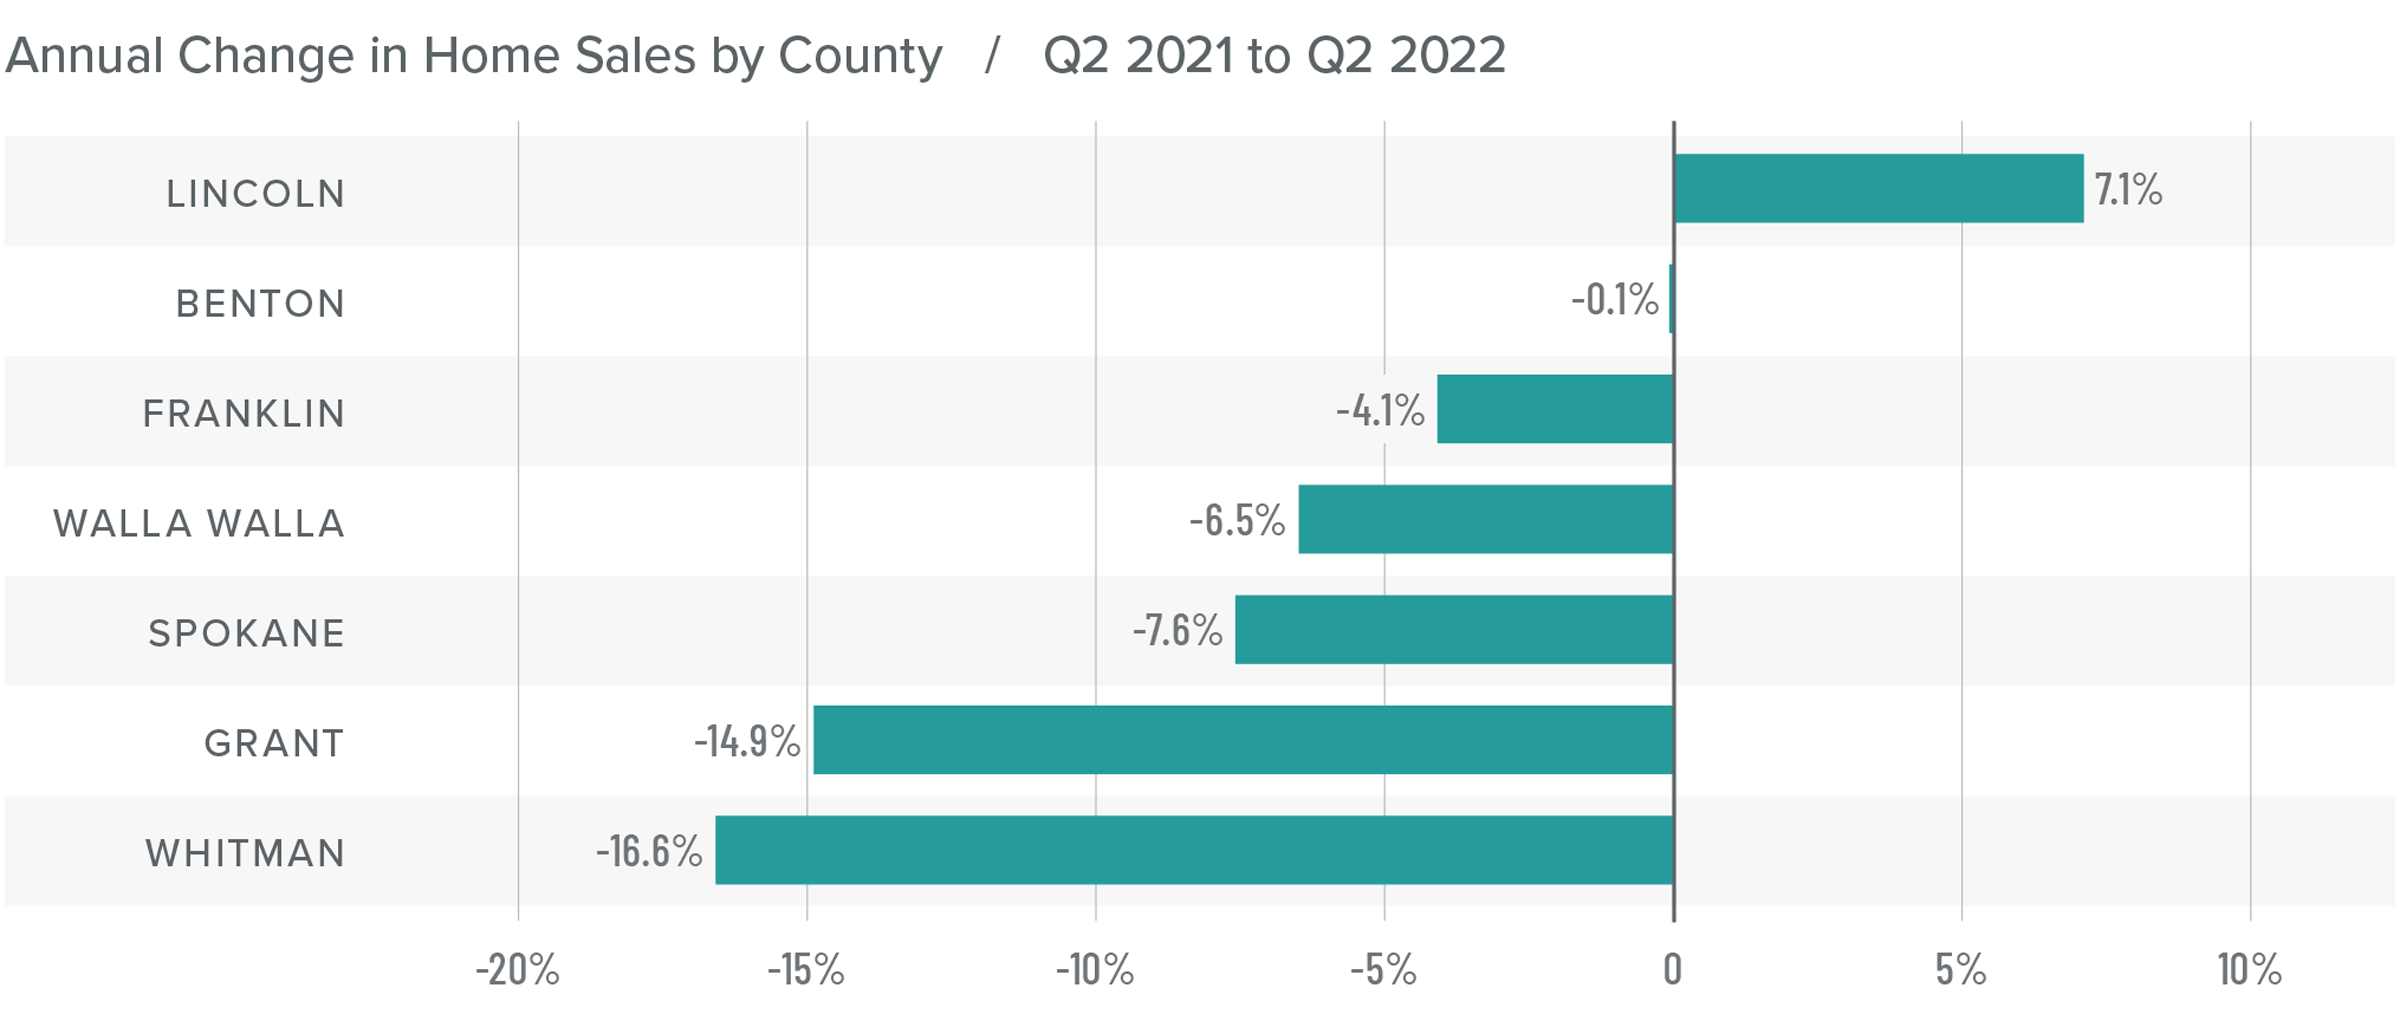
❱ During third quarter, 3,305 homes sold, which was 21.8% lower than a year ago. Transactions fell 4.6% compared to the second quarter of this year.
❱ Listing activity rose 97.2% compared to a year ago and was 74.9% higher than in the second quarter.
❱ Year over year, sales fell across the region. Additionally, sales fell in all the markets covered by this report compared to the second quarter of 2022.
❱ Even with more choice in the market, pending sales fell more than 14%, suggesting that significantly higher mortgage rates are now having an impact on the market.
Eastern Washington Home Prices
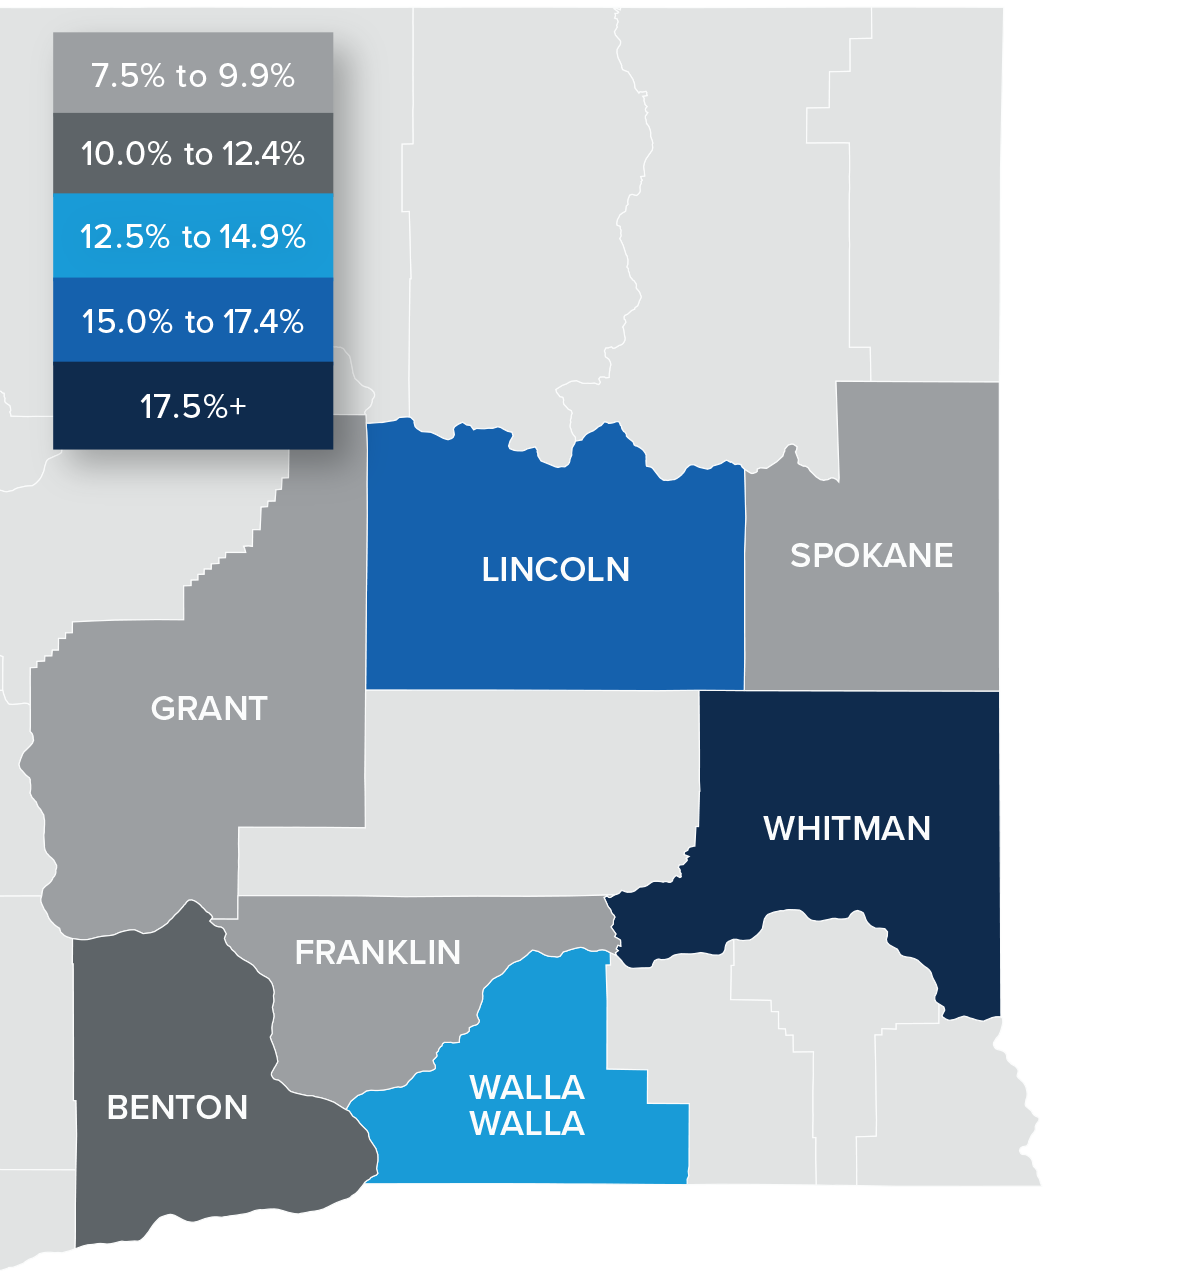
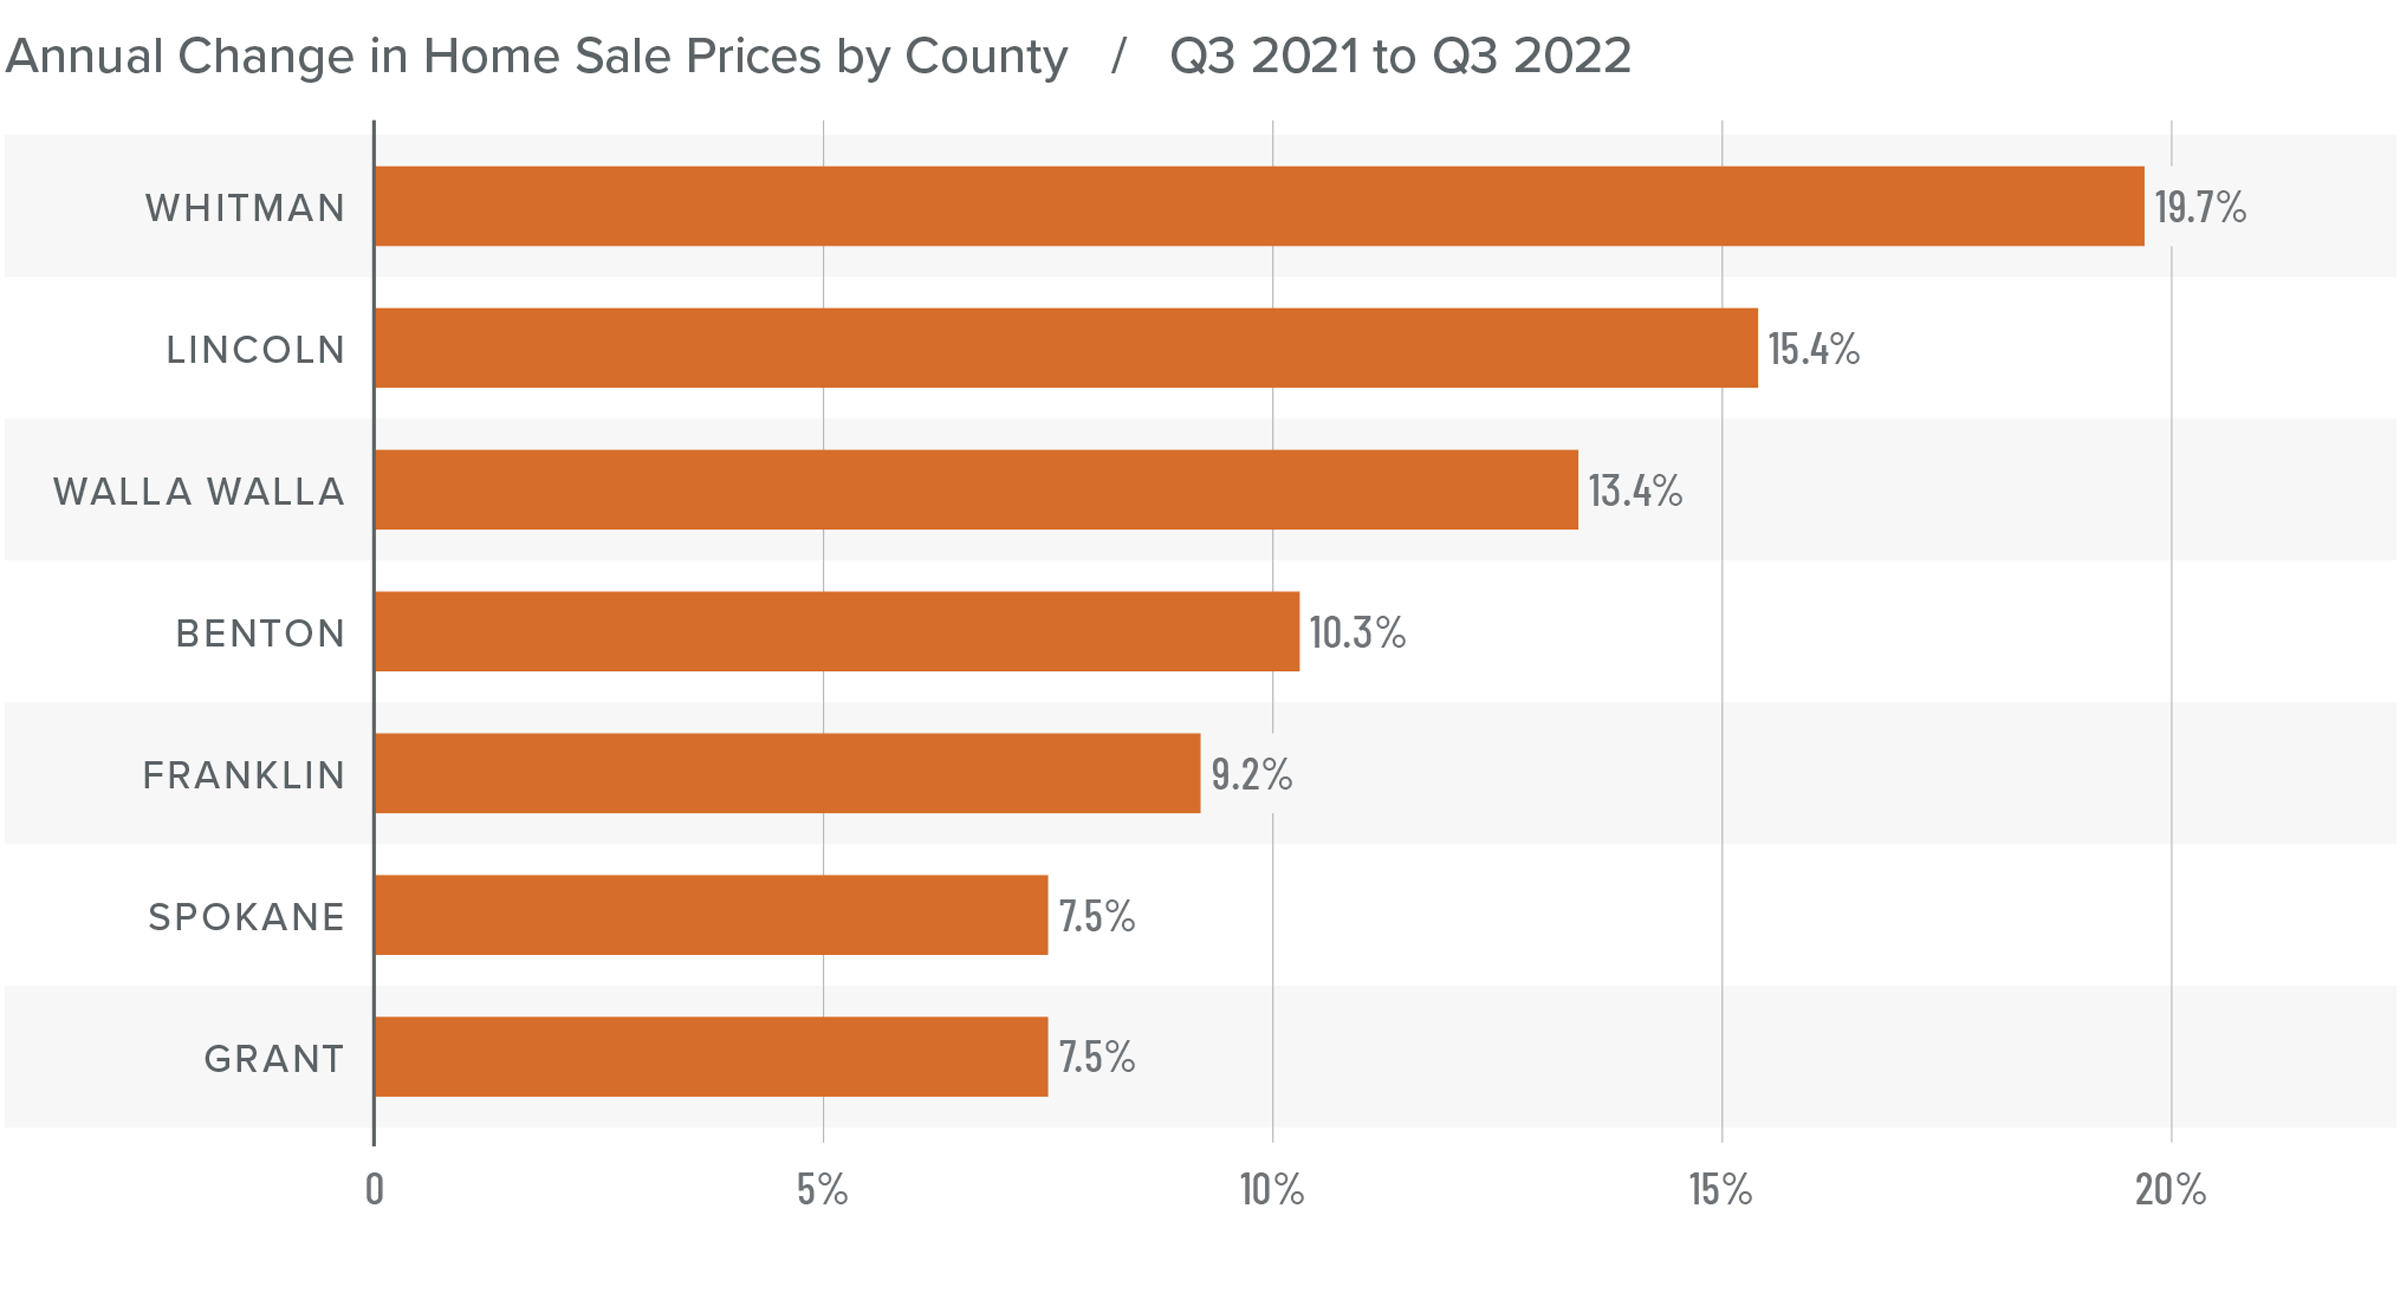
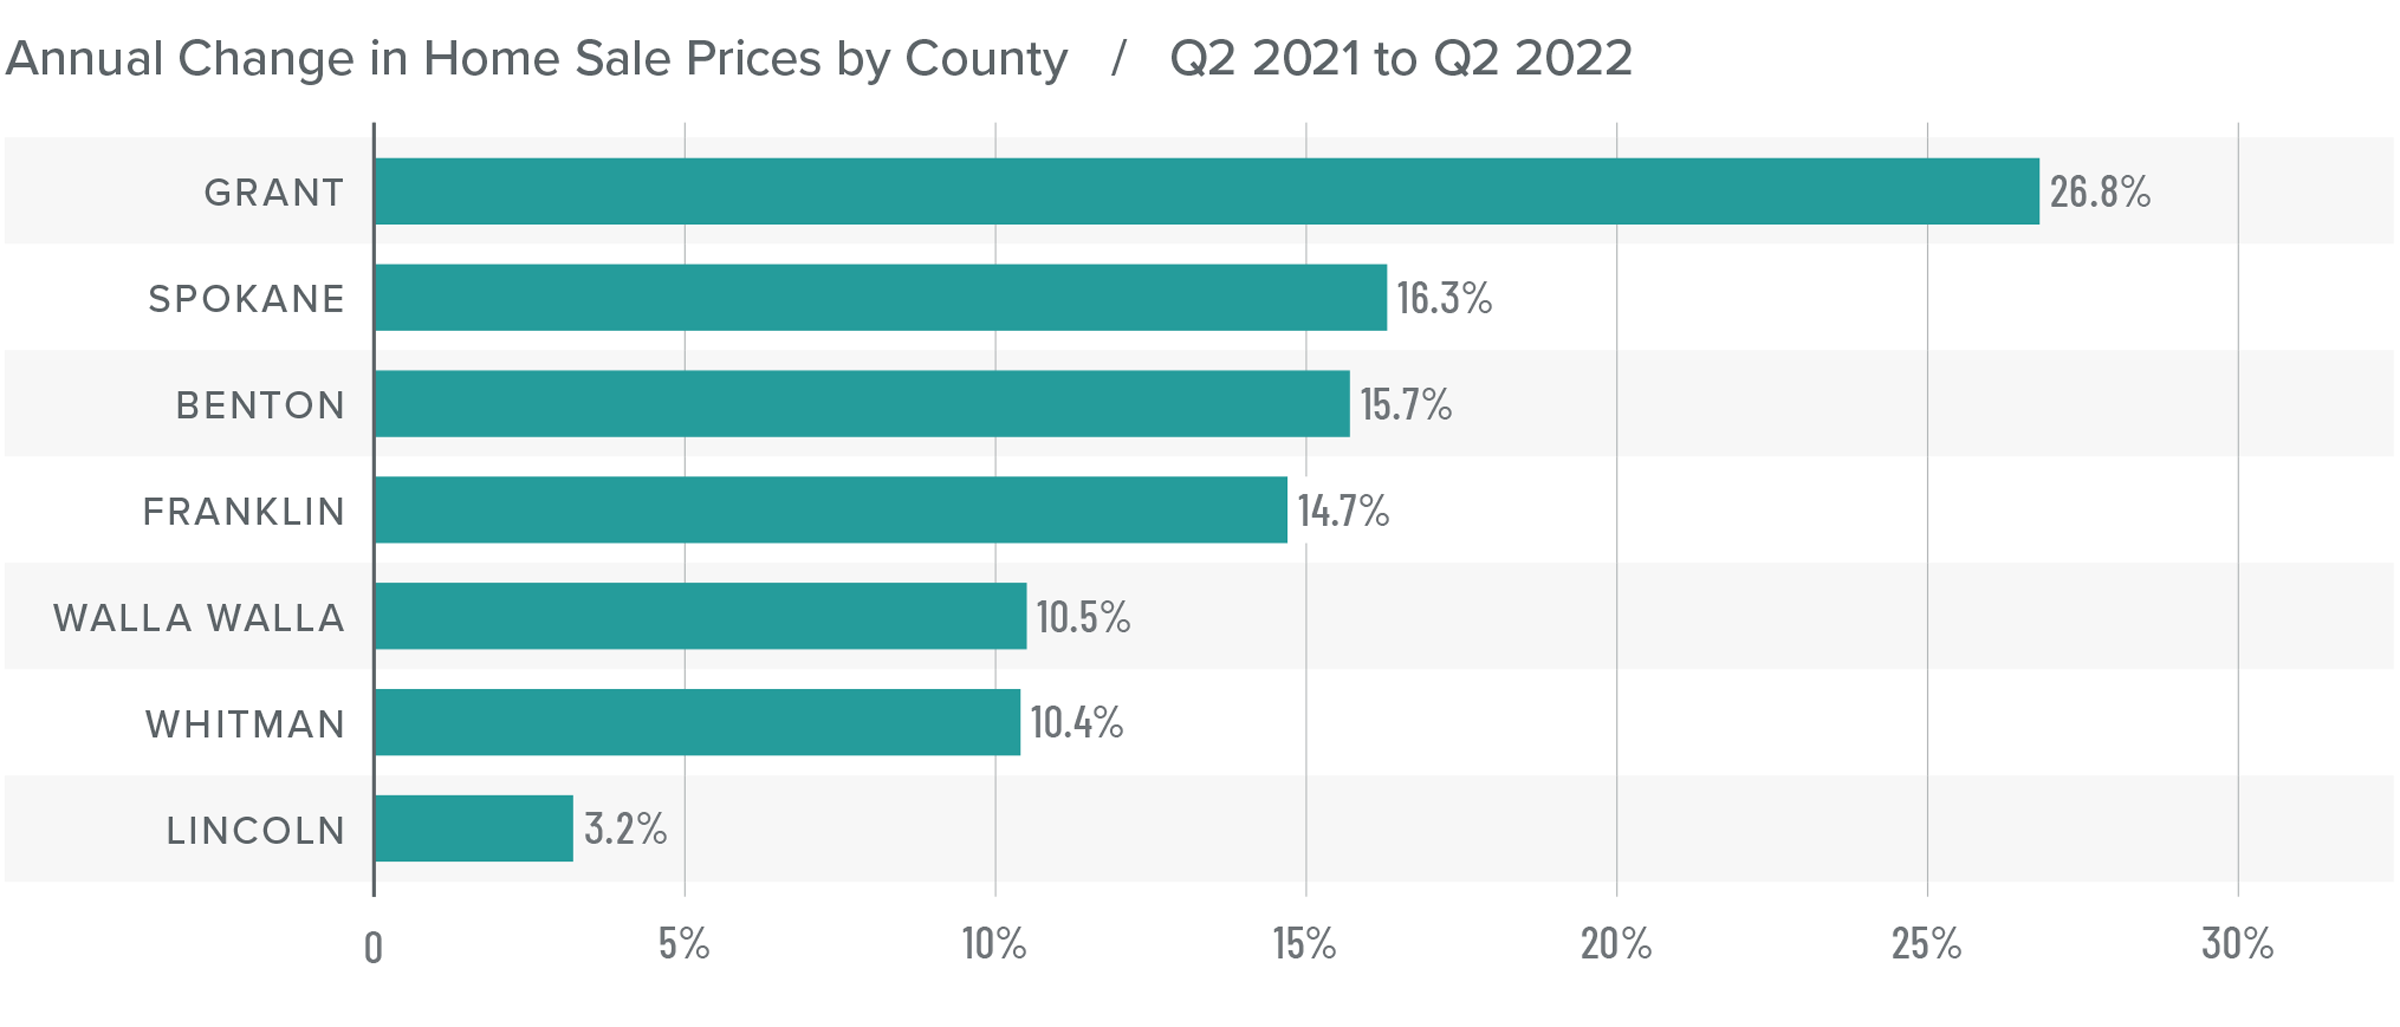
❱ Year over year, the average home price in Eastern Washington rose 8.8% to $463,324, but average prices were down 2.7% compared to the second quarter.
❱ Compared to the second quarter of 2022, prices fell in all counties except Benton, Lincoln, and Whitman.
❱ Every county saw average sale prices increase year over year, with significant gains in Whitman, Lincoln, Walla Walla, and Benton counties.
❱ Significantly higher mortgage rates are starting to impact the market, which has led median list prices to drop in Spokane, Franklin, Whitman, and Grant counties compared to the previous quarter.
Mortgage Rates
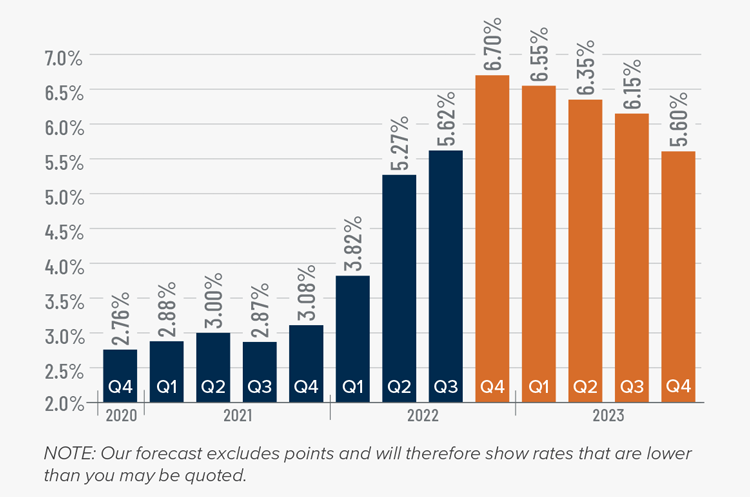
This remains an uncertain period for mortgage rates. When the Federal Reserve slowed bond purchases in 2013, investors were accused of having a “taper tantrum,” and we are seeing a similar reaction today. The Fed appears to be content to watch the housing market go through a period of pain as they throw all their tools at reducing inflation.
As a result, mortgage rates are out of sync with treasury yields, which not only continues to push rates much higher, but also creates violent swings in both directions. My current forecast calls for rates to peak in the fourth quarter of this year before starting to slowly pull back. That said, they will remain in the 6% range until the end of 2023.
Eastern Washington Days on Market
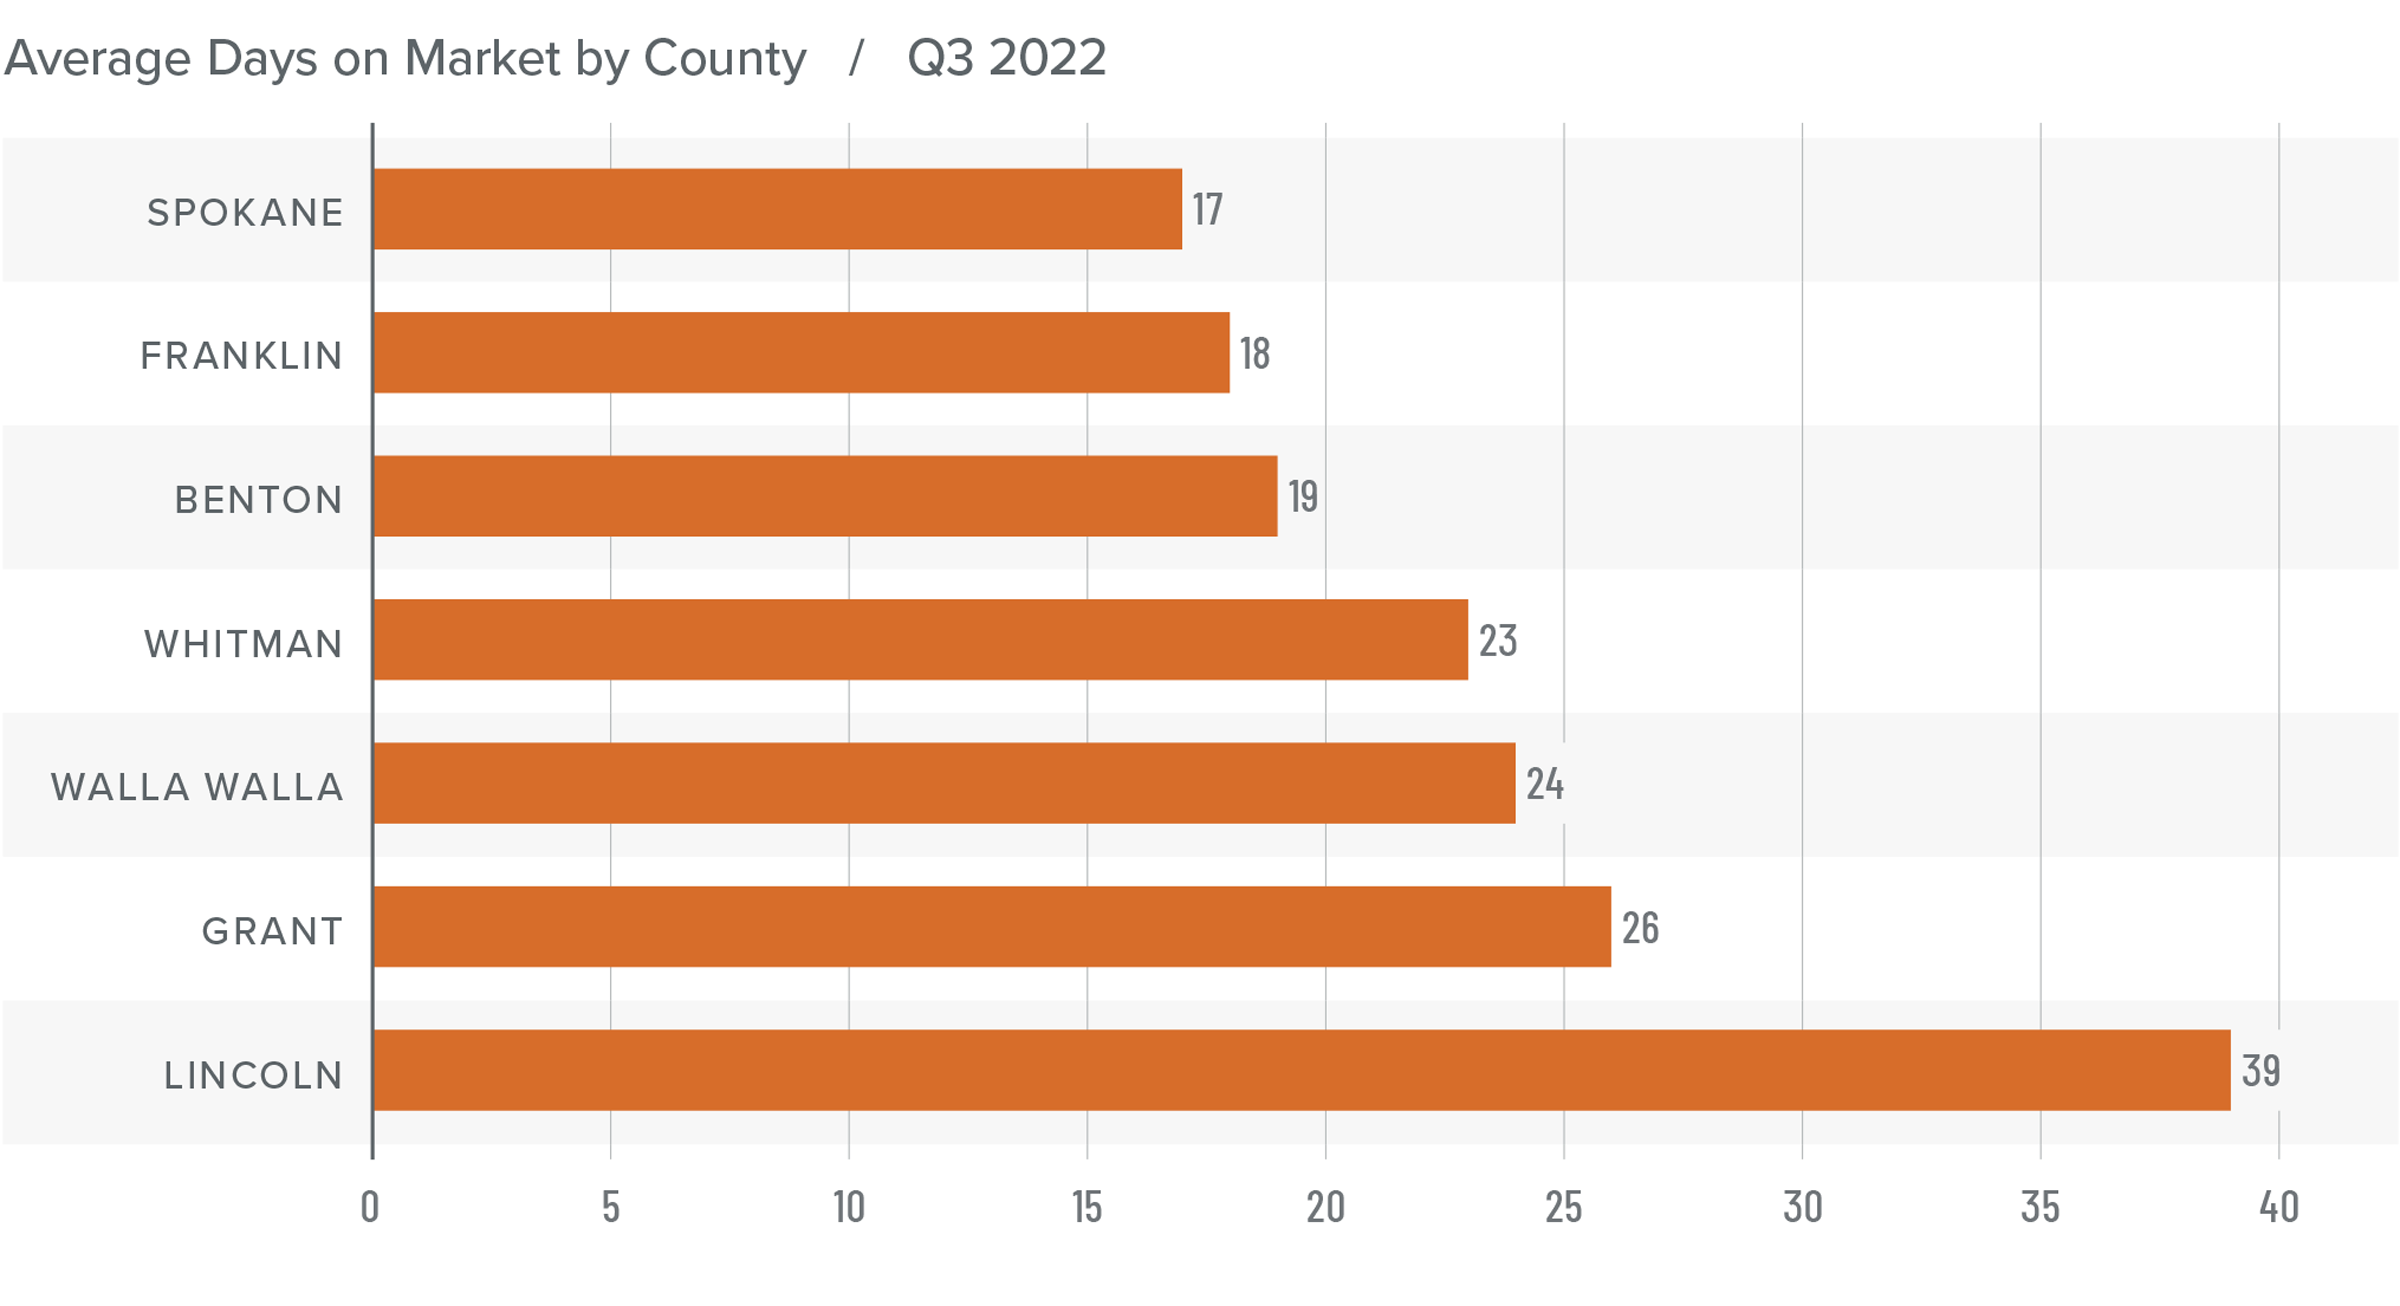
❱ The average time it took to sell a home in Eastern Washington in the third quarter of 2022 was 24 days, which is 9 more days than during the same period a year ago.
❱ Compared to the second quarter of this year, average days on market rose in every county. The regional average rose by 6 days to 24.
❱ All counties saw the average number of days it took for a house to sell rise compared to the third quarter of 2021.
❱ Longer market time can be attributed to more inventory combined with higher financing costs, which have led some buyers to wait for mortgage rates to stabilize and/or for prices to drop further.
Conclusions
This speedometer reflects the state of the region’s real estate market using housing inventory, price gains, home sales, interest rates, and larger economic factors.
Regionally speaking, the job market continues to expand, which should be a benefit for the housing market. However, with mortgage rates rising more than 2.7% from a year ago, many buyers are now being priced out of the market. The third quarter was an inflection point in which higher financing costs are now acting as a significant headwind. I anticipate that the market will struggle until rates stabilize. Even then, affordability will remain a factor. Ultimately, prices are expected to pull back to account for higher mortgage rates, but I don’t believe there will be any systemic price correction. Rather it will be a reversion that will allow the market to move to a more sustainable pace of price growth.

As such, I have decided to move the needle more in favor of home buyers as the region heads toward a more balanced market—one we have not seen in quite some time.
About Matthew Gardner
As Chief Economist for Windermere Real Estate, Matthew Gardner is responsible for analyzing and interpreting economic data and its impact on the real estate market on both a local and national level. Matthew has over 30 years of professional experience both in the U.S. and U.K.
In addition to his day-to-day responsibilities, Matthew sits on the Washington State Governors Council of Economic Advisors; chairs the Board of Trustees at the Washington Center for Real Estate Research at the University of Washington; and is an Advisory Board Member at the Runstad Center for Real Estate Studies at the University of Washington where he also lectures in real estate economics.
Q2 2022 Eastern Washington Real Estate Market Update

The following analysis of select counties of the Eastern Washington real estate market is provided by Windermere Real Estate Chief Economist Matthew Gardner. We hope that this information may assist you with making better-informed real estate decisions. For further information about the housing market in your area, please don’t hesitate to contact your Windermere Real Estate agent.
Regional Economic Overview
Year over year, total employment in Eastern Washington rose by more than 17,000 jobs, representing an annual growth rate of 3.5%. Spokane County saw the fastest pace of job growth, rising by 4.7%. All other counties except Lincoln added jobs over the past 12 months. Whitman and Lincoln counties are still marginally below their pre-pandemic employment levels. Unadjusted for seasonality, the regional unemployment rate was 4.4%; the seasonally adjusted rate was 4.6%. The highest jobless rate was in Franklin County at 6.2% and the lowest rate was in Whitman County at 4.1%.
Eastern Washington Home Sales
❱ During second quarter, 3,464 homes sold, which was 6.9% lower than a year ago but more than 47% higher than the first quarter of 2022.
❱ Sales growth this spring came as listing activity jumped. The average number of homes on the market was 131% higher than in the first quarter.
❱ Year over year, sales increased in Lincoln County but fell across the balance of the region. However, compared to the first quarter, sales rose significantly across the board.
❱ Higher inventory levels also allowed pending sales to rise by more than 34% from the first quarter. The spring market was clearly a good one, even as mortgage rates rose.
Eastern Washington Home Prices
❱ The average home price in Eastern Washington rose 16.3% from last year to $475,985. Average prices were 9.4% higher than in the first quarter.
❱ Compared to the first quarter of 2022, prices rose in all counties except Benton, where they were down a modest .8%.
❱ Every county other than Lincoln saw average prices rise by more than 10% compared to the same time last year. Grant County prices rose a very impressive 26.8%.
❱ I have started tracking list prices, as they are a leading indicator of the direction of the housing market. Thus far, rising mortgage rates and growing inventory levels have yet to dampen seller confidence, with median list prices up an average of 9.9% from the first quarter.
Mortgage Rates
Although mortgage rates did drop in June, the quarterly trend was still moving higher. Inflation—the bane of bonds and, therefore, mortgage rates—has yet to slow, which is putting upward pressure on financing costs.
That said, there are some signs that inflation is starting to soften and if this starts to show in upcoming Consumer Price Index numbers then rates will likely find a ceiling. I am hopeful this will be the case at some point in the third quarter, which is reflected in my forecast.
Eastern Washington Days on Market
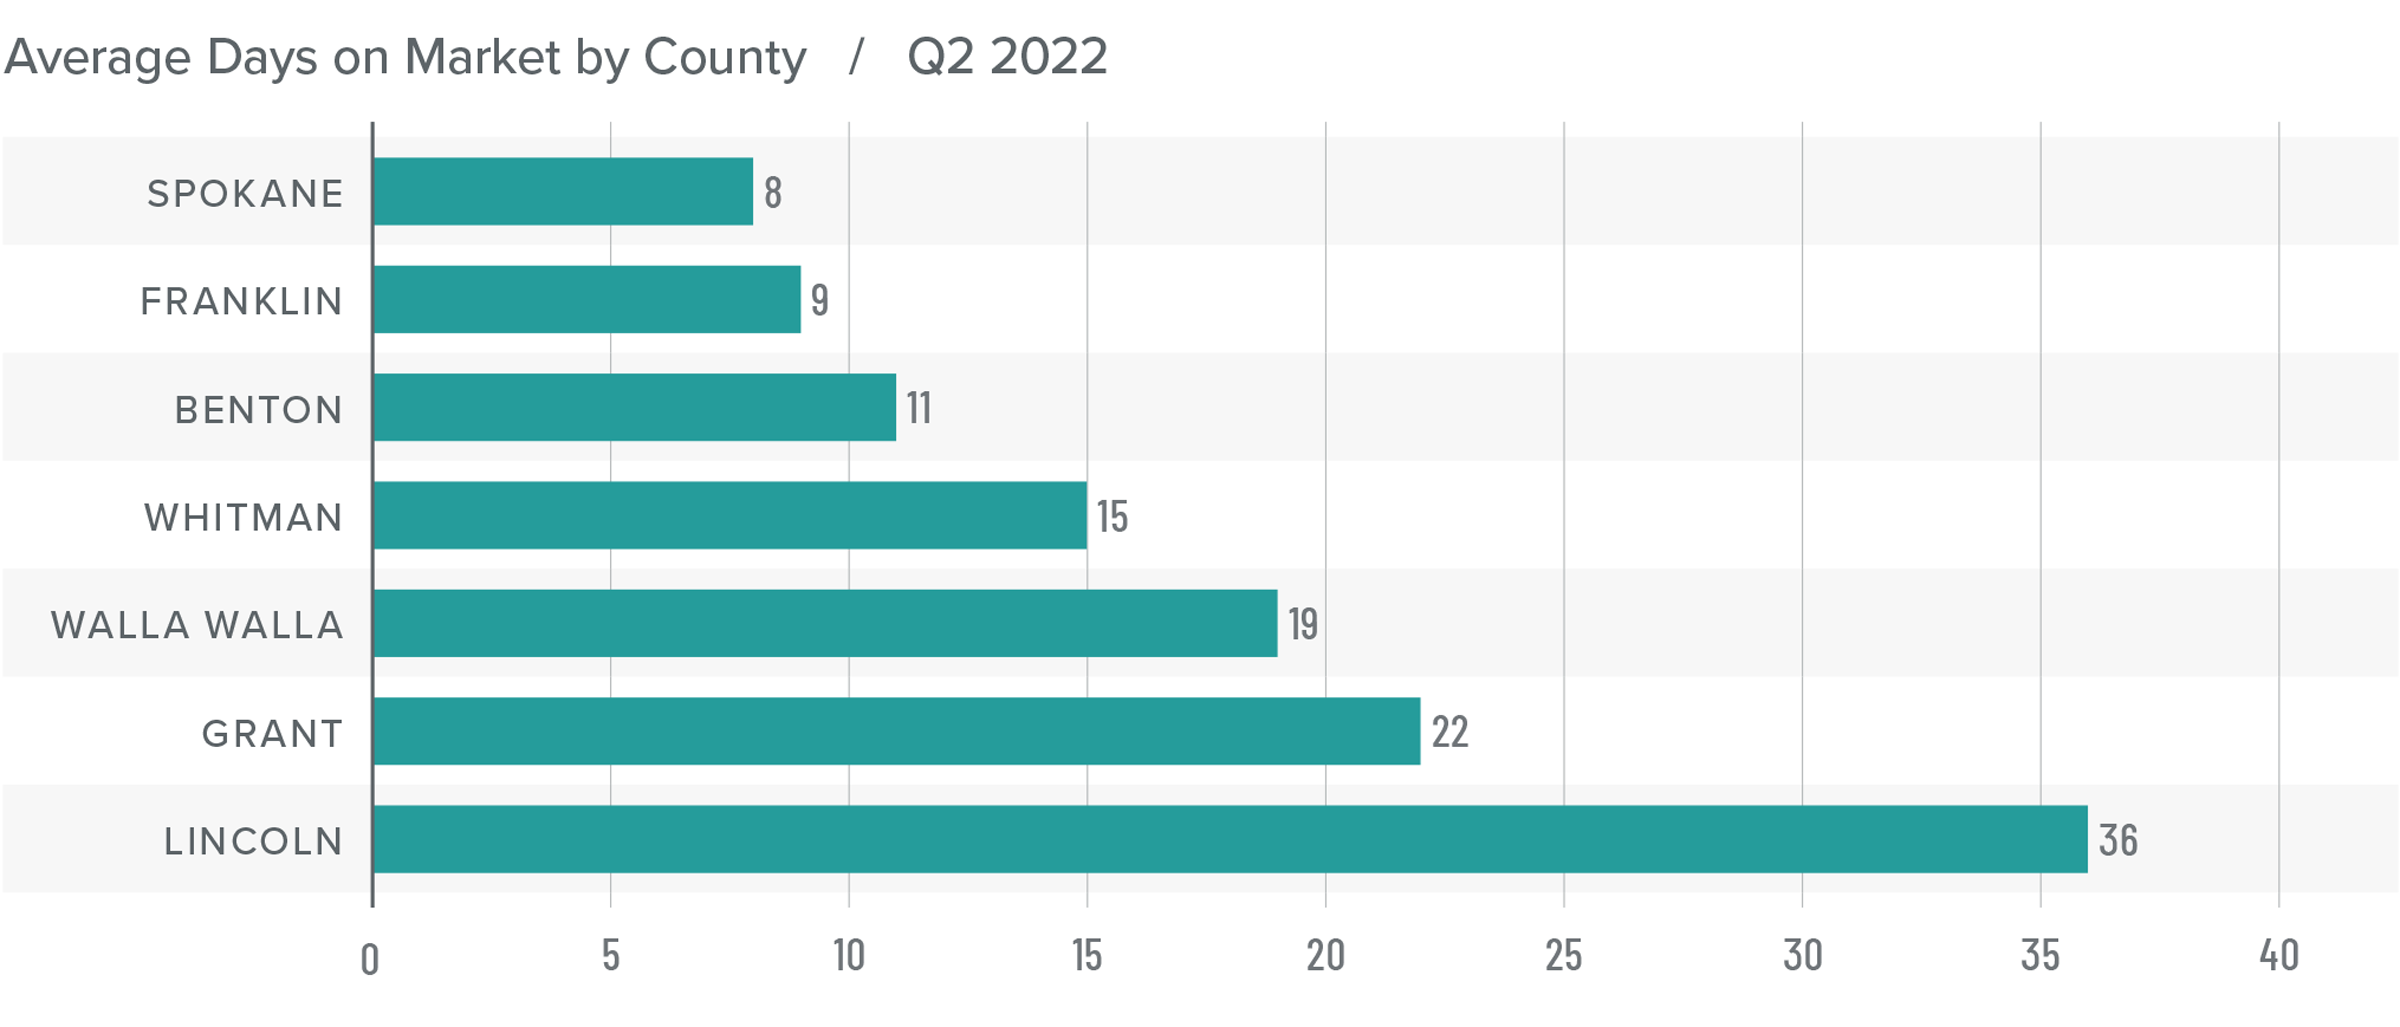
❱ The average time it took to sell a home in Eastern Washington in the second quarter of 2022 was 17 days, which is 3 fewer days than the same period a year ago.
❱ Compared to the first quarter of this year, average days on market fell in every county other than Lincoln, where it took an average of four more days to sell a home.
❱ All counties other than Spokane (where market time was unchanged) saw the average number of days it took for a house to sell drop compared to a year ago.
❱ It took an average of eight fewer days to sell a home in the quarter than it did during the first quarter of 2022.
Conclusions
This speedometer reflects the state of the region’s real estate market using housing inventory, price gains, home sales, interest rates, and larger economic factors.
Employment in Eastern Washington continues to grow, which is a positive for the housing market. Although the number of homes for sale jumped significantly this spring, which typically favors home buyers, home sales and days on market suggest that demand remains strong, and the market is still competitive.

With list prices continuing to rise, sellers are clearly confident even in the face of rising financing costs. Though the pace of price growth has slowed, sellers are still in the driver’s seat. As such, I have moved the needle a little more in the direction of sellers. Until listing price growth shows further slowing, we will not approach a balanced market.
About Matthew Gardner
As Chief Economist for Windermere Real Estate, Matthew Gardner is responsible for analyzing and interpreting economic data and its impact on the real estate market on both a local and national level. Matthew has over 30 years of professional experience both in the U.S. and U.K.
In addition to his day-to-day responsibilities, Matthew sits on the Washington State Governors Council of Economic Advisors; chairs the Board of Trustees at the Washington Center for Real Estate Research at the University of Washington; and is an Advisory Board Member at the Runstad Center for Real Estate Studies at the University of Washington where he also lectures in real estate economics.
Q1 2022 Eastern Washington Real Estate Market Update

The following analysis of select counties of the Eastern Washington real estate market is provided by Windermere Real Estate Chief Economist Matthew Gardner. We hope that this information may assist you with making better-informed real estate decisions. For further information about the housing market in your area, please don’t hesitate to contact your Windermere Real Estate agent.
Regional Economic Overview
Even though Washington State revised the 2021 total employment level downward, the Eastern Washington job market is still in positive territory after its recovery from the pandemic. The region has recovered all of the jobs that were lost and added 13,000 new jobs. The job count in Whitman and Grant counties remains marginally below their pre-COVID peaks, but I expect that to be resolved by this summer. Unadjusted for seasonality, the regional unemployment rate was 5.9%. However, when adjusted for seasonal shifts, the rate was 4.9%. The highest jobless rate was in Grant County at 6.8%; the lowest rate was in Walla Walla County at 3.9%.
Eastern Washington Home Sales
❱ In the first quarter, 2,353 homes sold, which was down 5.7% from the same period in 2021 and 36.6% lower than in the final quarter of last year.
❱ While these numbers don’t appear positive at face value, the drop was due to the lack of homes for sale. Although listing activity was 2.2% higher than the same period in 2021, it was 40% lower than in the final quarter of last year. Limited choice is certainly impacting the market.
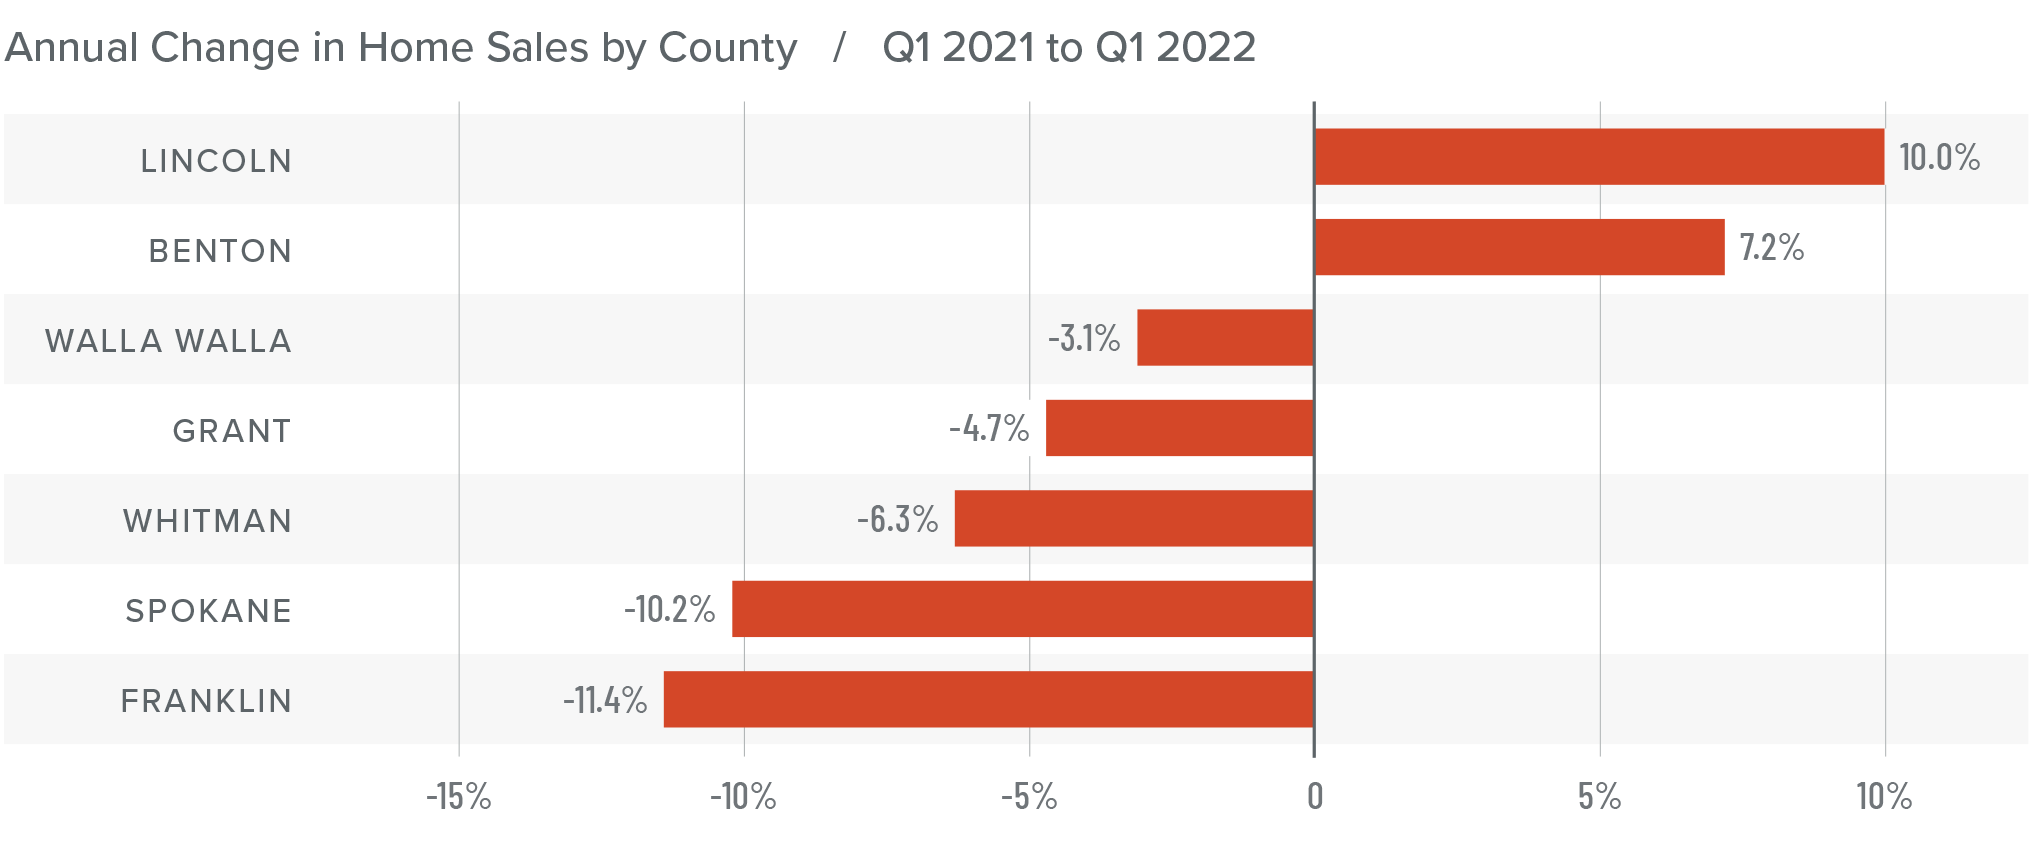
❱ Year over year, sales increased in Benton and Lincoln counties, but fell in the rest of the market areas. Sales fell across the board compared to the fourth quarter.
❱ Pending sales were down 12.6% from the final quarter of last year, suggesting that unless we see a surge in the number of homes coming to market, second quarter numbers may disappoint as well.
Eastern Washington Home Prices
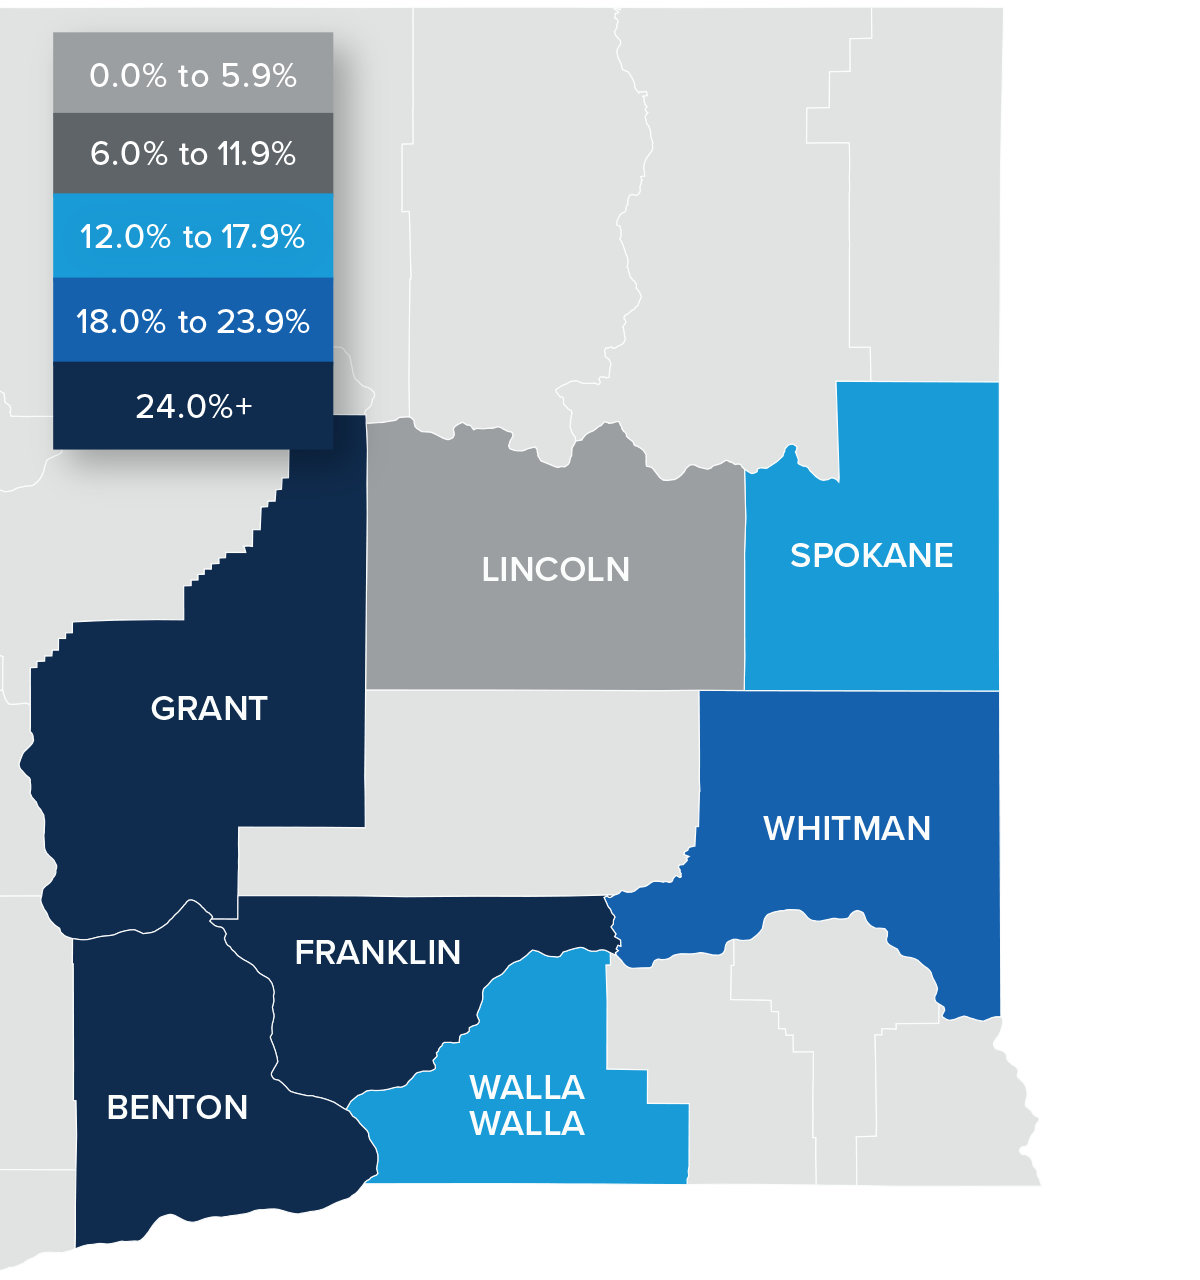
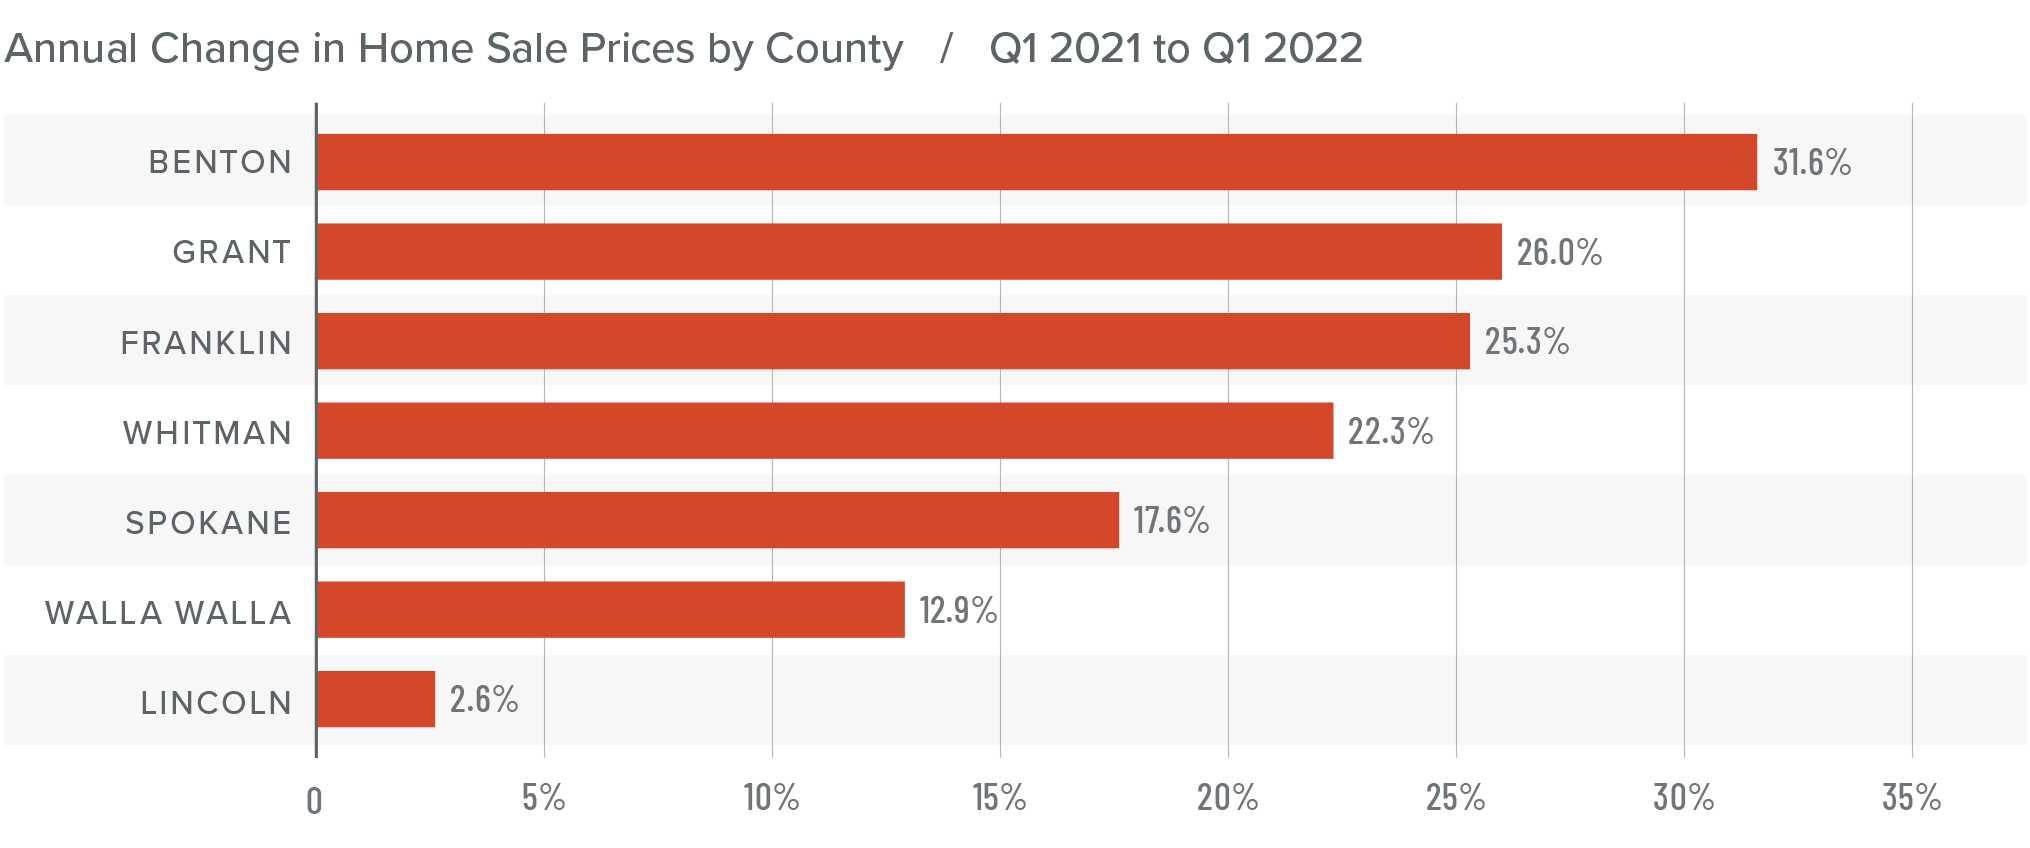
❱ Year over year the average home price in Eastern Washington rose a very significant 21.4% to $434,921 and was 2.6% higher than the previous quarter.
❱ When compared to the final quarter of last year, prices rose in all counties other than Lincoln and Walla Walla.
❱ All counties contained in this report saw average sale prices rise; every county except Lincoln County had double-digit growth.
❱ The market has yet to feel the impact of rising mortgage rates. Inventory issues persist, so it’s likely prices will continue to rise as buyers compete for what homes are available and seek to lock in a loan rate before they rise any further.
Mortgage Rates
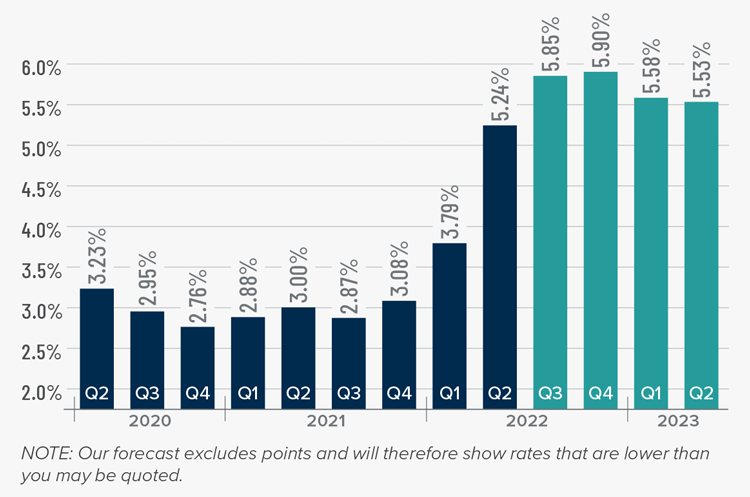
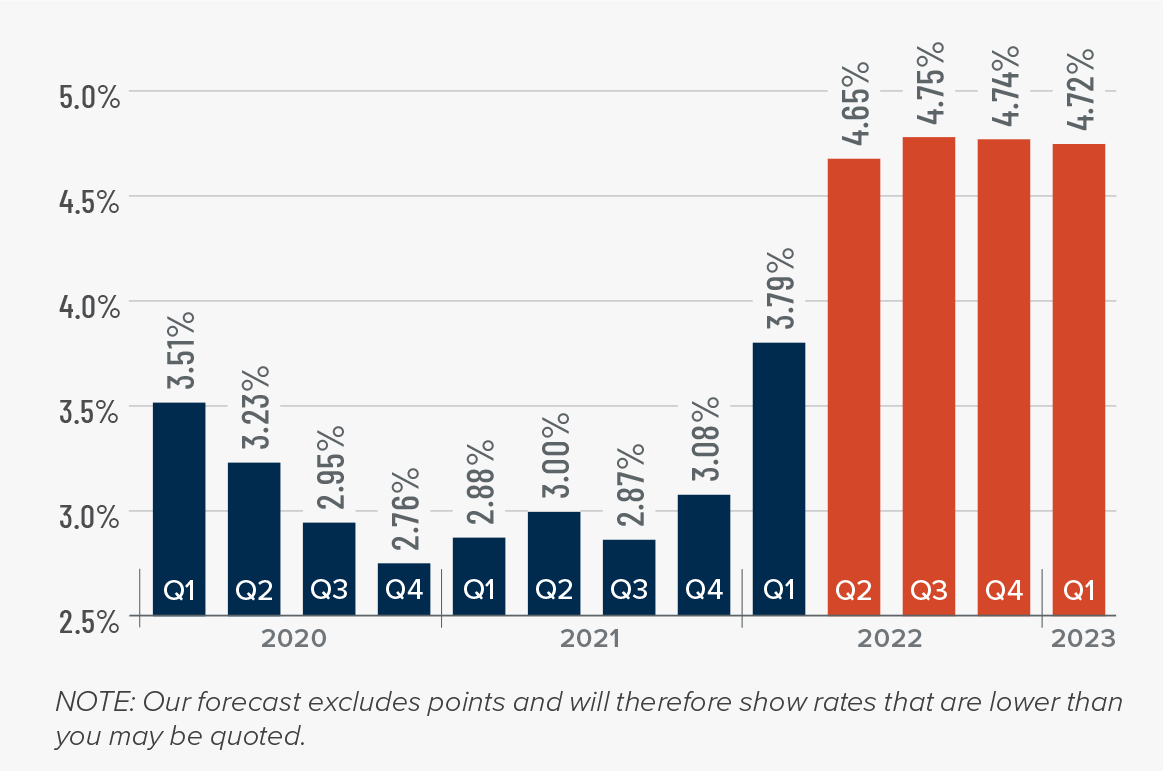
Average rates for a 30-year conforming mortgage were 3.11% at the end of 2021, but since then have jumped over 1.5%—the largest increase since 1987. The speed of the surge in rates is due to the market having quickly priced in the seven-to-eight rate increase that the Fed is expected to implement this year.
Because the mortgage market has priced this into the rates they are offering today, my forecast suggests that we are getting close to a ceiling in rates, and it is my belief that they will rise modestly in the second quarter before stabilizing for the balance of the year.
Eastern Washington Days on Market
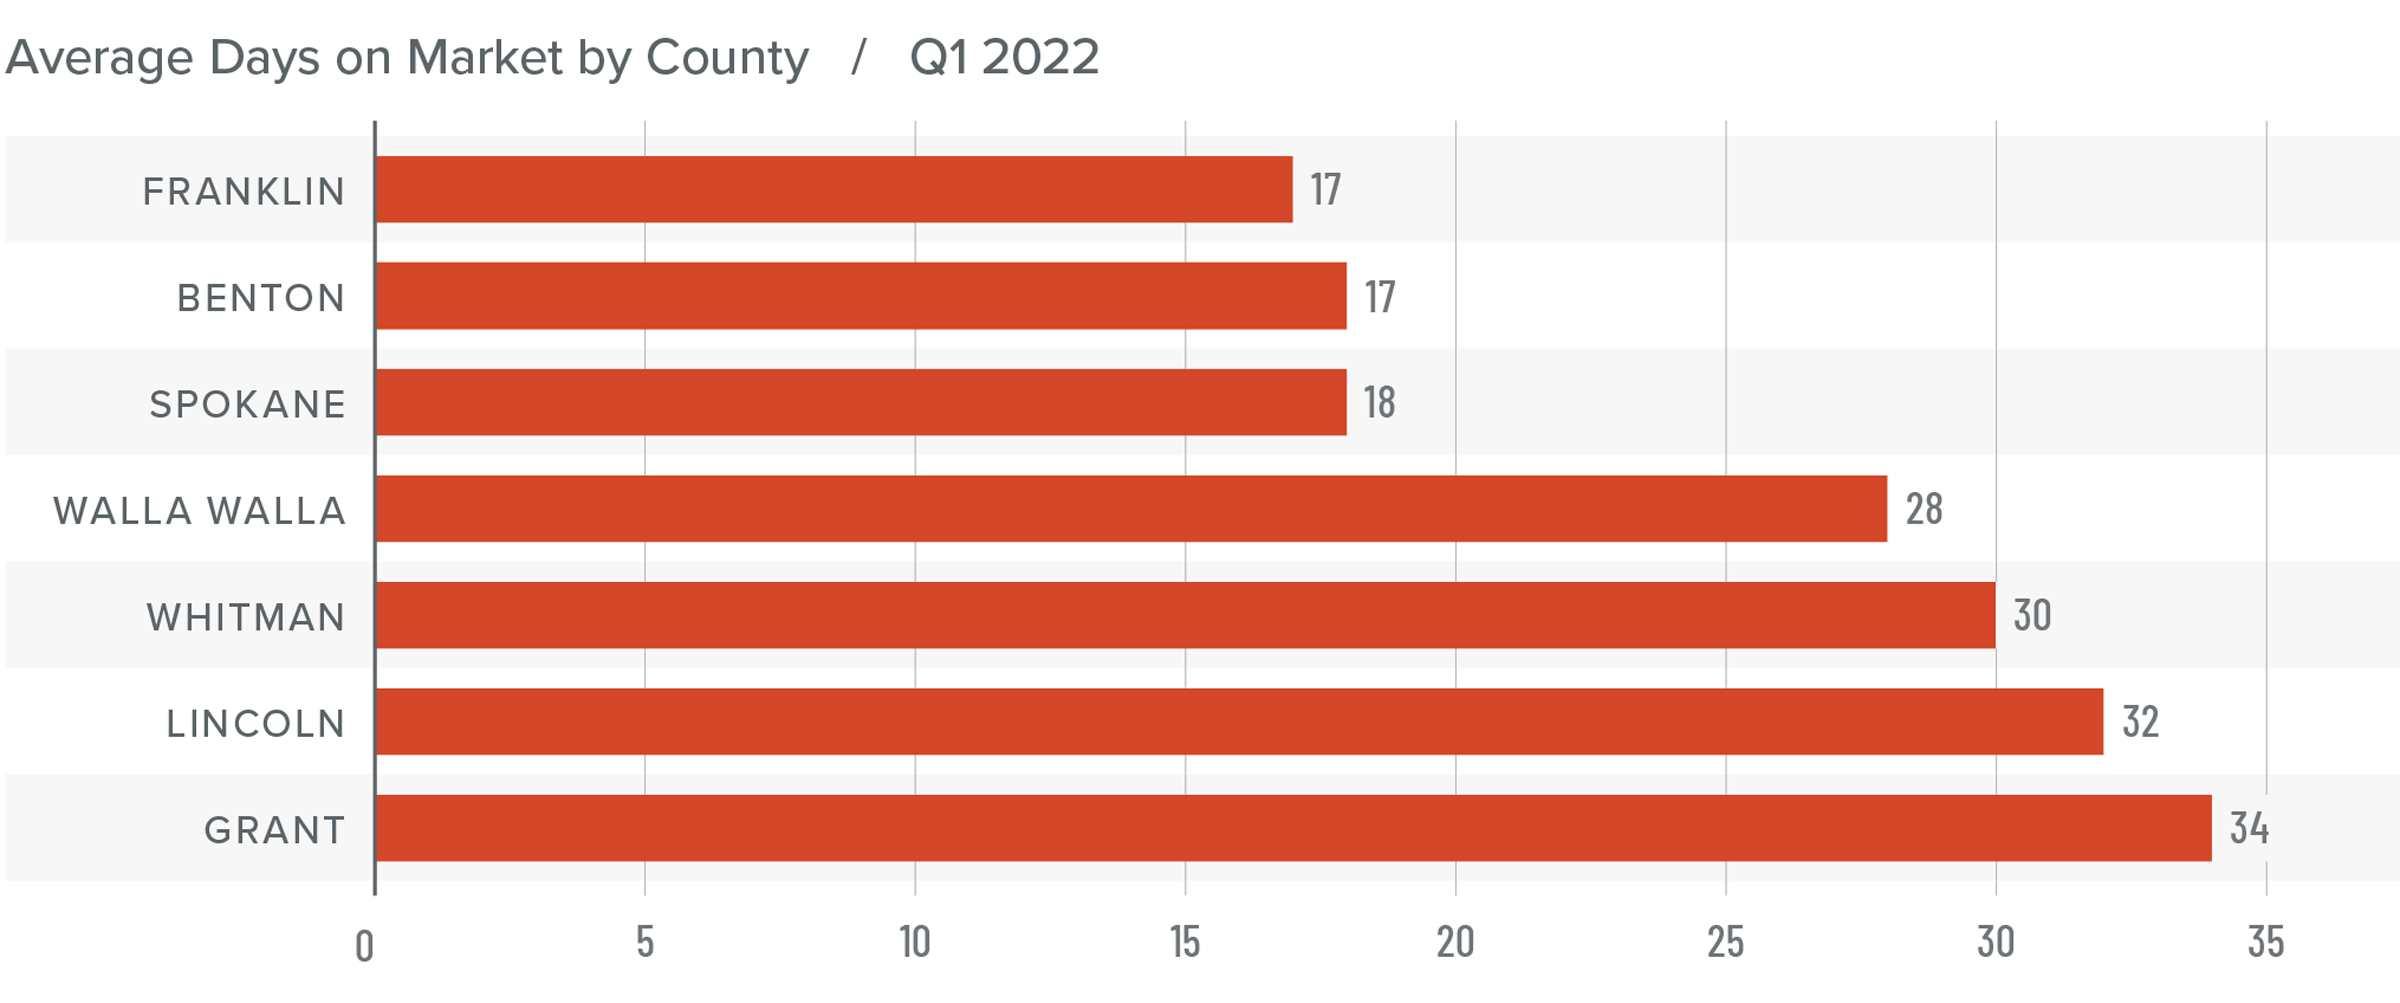
❱ The average time it took to sell a home in Eastern Washington in the first quarter of 2022 was 25 days. This is 8 fewer days than in the first quarter of 2021.
❱ Compared to the previous quarter, average days on market rose in every county other than Lincoln.
❱ All counties other than Spokane and Franklin saw the average number of days-on-market drop compared to the same period in 2021. That said, the increased market time in Spokane and Franklin counties was modest.
❱ During the first quarter it took an average of only one more day to sell a home than it did during the final quarter of last year.
Conclusions
This speedometer reflects the state of the region’s real estate market using housing inventory, price gains, home sales, interest rates, and larger economic factors.
Employment levels continue to grow in Eastern Washington, but the housing market is still struggling to find its direction. A lack of homes for sale remains a major issue and the region appears to be headed toward a slower pace of sales. For now, though, price growth remains strong. The impact of rising mortgage rates on the housing market lags by about three months. It will be interesting to see how this affects the pace of price growth once the spring market is fully underway.

Given all the factors discussed here, I have chosen to leave the needle in the same position as the previous quarter. Sellers are still in the driver’s seat—as list prices continue to increase—but higher mortgage rates will further exacerbate affordability concerns in several markets, which may move the region toward a period of greater stability. We will have to wait and see.
About Matthew Gardner
As Chief Economist for Windermere Real Estate, Matthew Gardner is responsible for analyzing and interpreting economic data and its impact on the real estate market on both a local and national level. Matthew has over 30 years of professional experience both in the U.S. and U.K.
In addition to his day-to-day responsibilities, Matthew sits on the Washington State Governors Council of Economic Advisors; chairs the Board of Trustees at the Washington Center for Real Estate Research at the University of Washington; and is an Advisory Board Member at the Runstad Center for Real Estate Studies at the University of Washington where he also lectures in real estate economics.
Q4 2021 Eastern Washington Real Estate Market Update

The following analysis of the Eastern Washington real estate market is provided by Windermere Real Estate Chief Economist Matthew Gardner. We hope that this information may assist you with making better-informed real estate decisions. For further information about the housing market in your area, please don’t hesitate to contact your Windermere Real Estate agent.
Regional Economic Overview
The Eastern Washington economy has proved remarkably resilient to the effects of the pandemic, having recovered all of the jobs that were lost and adding more than 20,500 more. Every county except Whitman shows employment levels above their pre-pandemic peak. It should be added that this report considers total employment, not just non-agricultural jobs, so the numbers are higher than might be expected. With the job market expanding at a solid pace, it is not a surprise to see the unemployment rate continuing to trend lower. As of November 2021 (the most recent data available), only 3.4% of the workforce was unemployed—down from the pandemic peak of 14.9%.
eastern washington Home Sales
❱ In the final quarter of 2021, 3,714 homes sold, down 5.1% compared to the same period in 2020. Sales were also 10.3% lower than in the third quarter, but this was mainly due to seasonal changes in the market.
❱ The number of home sales was disappointing, and though we might suspect the slowing is due to a lack of homes for sale, listings were down by less than 1%, which makes the drop in sales somewhat puzzling.
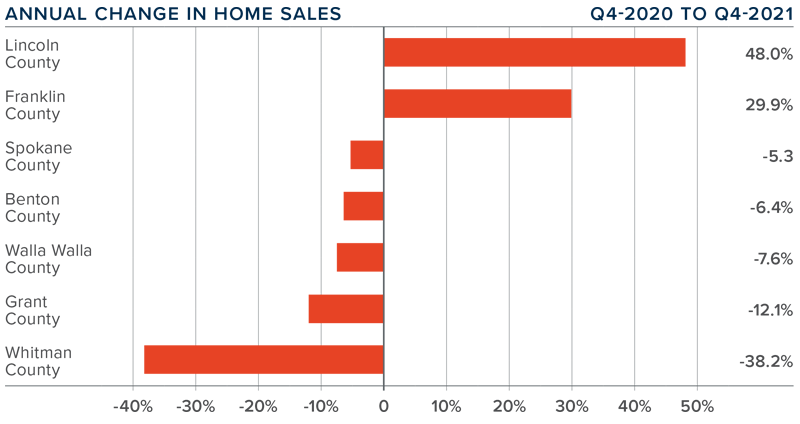
❱ Year-over-year, sales rose in two counties but fell in the other five. Compared to the third quarter, sales fell everywhere but Franklin County.
❱ Whether it was the rise of new COVID-19 infections, inclement weather, or rising mortgage rates, the main culprit behind the slowdown in sales is unclear. I will be very interested to see how the market performs in the first quarter of the new year.
eastern washington Home Prices

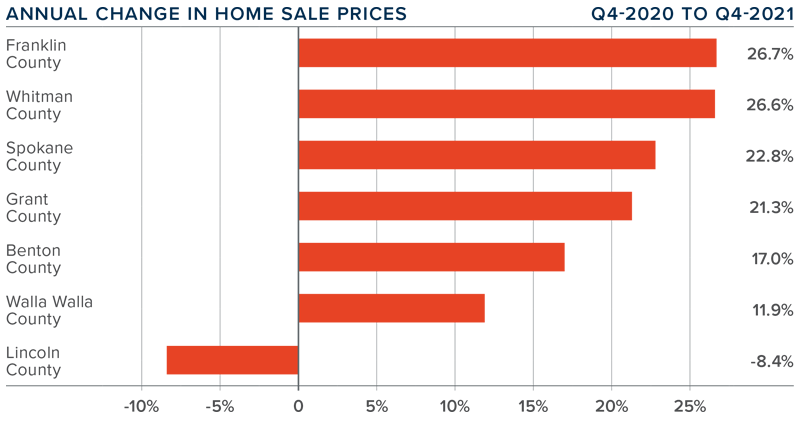
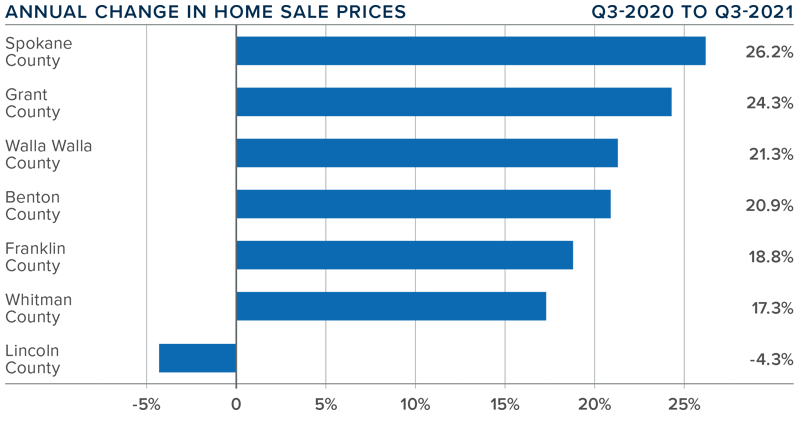
❱ Year-over-year, the average home price in Eastern Washington rose a very significant 21.3% to $423,870 but pulled back by a modest .4% compared to the third quarter of the year.
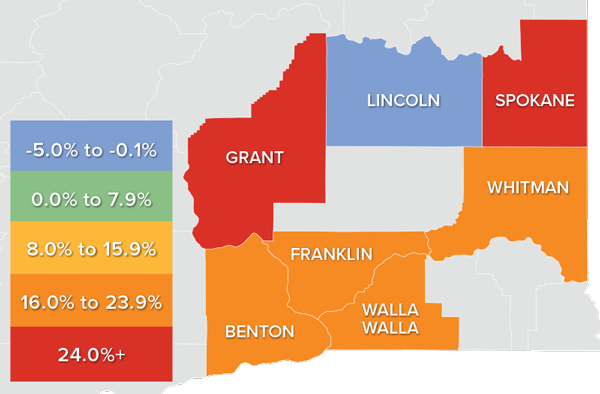
❱ When compared to third quarter, prices rose in Benton, Franklin, and Walla Walla counties. Prices remained static in Lincoln County and dropped in the rest of the market areas.
❱ Lincoln County saw prices drop compared to the previous year, but it is a small market, which makes it prone to significant swings. The balance of the counties contained in this report saw prices rise at double-digit rates across the board.
❱ Mortgage rates rose .3% between October and the end of the year, which may have impacted near-term price growth. That said, Spokane County is now technically unaffordable for a buyer making the median income and every county other than Lincoln is unaffordable for first-time buyers. Price growth is likely slowing due to lower affordability.
Days on Market
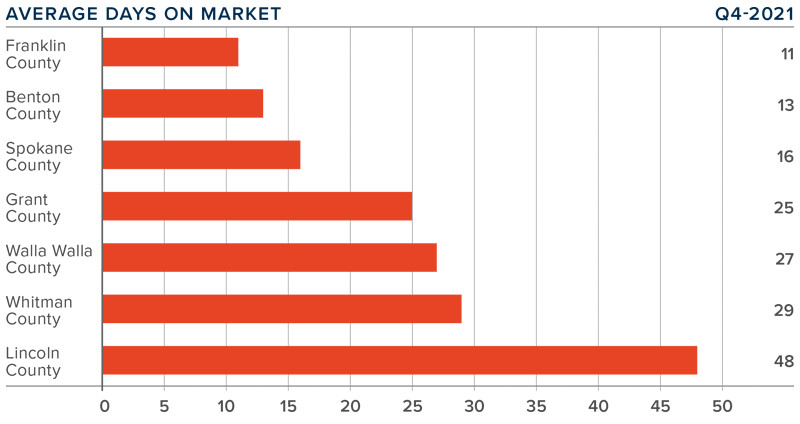
❱ The average time it took to sell a home in Eastern Washington in the final quarter of 2021 was 24 days.
❱ During the quarter, it took seven fewer days to sell a home in Eastern Washington than it did a year ago.
❱ All markets other than Lincoln saw the average number of days-on-market drop compared to the same period in 2020, with significant declines in Walla Walla (-23 days) and Whitman (-13 days) counties.
❱ It took ten more days to sell a home in the quarter than it did during the third quarter of this year.
Conclusions

This speedometer reflects the state of the region’s real estate market using housing inventory, price gains, home sales, interest rates, and larger economic factors.
Solid employment gains continue in Eastern Washington, but the housing market appears to have taken somewhat of a breather. Housing data for the winter months can be a little frenetic, but the signs of a slowdown are there. Although it is far too early to suggest that this is the case, it will be interesting to see how the market performs in the spring, especially considering rising mortgage rates and falling affordability levels.
Ultimately, only time will tell, but it seems that the Eastern Washington market is poised for a move back to some sort of balance—at least given the current data. As such, I have moved the needle a little toward home buyers, but it remains a seller’s market.
About Matthew Gardner

As Chief Economist for Windermere Real Estate, Matthew Gardner is responsible for analyzing and interpreting economic data and its impact on the real estate market on both a local and national level. Matthew has over 30 years of professional experience both in the U.S. and U.K.
In addition to his day-to-day responsibilities, Matthew sits on the Washington State Governors Council of Economic Advisors; chairs the Board of Trustees at the Washington Center for Real Estate Research at the University of Washington; and is an Advisory Board Member at the Runstad Center for Real Estate Studies at the University of Washington where he also lectures in real estate economics.
Q3 2021 Eastern Washington Real Estate Market Update

The following analysis of the Eastern Washington real estate market is provided by Windermere Real Estate Chief Economist Matthew Gardner. We hope that this information may assist you with making better-informed real estate decisions. For further information about the housing market in your area, please don’t hesitate to contact your Windermere Real Estate agent.
Regional Economic Overview
The Eastern Washington job market lost more than 47,000 jobs over the pandemic period, but the region has now recovered all of these jobs and added almost 11,000 new positions. Every county except Whitman shows employment levels above their pre-pandemic peak. Of specific note is Spokane County, which met my forecast in the second quarter Gardner Report and has now seen a full job recovery. Employment growth has, unsurprisingly, allowed the unemployment rate to drop further, with the region showing just 4.6% of its workforce now without a job. This is down from the pandemic peak of 14.9%.
eastern washington Home Sales
❱ Home sales throughout Eastern Washington fell 2.2% compared to the same quarter in 2020. This is not very informative given that the country was experiencing a massive housing rebound following the outbreak of COVID-19. More useful is that sales rose 13.5% from the second quarter of this year.
❱ Listing activity was up more than 64% compared to the second quarter of this year, which allowed sales to grow. That said, available inventory is still 13.7% lower than last summer.
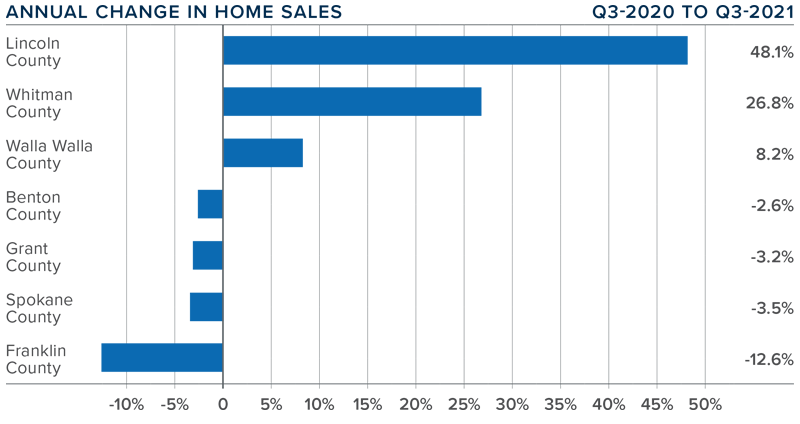
❱ Year-over-year, sales rose in three counties but fell in the other four. Compared to the second quarter, sales rose in all counties other than Whitman, with significant increases in Lincoln County, where transactions rose more than 48%.
❱ Pending home sales, which are an indicator of future closings, were 3.1% higher than in the prior quarter. This suggests that closings in the fourth quarter will be positive.
eastern washington Home Prices
❱ Year-over-year, the average home price in Eastern Washington rose a very significant 23.7% to $425,630 and was 3.8% higher than in the second quarter of this year.
❱ Demand remains strong, as demonstrated by the rising number pending sales, and the increase in the number of homes for sale has not slowed the market.
❱ Prices rose in every county other than the small Lincoln County market. There were double-digit increases in all other areas.
❱ Mortgage rates remain very competitive, which has allowed prices to continue rising. However, as I mentioned in the last Gardner Report, affordability concerns are starting to rise. Both Spokane and Walla Walla counties are now technically unaffordable for buyers making the median income, and every county in this report—with the exception of Lincoln County—is considered unaffordable for first-time buyers.
Days on Market
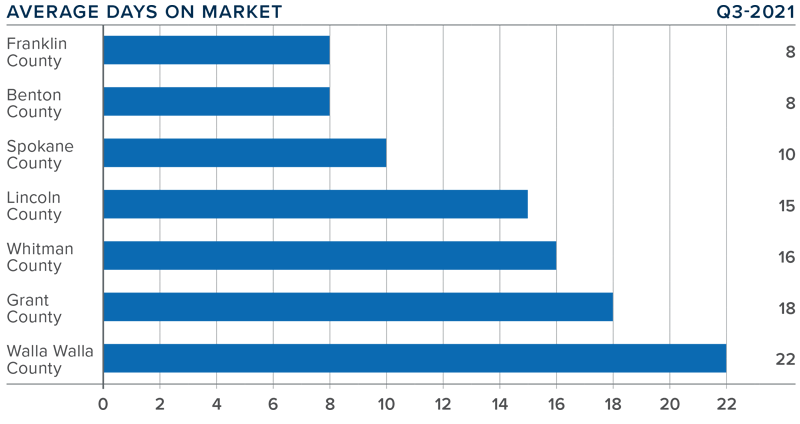
❱ The average time it took to sell a home in Eastern Washington in the third quarter of 2021 was 14 days.
❱ During the quarter, it took 17 fewer days to sell a home in Eastern Washington than it did a year ago.
❱ All markets saw days on market drop compared to the third quarter of 2020, with significant declines in Lincoln County (-29 days), Whitman County (-26 days), and Grant County (-22 days).
❱ It took six fewer days to sell a home in the third quarter than it did during the second quarter of this year.
Conclusions

This speedometer reflects the state of the region’s real estate market using housing inventory, price gains, home sales, interest rates, and larger economic factors.
With a full return of the jobs lost to COVID-19 and very favorable mortgage rates, home buyers have been out in force. This, in concert with more choice in the region, caused home sales and prices to rise.
As it stands today, the only thing that’s favoring buyers is that there are more homes for sale. But, given the direction of pending sales, prices, and shortening days on market, the region still favors home sellers. As such—and even in the face of affordability issues starting to appear in select markets—I have chosen to move the needle a little more in favor of home sellers.
About Matthew Gardner
As Chief Economist for Windermere Real Estate, Matthew Gardner is responsible for analyzing and interpreting economic data and its impact on the real estate market on both a local and national level. Matthew has over 30 years of professional experience both in the U.S. and U.K.
In addition to his day-to-day responsibilities, Matthew sits on the Washington State Governors Council of Economic Advisors; chairs the Board of Trustees at the Washington Center for Real Estate Research at the University of Washington; and is an Advisory Board Member at the Runstad Center for Real Estate Studies at the University of Washington where he also lectures in real estate economics.
Q2 2021 Eastern Washington Real Estate Market Update

The following analysis of the Eastern Washington real estate market is provided by Windermere Real Estate Chief Economist Matthew Gardner. We hope that this information may assist you with making better-informed real estate decisions. For further information about the housing market in your area, please don’t hesitate to contact your Windermere Real Estate agent.
Regional Economic Overview
The Eastern Washington job market continues to recover following the loss of more than 47,000 jobs due to the pandemic. The latest numbers show that all but 6,300 of the jobs lost have returned, with solid numbers after the state reopened fully. It was interesting to note that the Benton/Franklin market has now recovered all of the jobs that were lost due to COVID-19, and Walla Walla and Lincoln counties have reached almost a full recovery. Spokane County is still down 3,500 jobs from its pre-pandemic peak, which is expected given its size. That said, I would not be surprised to see a full recovery there by the end of the summer, if not sooner. With jobs returning, the unemployment rate continues to decline. The latest data shows the region’s unemployment rate is down to 5.1% from 11.4% a year ago.
eastern washington Home Sales
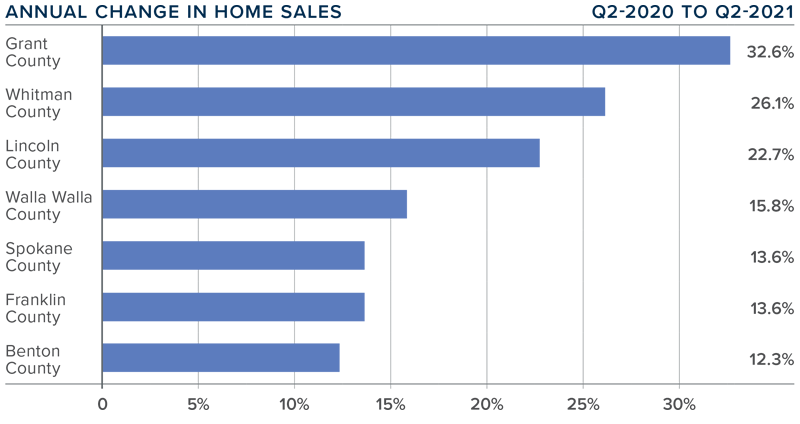
❱ Home sales throughout Eastern Washington rose 15.4% compared to the same quarter in 2020. Given that the pandemic was in full swing at that time, these stats aren’t very informative. Of greater interest was that sales rose 47.9% from the first quarter of this year.
❱ Listing activity was up more than 26% from the first quarter, which explains the rapid growth in sales. That said, the number of homes for sale is still 52% lower than during the early pandemic period.
❱ Year-over-year, sales rose by double digits across the board. Of particular note was significant growth in Whitman, Spokane, Lincoln, and Walla Walla counties compared to the first quarter of this year.
❱ Pending home sales, which are an indicator of future closings, were 38.3% higher than in the first quarter. This suggests that closings in the third quarter will be positive.
eastern washington Home Prices
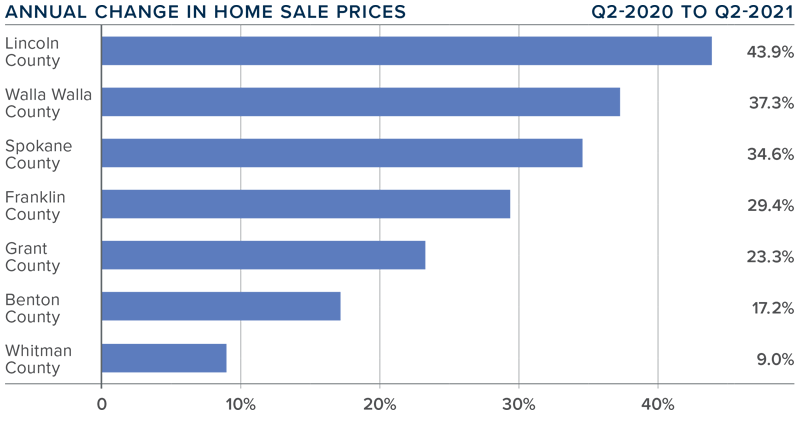
❱ Year-over-year, the average home price in Eastern Washington rose a very significant 28.8% to $410,242. Home prices were also 14.1% higher than in the first quarter of this year.
❱ Demand remains strong, and, even with greater inventory of homes for sale, prices continue to rise at well-above-average rates.
❱ Prices rose in every county, and all but one county saw double-digit increases. Lincoln, Walla Walla, and Spokane counties all experienced significant growth.
❱ Mortgage rates pulled back in the quarter, but I expect them to rise modestly as we move through the year. This will have some impact on the pace of home price growth, but a larger factor will be affordability. Spokane County is verging on becoming technically unaffordable for buyers, and all counties aside from Lincoln are now considered unaffordable for first-time buyers.
Days on Market
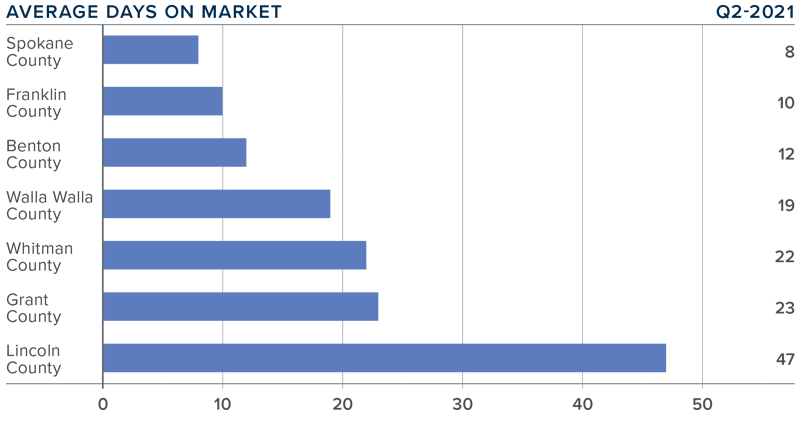
❱ The average time it took to sell a home in Eastern Washington in the second quarter of 2021 was 20 days.
❱ During the second quarter, it took 15 fewer days to sell a home in Eastern Washington than it did a year ago.
❱ All markets saw days-on-market drop compared to the second quarter of 2020, with significant declines in Walla Walla (-27 days), Whitman (-22 days), and Grant (-20 days) counties.
❱ It took 13 fewer days to sell a home in the second quarter than it did during the first quarter of last year.
Conclusions
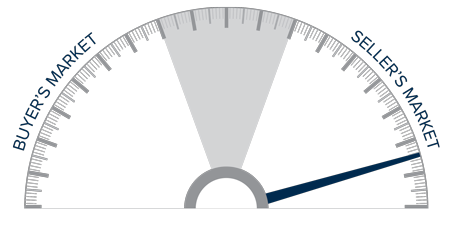
This speedometer reflects the state of the region’s real estate market using housing inventory, price gains, home sales, interest rates, and larger economic factors.
Eastern Washington’s economy continues to recover, and rising mortgage rates in the first quarter nudged a lot of buyers off the fence. Even with rates pulling back in the second quarter, the belief that they will start to rise again has only increased buyer urgency, which has also been buoyed by growing levels of inventory.
The market will continue to perform strongly as we move through the balance of this year and, even though there are more homes for sale, conditions are still highly competitive. Because affordability issues are increasing, I am leaving the needle in the same place as last quarter, but it remains a seller’s market.
About Matthew Gardner
As Chief Economist for Windermere Real Estate, Matthew Gardner is responsible for analyzing and interpreting economic data and its impact on the real estate market on both a local and national level. Matthew has over 30 years of professional experience both in the U.S. and U.K.
In addition to his day-to-day responsibilities, Matthew sits on the Washington State Governors Council of Economic Advisors; chairs the Board of Trustees at the Washington Center for Real Estate Research at the University of Washington; and is an Advisory Board Member at the Runstad Center for Real Estate Studies at the University of Washington where he also lectures in real estate economics.
")


