
 Facebook
 X
X
 Pinterest
 Copy Link
Q3 2023 Utah Real Estate Market Update

The following analysis of select counties of the Utah real estate market is provided by Windermere Real Estate. We hope that this information may assist you with making better-informed real estate decisions. For further information about the housing market in your area, please don’t hesitate to contact your Windermere Real Estate agent.
Regional Economic Overview
After picking up in the second quarter of this year, year-over-year employment growth has pulled back again. Utah added 39,000 jobs over the past 12 months, which represents an annual growth rate of 2.3%. This is the lowest pace of job gains since the pandemic started. Job growth was led by the Salt Lake City metro area, where employment rose 2.7%. This was followed by the Ogden and Provo metro areas, where employment rose 2.4% and 1.7%, respectively.
Utah’s unemployment rate in August was 2.5%, which is up .1% year over year. At the county level, the lowest jobless rate was in Morgan County (2.5%) and the highest was in Weber County, where 3.1% of the workforce were without jobs. In aggregate, the unemployment rate within the counties contained in this report was 3%.
Utah Home Sales
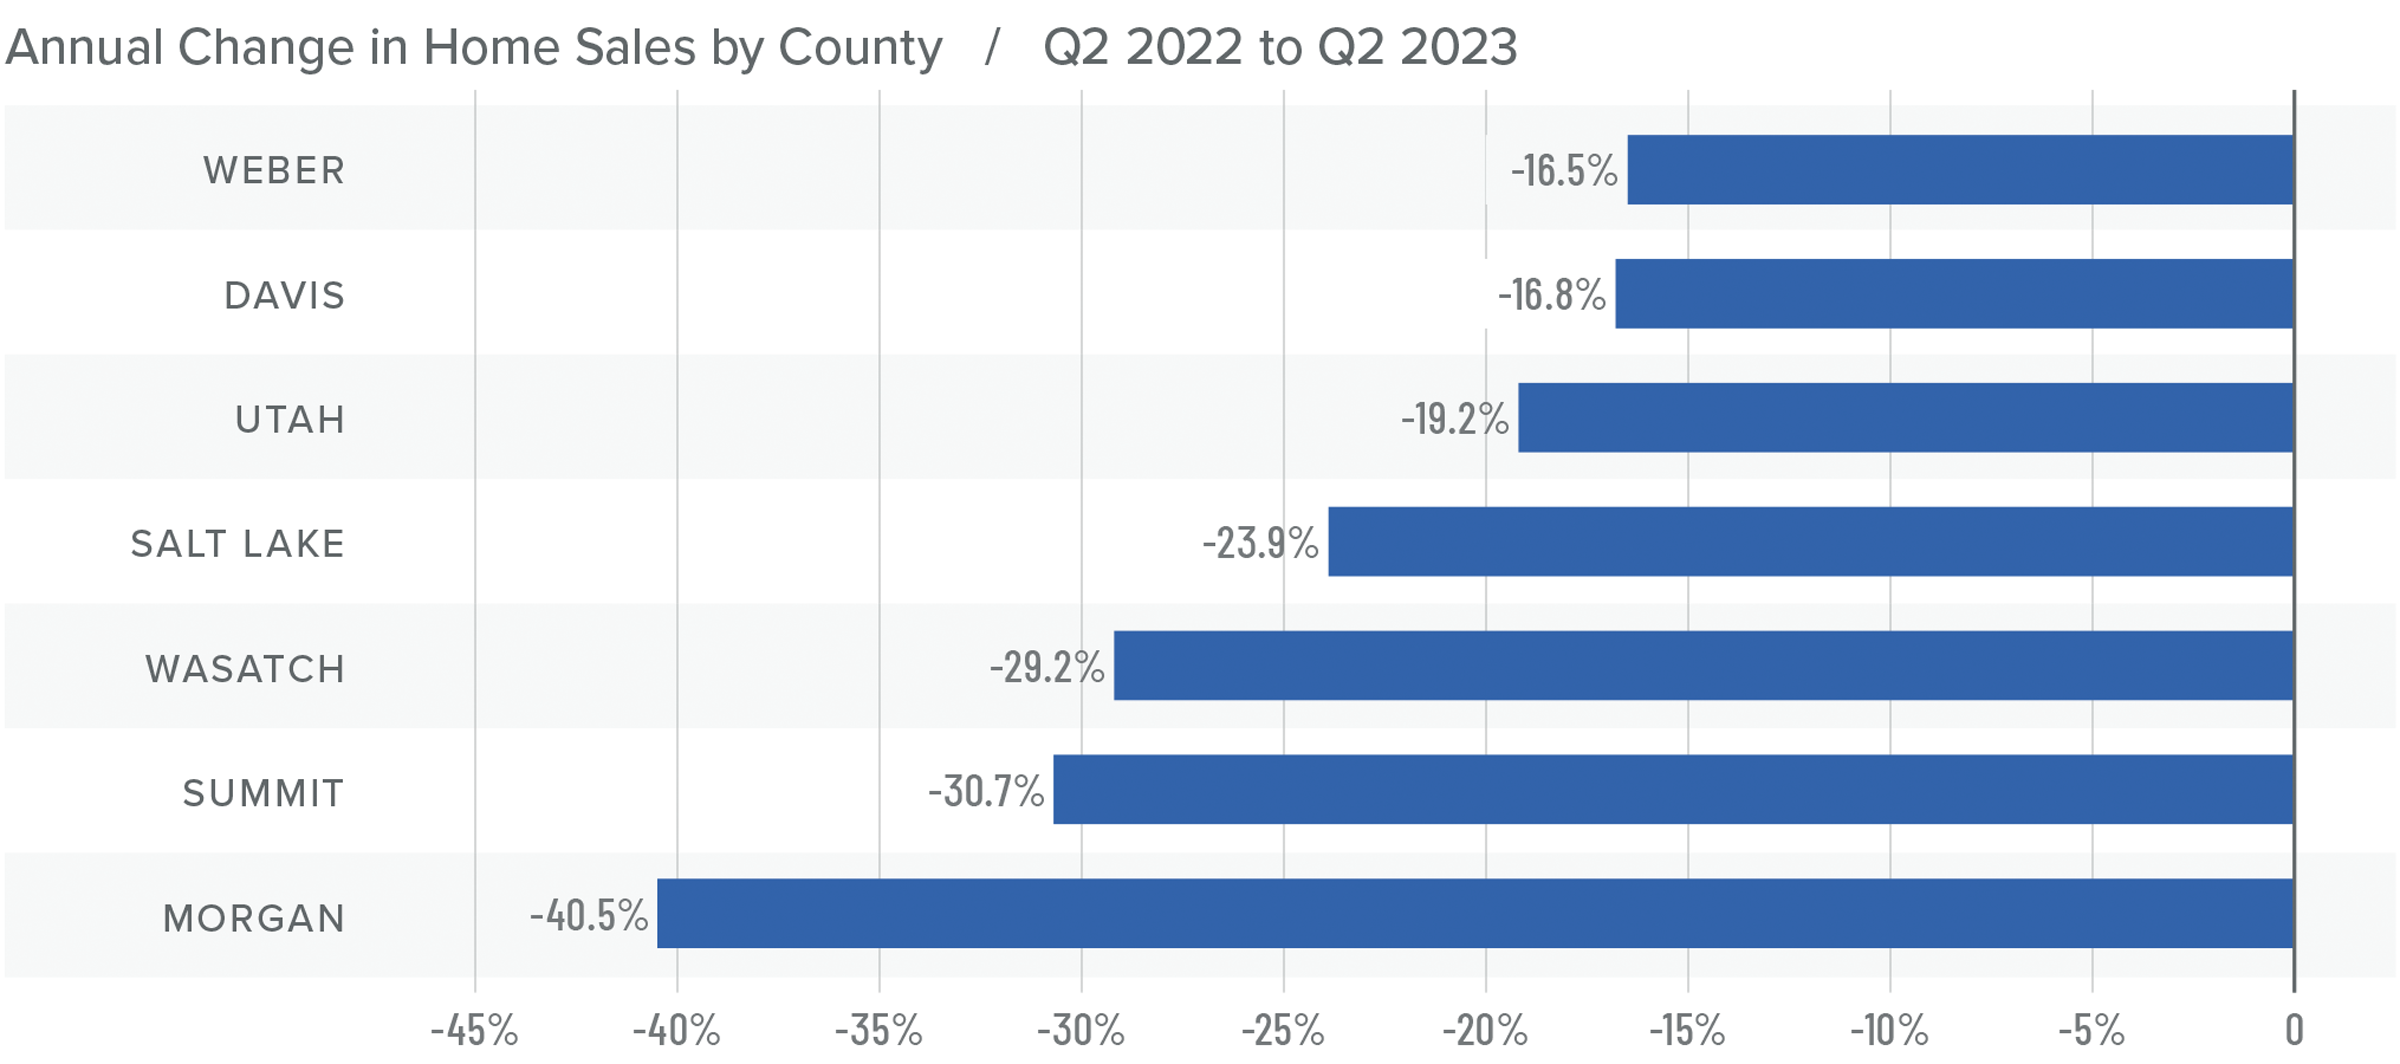
❱ In the third quarter of 2023, 6,675 homes sold in the areas covered by this report. This was down 9.5% compared to the third quarter of 2022 and was 5.7% lower than in the second quarter of this year.
❱ Although total sales volumes have fallen, they rose in Wasatch, Summit, and Morgan counties compared the third quarter of 2022. These same three counties also saw sales grow between the second and third quarters of this year.
❱ As sales volumes fell, listing activity rose 28.7% compared to the second quarter of 2023. Clearly, more choice in the market was not enough to tempt buyers who were also faced with significantly higher financing costs.
❱ Pending sales fell 8.9% from the second quarter, suggesting that closings in the fourth quarter may also be lackluster.

Utah Home Prices
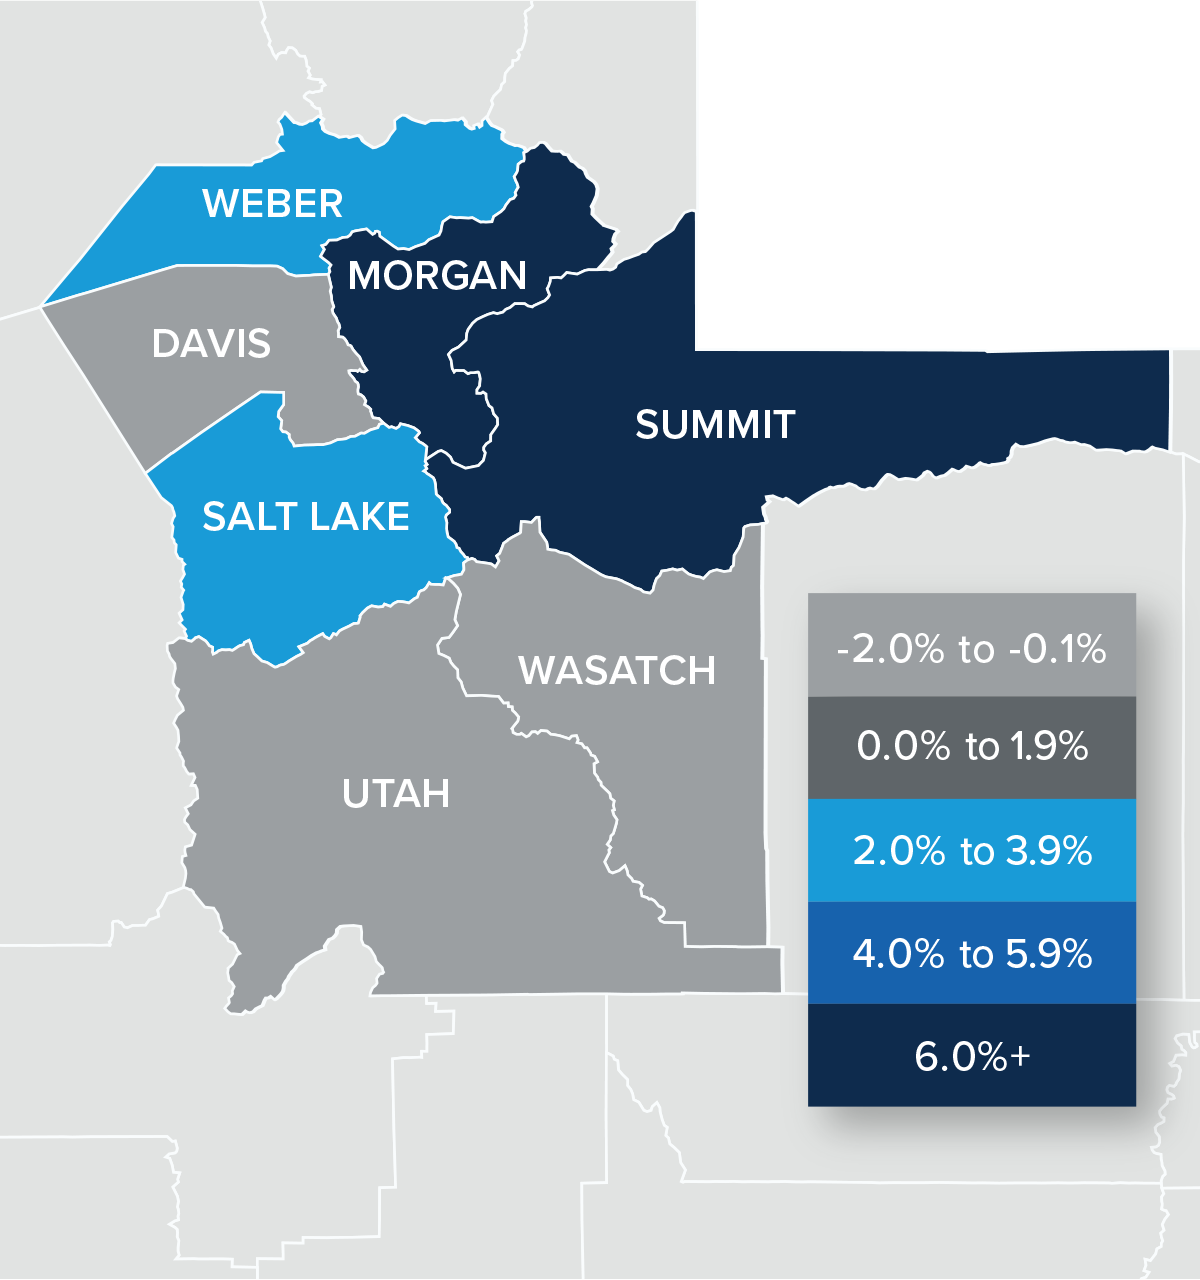
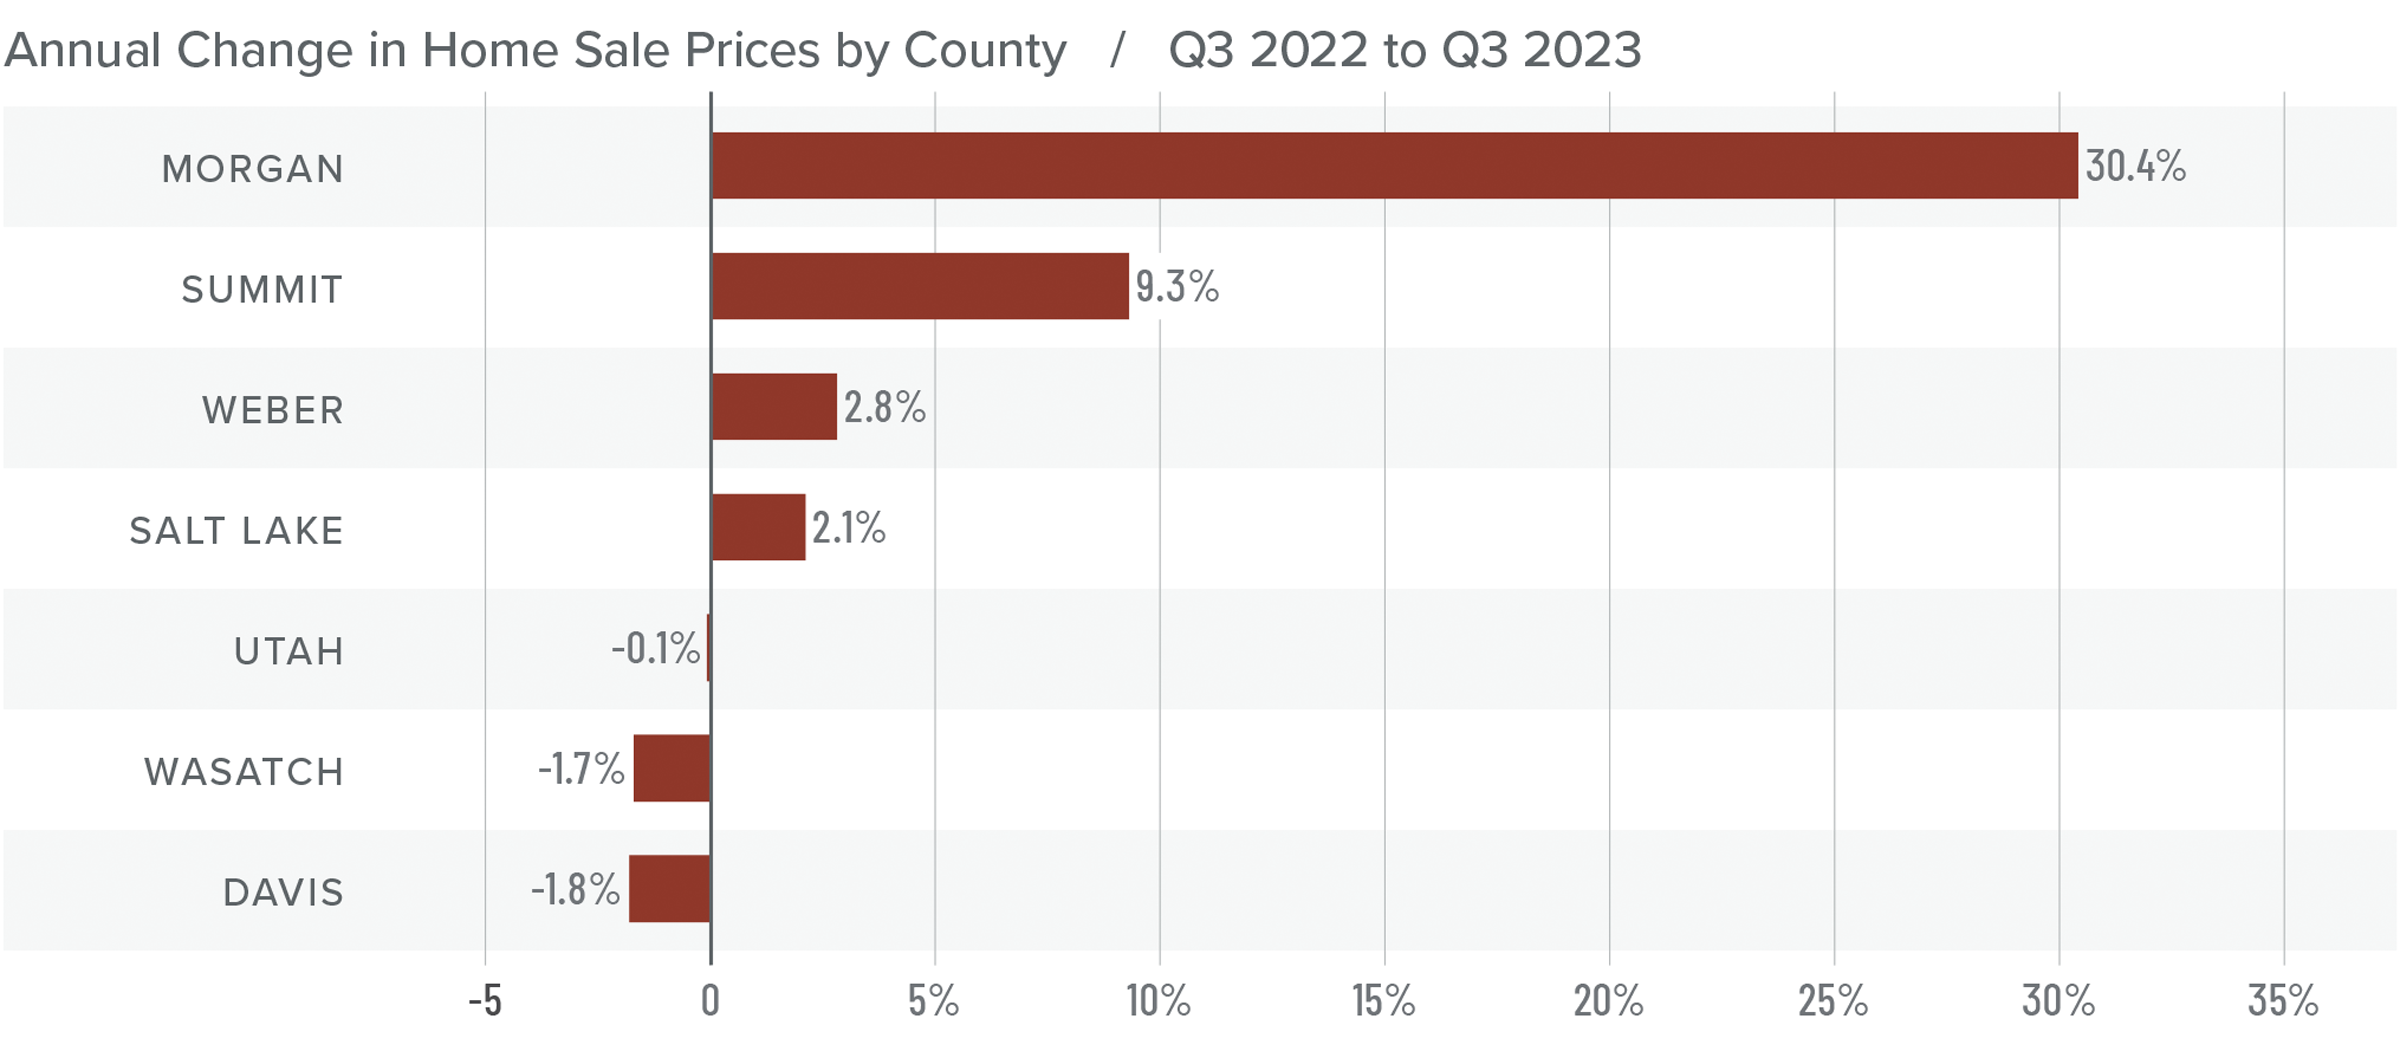
❱ The average sale price grew 4% from the same time in 2022 to $651,913. Prices were also 3.8% higher than in the second quarter of 2023.
❱ Regionally, median list prices in the third quarter were flat compared to the second quarter of the year. However, asking prices were higher in Wasatch, Summit, and Morgan counties.
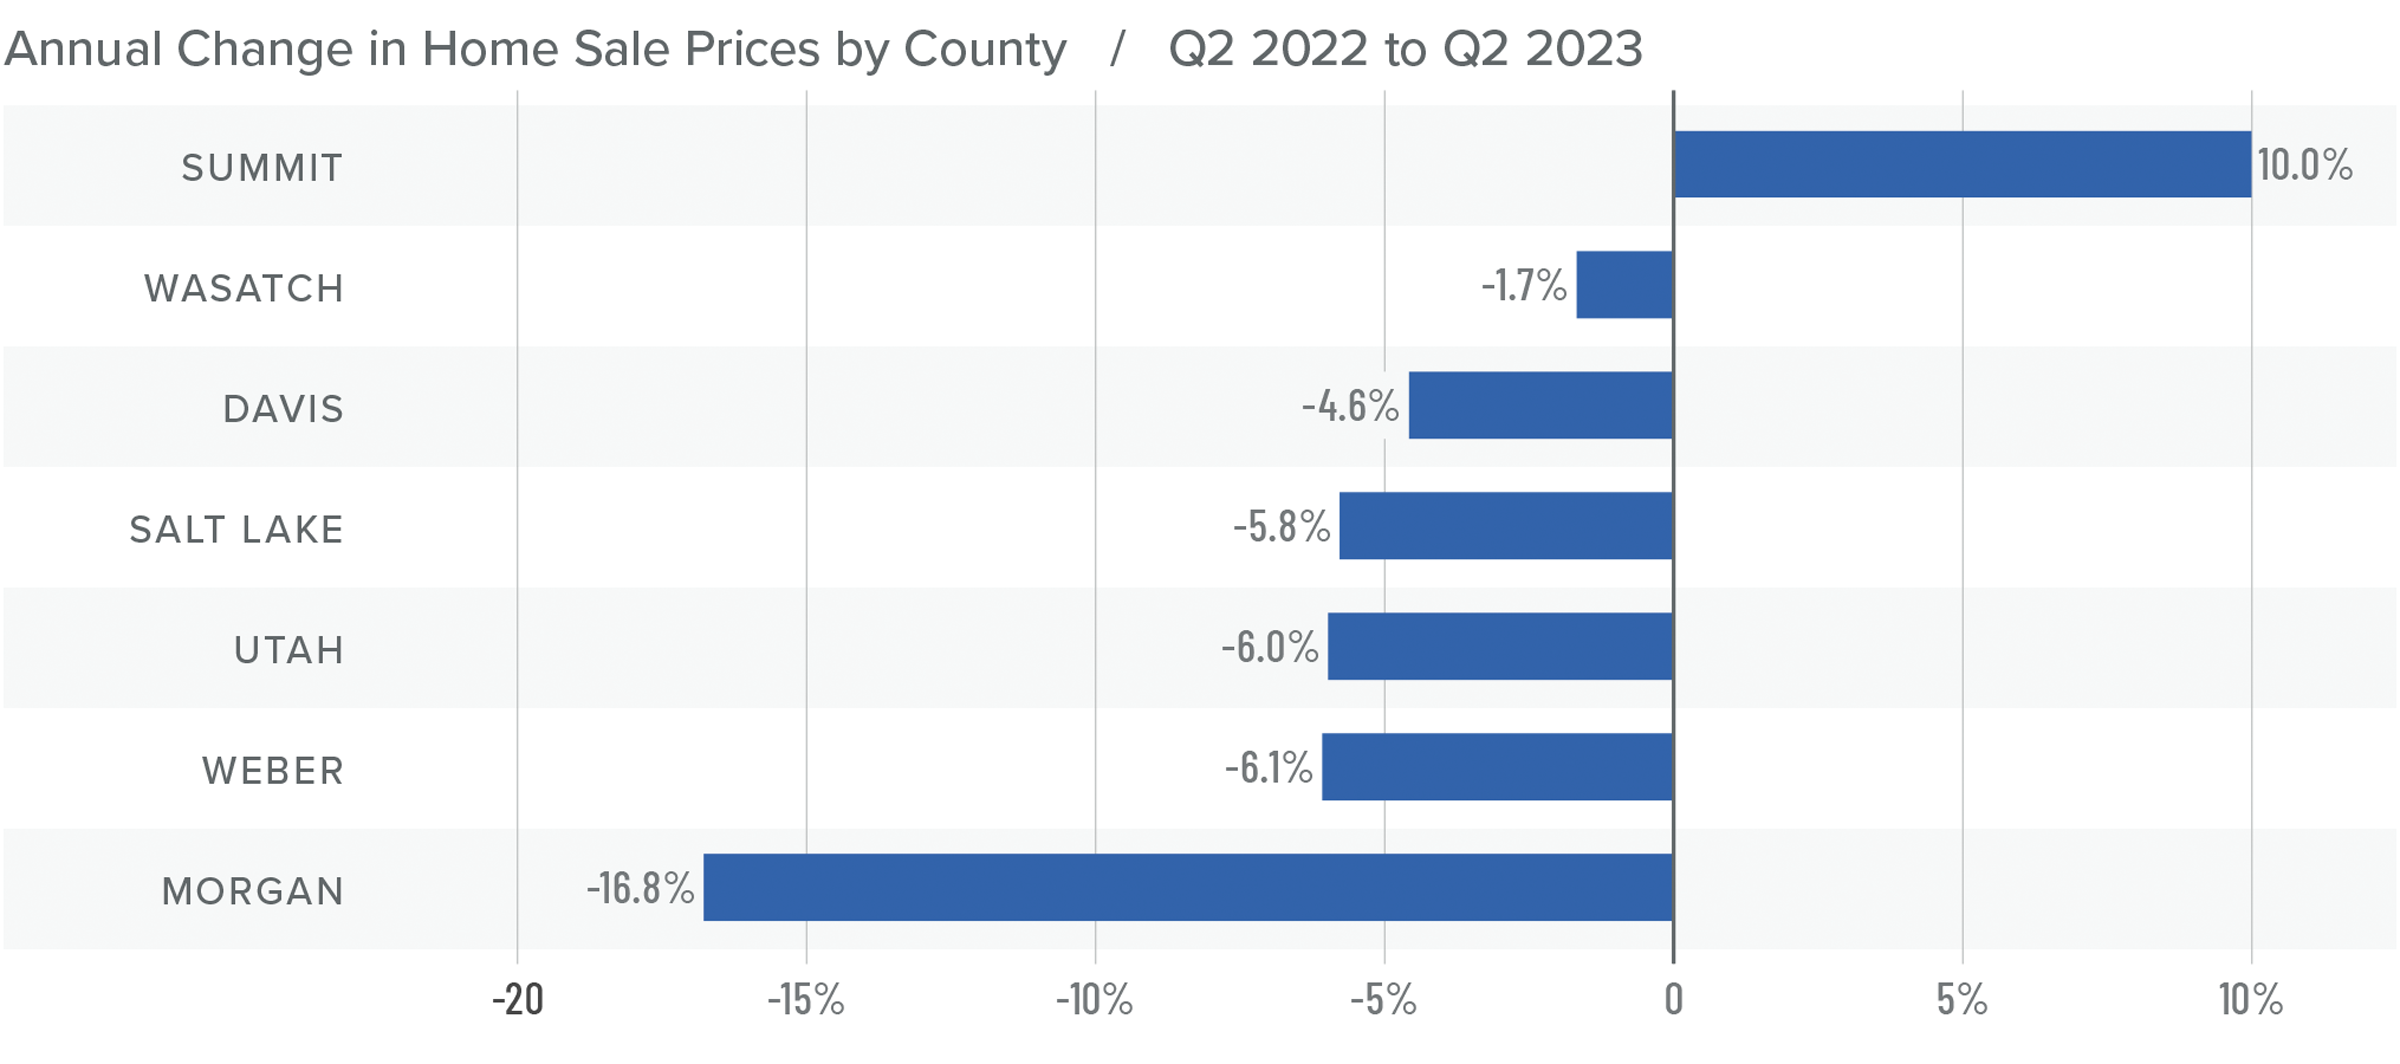
❱ Year over year, prices rose in four counties but fell in three. With just 28 sales in the quarter, Morgan County had a significant price increase, but it’s such a small market that sizeable price swings are not unusual. Compared to the second quarter of 2023, prices rose in all counties except Davis and Summit, where prices fell 1.7% and 13.8%, respectively.
❱ Price growth has been slowing, which is to be expected given the significant rise in mortgage rates. I don’t expect to see much in the way of price growth for the balance of the year due to both higher financing costs and more choice in the market.
Mortgage Rates
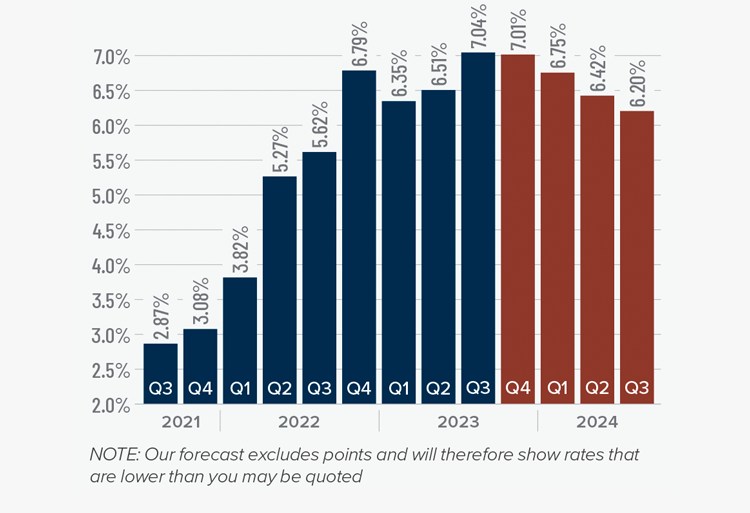
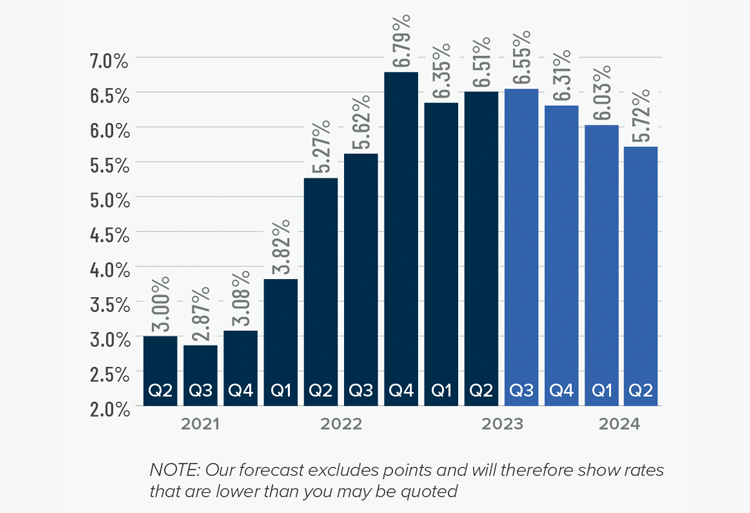
Mortgage rates continued trending higher in the third quarter of 2023 and are now at levels we have not seen since the fall of 2000. Mortgage rates are tied to the interest rate (yield) on 10-year treasuries, and they move in the opposite direction of the economy. Unfortunately for mortgage rates, the economy remains relatively buoyant, and though inflation is down significantly from its high, it is still elevated. These major factors and many minor ones are pushing Treasury yields higher, which is pushing mortgage rates up. Given the current position of the Federal Reserve, which intends to keep rates “higher for longer,” it is unlikely that home buyers will get much reprieve when it comes to borrowing costs any time soon.
With such a persistently positive economy, I have had to revise my forecast yet again. I now believe rates will hold at current levels before starting to trend down in the spring of next year.
Utah Days on Market
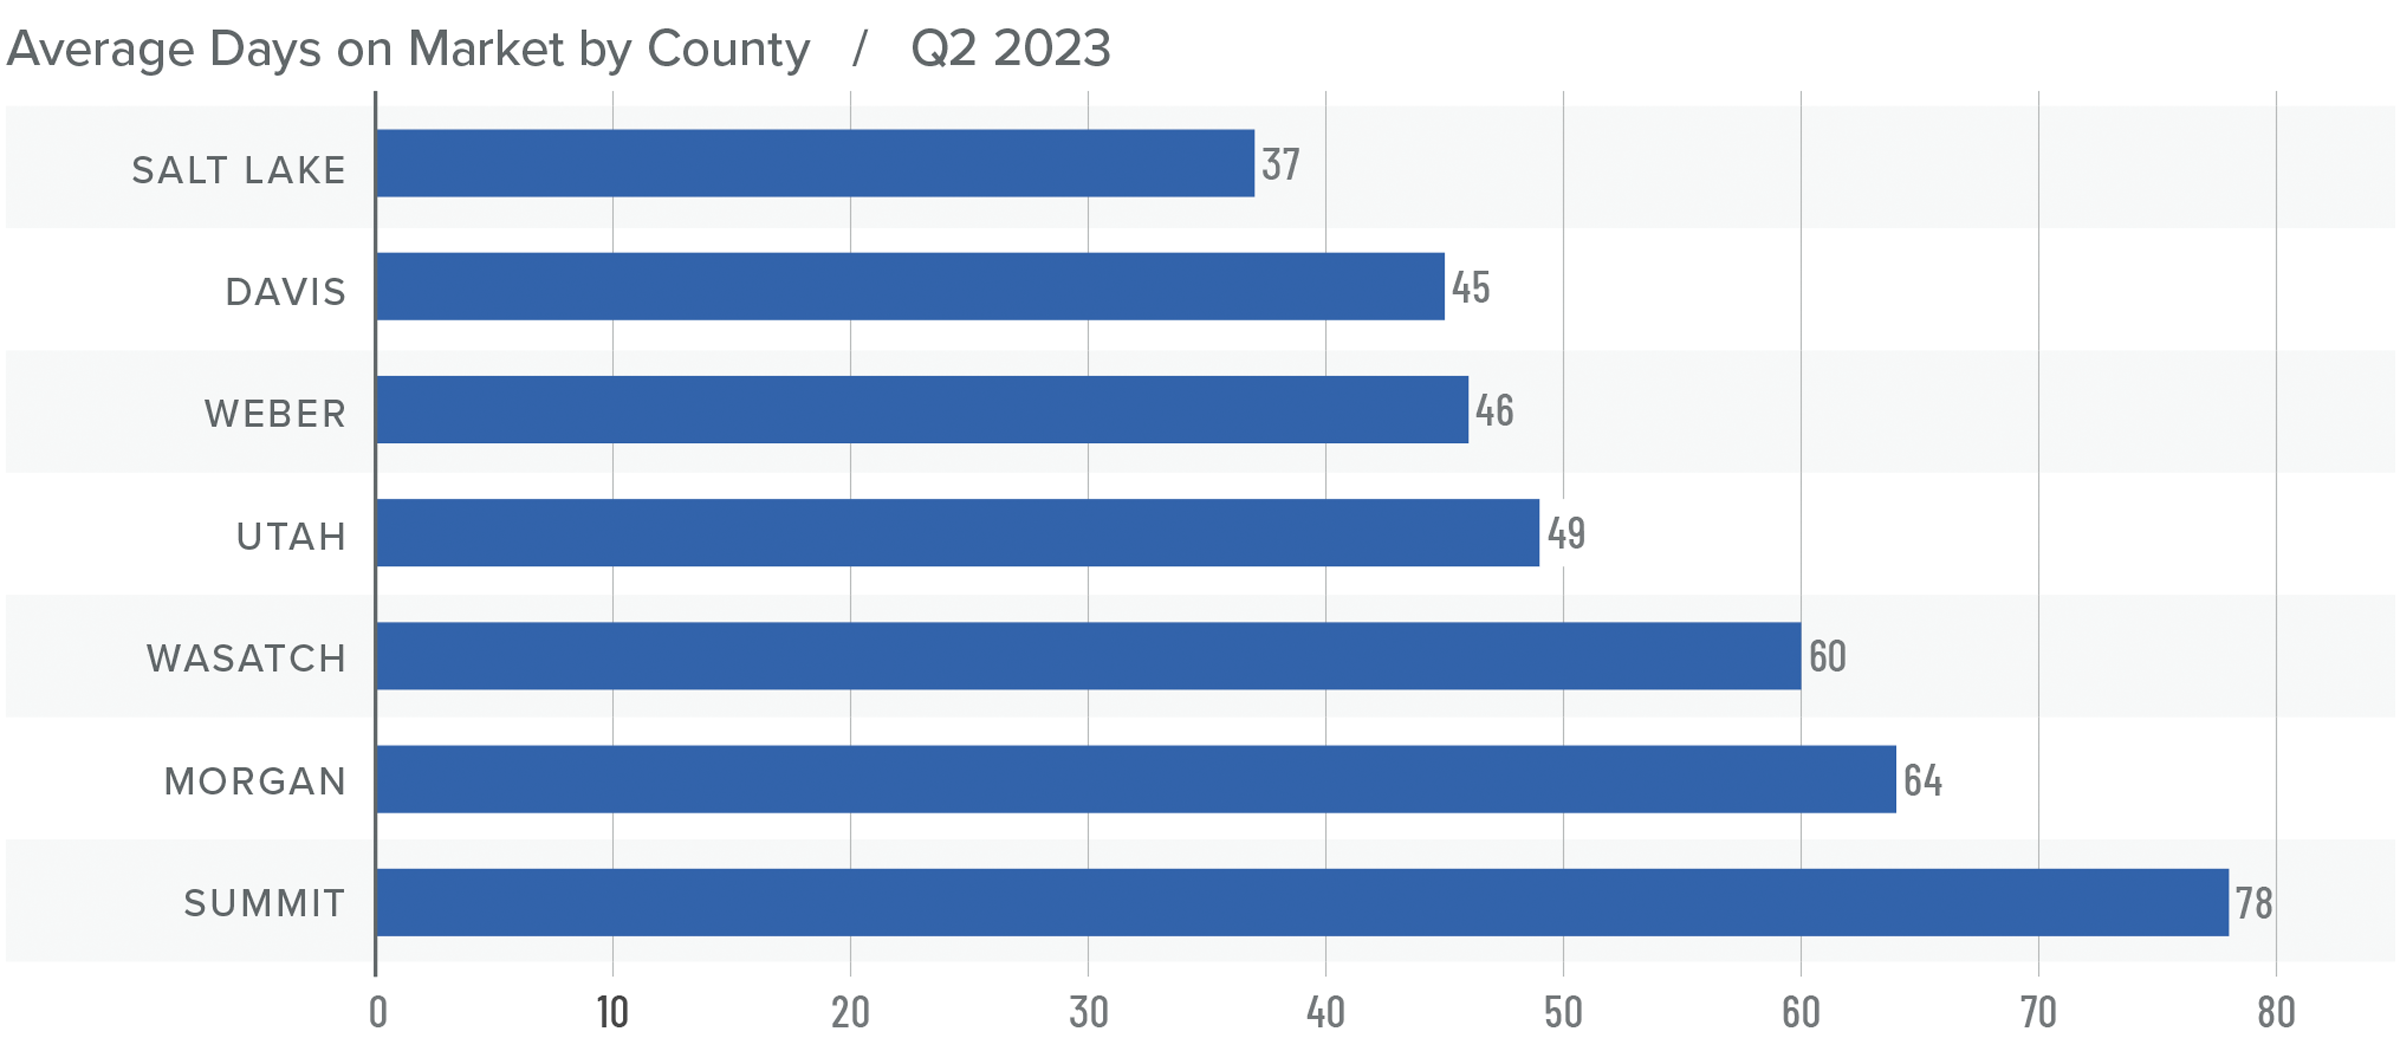
❱ The average time it took to sell a home in the counties covered by this report rose 17 days compared to the same period in 2022.
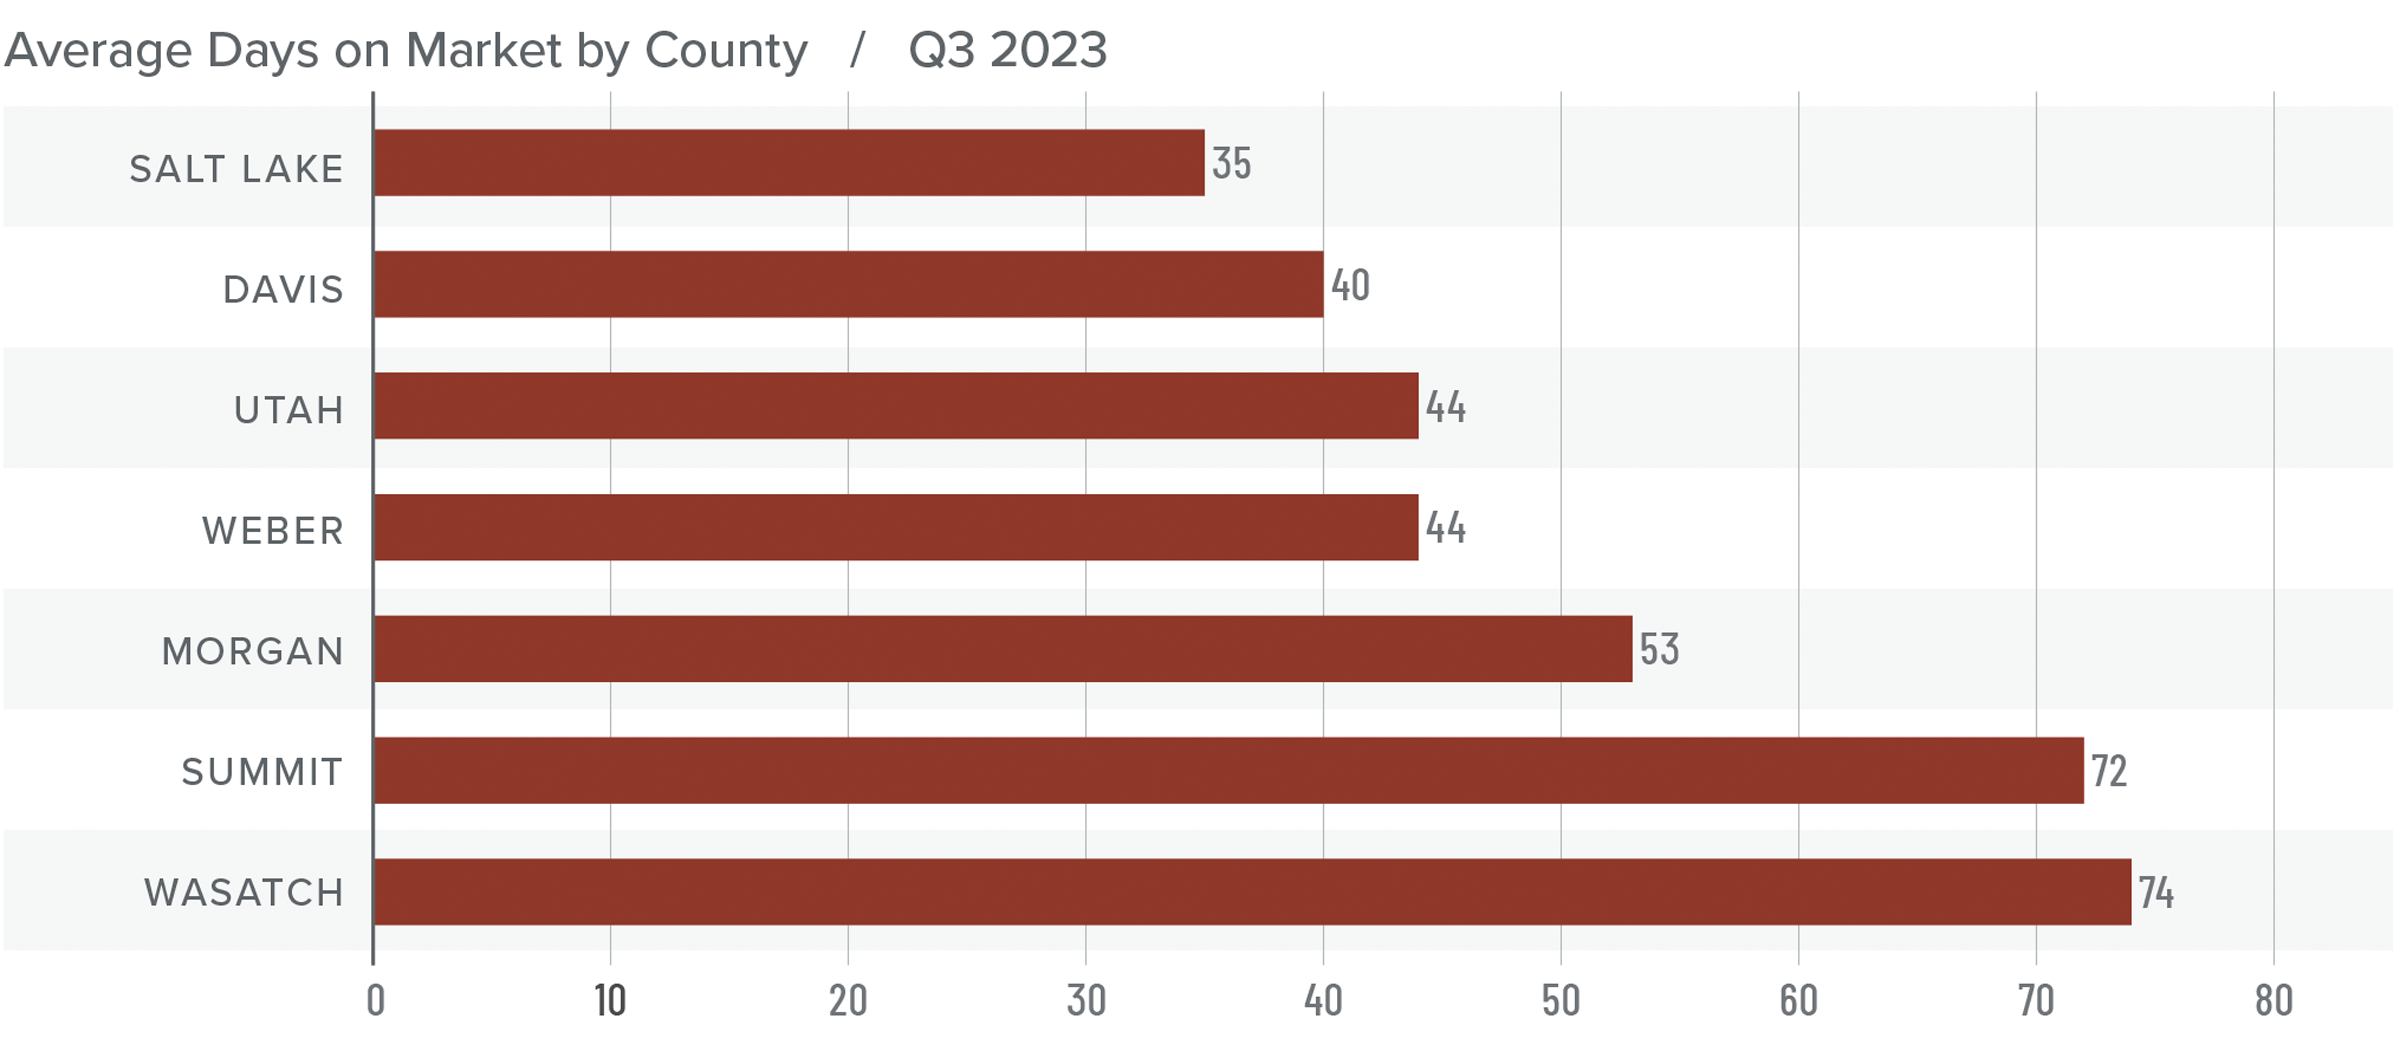
❱ Homes sold fastest in Salt Lake County; Wasatch County was the slowest. All areas saw market time rise compared to the third quarter of 2022, but all counties except Wasatch saw market time fall compared to the second quarter of this year.
❱ During the third quarter, it took an average of 52 days to sell a home. Market time fell three days compared to the second quarter of 2023.
❱ Even when faced with more inventory and higher financing costs, it was impressive to see the length of time it took to sell a home in the region fall, albeit modestly, from the second quarter.
Conclusions
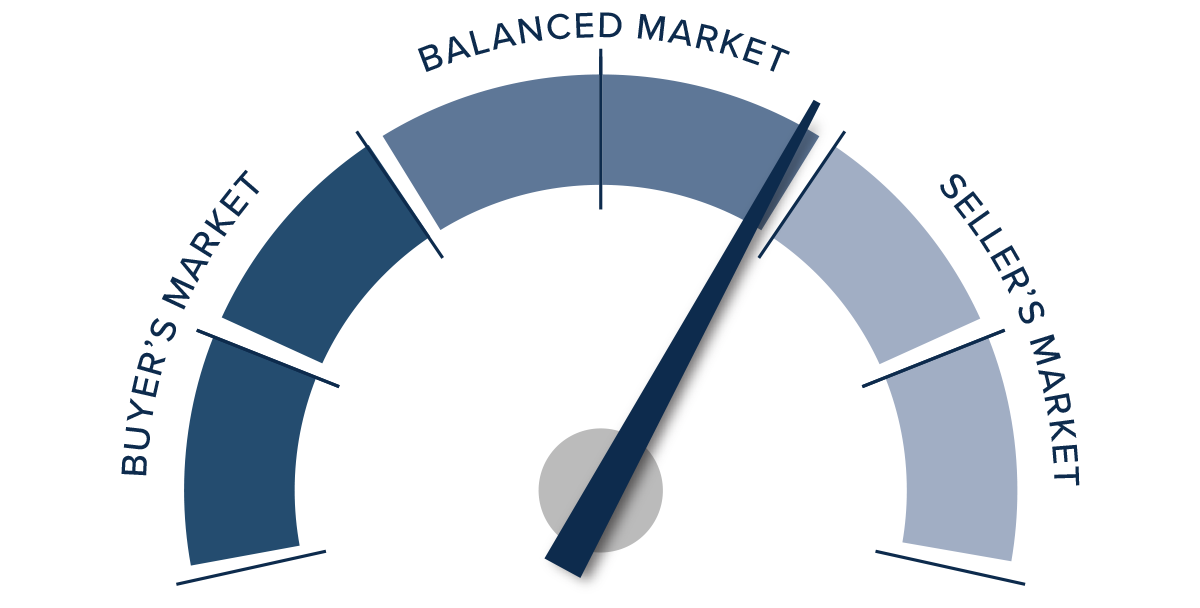
This speedometer reflects the state of the region’s real estate market using housing inventory, price gains, home sales, interest rates, and larger economic factors.
The region saw average market time fall even though the number of available homes rose, which should favor home sellers. That said, closed and pending sales fell, and list price growth was flat.
This suggests that the market is lacking direction, which is to be expected given that mortgage rates are at their highest level in over 20 years. Current buyers are likely weighing whether interest rates will come down and, if they do, how long they’ll have to wait to refinance out of a loan with a rate well above seven percent.
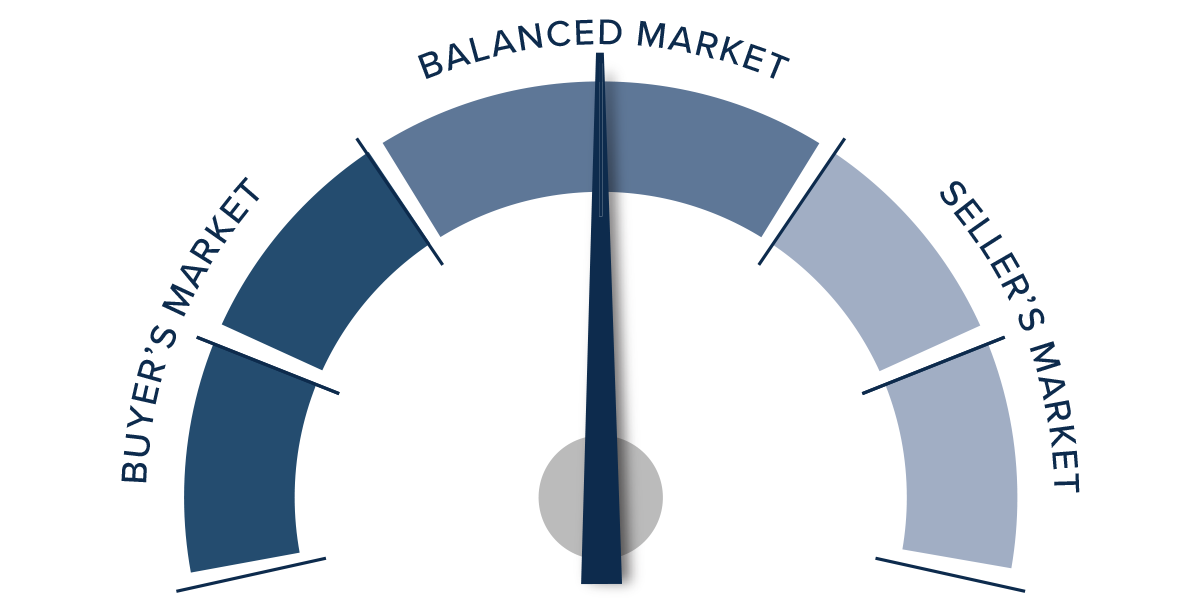
Inventory growth and mortgage rates aside, the market has seen a very significant runup in prices since the start of the pandemic, so it wouldn’t surprise me if both prices and sales remain fairly static for the balance of the year.
As such, the needle moves more toward the middle, with neither buyers nor sellers really having the upper hand.
Q2 2023 Utah Real Estate Market Update

The following analysis of select counties of the Utah real estate market is provided by Windermere Real Estate Chief Economist Matthew Gardner. We hope that this information may assist you with making better-informed real estate decisions. For further information about the housing market in your area, please don’t hesitate to contact your Windermere Real Estate agent.
Regional Economic Overview
Although it slowed in the first quarter of 2023, employment growth has stabilized in Utah. The state added 52,400 jobs over the past 12 months, which represents an annual growth rate of 3.1%. The counties covered by this report added almost 33,000 new jobs over the past year, representing a growth rate of 2.4%. As we saw in the first quarter of the year, the fastest growing county was Summit, which had a 5.8% annual growth rate. The slowest was again Morgan County, where the job level rose 1.6%. Utah’s unemployment rate in May was 2.5%, up .03% from the level in the second quarter of 2022. At the county level, the lowest jobless rate was in Morgan County (1.8%) and the highest was in Weber County, where 2.5% of the workforce was without a job. In aggregate, the unemployment rate within the counties contained in this report was only 2.3%.
Utah Home Sales
❱ In the second quarter, 6,939 homes were sold in the areas covered by this report. This was down 21% compared to the second quarter of 2022 but was 28.3% higher than in the first quarter of this year.
❱ Year over year, sales fell across the board. However, sales increased by double digits in every county covered by this report compared to the first quarter.
❱ It is quite likely that the higher number of homes sold compared to the previous quarter was a result of the impressive increase in the number of homes for sale. Inventory rose 12.6% over the first quarter.
❱ Pending sales rose 14.6% from the first quarter, suggesting that closings in the upcoming quarter will likely rise.
Utah Home Prices
❱ The average sale price in the quarter fell 5.4% from the second quarter of 2022 to $629,289. However, sale prices were 4.1% higher than in the first quarter of 2023.
❱ Median list prices in the second quarter were 8.5% higher than in the first quarter of the year. It’s interesting to see sellers’ continued confidence given the significant increase in mortgage rates the market has experienced.
❱ Year over year, prices rose in Summit County but dropped in the other markets. Compared to the first quarter, prices rose in every county other than Wasatch, where they fell 12.7%.
❱ It was notable that the markets that saw list prices rising were in the more affordable areas. Expensive counties, such as Morgan, Summit, and Wasatch, all had lower median list prices than in the first quarter of this year.
Mortgage Rates
Although they were less erratic than the first quarter, mortgage rates unfortunately trended higher and ended the quarter above 7%. This was due to the short debt ceiling impasse, as well as several economic datasets that suggested the U.S. economy was not slowing at the speed required by the Federal Reserve.
While the June employment report showed fewer jobs created than earlier in the year, as well as downward revisions to prior gains, inflation has not sufficiently slowed. Until it does, rates cannot start to trend consistently lower. With the economy not slowing as fast as expected, I have adjusted my forecast: Rates will hold at current levels in third quarter and then start to trend lower through the fall. Although there are sure to be occasional spikes, my model now shows the 30-year fixed rate breaking below 6% next spring.
Utah Days on Market
❱ The average time it took to sell a home in the counties covered by this report rose 36 days compared to the same period a year ago.
❱ Homes sold fastest in Salt Lake County and slowest in Summit County. All areas saw average market time rise compared to the second quarter of 2022, but market time fell in all areas compared to the first quarter of this year.
❱ During the second quarter, it took an average of 54 days to sell a home. Market time fell 13 days compared to the first quarter of 2023.
❱ It was impressive to see the length of time it took to sell a home in the region fall significantly despite more inventory and higher financing costs.
Conclusions
This speedometer reflects the state of the region’s real estate market using housing inventory, price gains, home sales, interest rates, and larger economic factors.
In the first quarter Gardner Report, I suggested that the region was “very close to bottoming out” in respect to price. It appears I underestimated the resilience of Utah’s housing market. Given all the data presented here, the only thing that favors buyers is that there are more homes for sale. That said, while inventory levels have risen, they remain remarkably low by historic standards. This doesn’t come as a surprise given that 87.6% of all homeowners with a mortgage have rates below 5% and 31.6% have rates at or below 3%. If they don’t have to sell, why would they?
This will keep inventory tight. The only question that remains is how long the market can tolerate high mortgage rates and decreasing affordability. Given all the above factors, I have moved the needle a little more in favor of sellers. I can’t go so far as to suggest that sellers are in a totally dominant position, but they still have the upper hand.
About Matthew Gardner

As Chief Economist for Windermere Real Estate, Matthew Gardner is responsible for analyzing and interpreting economic data and its impact on the real estate market on both a local and national level. Matthew has over 30 years of professional experience both in the U.S. and U.K.
In addition to his day-to-day responsibilities, Matthew sits on the Washington State Governors Council of Economic Advisors; chairs the Board of Trustees at the Washington Center for Real Estate Research at the University of Washington; and is an Advisory Board Member at the Runstad Center for Real Estate Studies at the University of Washington where he also lectures in real estate economics.
Q1 2023 Utah Real Estate Market Update
The following analysis of select counties of the Utah real estate market is provided by Windermere Real Estate Chief Economist Matthew Gardner. We hope that this information may assist you with making better-informed real estate decisions. For further information about the housing market in your area, please don’t hesitate to contact your Windermere Real Estate agent.
Regional Economic Overview
Continuing the trend that started last summer, employment growth in Utah continues to taper. Over the past 12 months, the state added 52,600 jobs. At an annual rate of 3.2%, this was the slowest percentage growth since Utah started recovering jobs post-COVID. Although this is an improvement over the rate in the last quarter, annual adjustments to the data gave early 2023 data a boost. The counties covered by this report added more than 38,600 new jobs over the past year, representing a growth rate of 2.8%. The fastest growing county was Summit, with a 4.8% increase in employment. The slowest was Morgan County, where the job level rose .7%. Utah’s unemployment rate in February was 2.4%, matching the level at the end of 2022. The labor force continues to grow but, so far, it has not caused the jobless rate to rise, which is very impressive.
Utah Home Sales
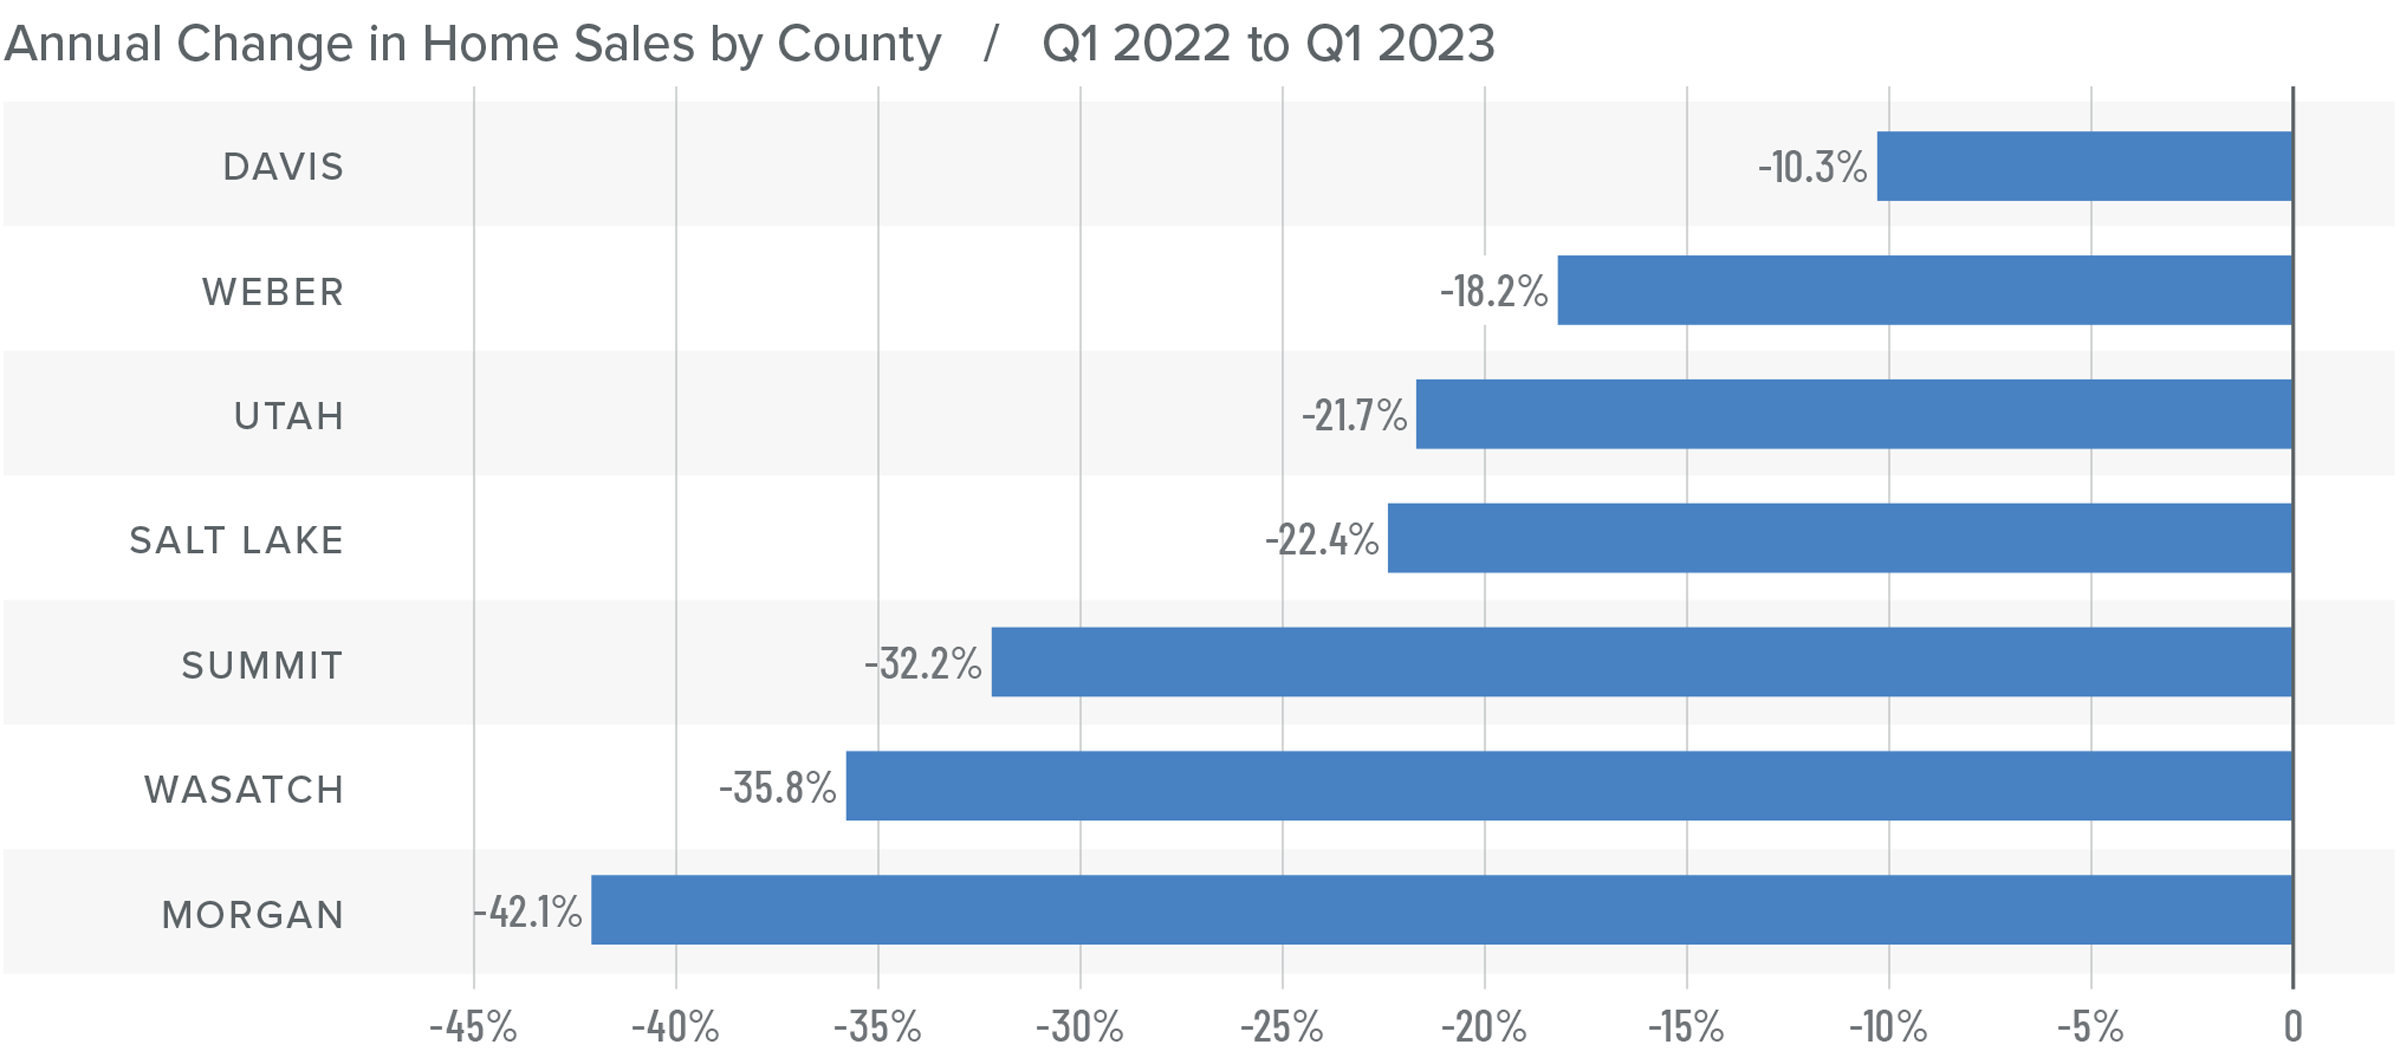
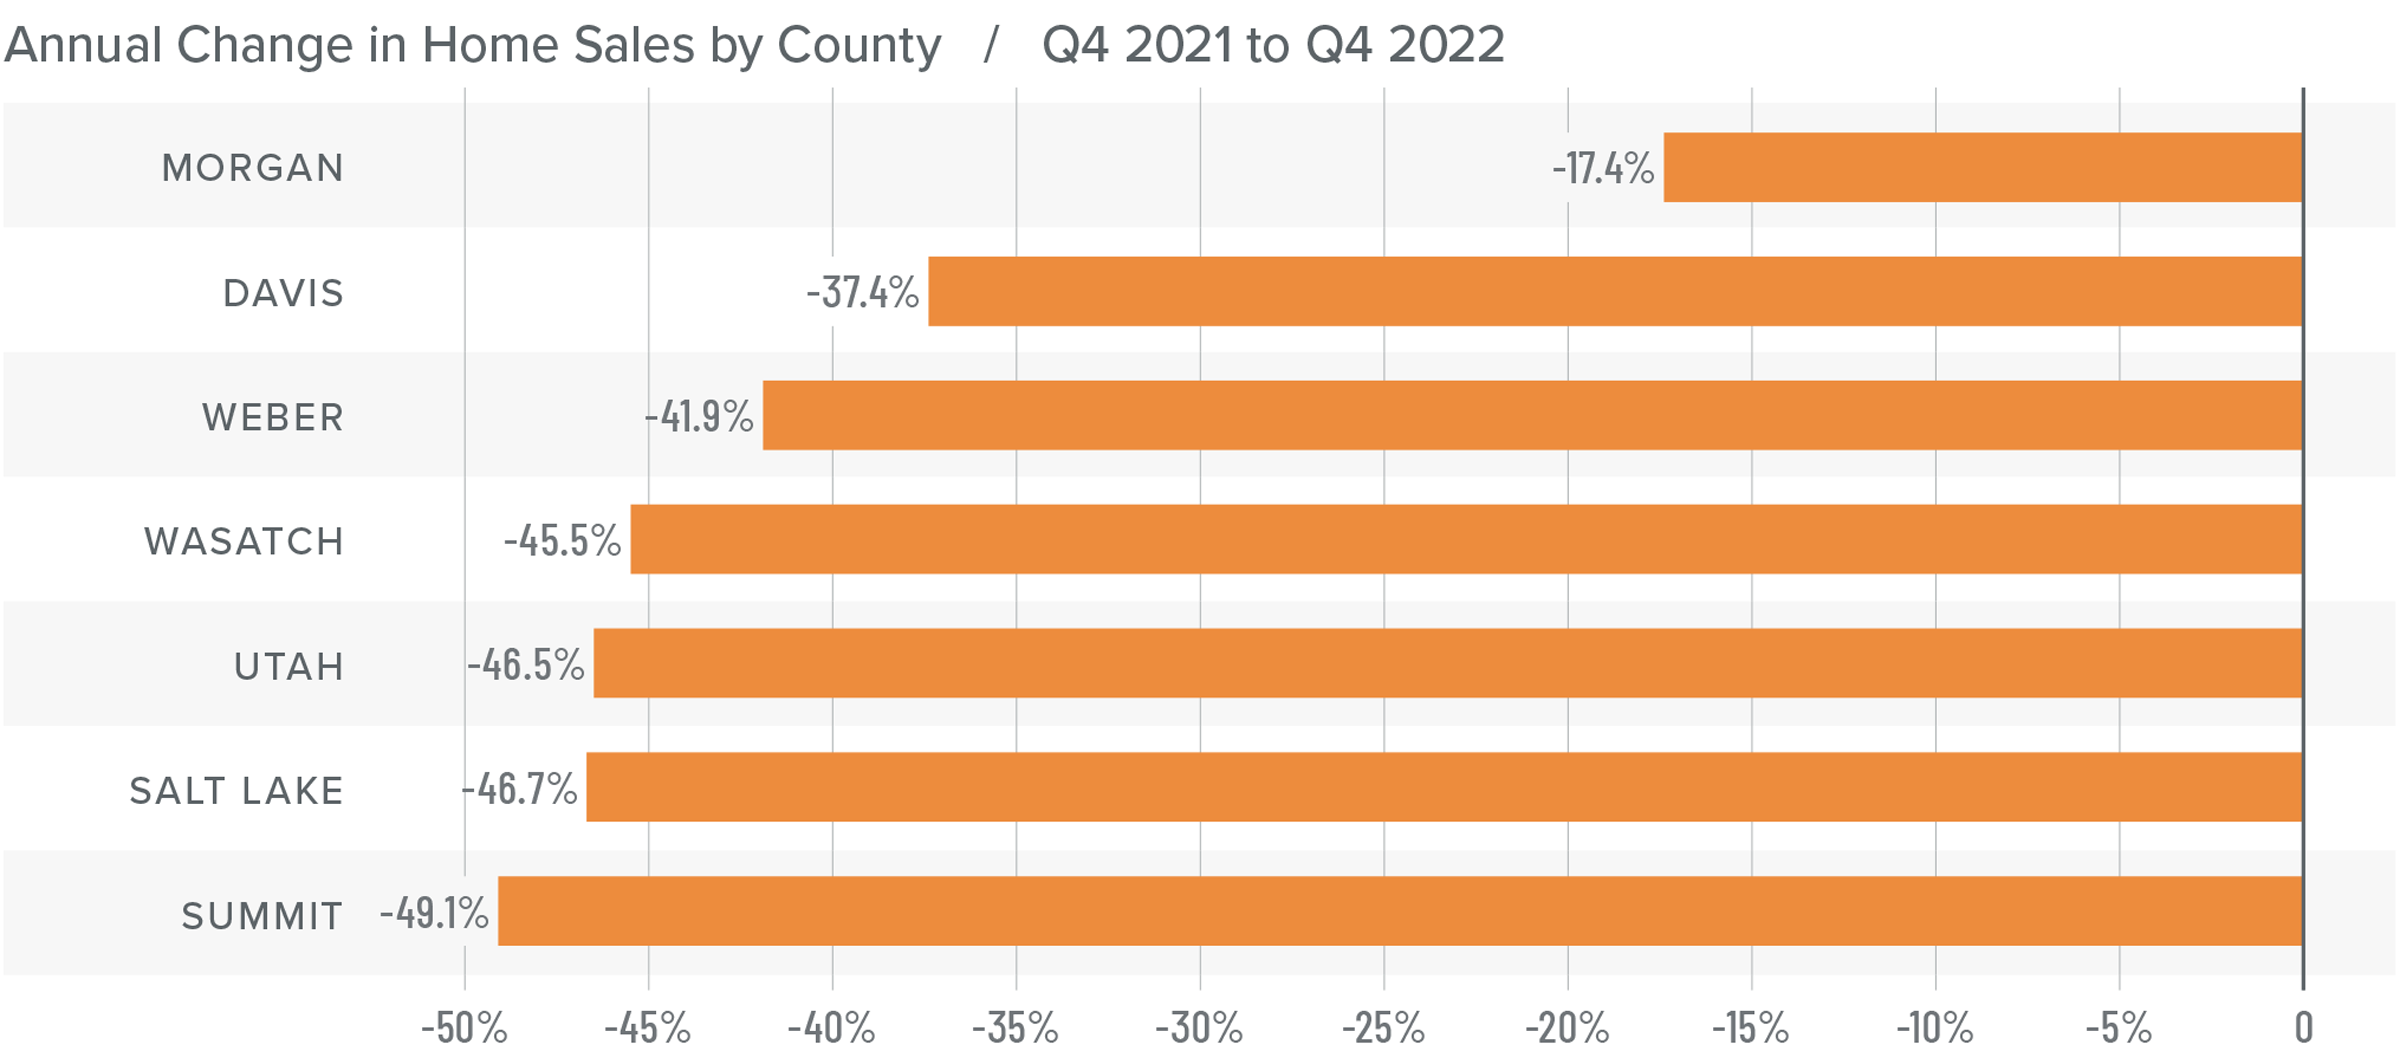
❱ In the first quarter of the year, 5,251 homes sold. This was down 21% compared to the first quarter of 2022. Sales were .2% higher than in the fourth quarter of last year.
❱ Year over year, sales fell across the board. Compared to the fourth quarter, sales rose in Utah and Weber counties but fell in the rest of the market areas covered by this report.
❱ The number of homes for sale plummeted by one third when compared to the fourth quarter of 2022, making any increase in sales rather impressive.
❱ Pending sales jumped 38.3% from the fourth quarter, suggesting that closings in the second quarter of this year may rise further.
Utah Home Prices
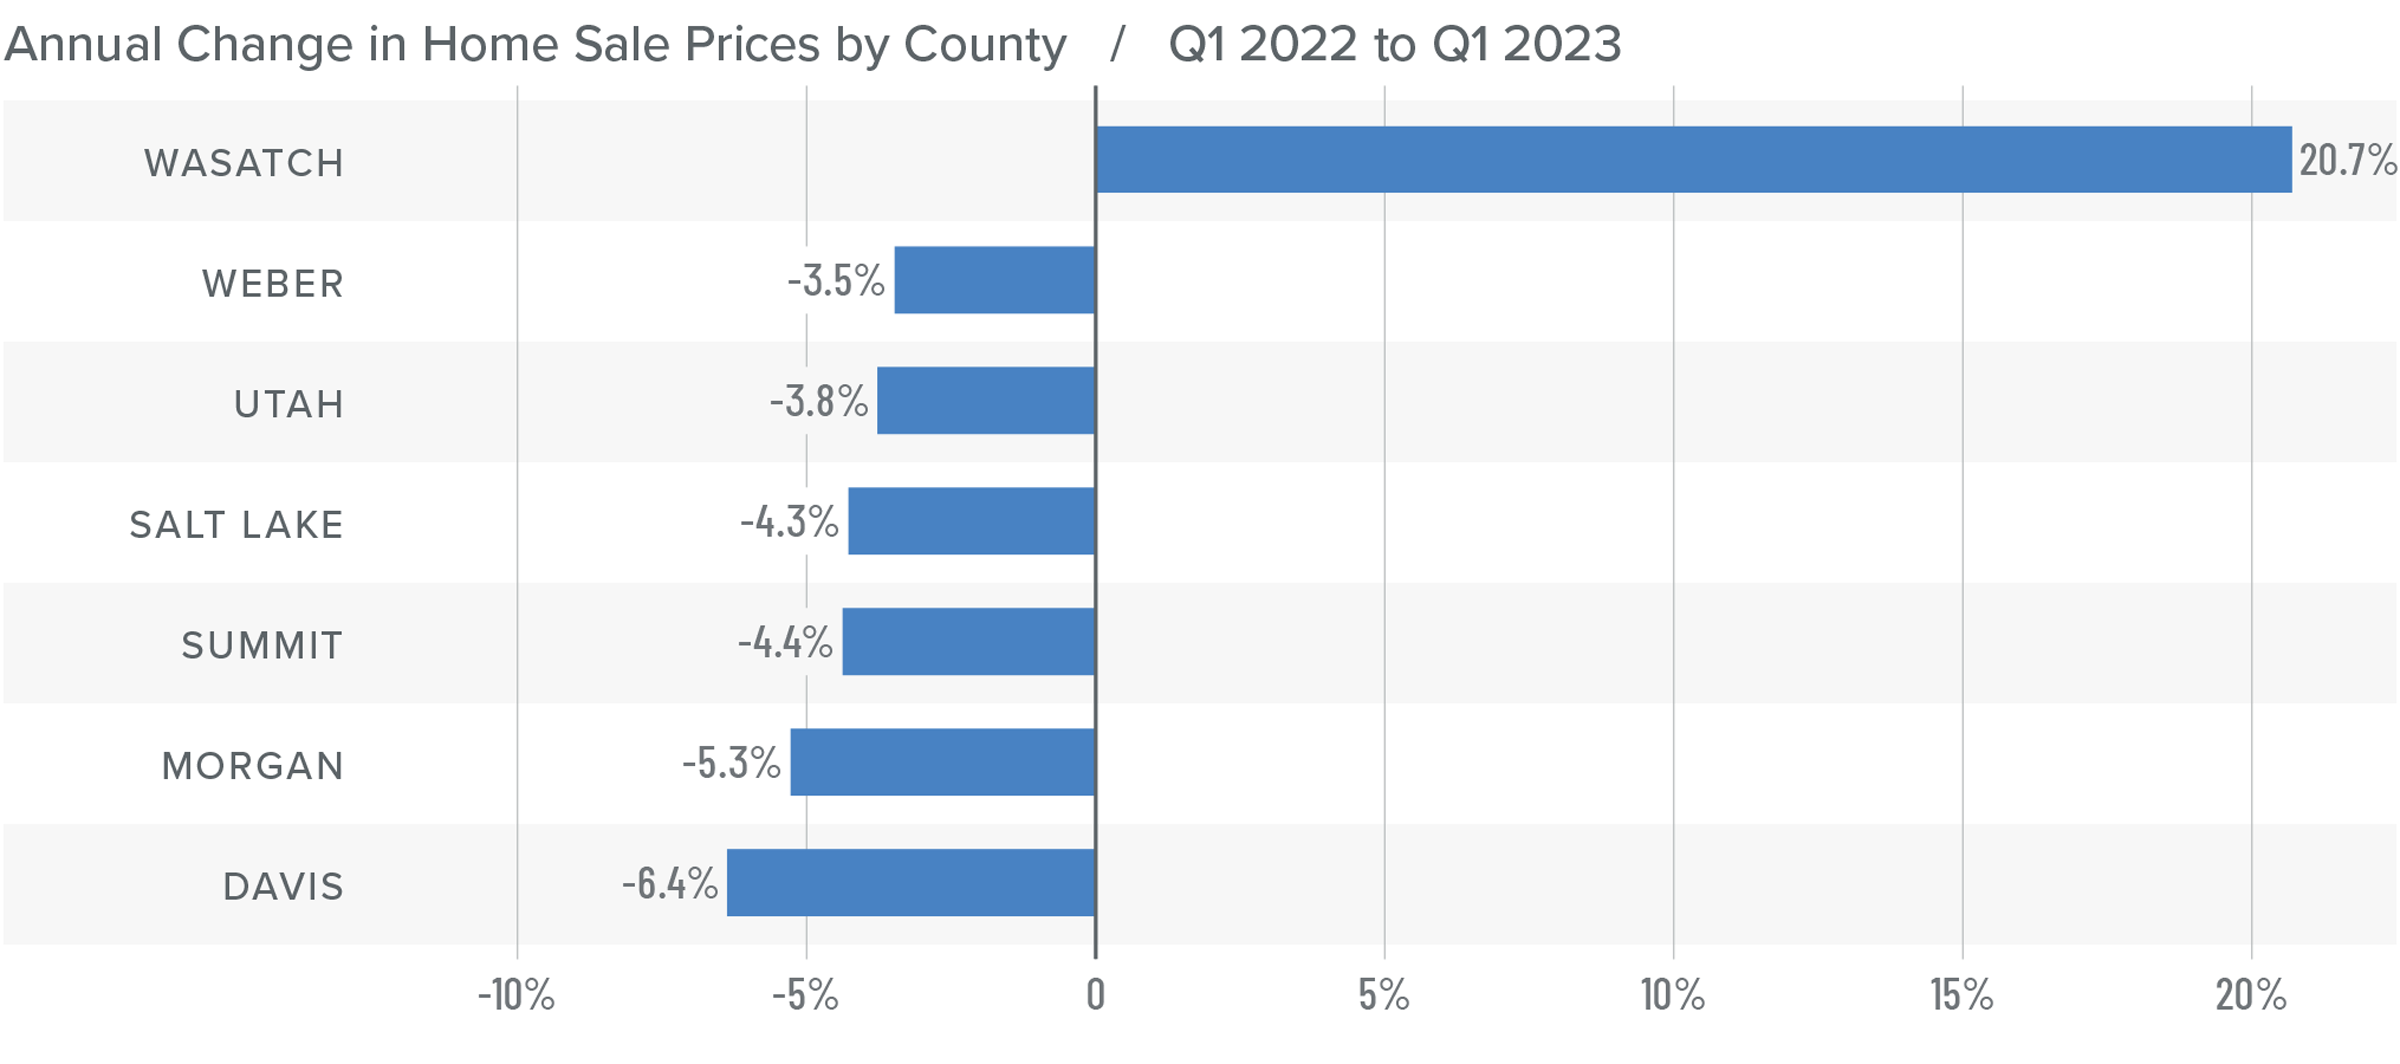
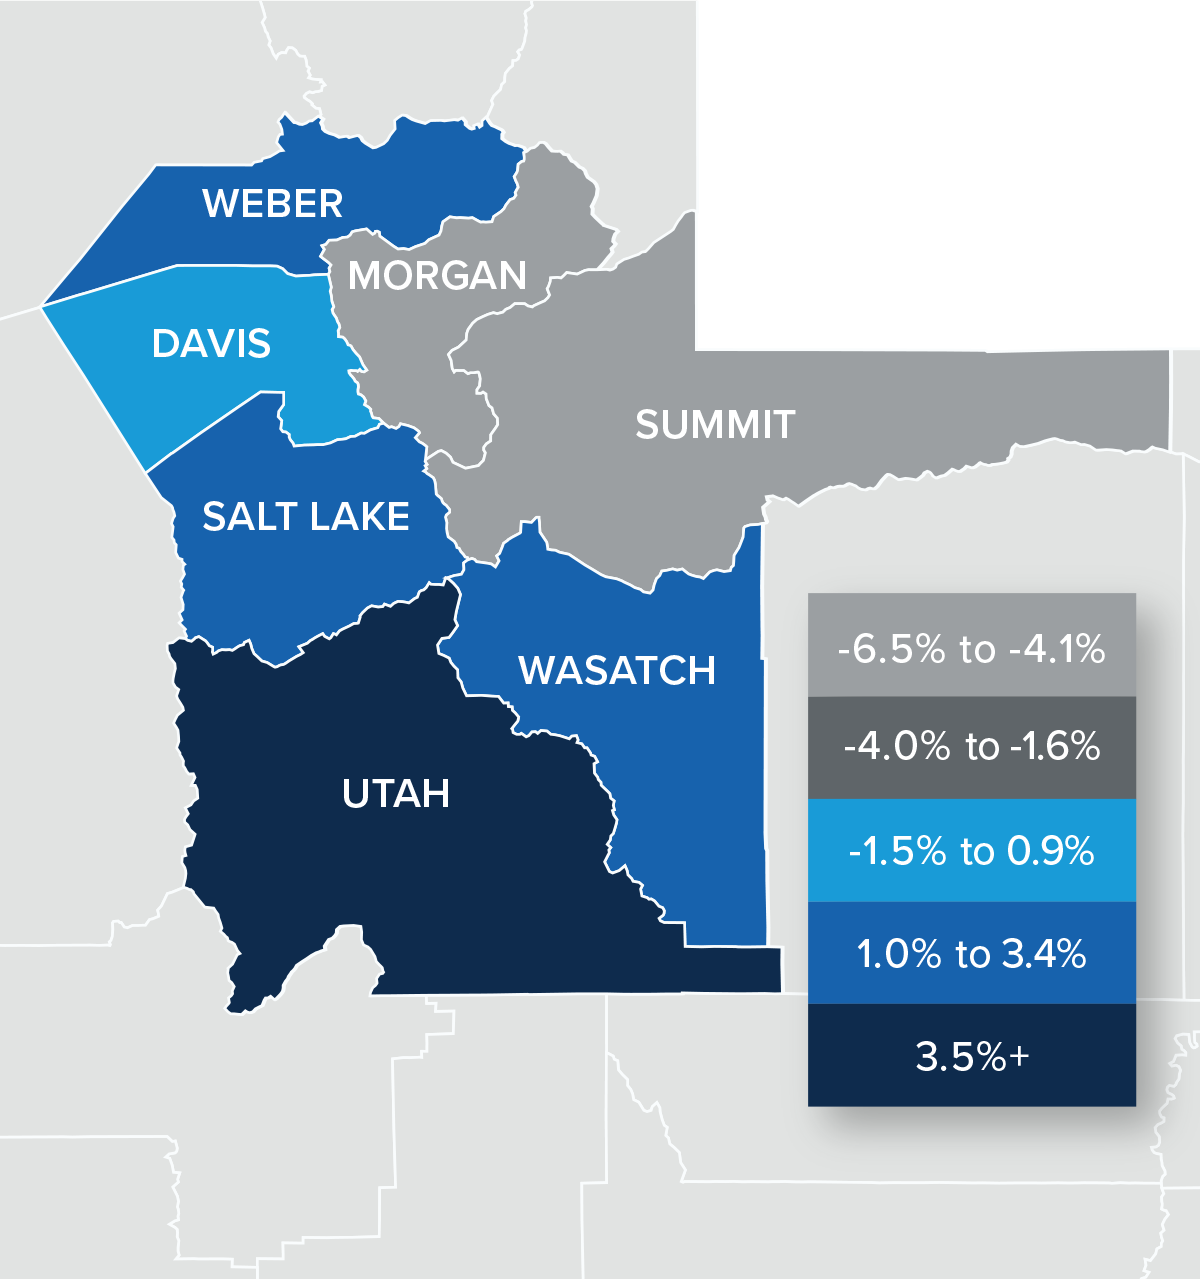
❱ The average sale price in the first quarter of the year fell 5.3% compared to the first quarter of 2022 to $603,340. Prices were also .1% lower than in the fourth quarter of 2022.
❱ Median listing prices in the first quarter were 3.7% higher than at the end of last year, suggesting that home sellers remain confident about the spring market. Of the counties covered by this report, only Wasatch and Morgan counties saw listing prices fall compared to the prior quarter.
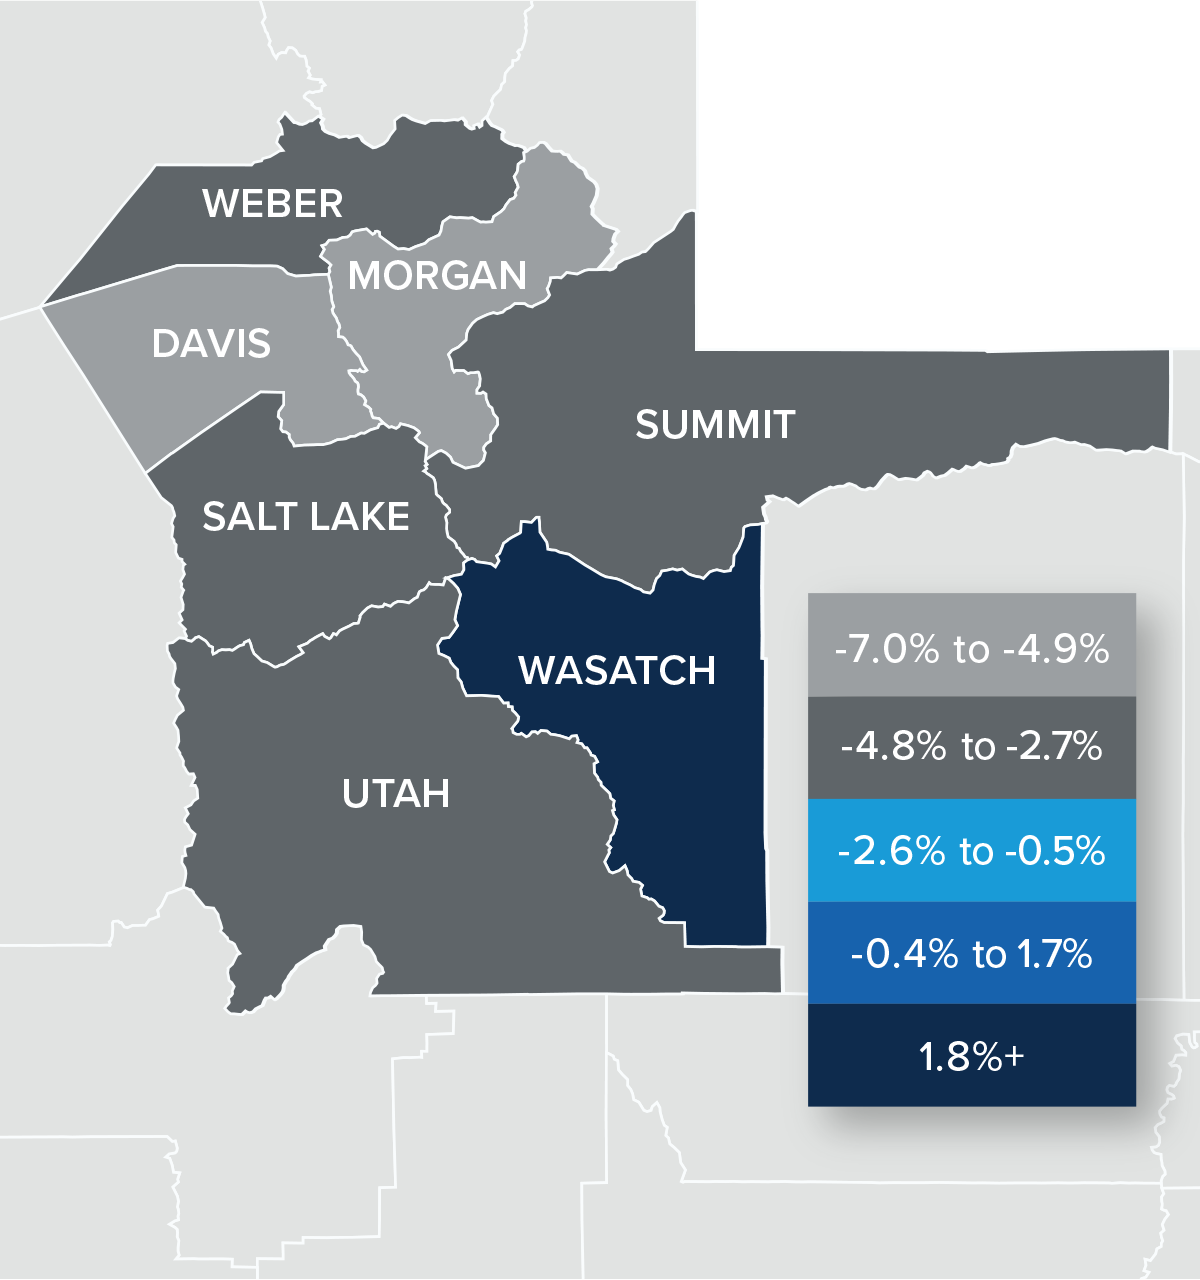
❱ Year over year, prices rose in Wasatch County but fell in the other markets. Compared to the fourth quarter of 2022, prices rose in Morgan, Summit, and Wasatch counties.
❱ The market is correcting. Although this may not be something sellers want to see, it is important to return to some sense of normalcy following the frantic, low-mortgage-rate-induced market of the pandemic period. There will be a relatively modest decline in prices in the coming months, but I expect home values to rise again in the second half of this year.
Mortgage Rates
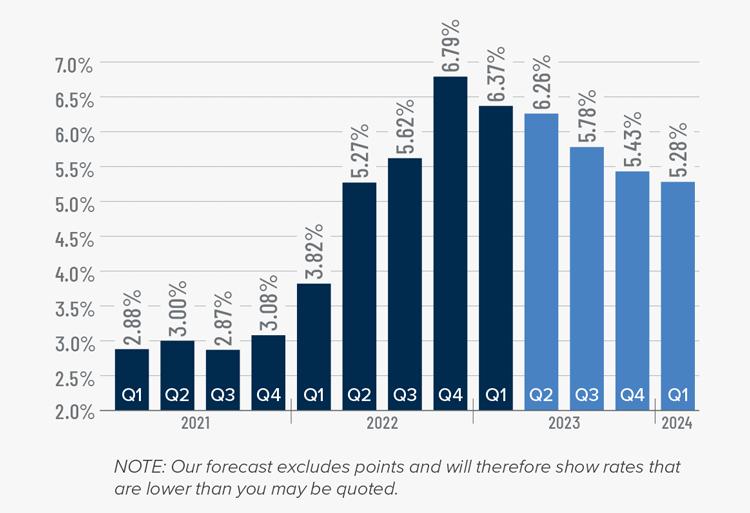
Rates in the first quarter of 2023 were far less volatile than last year, even with the brief but significant impact of early March’s banking crisis. It appears that buyers are jumping in when rates dip, which was the case in mid-January and again in early February.
Even with the March Consumer Price Index report showing inflation slowing, I still expect the Federal Reserve to raise short-term rates one more time following their May meeting before pausing rate increases. This should be the catalyst that allows mortgage rates to start trending lower at a more consistent pace than we have seen so far this year. My current forecast is that rates will continue to move lower with occasional spikes, and that they will hold below 6% in the second half of this year.
Utah Days on Market
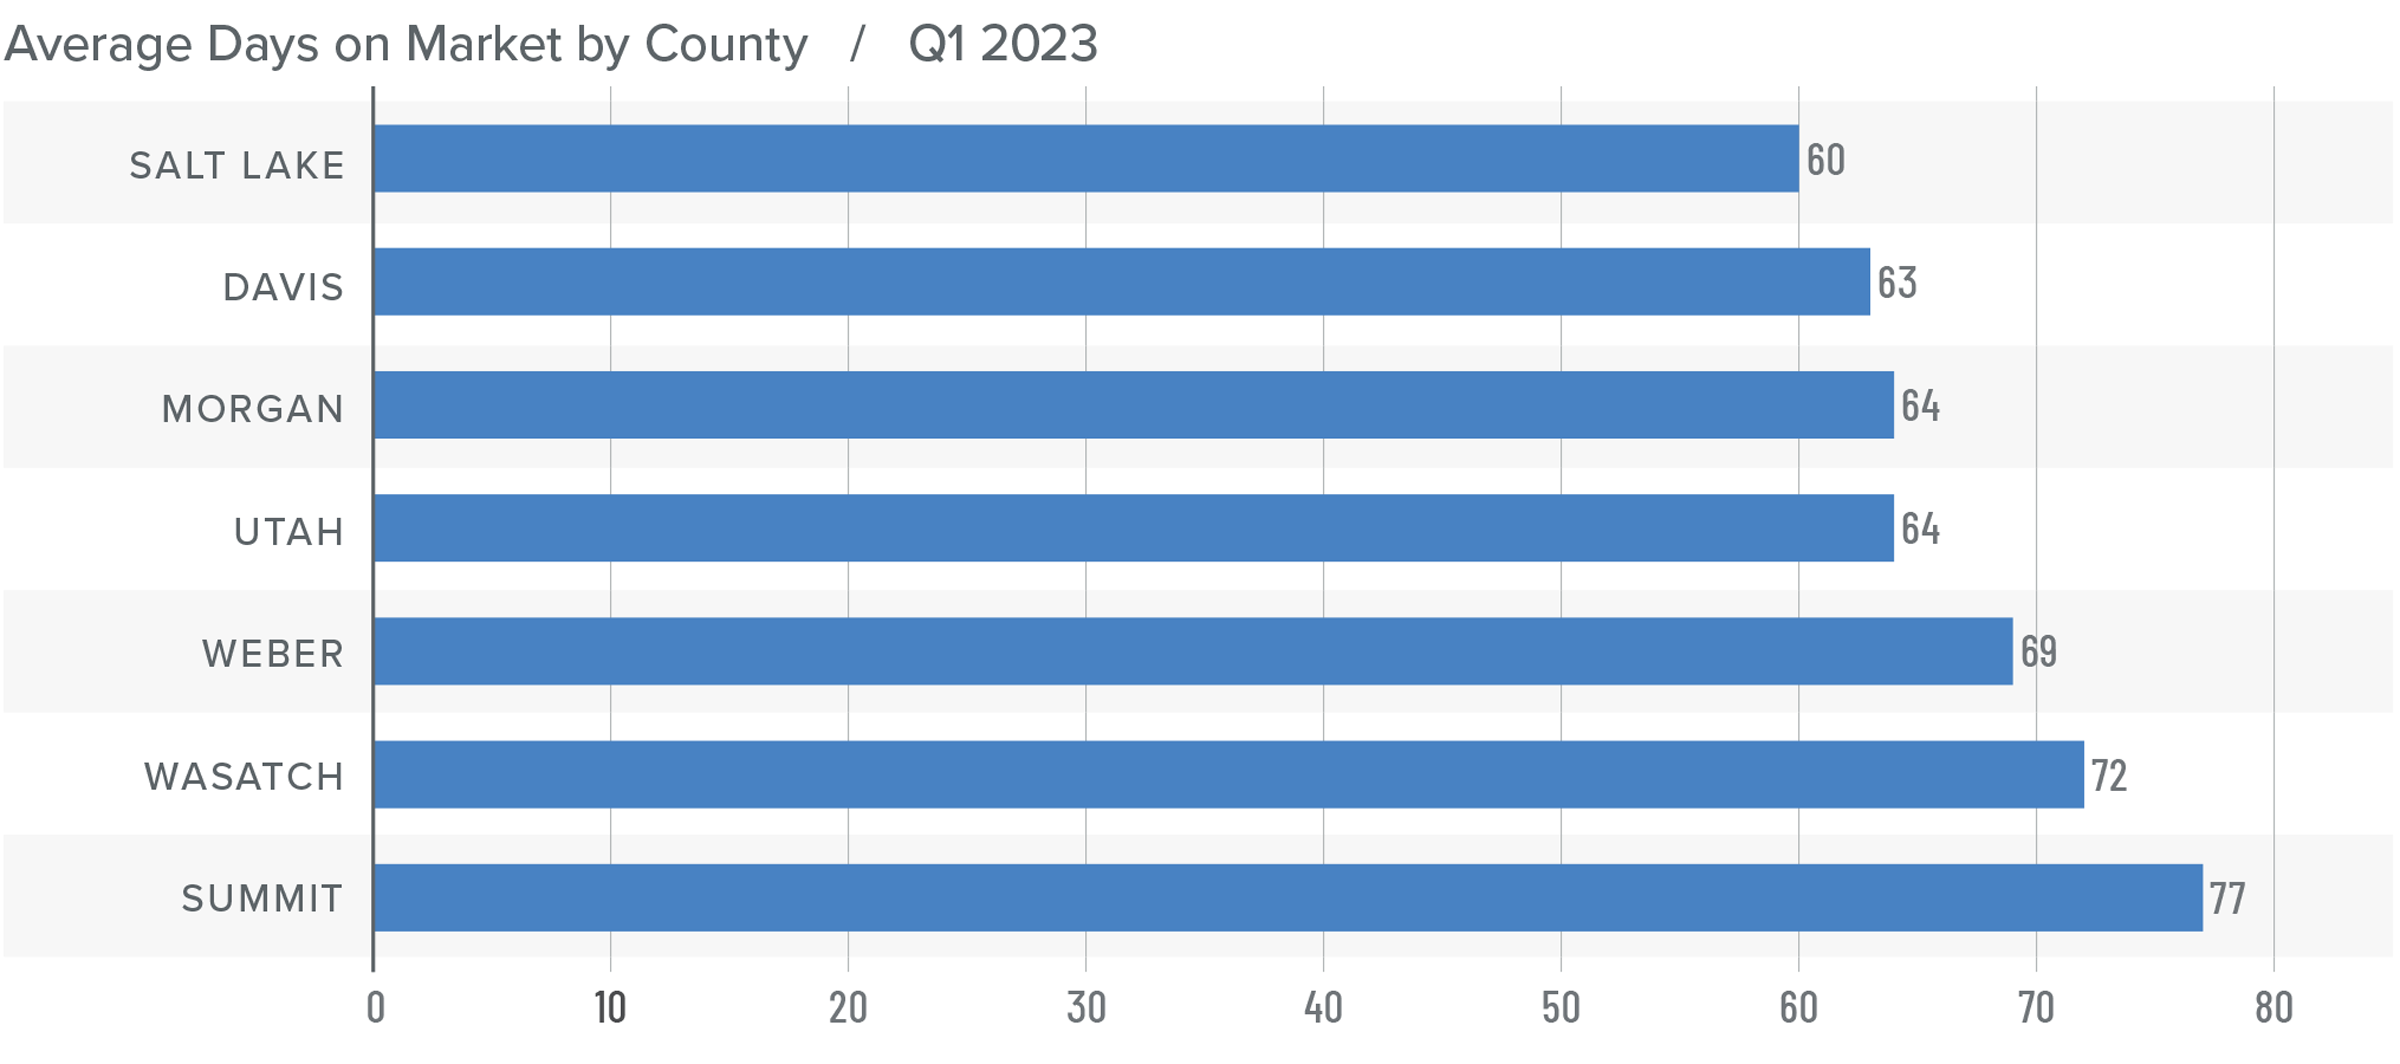
❱ The average time it took to sell a home in the counties covered by this report rose 42 days compared to the same period in 2022.
❱ Homes again sold fastest in Salt Lake County and slowest in Summit County. All areas saw average market time rise compared to the prior quarter as well as the same quarter in 2022.
❱ During the quarter, it took an average of 67 days to sell a home, which was an increase of 9 days compared to the final quarter of 2022.
❱ Although average market time rose compared to the fourth quarter of last year, the increase was not significant. Lower inventory levels may lead to market time pulling back again as we get into the spring months, or at least levelling out.
Conclusions
This speedometer reflects the state of the region’s real estate market using housing inventory, price gains, home sales, interest rates, and larger economic factors.
Higher financing costs and lower affordability rates are acting as headwinds in the housing market, which is offsetting the benefit that housing normally sees from a growing economy. I have stated previously that home prices in Utah would continue to moderate but that a major downward correction was unlikely. That prediction appears to have been accurate. I believe that the market is very close to bottoming out given low inventory levels, rising pending and closed sales, and higher listing prices—all of which benefit home sellers. That said, lower home prices and longer days on market tend to favor home buyers.
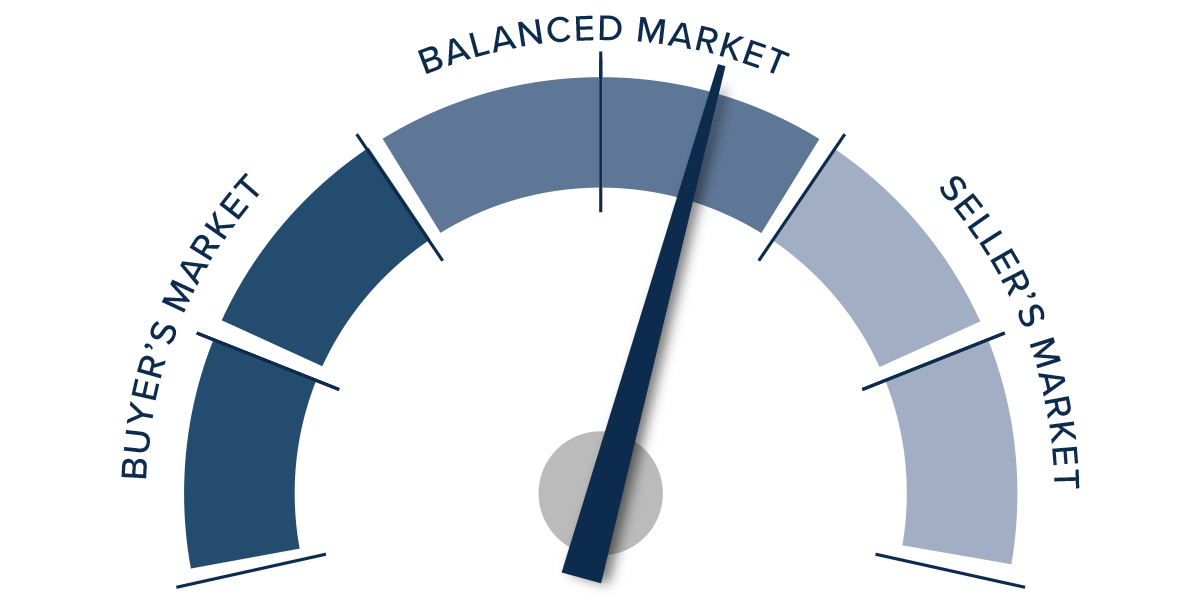
Ultimately, I would describe the market as balanced, but I am tilting the needle just a little in favor of sellers. I expect that mortgage rates will start to stabilize as we move through the spring and then start to drop a little. If this occurs and inventory levels do not rise significantly, then we will certainly be back in a position that more firmly favors home sellers.
About Matthew Gardner
As Chief Economist for Windermere Real Estate, Matthew Gardner is responsible for analyzing and interpreting economic data and its impact on the real estate market on both a local and national level. Matthew has over 30 years of professional experience both in the U.S. and U.K.
In addition to his day-to-day responsibilities, Matthew sits on the Washington State Governors Council of Economic Advisors; chairs the Board of Trustees at the Washington Center for Real Estate Research at the University of Washington; and is an Advisory Board Member at the Runstad Center for Real Estate Studies at the University of Washington where he also lectures in real estate economics.
Q4 2022 Utah Real Estate Market Update

The following analysis of select counties of the Utah real estate market is provided by Windermere Real Estate Chief Economist Matthew Gardner. We hope that this information may assist you with making better-informed real estate decisions. For further information about the housing market in your area, please don’t hesitate to contact your Windermere Real Estate agent.
Regional Economic Overview
Utah’s economy continues to add jobs, but the pace of growth has started to slow. Over the past 12 months, the state added 43,300 jobs. At an annual rate of 2.6%, this was the slowest pace of growth since the state started recovering jobs post-COVID. The counties covered by this report added more than 35,000 new jobs over the past year, which was also a growth rate of 2.6%. The state’s unemployment rate in November was 2.2%. This was marginally below the rate of the prior year but impressive all the same. It is equally impressive to see that the unemployment rate remained at a very low level even as the state added over 52,400 people to the workforce.
Utah Home Sales
❱ In the final quarter of 2022, 5,145 homes sold in the areas covered by this report. This was down 45% compared to the same period the previous year and down 27.8% compared to the third quarter of 2022.
❱ Sales fell across the board compared to both the fourth quarter of 2021 and the third quarter of 2022.
❱ Inventory levels have skyrocketed, with the average number of homes on the market up a remarkable 248% from the same period in 2021. Listing activity fell 8.3% from the third quarter, but that wasn’t surprising given seasonal factors.
❱ Significantly higher inventory levels gave buyers a lot more options than they have become accustomed to. This, combined with higher mortgage rates, likely impacted sales in the fourth quarter.
Utah Home Prices
❱ The average sale price in the fourth quarter rose a modest .6% from the fourth quarter of 2021 to $604,105. Prices were 3.7% lower than in the third quarter of 2022.
❱ Median listing prices were 3.6% lower than in the third quarter, suggesting that higher financing costs may have created a price ceiling. That said, listing prices were higher in Morgan, Wasatch, and Summit counties compared to the prior quarter.
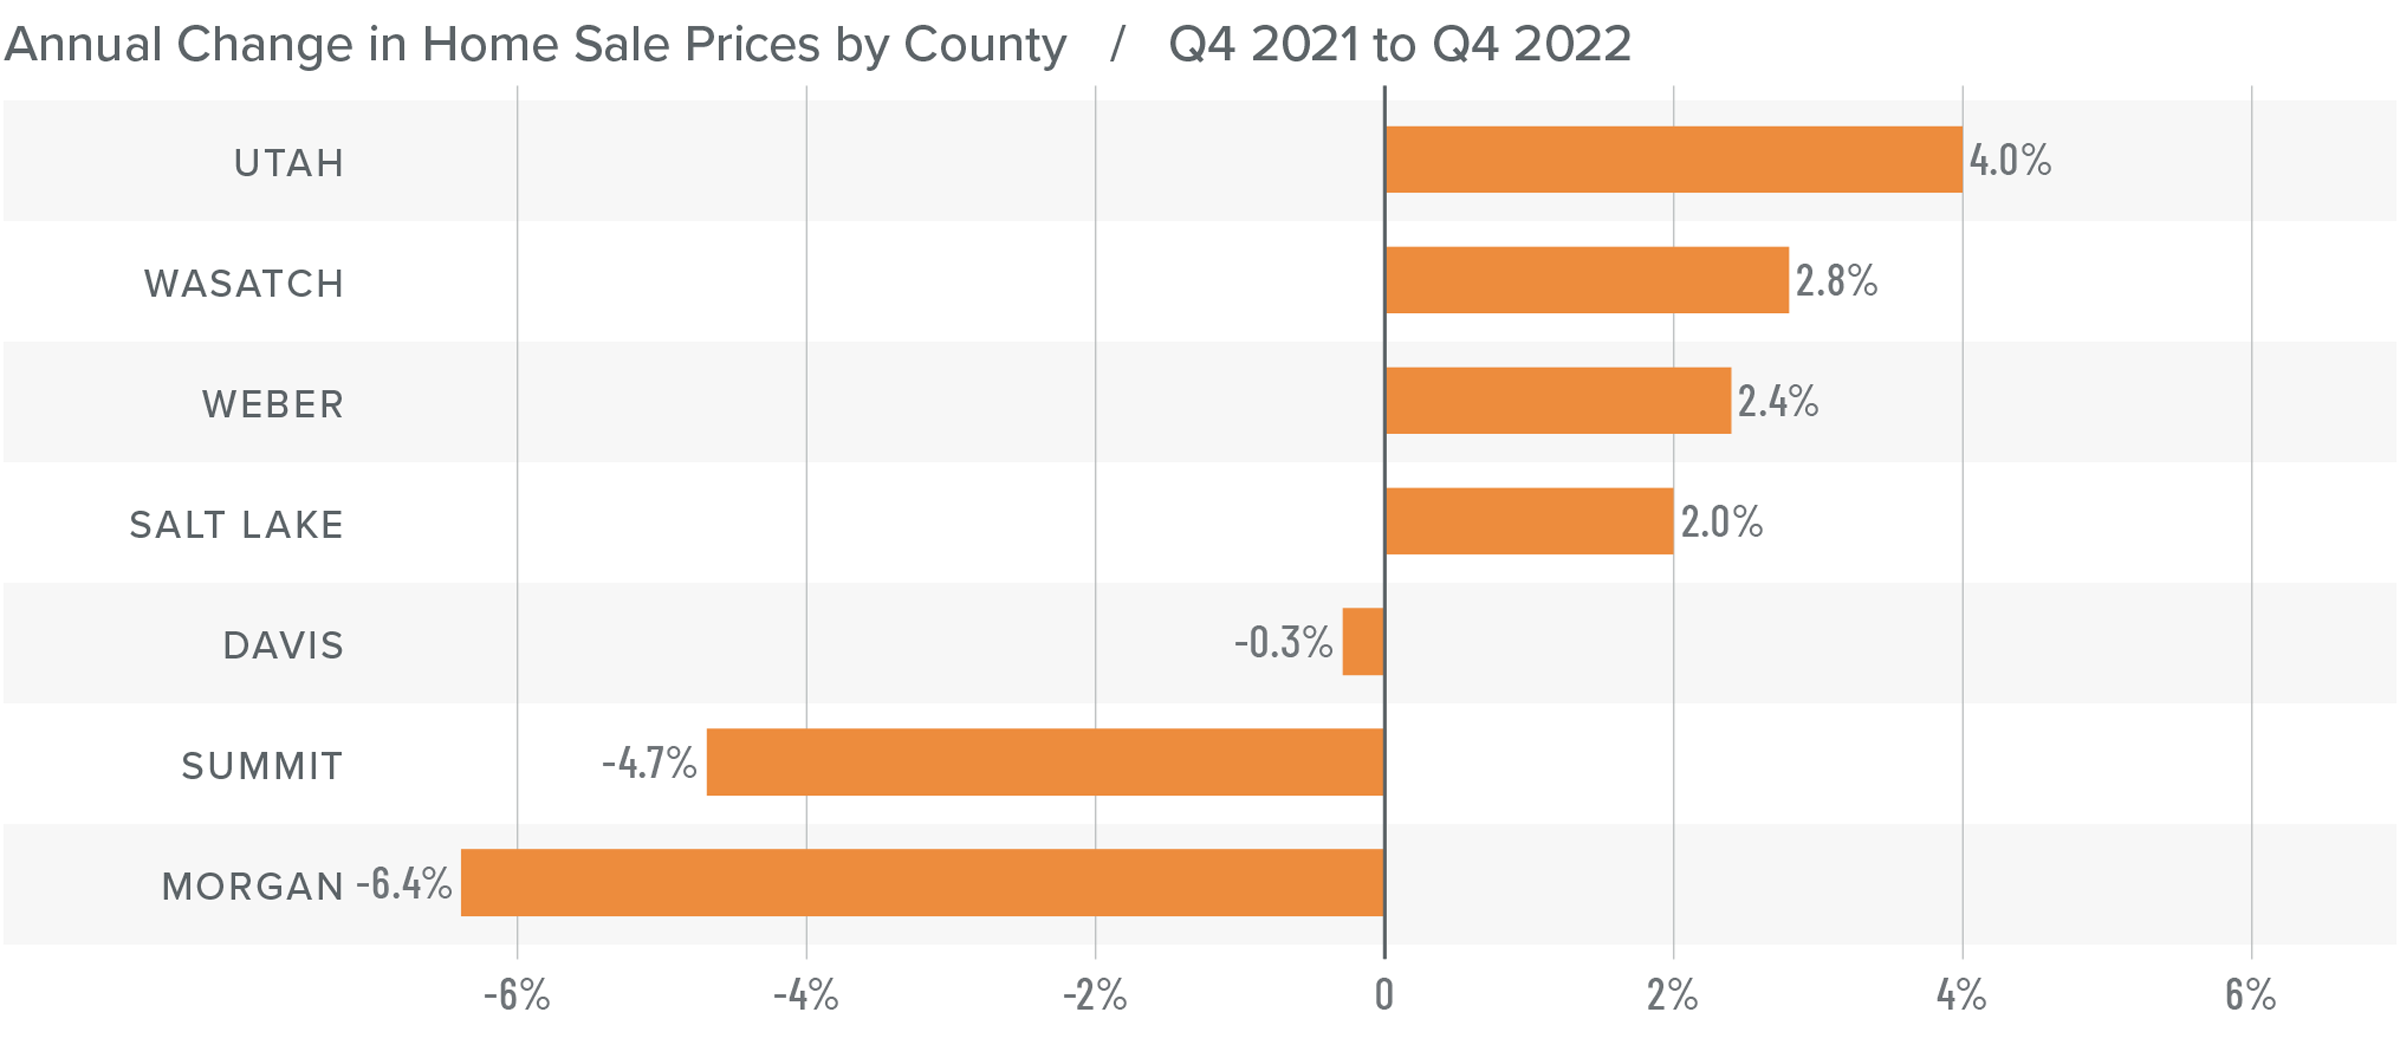
❱ Year over year, prices rose in four markets but pulled back in the other three. Compared to the third quarter of 2022, average home prices fell in every area other than Summit County, where they rose .8%.
❱ The bull market that has been in place for quite some time appears to have lost its momentum. I am not concerned by this and expect the market to moderate as it comes to terms with higher financing costs.
Mortgage Rates
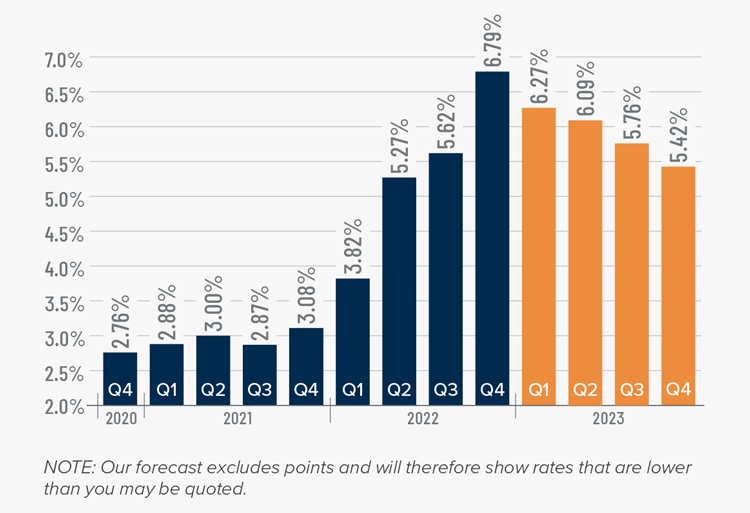
Rates rose dramatically in 2022, but I believe that they have now peaked. Mortgage rates are primarily based on the prices and yields of bonds, and while bonds take cues from several places, they are always impacted by inflation and the economy at large. If inflation continues to fall, as I expect it will, rates will continue to drop.
My current forecast is that mortgage rates will trend lower as we move through the year. While this may be good news for home buyers, rates will still be higher than they have become accustomed to. Even as the cost of borrowing falls, home prices in expensive markets will probably fall a bit more to compensate for rates that will likely hold above 6% until early summer.
Utah Days on Market
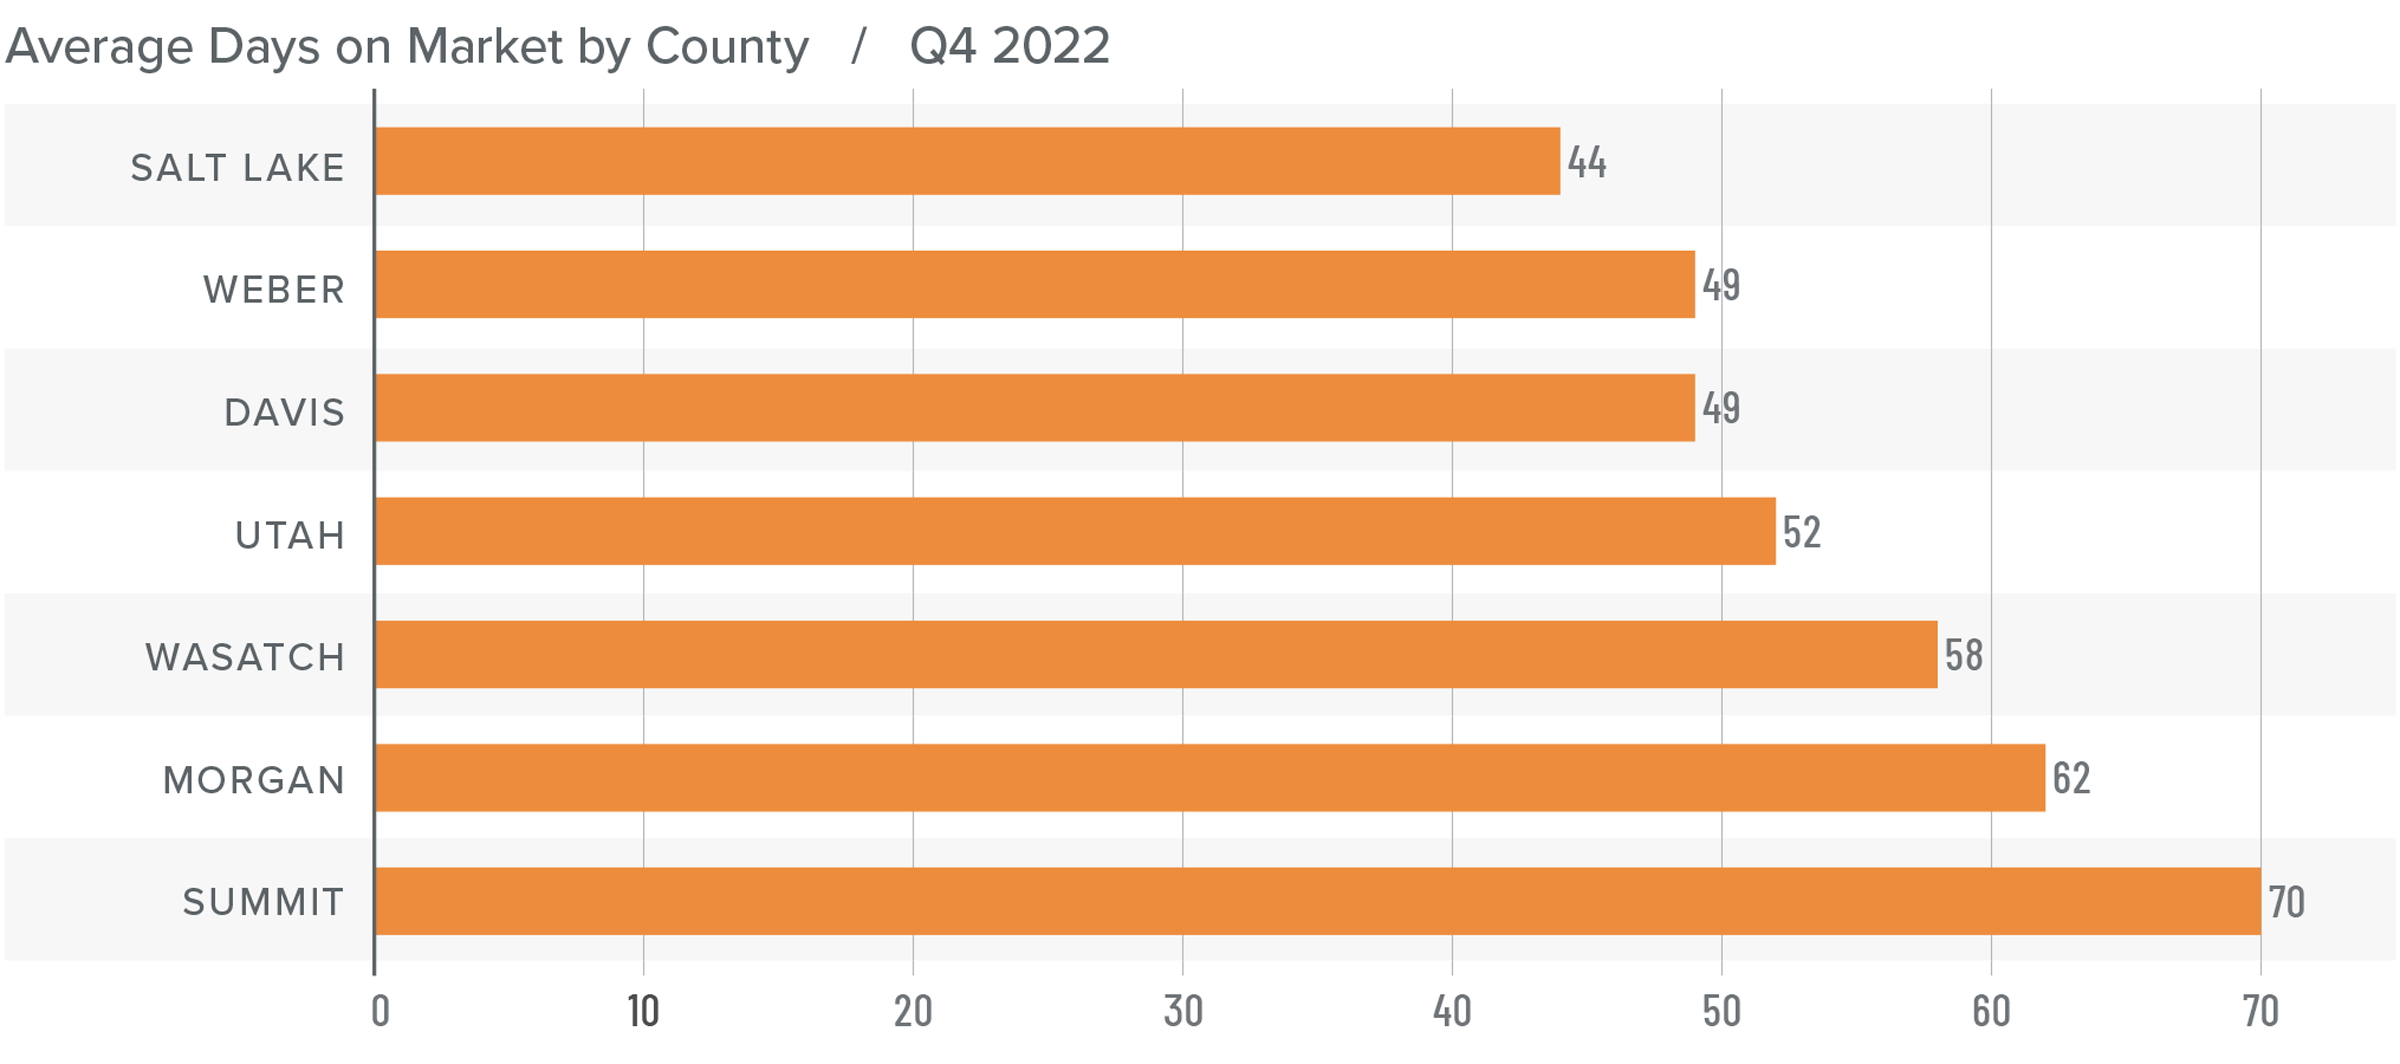
❱ The average time it took to sell a home in the counties covered by this report rose 27 days compared to the same period in 2021.
❱ Homes sold fastest in Salt Lake County and slowest in Summit County. All areas saw average market time rise compared to the third quarter of 2022 as well as the fourth quarter of 2021.
❱ It took an average of 55 days to sell a home during the fourth quarter. Market time rose 22 days from the third quarter of 2022.
❱ It is likely that home buyers are waiting for asking prices to fall further and hoping that mortgage rates do the same.
Conclusions
This speedometer reflects the state of the region’s real estate market using housing inventory, price gains, home sales, interest rates, and larger economic factors.
The state’s economy is still performing very well, but this is not enough to push the housing market forward at the pace we saw during the height of the pandemic. I expect the region will continue to see downward pressure on home prices, but a major correction is unlikely. It’s more likely that as mortgage rates continue to decline, the market will find a solid floor in the summer and prices will resume their upward trend as we move into the fall.

The Utah housing market does not yet significantly favor home buyers but, given the data discussed in this report, it has certainly shifted away from sellers and into neutral territory. I have moved the needle accordingly.
About Matthew Gardner
As Chief Economist for Windermere Real Estate, Matthew Gardner is responsible for analyzing and interpreting economic data and its impact on the real estate market on both a local and national level. Matthew has over 30 years of professional experience both in the U.S. and U.K.
In addition to his day-to-day responsibilities, Matthew sits on the Washington State Governors Council of Economic Advisors; chairs the Board of Trustees at the Washington Center for Real Estate Research at the University of Washington; and is an Advisory Board Member at the Runstad Center for Real Estate Studies at the University of Washington where he also lectures in real estate economics.
Q3 2022 Utah Real Estate Market Update
The following analysis of select counties of the Utah real estate market is provided by Windermere Real Estate Chief Economist Matthew Gardner. We hope that this information may assist you with making better-informed real estate decisions. For further information about the housing market in your area, please don’t hesitate to contact your Windermere Real Estate agent.
Regional Economic Overview
Utah’s economy continues to add jobs. The 53,600 jobs created statewide over the past year represent a growth rate of 3.3%. The counties covered by this report added more than 40,000 new jobs over the past year, which is a growth rate of 3%. The state’s unemployment rate in August was 2%, which is marginally above the all-time low of 1.9% reported in April of this year. The labor force continues to expand, suggesting that the region expects economic growth to remain strong. Even though the state has seen a modest decline in the pace of job growth, the numbers are still very impressive.
Utah Home Sales
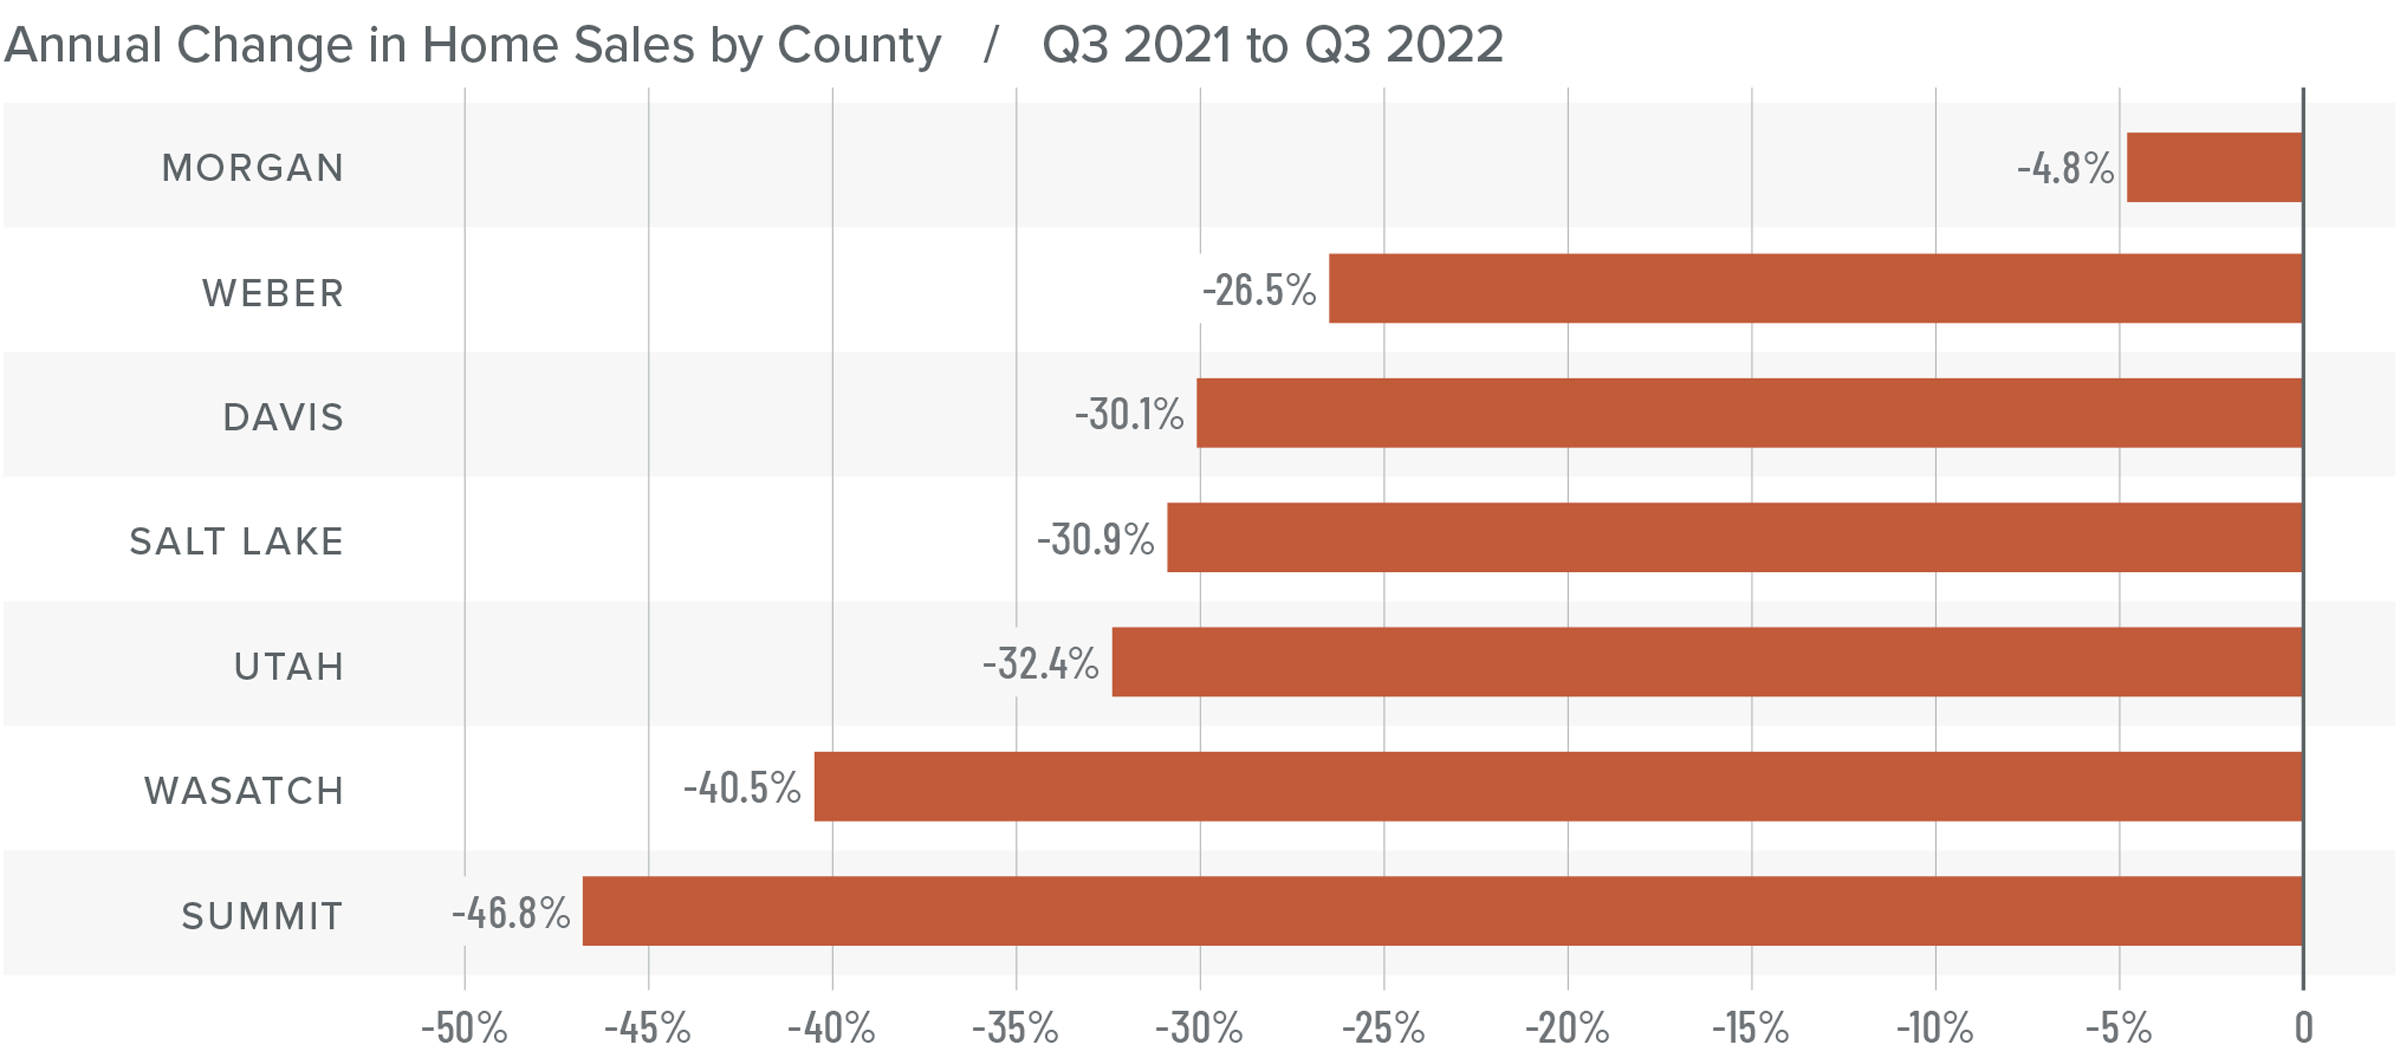
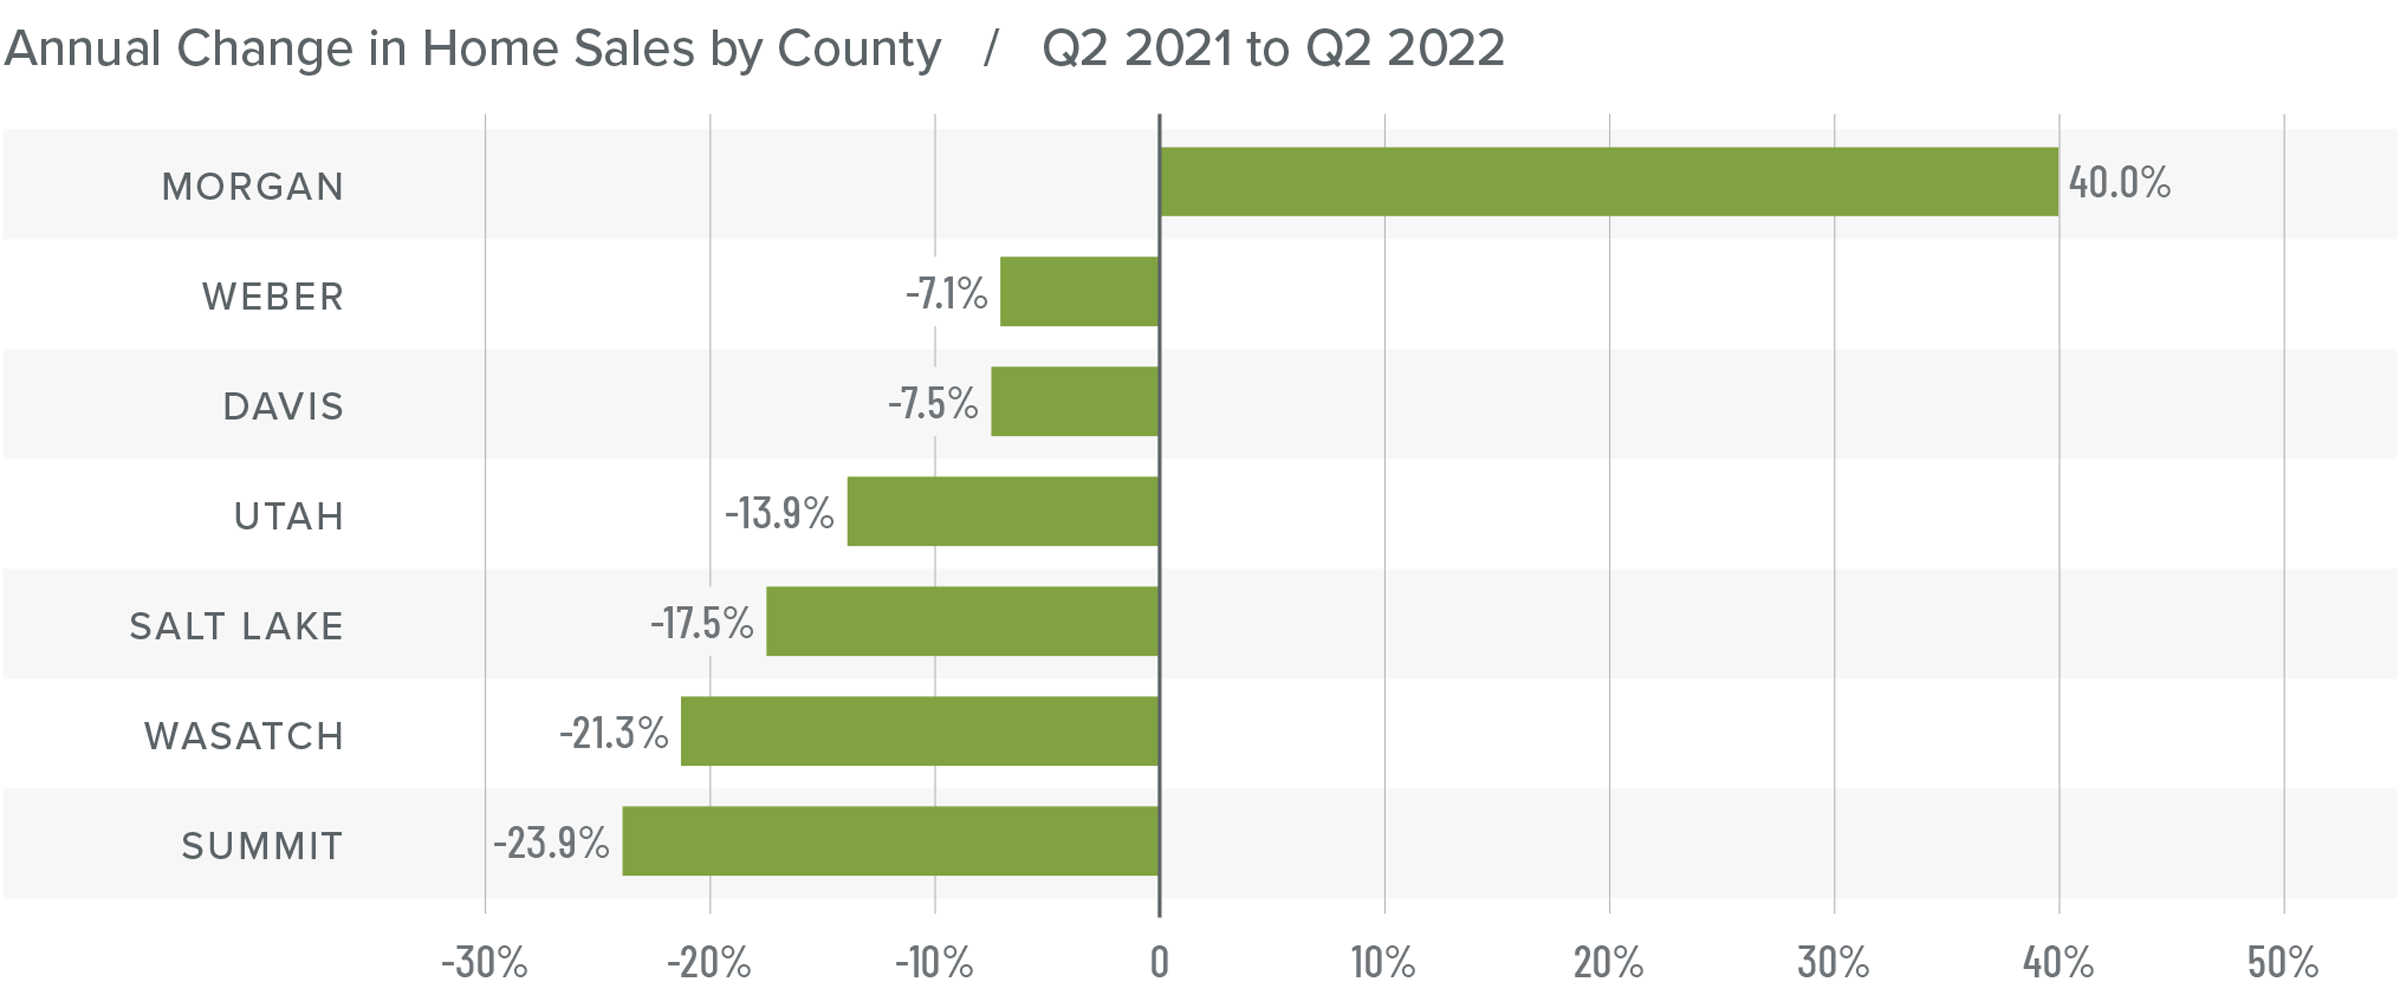
❱ In the third quarter, 7,134 homes sold. This was 31.6% fewer sales than a year ago and down 16.1% compared to the second quarter of this year.
❱ Year over year, sales fell across the board. Sales in all markets covered by this report were lower than in the second quarter of 2022 as well.
❱ Inventory levels continue to grow, with the average number of homes for sale in the quarter 149% higher than a year ago and up 79% from the second quarter of this year.
❱ Buyers, who seemed to ignore rising mortgage rates in the second quarter, are now feeling the impact of higher financing costs and have taken a pause.
Utah Home Prices
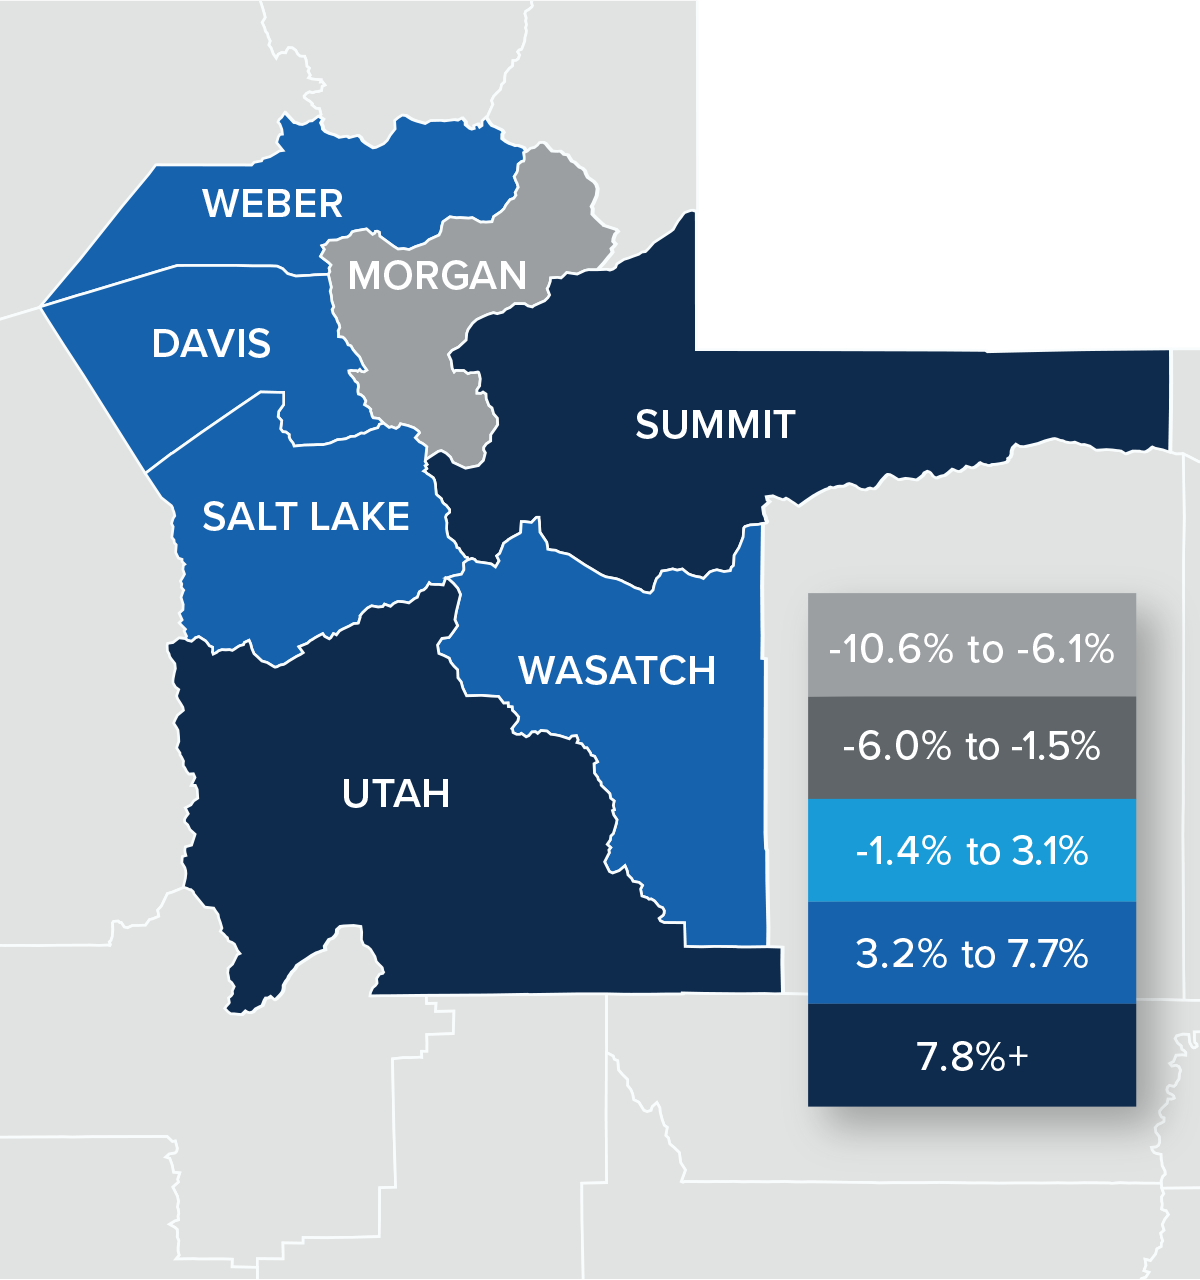
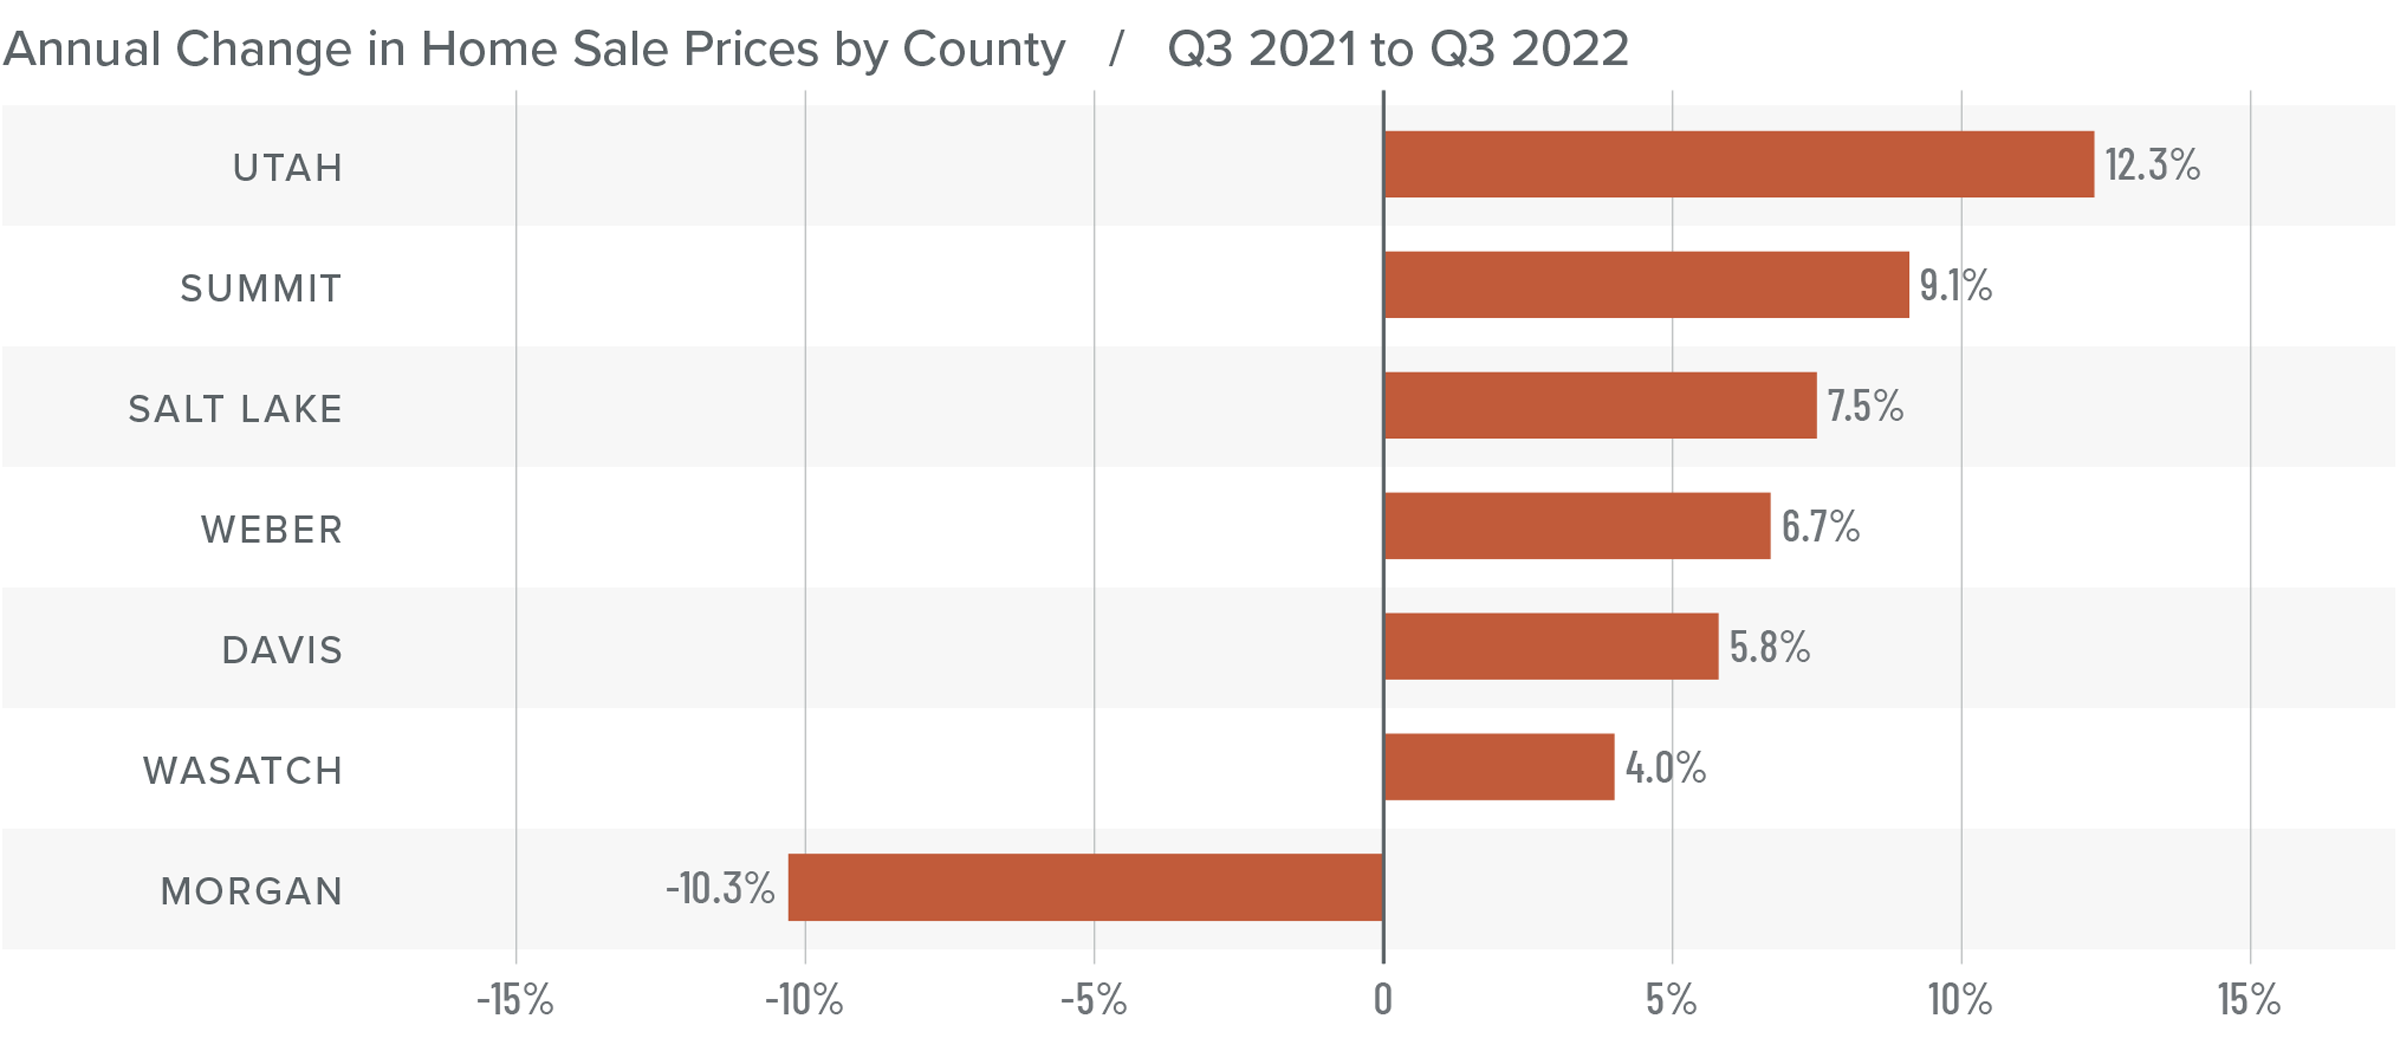
❱ The average home sale price in the third quarter was up 5.9% from a year ago to $627,503. However, prices fell 5.7% compared to the second quarter of this year.
❱ Median listing prices in the third quarter were down across the board. Sellers appear to be coming to terms with the fact that the remarkably buoyant market we’ve experienced since the start of the pandemic has now ended.
❱ All areas contained in this report except Morgan County had higher sale prices than a year ago. Compared to the second quarter of this year, only Wasatch County had higher sale prices.
❱ Although the data suggests that a market correction has started, I don’t find this terribly troubling. Homeowners have seen a remarkable run-up in home values over the past couple of years. It was only a matter of time before the market reverted back to a more sustainable pace of price growth.
Mortgage Rates
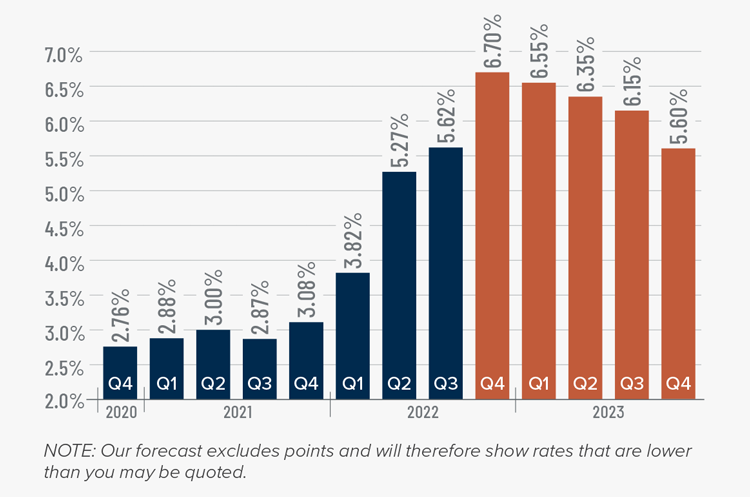
This remains an uncertain period for mortgage rates. When the Federal Reserve slowed bond purchases in 2013, investors were accused of having a “taper tantrum,” and we are seeing a similar reaction today. The Fed appears to be content to watch the housing market go through a period of pain as they throw all their tools at reducing inflation.
As a result, mortgage rates are out of sync with treasury yields, which not only continues to push rates much higher, but also creates violent swings in both directions. My current forecast calls for rates to peak in the fourth quarter of this year before starting to slowly pull back. That said, they will remain in the 6% range until the end of 2023.
Utah Days on Market
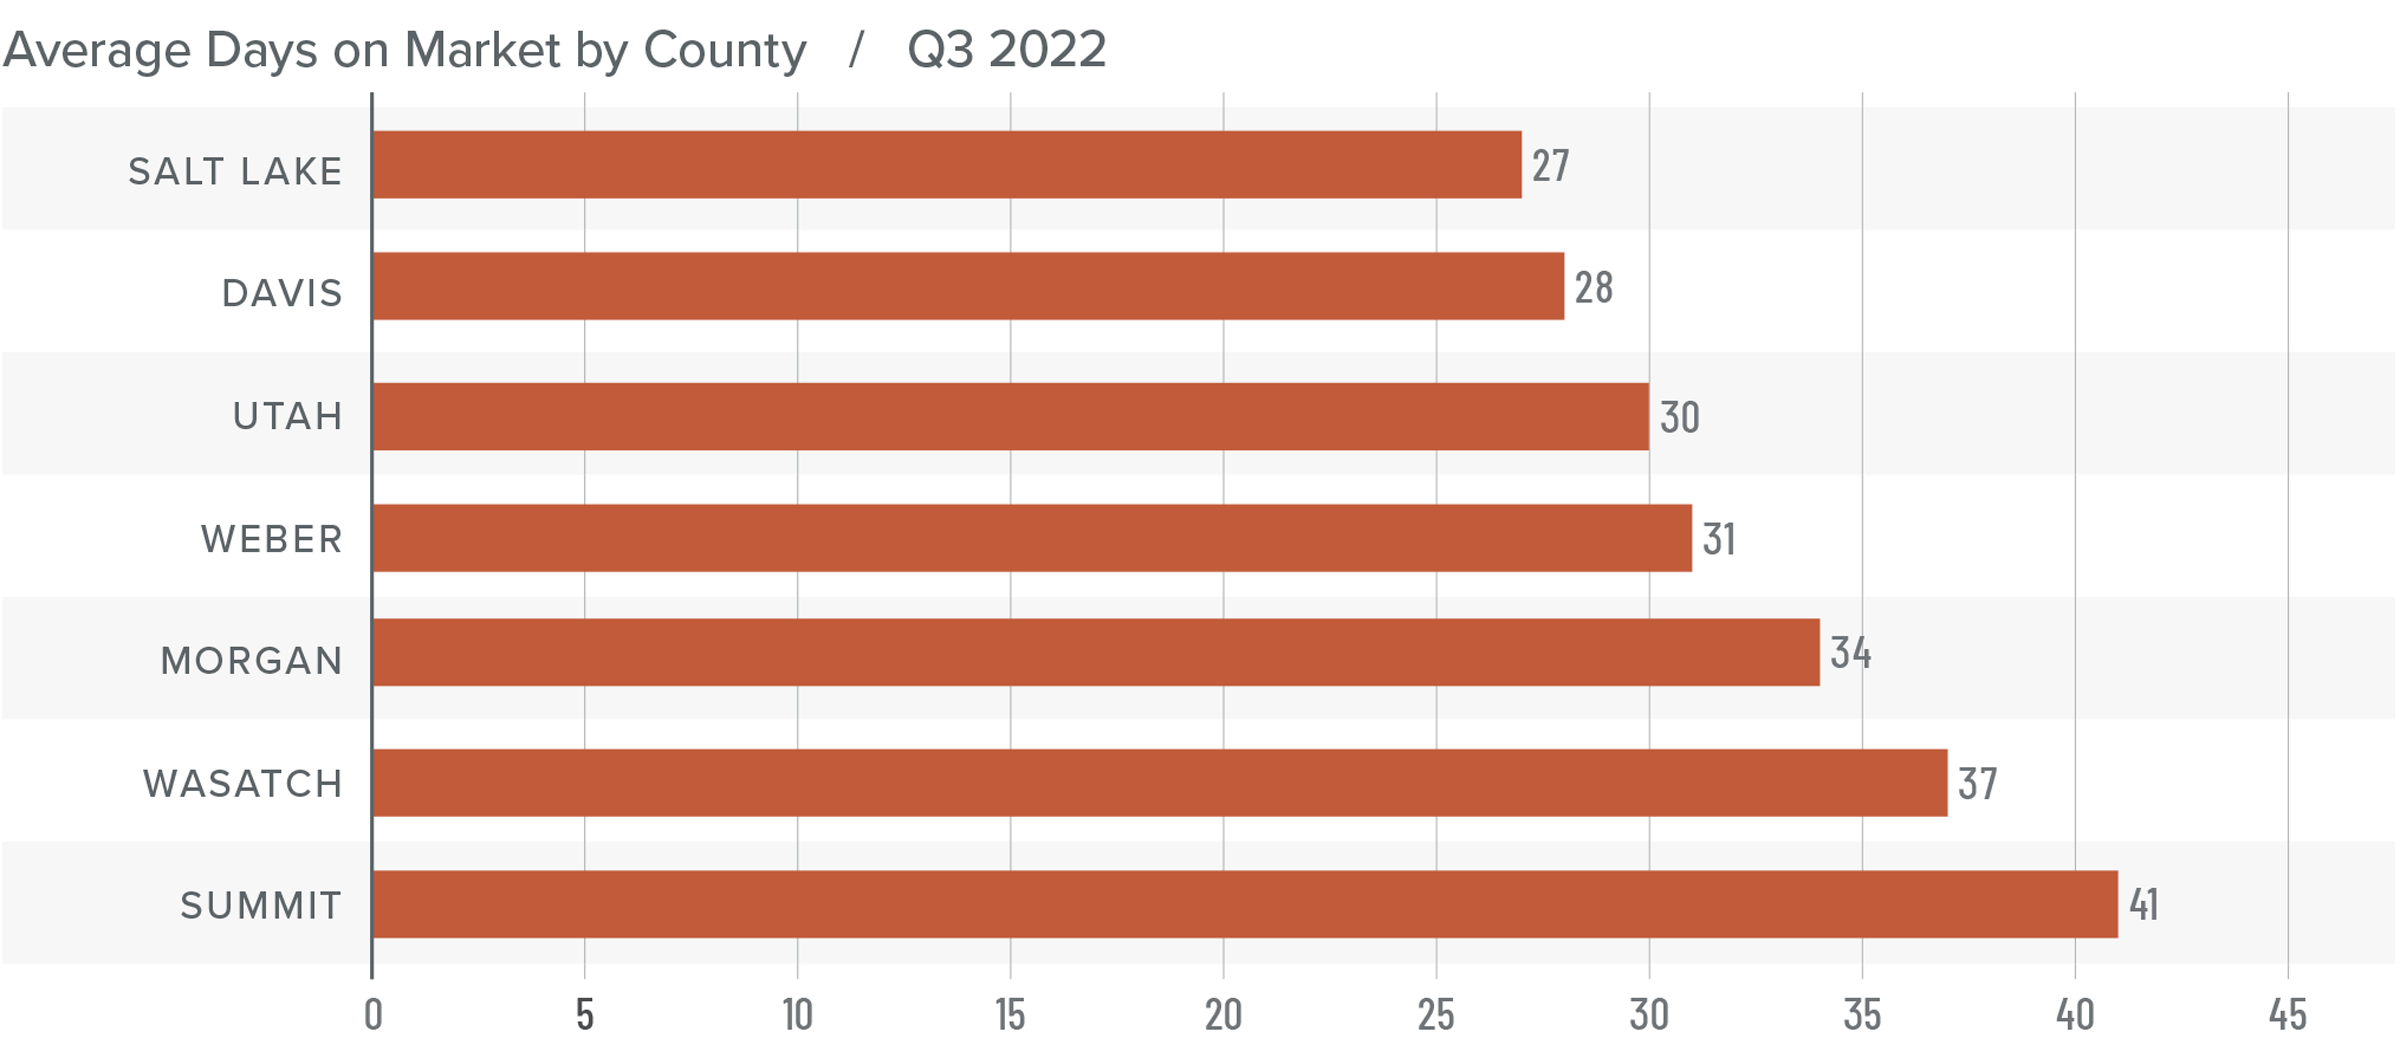
❱ The average number of days it took to sell a home in the counties covered by this report rose ten days compared to the same period a year ago.
❱ Though homes sold fastest in Salt Lake County, average market time rose in all counties covered by this report year over year. Days on market was also higher in every county compared to the second quarter of this year.
❱ During the quarter, it took an average of 33 days to sell a home in the region. Market time rose 15 days compared to the second quarter of 2022.
❱ Rapidly rising inventory levels and mortgage rates have put the brakes on the Utah housing market.
Conclusions
This speedometer reflects the state of the region’s real estate market using housing inventory, price gains, home sales, interest rates, and larger economic factors.
Although Utah’s economy remains strong, the housing market is now feeling the effects of mortgage rates that were 2.7% higher than in the third quarter of 2021. With rates expected to rise even more in the fourth quarter before hopefully levelling off in early 2023, I anticipate that prices will decline further from their current levels. While this may seem like a dire situation to some, homeowners have seen their equity leap since the pandemic started. Though the expected drop in home values may be disconcerting for owners, it’s necessary for the market to return to more realistic conditions. I expect that some would-be sellers will decide to wait until the market stabilizes before listing their homes, while others will decide not to sell at all. This will limit how far inventory levels will rise. As such, I don’t see the market reaching saturation.
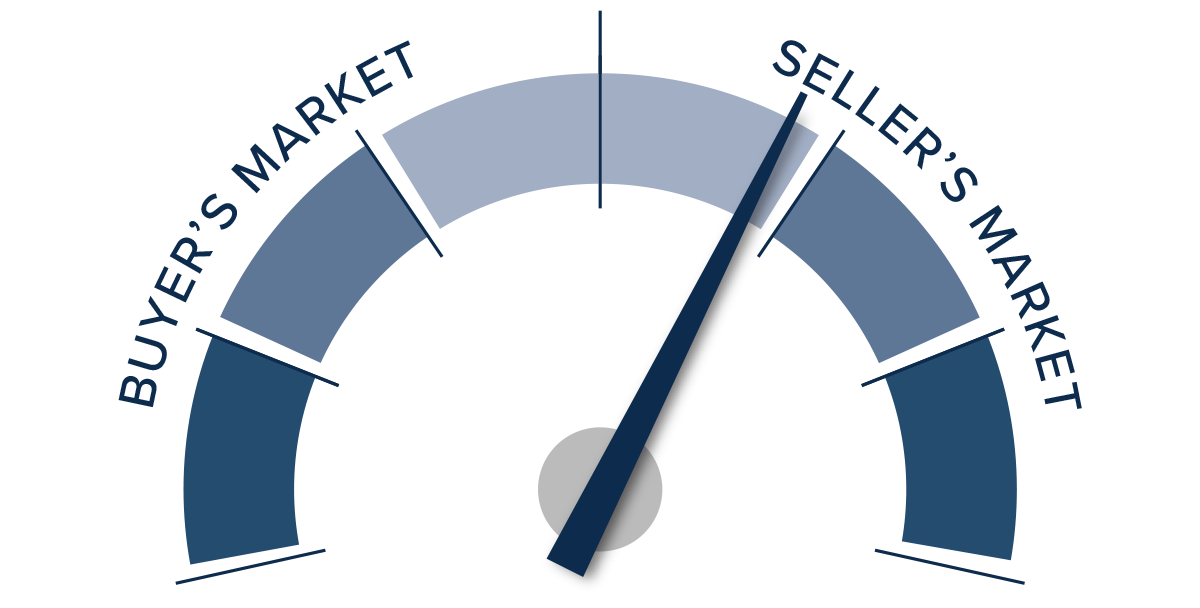
The Utah housing market is in a period of reversion that will bring it back to balance, which is actually positive for the long-term health of the market. Buyers have more choice, but many will wait until financing costs and the market start to stabilize before they resume their search for a home. We still aren’t in a buyer’s market, but we are certainly getting closer to balance. As such, I have moved the needle far closer to the middle.
About Matthew Gardner
As Chief Economist for Windermere Real Estate, Matthew Gardner is responsible for analyzing and interpreting economic data and its impact on the real estate market on both a local and national level. Matthew has over 30 years of professional experience both in the U.S. and U.K.
In addition to his day-to-day responsibilities, Matthew sits on the Washington State Governors Council of Economic Advisors; chairs the Board of Trustees at the Washington Center for Real Estate Research at the University of Washington; and is an Advisory Board Member at the Runstad Center for Real Estate Studies at the University of Washington where he also lectures in real estate economics.
Q2 2022 Utah Real Estate Market Update

The following analysis of select counties of the Utah real estate market is provided by Windermere Real Estate Chief Economist Matthew Gardner. We hope that this information may assist you with making better-informed real estate decisions. For further information about the housing market in your area, please don’t hesitate to contact your Windermere Real Estate agent.
Regional Economic Overview
The Utah economy remains buoyant. Although the pace of job growth has tapered somewhat from 2021, jobs continue to be added faster than the long-term average. Over the past 12 months, the state has added 55,400 jobs, representing a growth rate of 3.4%. The counties covered in this report added almost 53,000 new jobs over the past year, representing a growth rate of 4%. The state’s unemployment rate in May was 2%, which is marginally above the all-time low of 1.9% in April of this year. The labor force continues to expand, suggesting that the region expects economic growth to remain strong. All in all, a very impressive situation.
Utah Home Sales
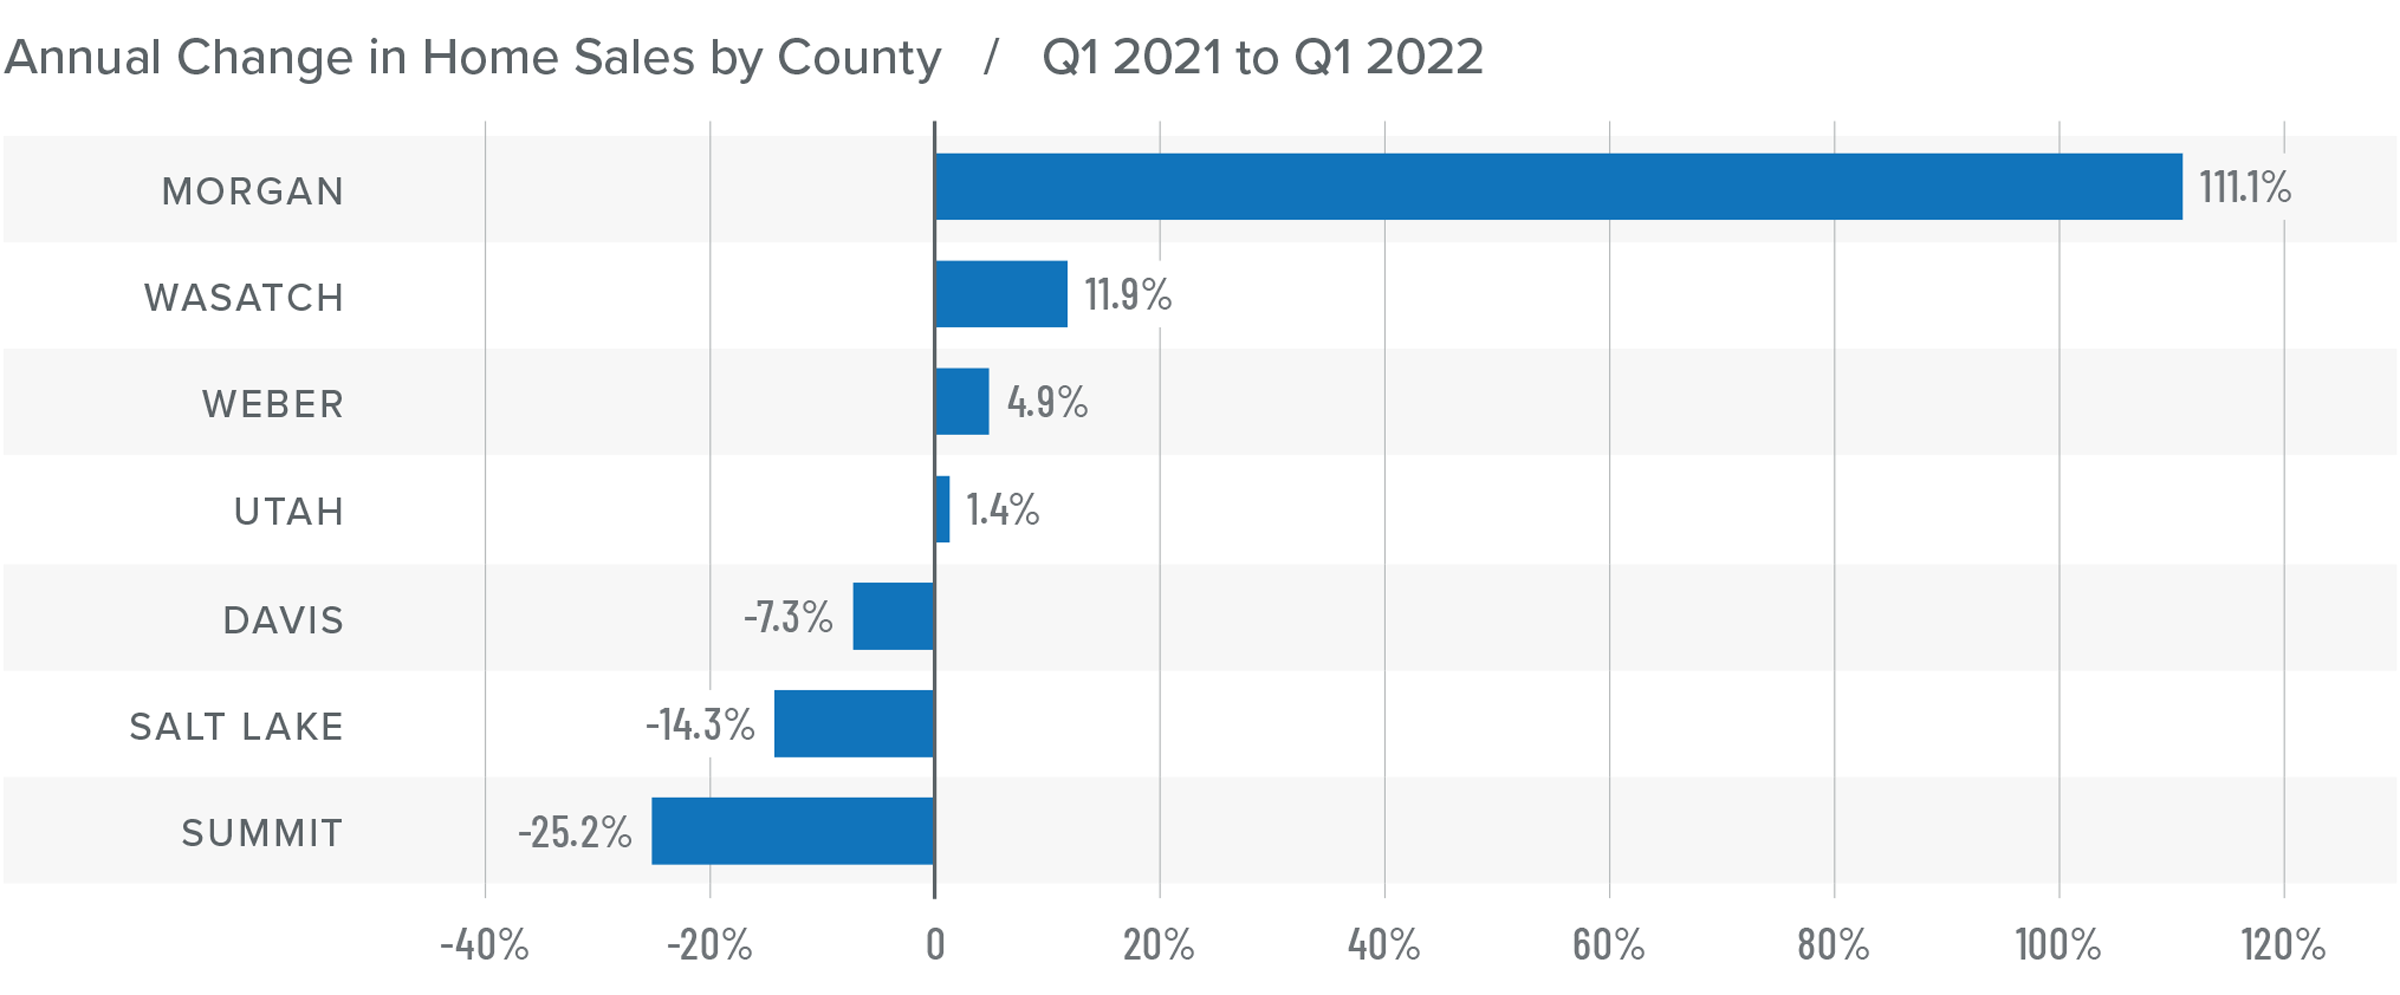
❱ In the second quarter of 2022, 8,501 homes sold, which was a drop of 14.4% year over year. Sales were 30.9% higher than in first quarter of the year.
❱ Year over year, sales rose in the small Morgan County area but fell in the rest of the markets included in this report. Conversely, sales rose across the board compared to the first quarter, with impressive growth in Morgan, Davis, Utah, and Salt Lake counties.
❱ Inventory levels, which had been remarkably low, rose 206.2% from the first quarter of the year. This clearly had a positive effect on the market as more choice for buyers led to more sales.
❱ Buyers appeared to shrug off the fact that mortgage rates rose more than 1.5% in the quarter, which suggests they still believe owning a home is a solid investment.
Utah Home Prices
❱ Even with more homes on the market, prices continued to rise. Home prices rose 15.4% year over year to an average of $665,697, and they were 4.2% higher than in the first quarter of 2021.
❱ I have started watching list prices, as they will be a leading indicator of whether the market is starting to feel the impacts of declining affordability due to rising financing costs. In the second quarter, the median list price in the region dropped 2.2%, but it rose in Morgan, Davis, and Salt Lake counties.
❱ All areas contained in the report except for Wasatch County saw sale prices increase by double digits compared to a year ago. Compared to the first quarter of this year, prices were higher in every county other than Summit.
❱ Higher financing costs combined with declining affordability may have started to slow the rapid pace of appreciation we’ve seen over the past two years. This is nothing to be concerned about; rather it suggests that the market is starting to return to some sense of normalcy.

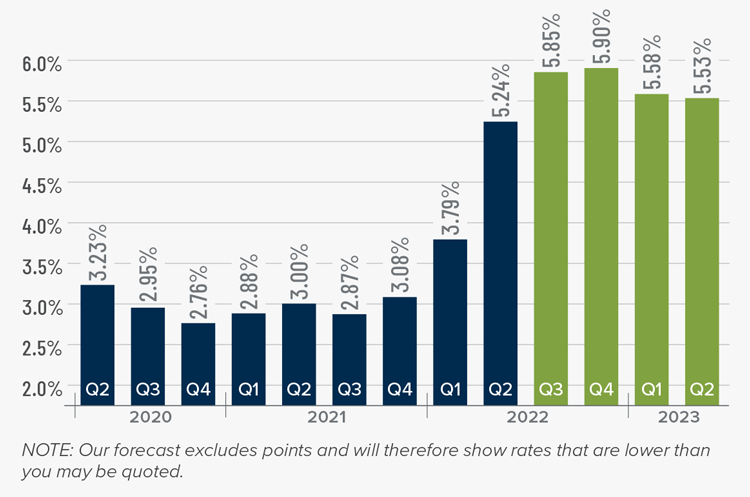
Mortgage Rates
Although mortgage rates did drop in June, the quarterly trend was still moving higher. Inflation—the bane of bonds and, therefore, mortgage rates—has yet to slow, which is putting upward pressure on financing costs.
That said, there are some signs that inflation is starting to soften and if this starts to show in upcoming Consumer Price Index numbers then rates will likely find a ceiling. I am hopeful this will be the case at some point in the third quarter, which is reflected in my forecast.
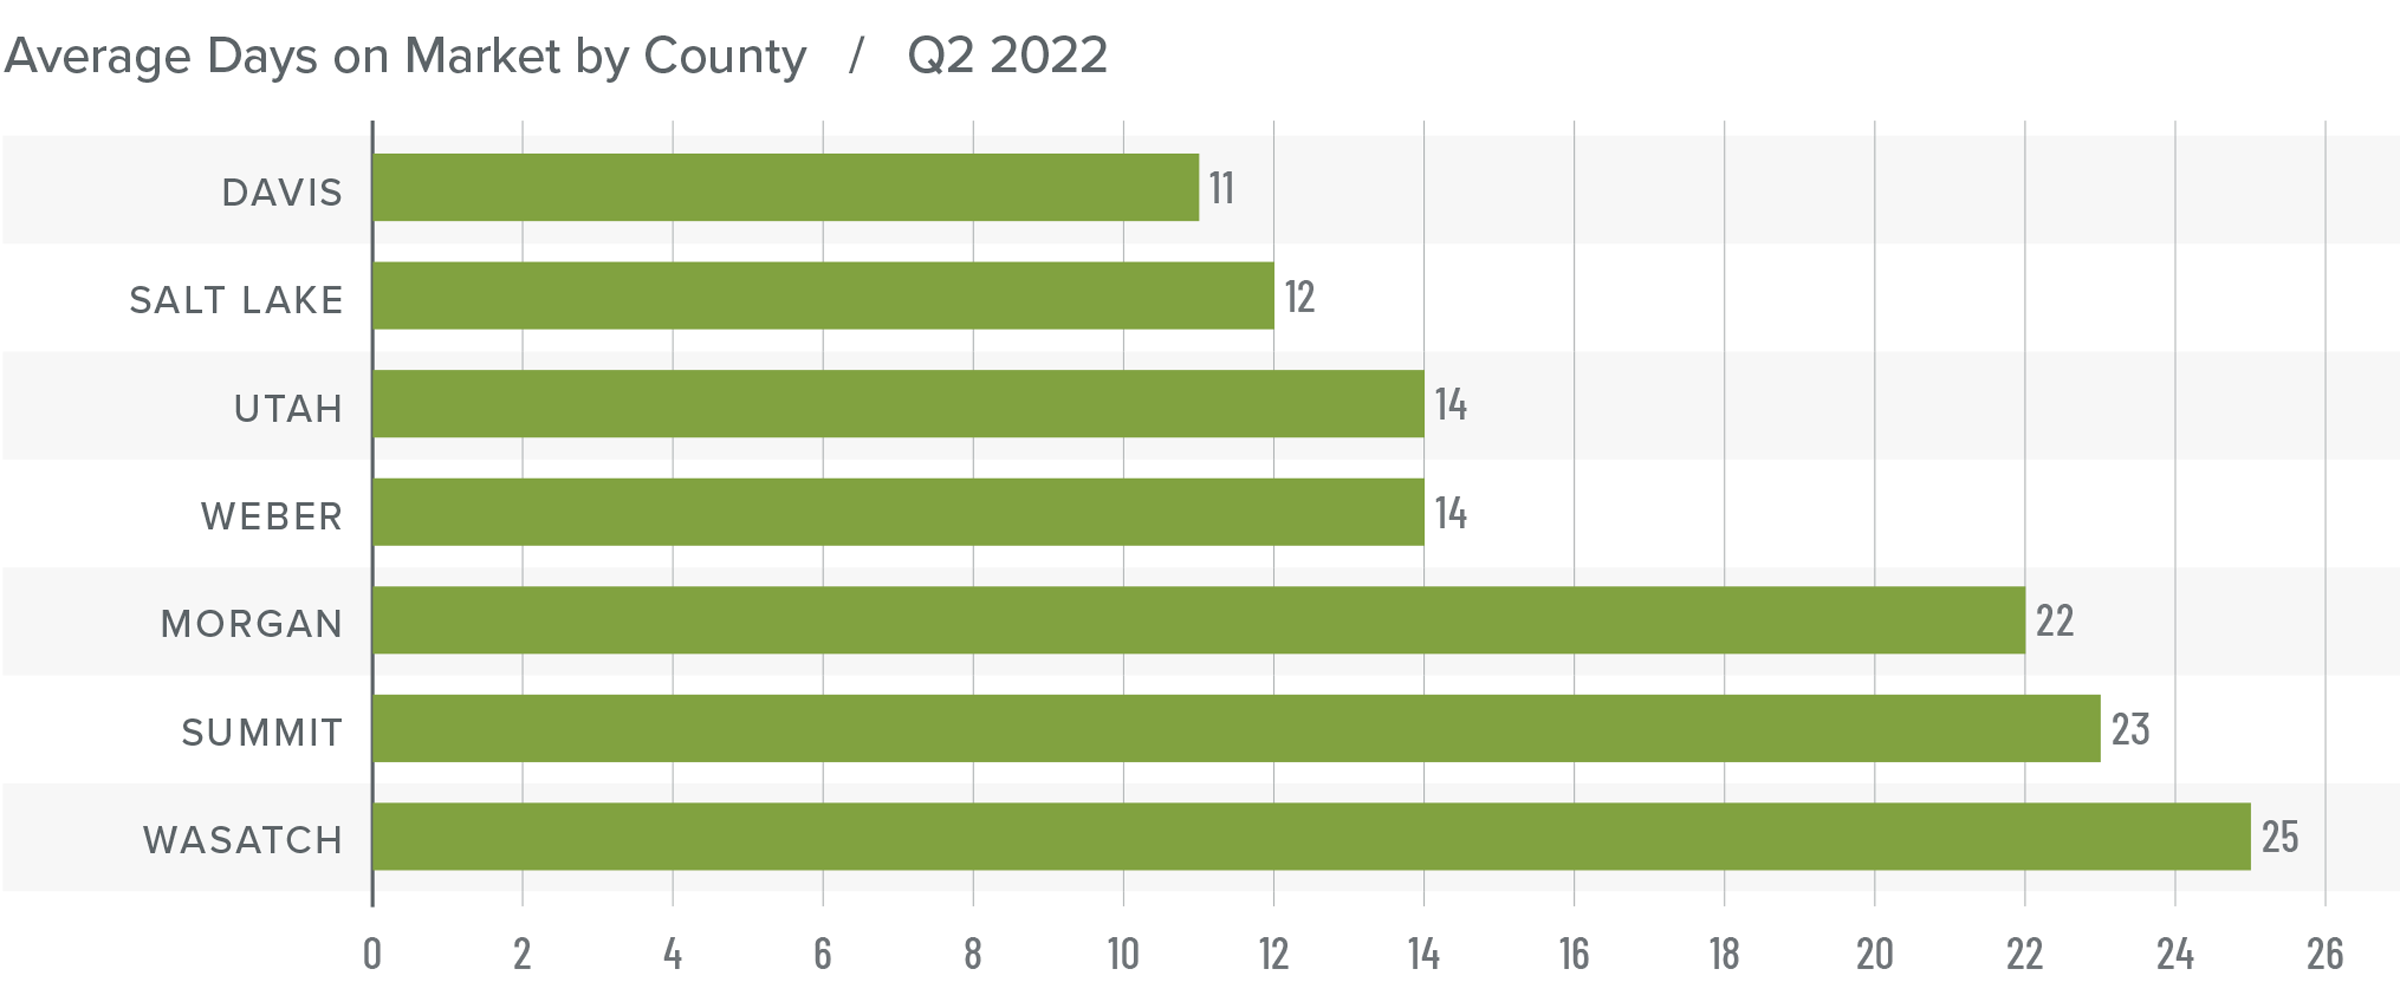
Utah Days on Market
❱ The average time it took to sell a home in the counties covered by this report dropped two days compared to the same period a year ago.
❱ Homes again sold fastest in Davis County, and every county except Summit and Wasatch saw average time on market rise compared to a year ago. The greatest drop in market time was in Summit County, where it took 19 fewer days to sell a home.
❱ During the second quarter, it took an average of 17 days to sell a home in the region. Not only did market time fall year over year, but it took 8 fewer days for homes to sell compared to first quarter.
❱ The market remains very competitive and, as mentioned earlier, appears to not yet be impacted by higher mortgage rates.
Conclusions
This speedometer reflects the state of the region’s real estate market using housing inventory, price gains, home sales, interest rates, and larger economic factors.
The number of homes for sale in Utah has risen significantly and buyers are absorbing the additional supply. That said, higher inventory levels are forcing sellers to be a little more competitive than they were, as demonstrated by declining median list prices in several areas. I would contend that the market is not headed for any sort of correction; rather it has started to trend back to some sense of normalcy. This may be concerning to those who have become accustomed to the frenetic pace the market has experienced since the start of the pandemic, but it really is nothing to worry about.
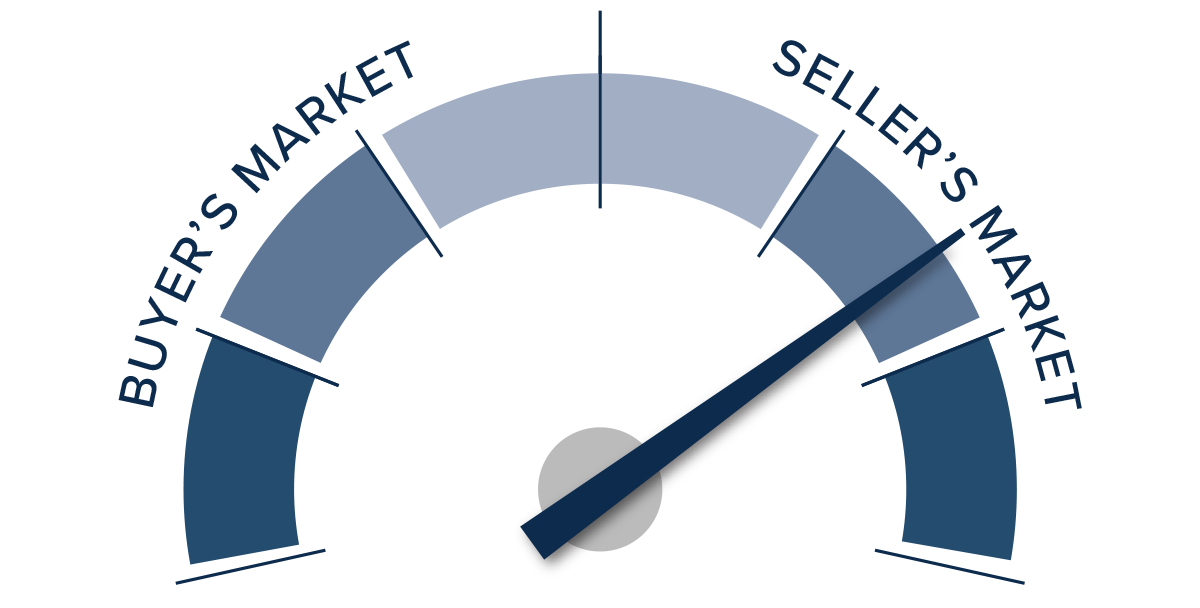
Sellers still have the upper hand and well-positioned, appropriately-priced homes continue to attract significant interest from buyers. Given all the data discussed in this report, I have left the needle in the same position as the last quarter. Although the market still favors sellers, a shift may be on the way that would lead us toward a more balanced market.
About Matthew Gardner
As Chief Economist for Windermere Real Estate, Matthew Gardner is responsible for analyzing and interpreting economic data and its impact on the real estate market on both a local and national level. Matthew has over 30 years of professional experience both in the U.S. and U.K.
In addition to his day-to-day responsibilities, Matthew sits on the Washington State Governors Council of Economic Advisors; chairs the Board of Trustees at the Washington Center for Real Estate Research at the University of Washington; and is an Advisory Board Member at the Runstad Center for Real Estate Studies at the University of Washington where he also lectures in real estate economics.
Q1 2022 Utah Real Estate Market Update

The following analysis of select counties of the Utah real estate market is provided by Windermere Real Estate Chief Economist Matthew Gardner. We hope that this information may assist you with making better-informed real estate decisions. For further information about the housing market in your area, please don’t hesitate to contact your Windermere Real Estate agent.
Regional Economic Overview
The Utah economy continues to impress, with total employment up 3.8% year over year. Of greater significance: current employment levels are now 78,600 higher than the pre-pandemic peak. The counties covered by this report added almost over 48,400 new jobs over the past year, representing a growth rate of 3.7%. Thanks to the state’s robust economy, the unemployment rate dropped to 2%, which is the lowest level recorded since the Labor Department started keeping records in 1976. Moreover, this remarkably low level of unemployment comes while the labor force rose above the 1.7 million mark—a level never before seen.
Utah Home Sales
❱ In the first quarter of 2022, 6,493 homes were sold, which is a drop of 7.5% year over year. There were 29.1% fewer sales than in the fourth quarter of 2021.
❱ Year over year, sales rose in four of the seven counties contained in this report, but fell in the balance of the region.
❱ Inventory levels remain well below the average, which is clearly limiting sales. The number of homes for sale was down 30.9% from the previous quarter, and down 5.6% from the same period a year ago.
❱ Pending sales, which are an indicator of future closings, fell 9.2% from the final quarter of 2021, suggesting that second quarter closings may remain below average.
Utah Home Prices
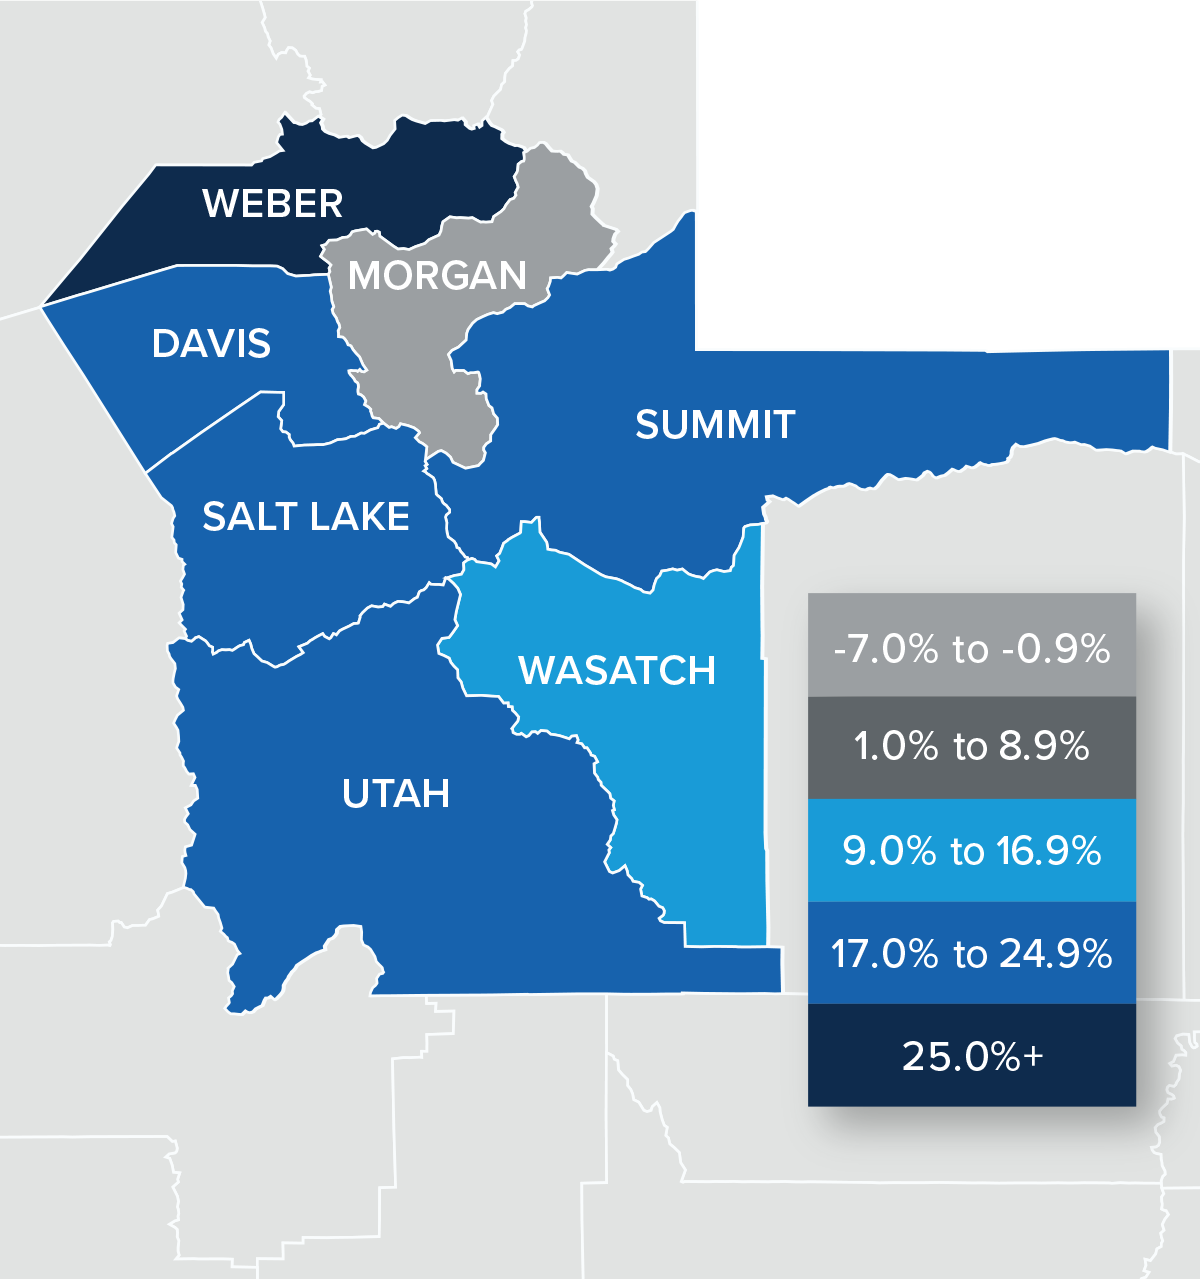
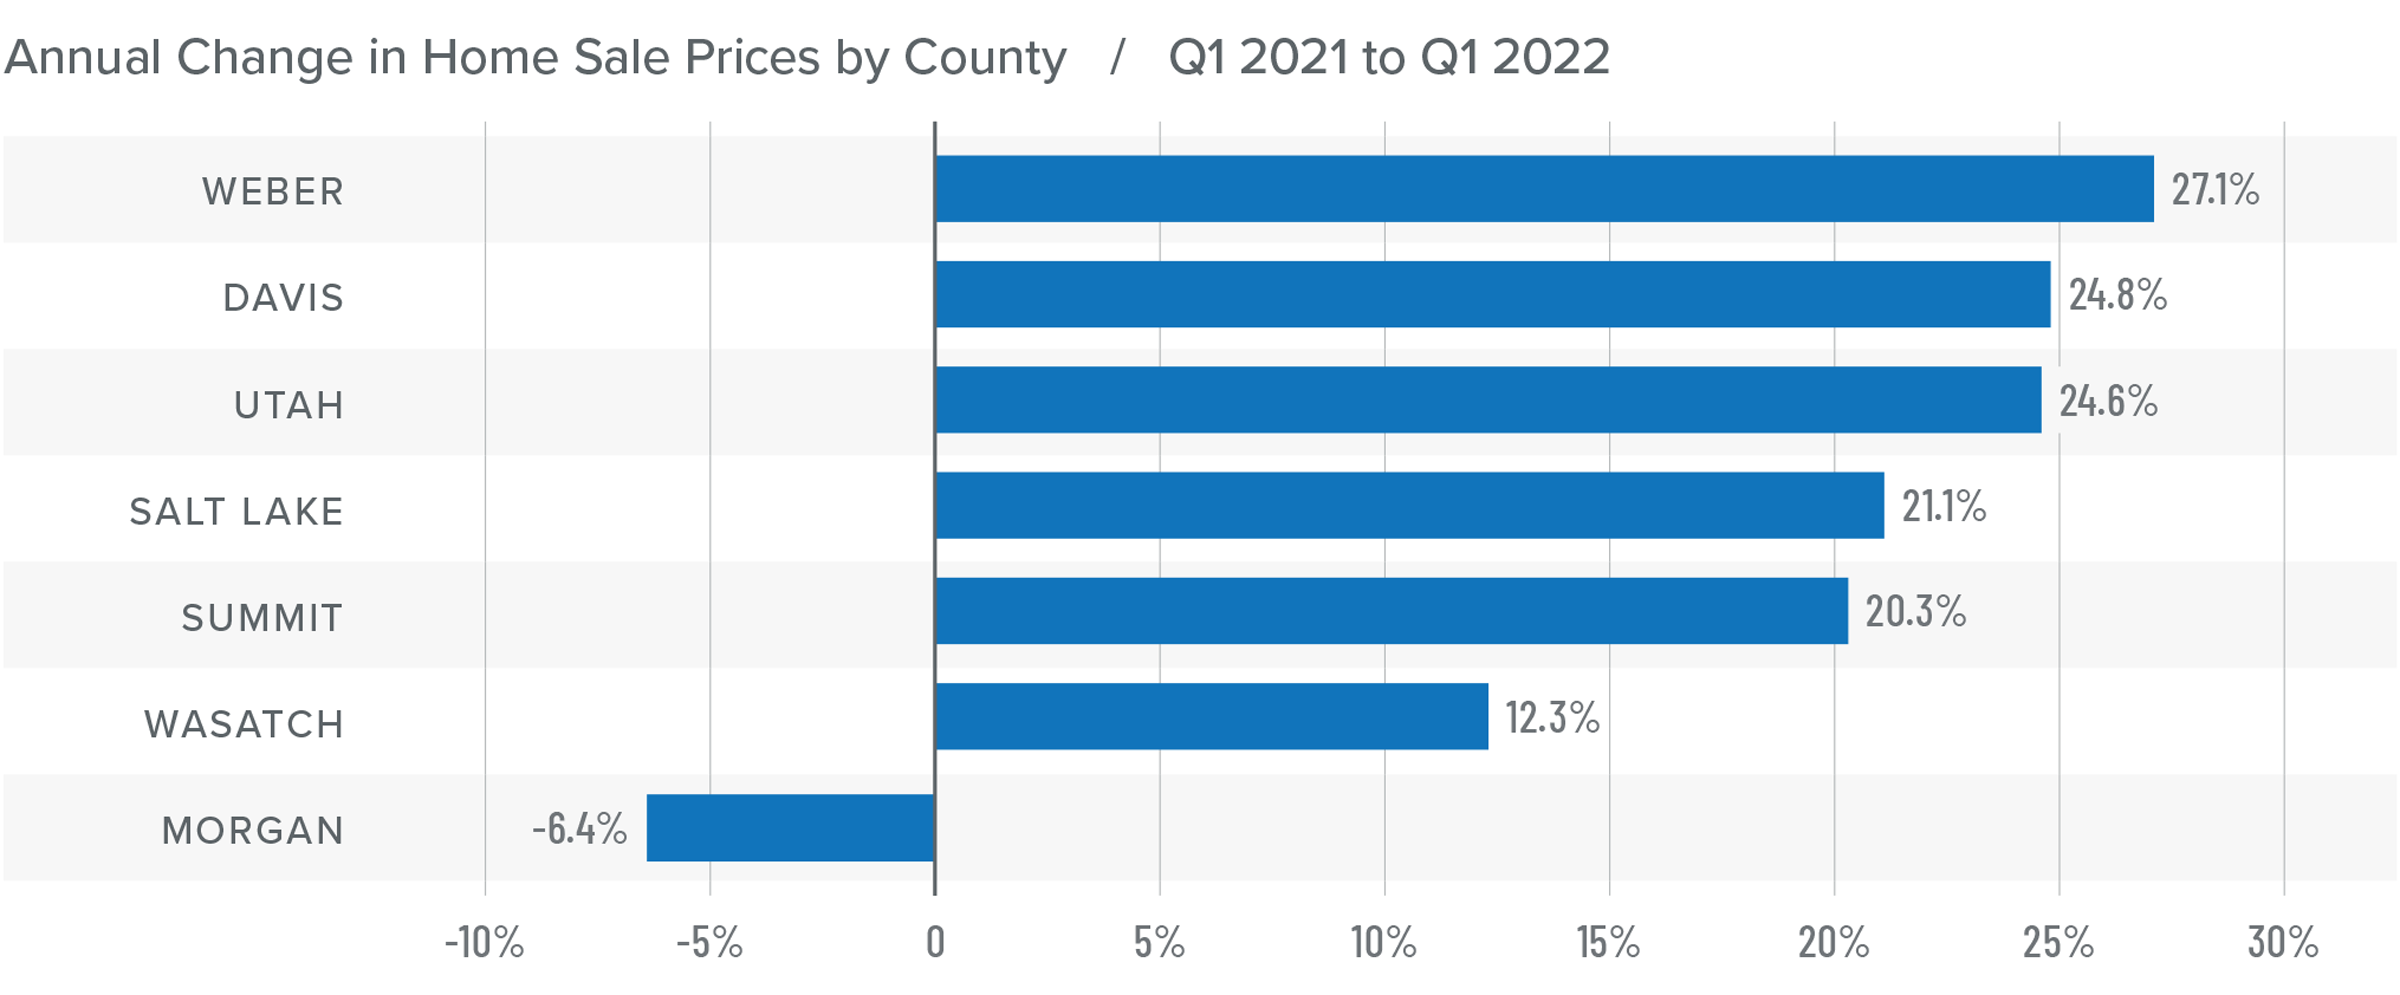
❱ With more demand than supply, it wasn’t surprising that home prices picked up. Year over year, prices rose 19.5% to an average of $639,131. Prices were 6.1% higher than in the fourth quarter of 2021.
❱ Compared to the final quarter of last year, prices rose in all counties other than Morgan, with Summit County jumping more than 20%.
❱ All areas contained in the report except for Morgan County saw prices increase by double digits. The pullback in Morgan County is not a concern given that it is a very small market.
❱ Mortgage rates increased in the first quarter but, as there is normally a lag between rising financing costs and their impact on sales or prices, it’s too early to tell if the market will experience any slowing. We will have a better idea in the second quarter report.
Mortgage Rates
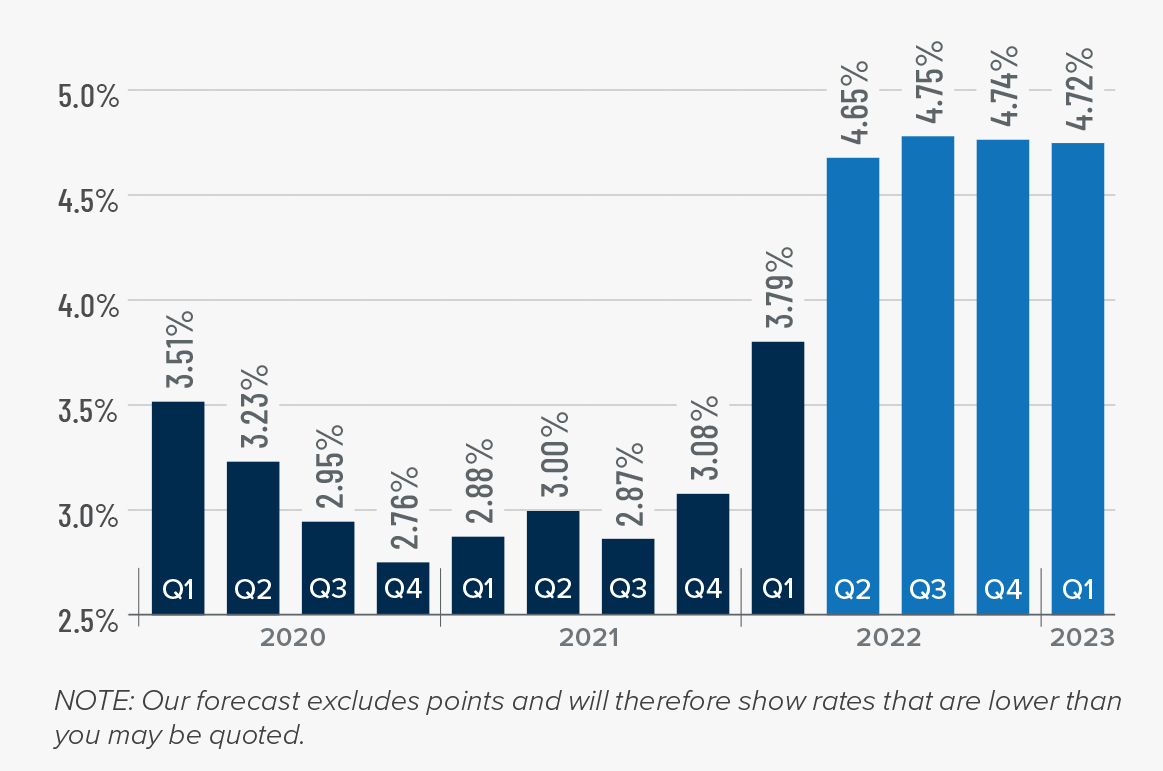
Average rates for a 30-year conforming mortgage were 3.11% at the end of 2021, but since then have jumped over 1.5%—the largest increase since 1987. The speed of the surge in rates is due to the market having quickly priced in the seven-to-eight rate increase that the Fed is expected to implement this year.
Because the mortgage market has priced this into the rates they are offering today, my forecast suggests that we are getting close to a ceiling in rates, and it is my belief that they will rise modestly in the second quarter before stabilizing for the balance of the year.
Utah Days on Market
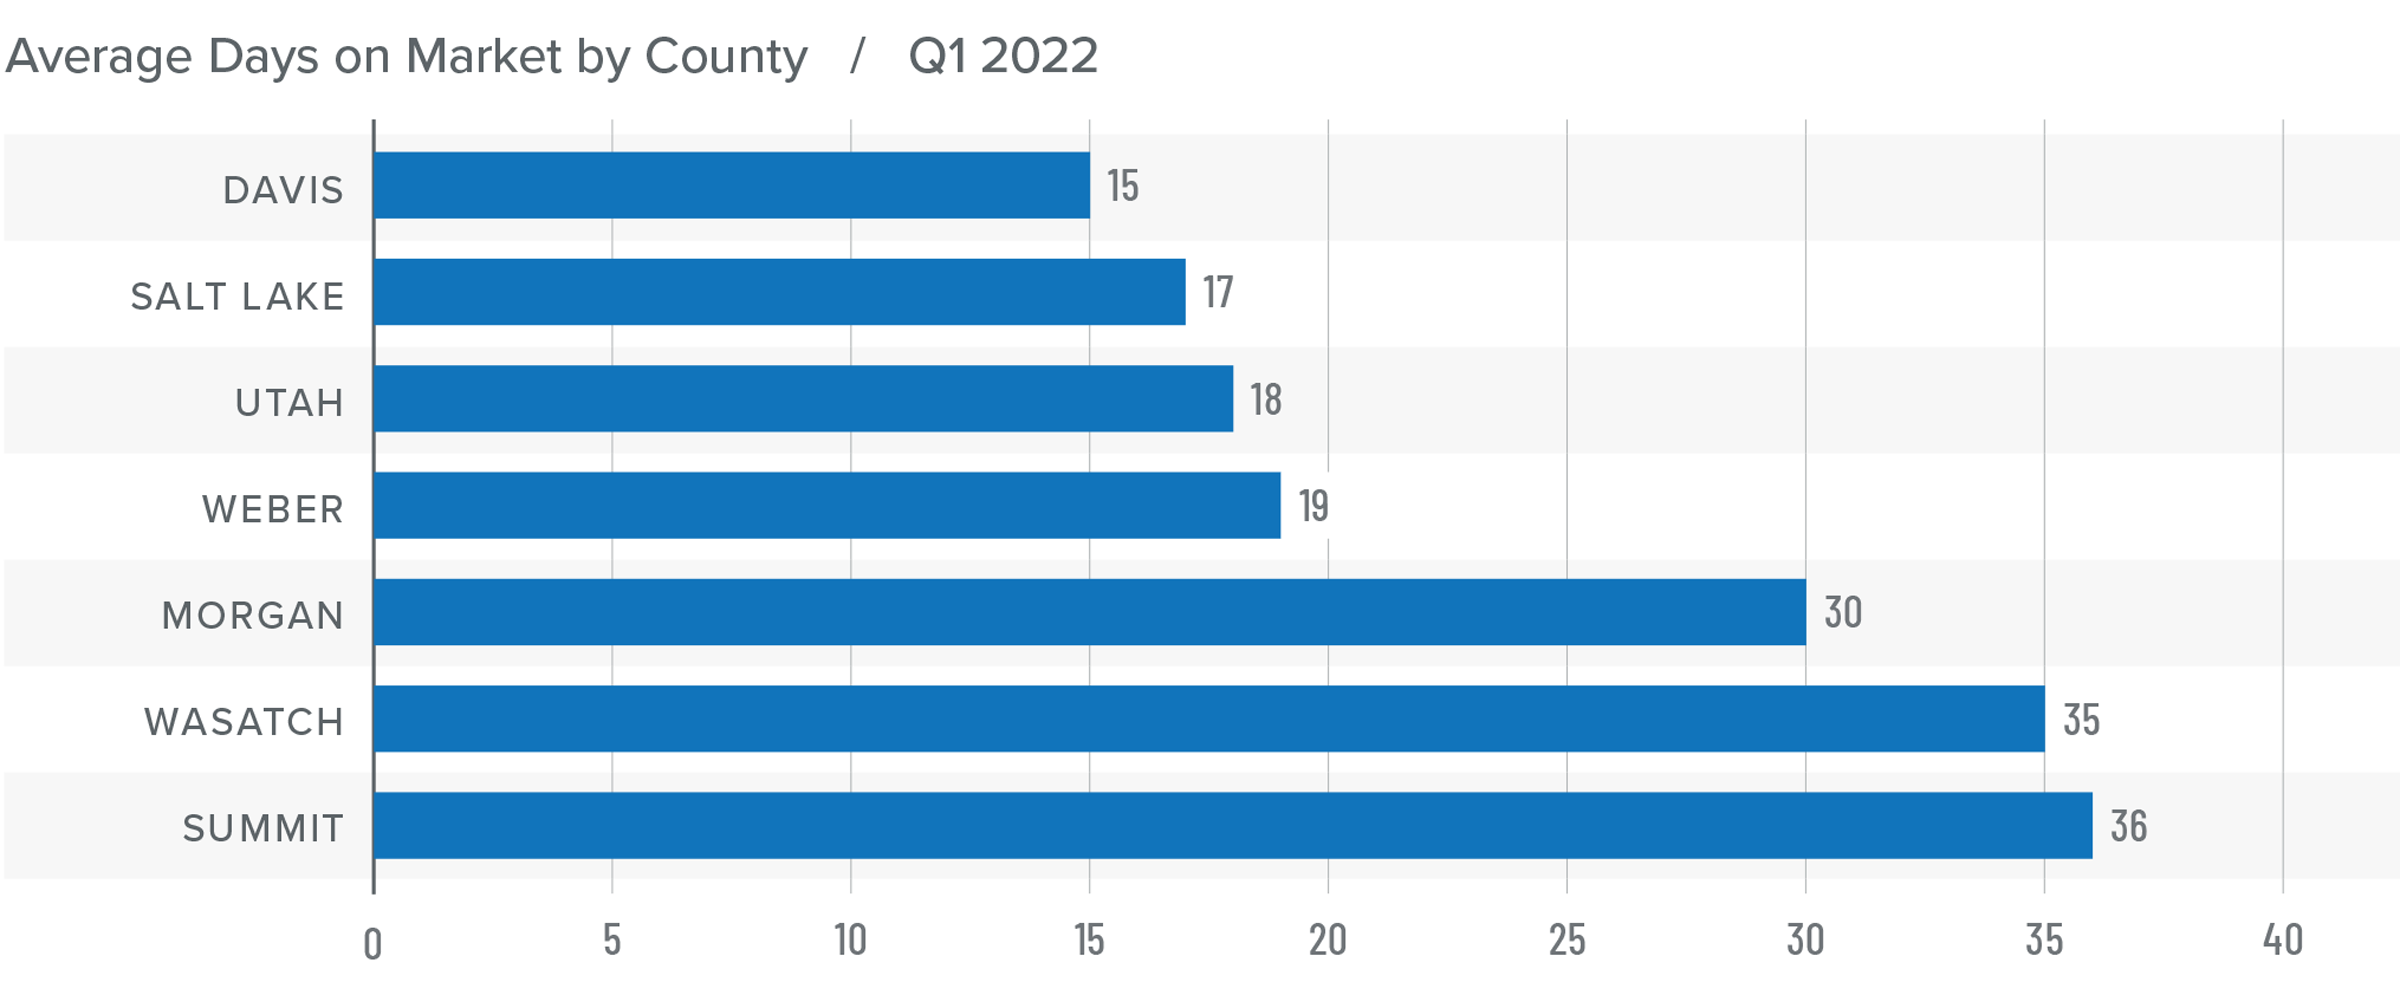
❱ The average time it took to sell a home in the counties covered by this report dropped eight days compared to the first quarter of 2021.
❱ Homes again sold fastest in Davis County, and market time dropped in all but three counties compared to a year ago. The greatest decline in market time was in Summit County, where it took 31 fewer days to sell a home.
❱ During first quarter, it took an average of 24 days to sell a home in the region. Market time fell year over year. It also took 4 fewer days for a home to sell than in the final quarter of last year.
❱ With days on market dropping across the board compared to the prior quarter, it’s clear that there is significant demand for the few homes that are available.
Conclusions
This speedometer reflects the state of the region’s real estate market using housing inventory, price gains, home sales, interest rates, and larger economic factors.
In last quarter’s Gardner Report, I suggested that home prices would continue to rise in 2022 but at a modestly slower pace than in 2021. Although it would be easy to assume that the jump in mortgage rates will cause price growth to slow more significantly, I am not sure whether that will be the case. As tight as the labor market is, rising incomes will likely offset most of the potential pain from higher mortgage payments. The region clearly heavily favors sellers, and I don’t expect this to change this year. While the full impact of rising mortgage rates has yet to be felt, I don’t believe it will be overly burdensome for buyers.
Given all of this, I have left the needle in the same position as last quarter. Though the data points to another very solid year for housing, I am waiting for the spring figures to determine if rising mortgage rates will cause any slowing to this supply-starved market.
About Matthew Gardner
As Chief Economist for Windermere Real Estate, Matthew Gardner is responsible for analyzing and interpreting economic data and its impact on the real estate market on both a local and national level. Matthew has over 30 years of professional experience both in the U.S. and U.K.
In addition to his day-to-day responsibilities, Matthew sits on the Washington State Governors Council of Economic Advisors; chairs the Board of Trustees at the Washington Center for Real Estate Research at the University of Washington; and is an Advisory Board Member at the Runstad Center for Real Estate Studies at the University of Washington where he also lectures in real estate economics.
Q4 2021 Utah Real Estate Market Update

The following analysis of select counties of the Utah real estate market is provided by Windermere Real Estate Chief Economist Matthew Gardner. We hope that this information may assist you with making better-informed real estate decisions. For further information about the housing market in your area, please don’t hesitate to contact your Windermere Real Estate agent.
Regional Economic Overview
Utah closed 2021 strongly with solid employment gains and an annual growth rate of 4.7%. It has been almost a year since the state recovered all the jobs lost due to the pandemic—a remarkable statistic. Even more impressive is that the employment level is now more than 61,000 jobs higher than before COVID-19 hit. The counties covered by this report have added almost 50,000 new jobs over the past year, representing a growth rate of 3.8%. Such robust growth has driven the unemployment rate down to just 2.1%, a level not seen since the Labor Department started keeping records back in 1976. Utah’s economic growth continues to impress. I believe it could be even better if the number of people in the workforce was rising significantly, which isn’t the case. But all in all, the employment picture is extremely positive.
utah Home Sales
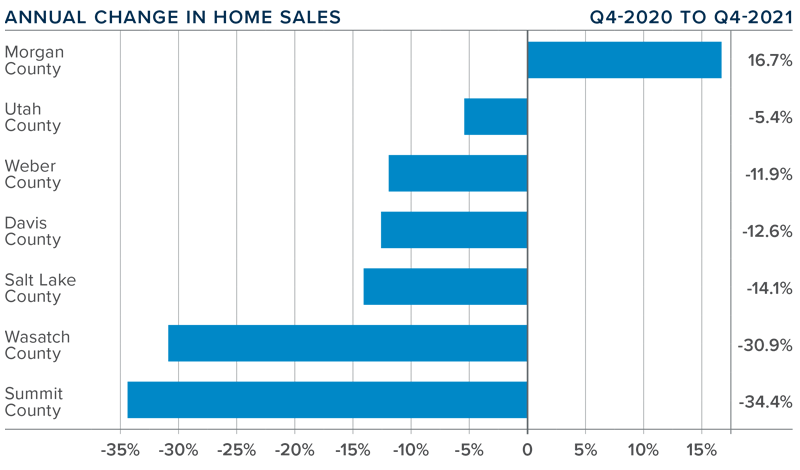
❱ In the final quarter of 2021, 9,158 homes sold, representing a 13.2% drop from a year ago and 11.6% lower than in the third quarter.
❱ Year-over-year, sales dropped in all areas except for Morgan County. Sales slowed in all counties other than Weber compared to the third quarter of 2021.
❱ The drop in sales between the third and fourth quarters doesn’t concern me and can be attributed to seasonal factors. Lower sales compared to a year ago may be due to the number of homes for sale, which was 11.2% lower than in the same quarter of 2020.
❱ Pending sales, which are an indicator of future closings, were down 4% relative to the third quarter, suggesting that sales in the first quarter of 2022 may not rise significantly.
utah Home Prices
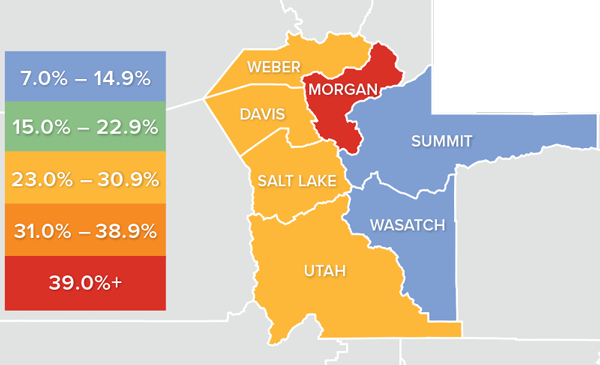
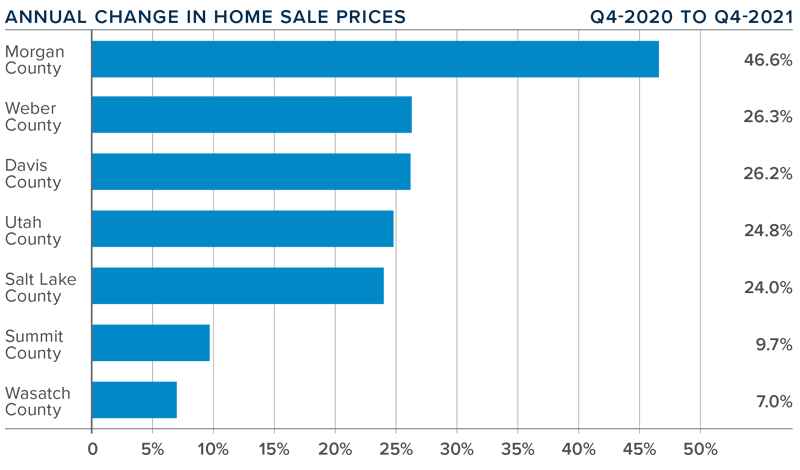
❱ Given Utah’s strong economy, it’s not surprising that home prices continue to rise significantly. Year over year, prices rose 17.3% to an average of $602,369. Prices were also .3% higher than in the third quarter of 2021.
❱ Compared to the third quarter, prices rose in Salt Lake, Utah, and Summit counties, but were down in the balance of the market areas.
❱ All areas contained in the report except for Summit and Wasatch counties saw prices rise by double digits. Morgan County’s rise was particularly impressive.
❱ The pace of price growth has slowed, but only very modestly. Whether this was a function of mortgage rates, which started rising in the quarter, is unclear. I expect rates to continue rising as we move through the year, which may have a compressing effect on price growth.
Days on Market
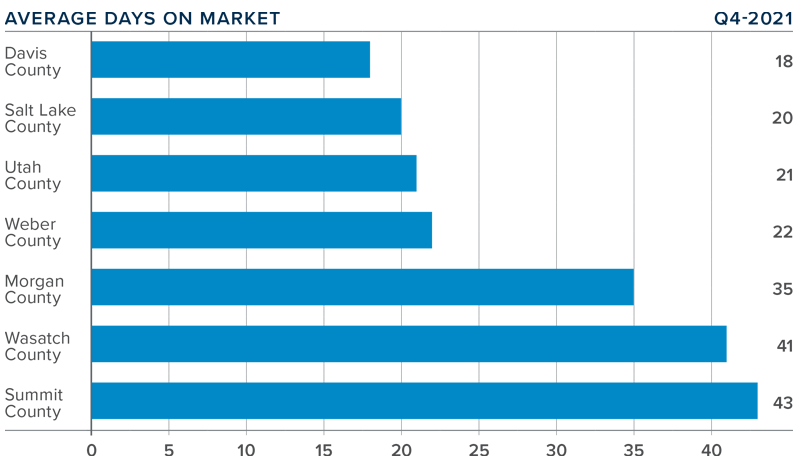
❱ The average amount of time it took to sell a home in the counties covered by this report dropped five days compared to the final quarter of 2020.
❱ Homes sold fastest in Davis County, with all but two counties seeing average time on market drop. Relative to a year ago, the greatest decline in market time was in Summit County, where it took 29 fewer days to sell a home.
❱ During the quarter, it took an average of 28 days to sell a home in the region. Although this is lower than a year ago, it was up 6 days compared to the third quarter of the year.
❱ The modest increase in market time is not very surprising given the frenetic market in 2020. The question is whether the pace of sales will increase as we move into the spring selling season.
Conclusions
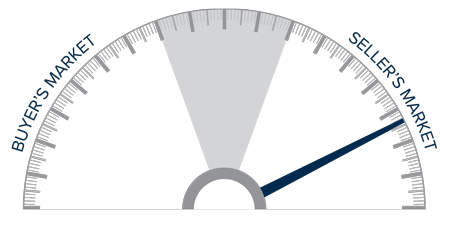
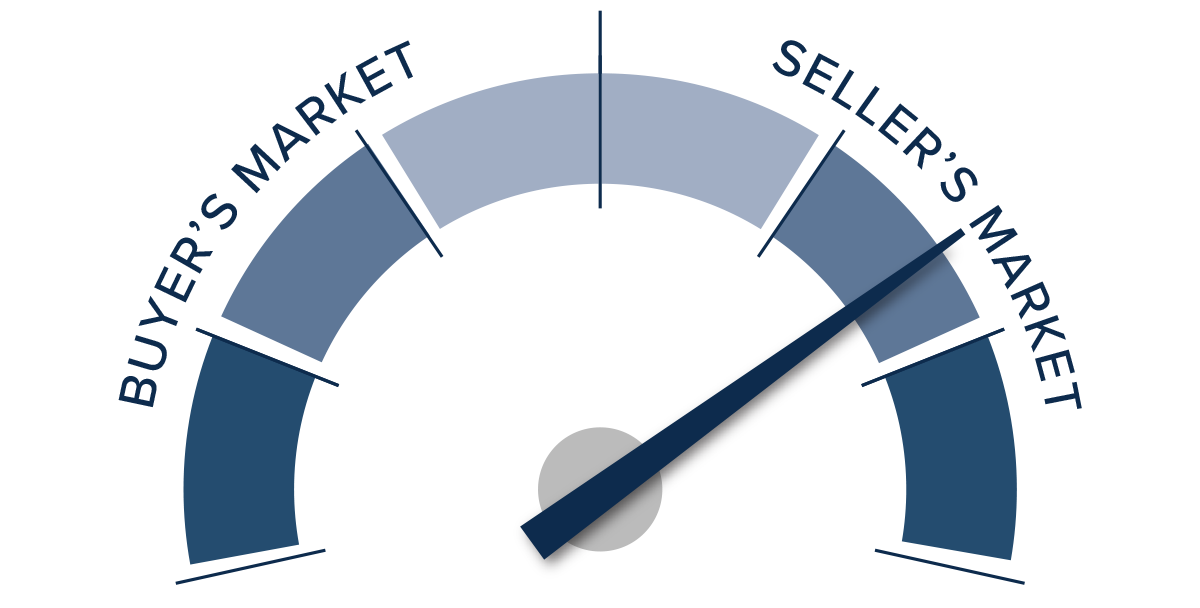
This speedometer reflects the state of the region’s real estate market using housing inventory, price gains, home sales, interest rates, and larger economic factors.
Utah’s rock-solid economy has been a major boost to the housing market. Prices continue to increase at a very impressive pace, but we will have to wait and see if this is sustainable given that mortgage rates are expected to continue rising in the coming months.
My current 2022 forecast suggests that, despite a very modest decrease in the pace of price growth compared to 2021, prices will rise by more than 10% in all the counties in this report. A few may even rise by close to 20%.
To say that it is a seller’s market in Utah would be an understatement. In the coming year, I don’t expect the housing supply to satisfy demand, which will cause prices to rise higher even in the face of rising mortgage rates. As such, I have moved the needle a little more toward sellers.
About Matthew Gardner

As Chief Economist for Windermere Real Estate, Matthew Gardner is responsible for analyzing and interpreting economic data and its impact on the real estate market on both a local and national level. Matthew has over 30 years of professional experience both in the U.S. and U.K.
In addition to his day-to-day responsibilities, Matthew sits on the Washington State Governors Council of Economic Advisors; chairs the Board of Trustees at the Washington Center for Real Estate Research at the University of Washington; and is an Advisory Board Member at the Runstad Center for Real Estate Studies at the University of Washington where he also lectures in real estate economics.
Q3 2021 Utah Real Estate Market Update

The following analysis of select counties of the Utah real estate market is provided by Windermere Real Estate Chief Economist Matthew Gardner. We hope that this information may assist you with making better-informed real estate decisions. For further information about the housing market in your area, please don’t hesitate to contact your Windermere Real Estate agent.
Regional Economic Overview
The summer months saw continued growth in Utah’s labor market, which had already recovered all of the jobs lost to COVID-19 earlier this spring. The latest data available (August 2021) showed non-agricultural employment 48,100 jobs higher than the pre-pandemic peak. With the healthy growth in jobs, the unemployment rate currently stands at 2.6%, a level that has not been seen since before the pandemic hit. As impressive as the current jobless rate is, it is also worth noting that unemployment continued to fall even as the labor force expanded to a point never seen in the state before. Utah’s economy is currently in great shape, and short of any unforeseeable events, I see no reason why anything would derail the impressive growth the area has experienced.
utah Home Sales
❱ In the third quarter of 2021, 10,356 homes were sold, representing an 18.3% drop from a year ago. This is not really a concern given that during third quarter last year the area was in the midst of a COVID-induced housing boom, which is skewing the numbers. What is more informative was that sales rose 6.9% from the previous quarter.
❱ Year-over-year, sales dropped across the board. However, compared to the prior quarter they rose in all counties other than Salt Lake and Morgan—though the drop in both counties was only seven sales.
❱ The increase in sales compared to the previous quarter was aided by a significant increase in the number of listings in the counties contained in this report, which jumped more than 36% from the second quarter of this year.
❱ Pending sales, an indicator of future closings, were up in all markets other than Salt Lake. The 2.8% increase from the second quarter suggests that sales in the final quarter of the year may continue to show improvement.
utah Home Prices
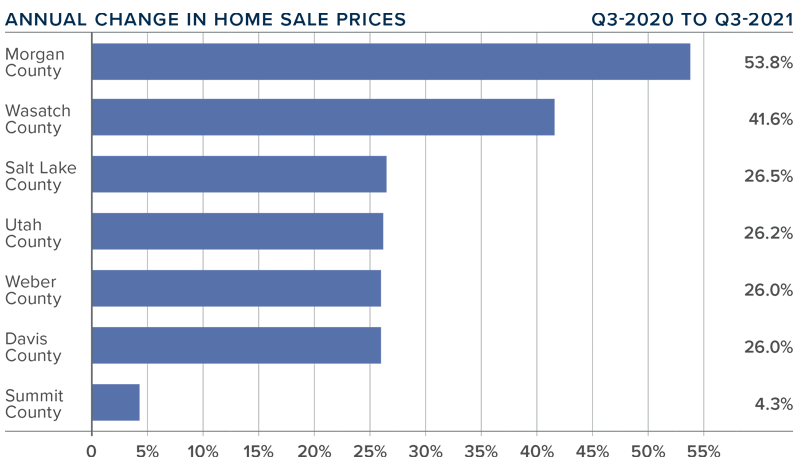
❱ With the economy performing extremely well, and mortgage rates holding close to their historic lows, it was not surprising to see sale prices continue to trend higher. Compared to a year ago, prices were up 23.8% to an average of $600,715. Prices also came in 3.8% higher than in the second quarter of this year.
❱ Although Summit County appears to be underperforming, it is worth noting that it is the most expensive county in this report, with an average price in the third quarter of $1.58 million. I am not particularly concerned at the decline since it is likely to be short-lived.
❱ All counties contained in the report except Summit saw prices increase by double-digits relative to a year ago. All counties but Summit also saw impressive gains compared to the previous quarter.
❱ In the second quarter Gardner Report, I suggested that the annual change in home prices was going to soften, which proved accurate. Although price growth remains well above the long-term average, I expect to see the pace of growth continue to slow as we close out the year.
Days on Market
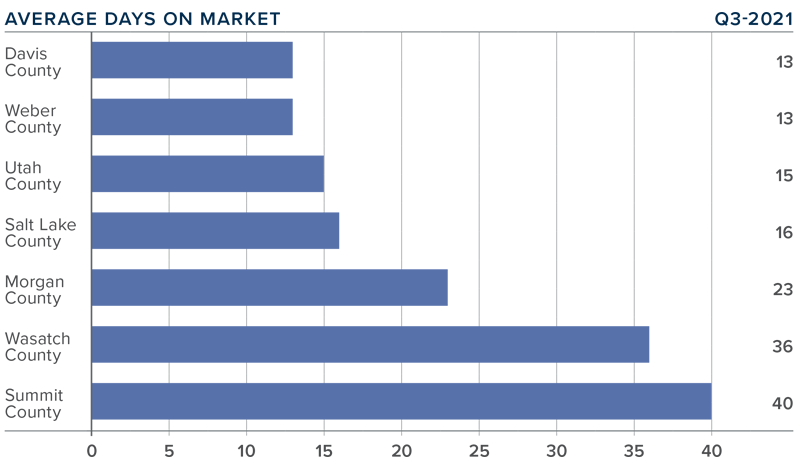
❱ The average number of days it took to sell a home in the counties covered by this report dropped 21 days compared to the third quarter of 2020.
❱ Homes again sold fastest in Davis County, which was one of only two counties with average sale time below two weeks. Relative to a year ago, the greatest drop in market time was in Summit County, where it took 41 fewer days to sell a home.
❱ During the quarter, it took an average of 22 days to sell a home in the region. Although this is lower than a year ago, it was up 3 days compared to the second quarter of this year.
❱ Rising inventory levels led to more choice in the market, which put slight upward pressure on market time. This is not a concern, and though it might please home buyers, we are still far from a balanced housing market.
Conclusions
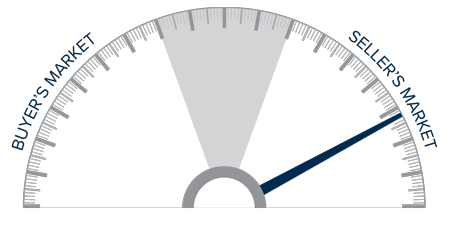
This speedometer reflects the state of the region’s real estate market using housing inventory, price gains, home sales, interest rates, and larger economic factors.
Utah’s economy stands on very solid ground. A stable economy and historically low mortgage rates are very stimulative to home buyers. Even though we have seen inventory levels grow and market time rise modestly—both of which favor home buyers—the data in aggregate is still heavily in favor of home sellers. As such, I have moved the needle a little more in their favor.
About Matthew Gardner
As Chief Economist for Windermere Real Estate, Matthew Gardner is responsible for analyzing and interpreting economic data and its impact on the real estate market on both a local and national level. Matthew has over 30 years of professional experience both in the U.S. and U.K.
In addition to his day-to-day responsibilities, Matthew sits on the Washington State Governors Council of Economic Advisors; chairs the Board of Trustees at the Washington Center for Real Estate Research at the University of Washington; and is an Advisory Board Member at the Runstad Center for Real Estate Studies at the University of Washington where he also lectures in real estate economics.
Q2 2021 Utah Real Estate Market Update

The following analysis of select counties of the Utah real estate market is provided by Windermere Real Estate Chief Economist Matthew Gardner. We hope that this information may assist you with making better-informed real estate decisions. For further information about the housing market in your area, please don’t hesitate to contact your Windermere Real Estate agent.
Regional Economic Overview
Utah’s impressive post-COVID job recovery continues unabated. In the first quarter Gardner Report, I reported that the state had not only recovered all the jobs that were lost due to the pandemic, but employment was continuing to rise. This trend has continued. With 96,400 jobs added over the past year and 14,500 over the past quarter, total employment is now 26,900 jobs higher than the pre-pandemic peak. The only other state in the country that has recovered all the jobs lost due to COVID is Idaho. With a full recovery in the job market, it’s no surprise the jobless rate dropped further to 2.7% in June—its lowest level since March 2020 and the second-lowest rate in the nation; only Nebraska is lower at 2.5%.
utah Home Sales
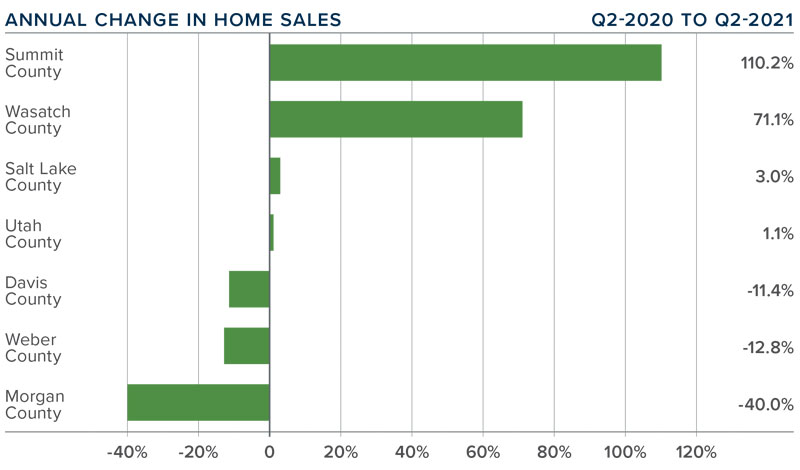
❱ In the second quarter of 2021, 9,689 homes sold, representing a modest 1.2% increase year over year, and a very significant 42% increase compared to the first quarter of the year.
❱ Sales activity rose in four counties but dropped in three. Summit County saw a massive increase in sales. Wasatch County also saw impressive gains. Sales dropped most in Morgan County, but because this is a very small market I’m not concerned.
❱ What aided the jump in sales from the first quarter was an increase in listing activity. Inventory of available homes rose more than 50% compared to the first quarter. Although this is good news, listing activity is still down more than 55% from this time a year ago.
❱ Pending sales rose across the board compared to the first quarter, with significant increases in Utah, Davis, Salt Lake, and Wasatch counties. With pending sales up more than 30% from the prior quarter, there will likely be solid growth in closed sales in the upcoming quarter.
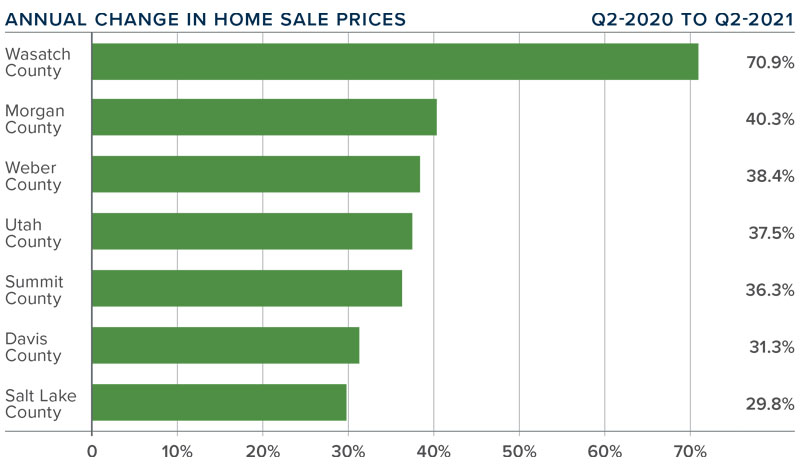
utah Home Prices
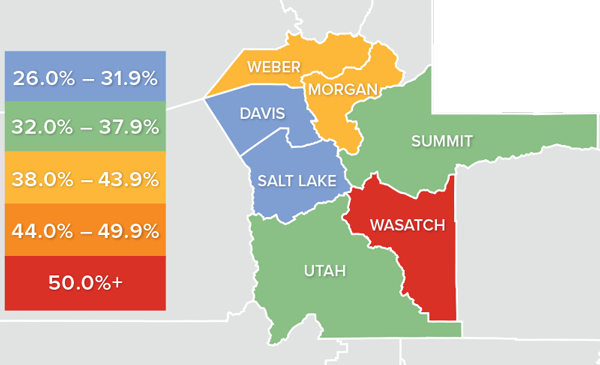
❱ A rock-solid economy and low mortgage rates had buyers out in force. That said, even with supply levels improving, demand is still outpacing supply, which has led to significant price gains. Year over year, the average home price in the region rose 41.8% to $578,648. Prices were 8% higher than in the first quarter of 2021.
❱ Although the data shows remarkable home price growth, the pandemic had a significant impact on housing during the second quarter of last year. As such, I anticipate the yearly change in prices will soften in the third quarter but remain well above the long-term average.
❱ Home price growth was led by Wasatch County, but rose by very significant rates across all the counties contained in this report. Of note is that Summit and Wasatch counties saw average sale prices above the $1 million level in the second quarter.
❱ The takeaway here is that, while the number of homes on the market did improve relative to the previous quarter, there continues to be a shortfall in inventory, which has led prices to rise at a significant pace.
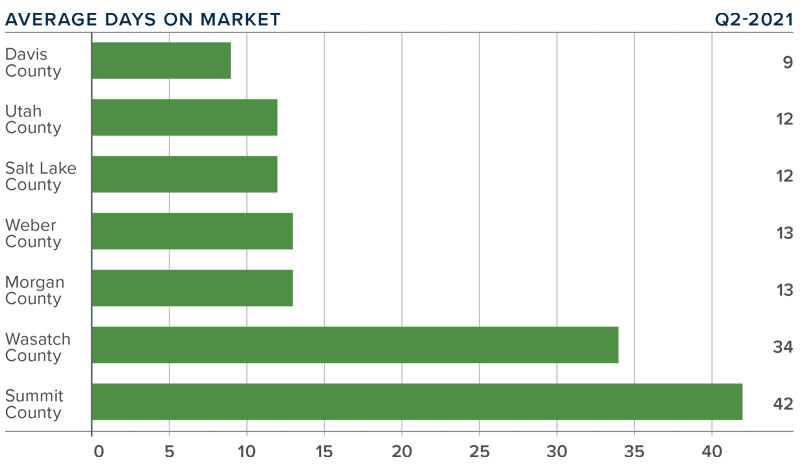
Days on Market
❱ The average number of days it took to sell a home in the counties covered by this report dropped 28 days compared to the second quarter of 2020.
❱ Homes sold fastest in Davis County, with sales occurring in less than two weeks in an additional four counties. The greatest drop in market time was in Summit County, where it took 63 fewer days to sell a home than it did a year ago.
❱ During the second quarter, it took an average of only 19 days to sell a home in the region, which is down 14 days compared to the first quarter of this year.
❱ Days-on-market data provided further proof of the supply/demand imbalance mentioned throughout this report. Unfortunately, I do not see any signs of supply levels rising enough to meet buyer demand.
Conclusions
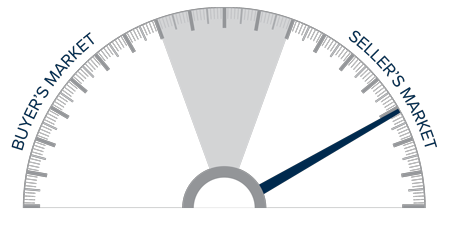
This speedometer reflects the state of the region’s real estate market using housing inventory, price gains, home sales, interest rates, and larger economic factors.
Strong economic growth—in concert with persistently low mortgage rates—continues to drive housing demand. Even with the increase in listings in the second quarter, many buyers are frustrated by the level of competition for the homes that are for sale.
It remains, undeniably, a seller’s market, and I have therefore moved the needle a little more in their favor.
About Matthew Gardner
As Chief Economist for Windermere Real Estate, Matthew Gardner is responsible for analyzing and interpreting economic data and its impact on the real estate market on both a local and national level. Matthew has over 30 years of professional experience both in the U.S. and U.K.
In addition to his day-to-day responsibilities, Matthew sits on the Washington State Governors Council of Economic Advisors; chairs the Board of Trustees at the Washington Center for Real Estate Research at the University of Washington; and is an Advisory Board Member at the Runstad Center for Real Estate Studies at the University of Washington where he also lectures in real estate economics.
")


