
 Facebook
 X
X
 Pinterest
 Copy Link
Q3 2023 Montana Real Estate Market Update

The following analysis of select counties of the Montana real estate market is provided by Windermere Real Estate. We hope that this information may assist you with making better-informed real estate decisions. For further information about the housing market in your area, please don’t hesitate to contact your Windermere Real Estate agent.
Regional Economic Overview
The pace of job growth in Montana continues to taper. The state added only 6,000 jobs, which represents an annual growth rate of 1.2%. This is the slowest pace of growth in the state since pandemic influences started to come into play.
Regional variations continued: the Billings metro area lost 600 jobs, Great Falls employment was flat, and the Missoula metro area saw employment rise 1,100 jobs.
The state unemployment rate in August was 2.5%, which was down from 2.7% in the same period of 2022. All metro areas in this report showed unemployment rates of 2.5%.
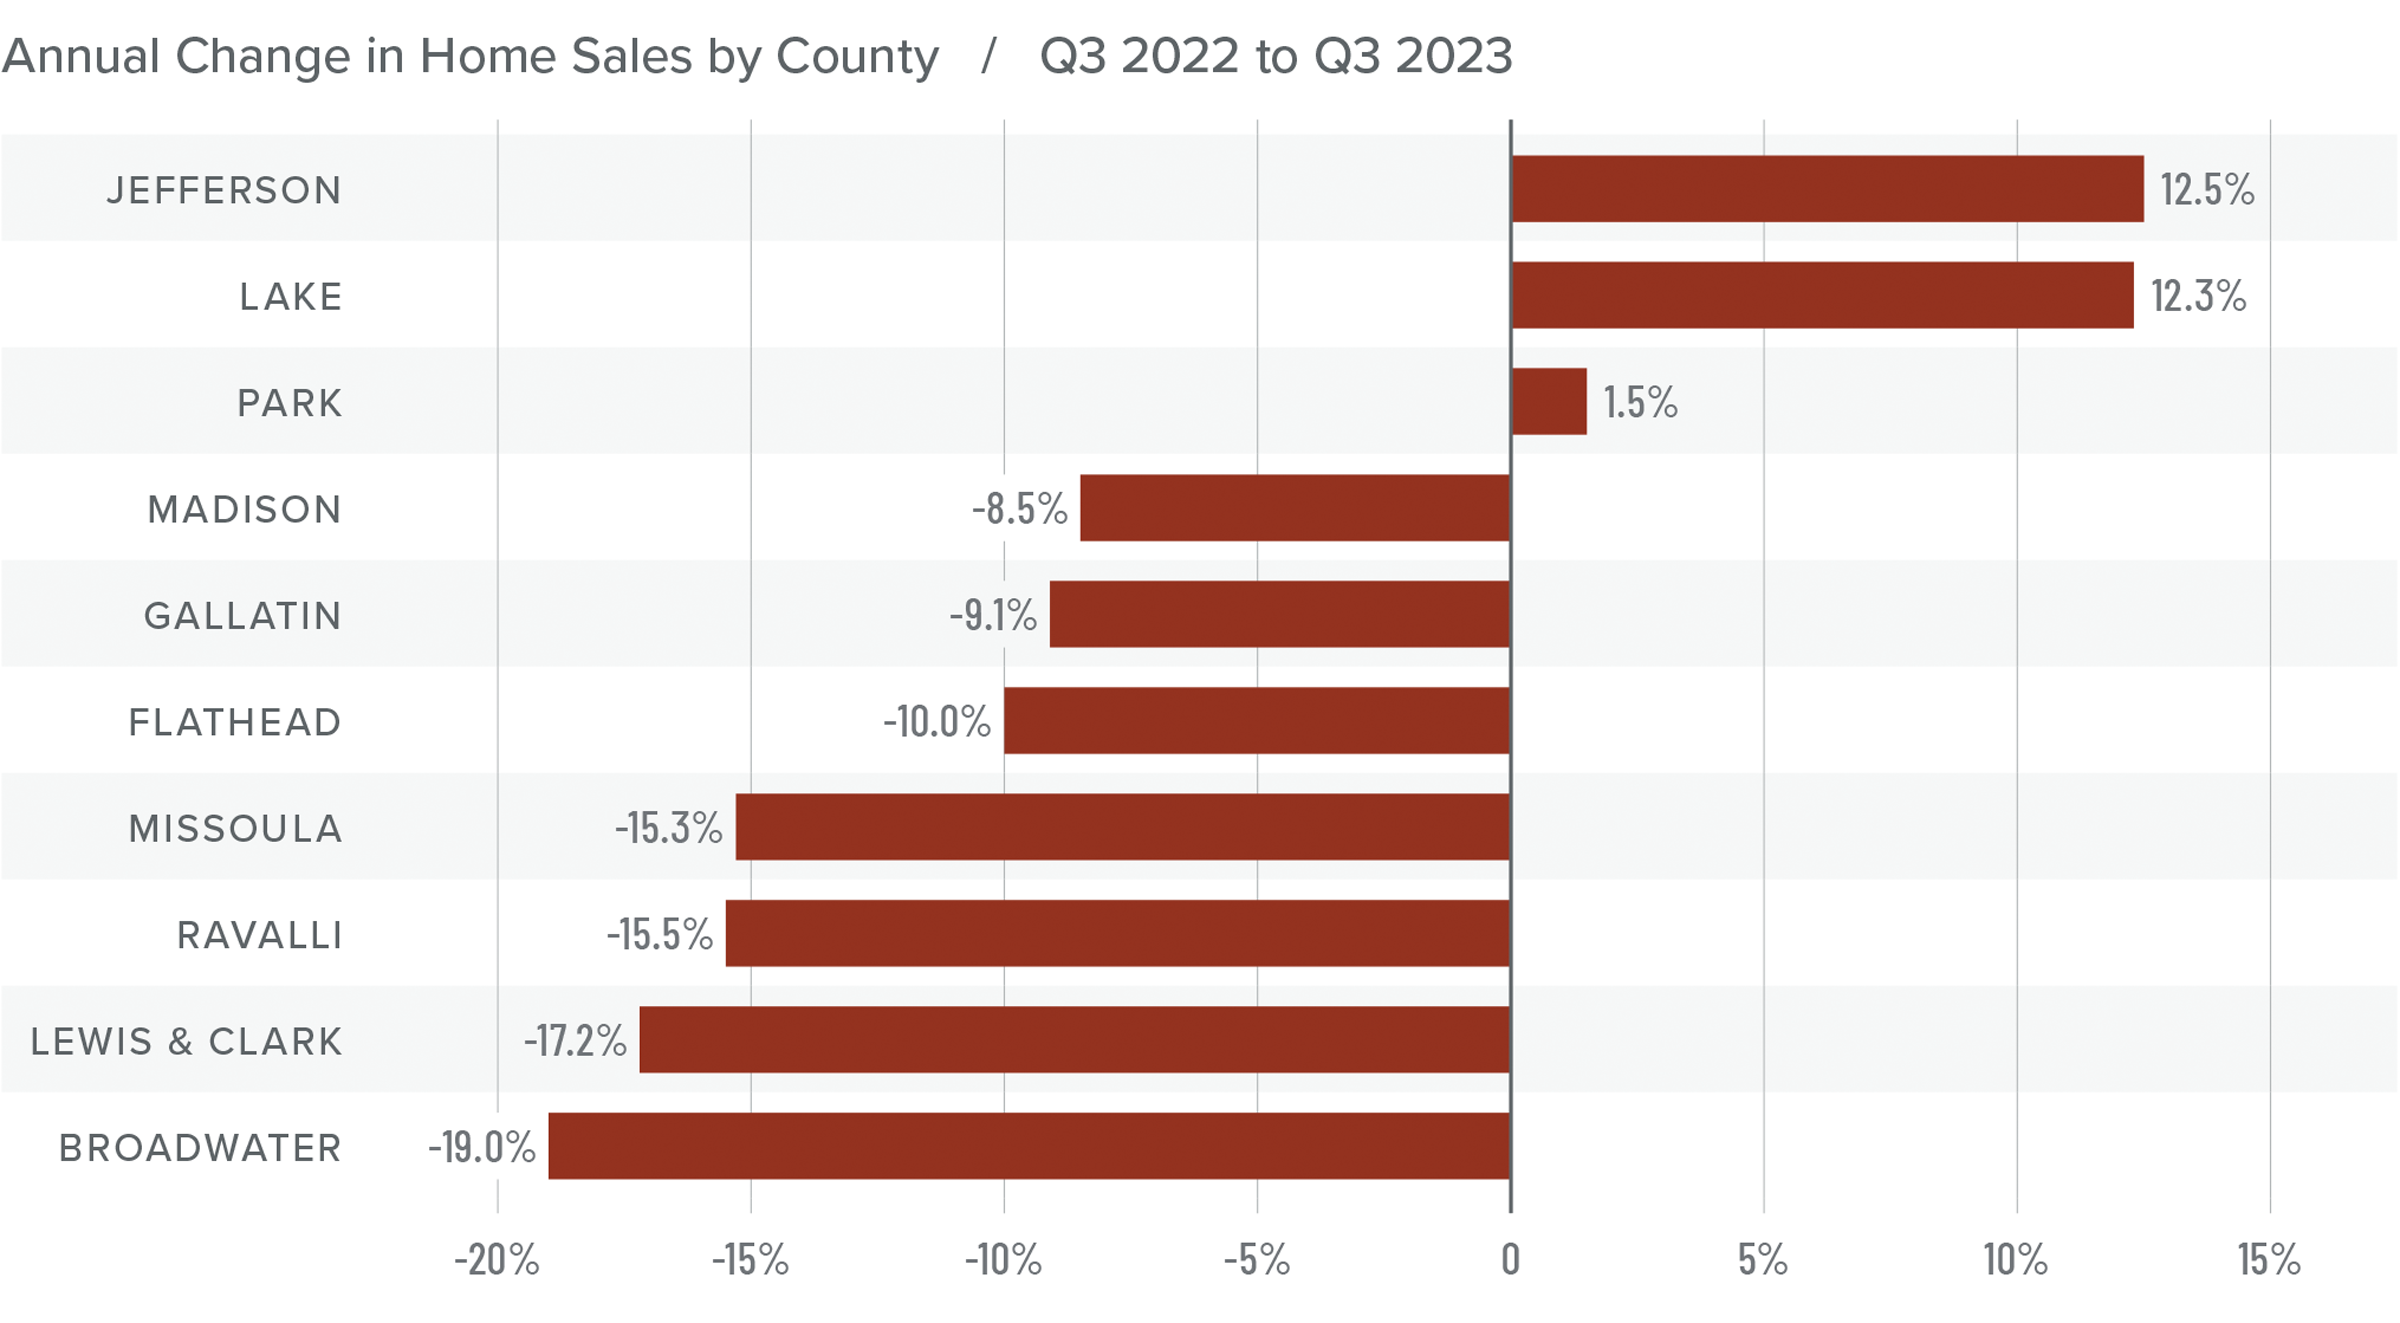
Montana Home Sales
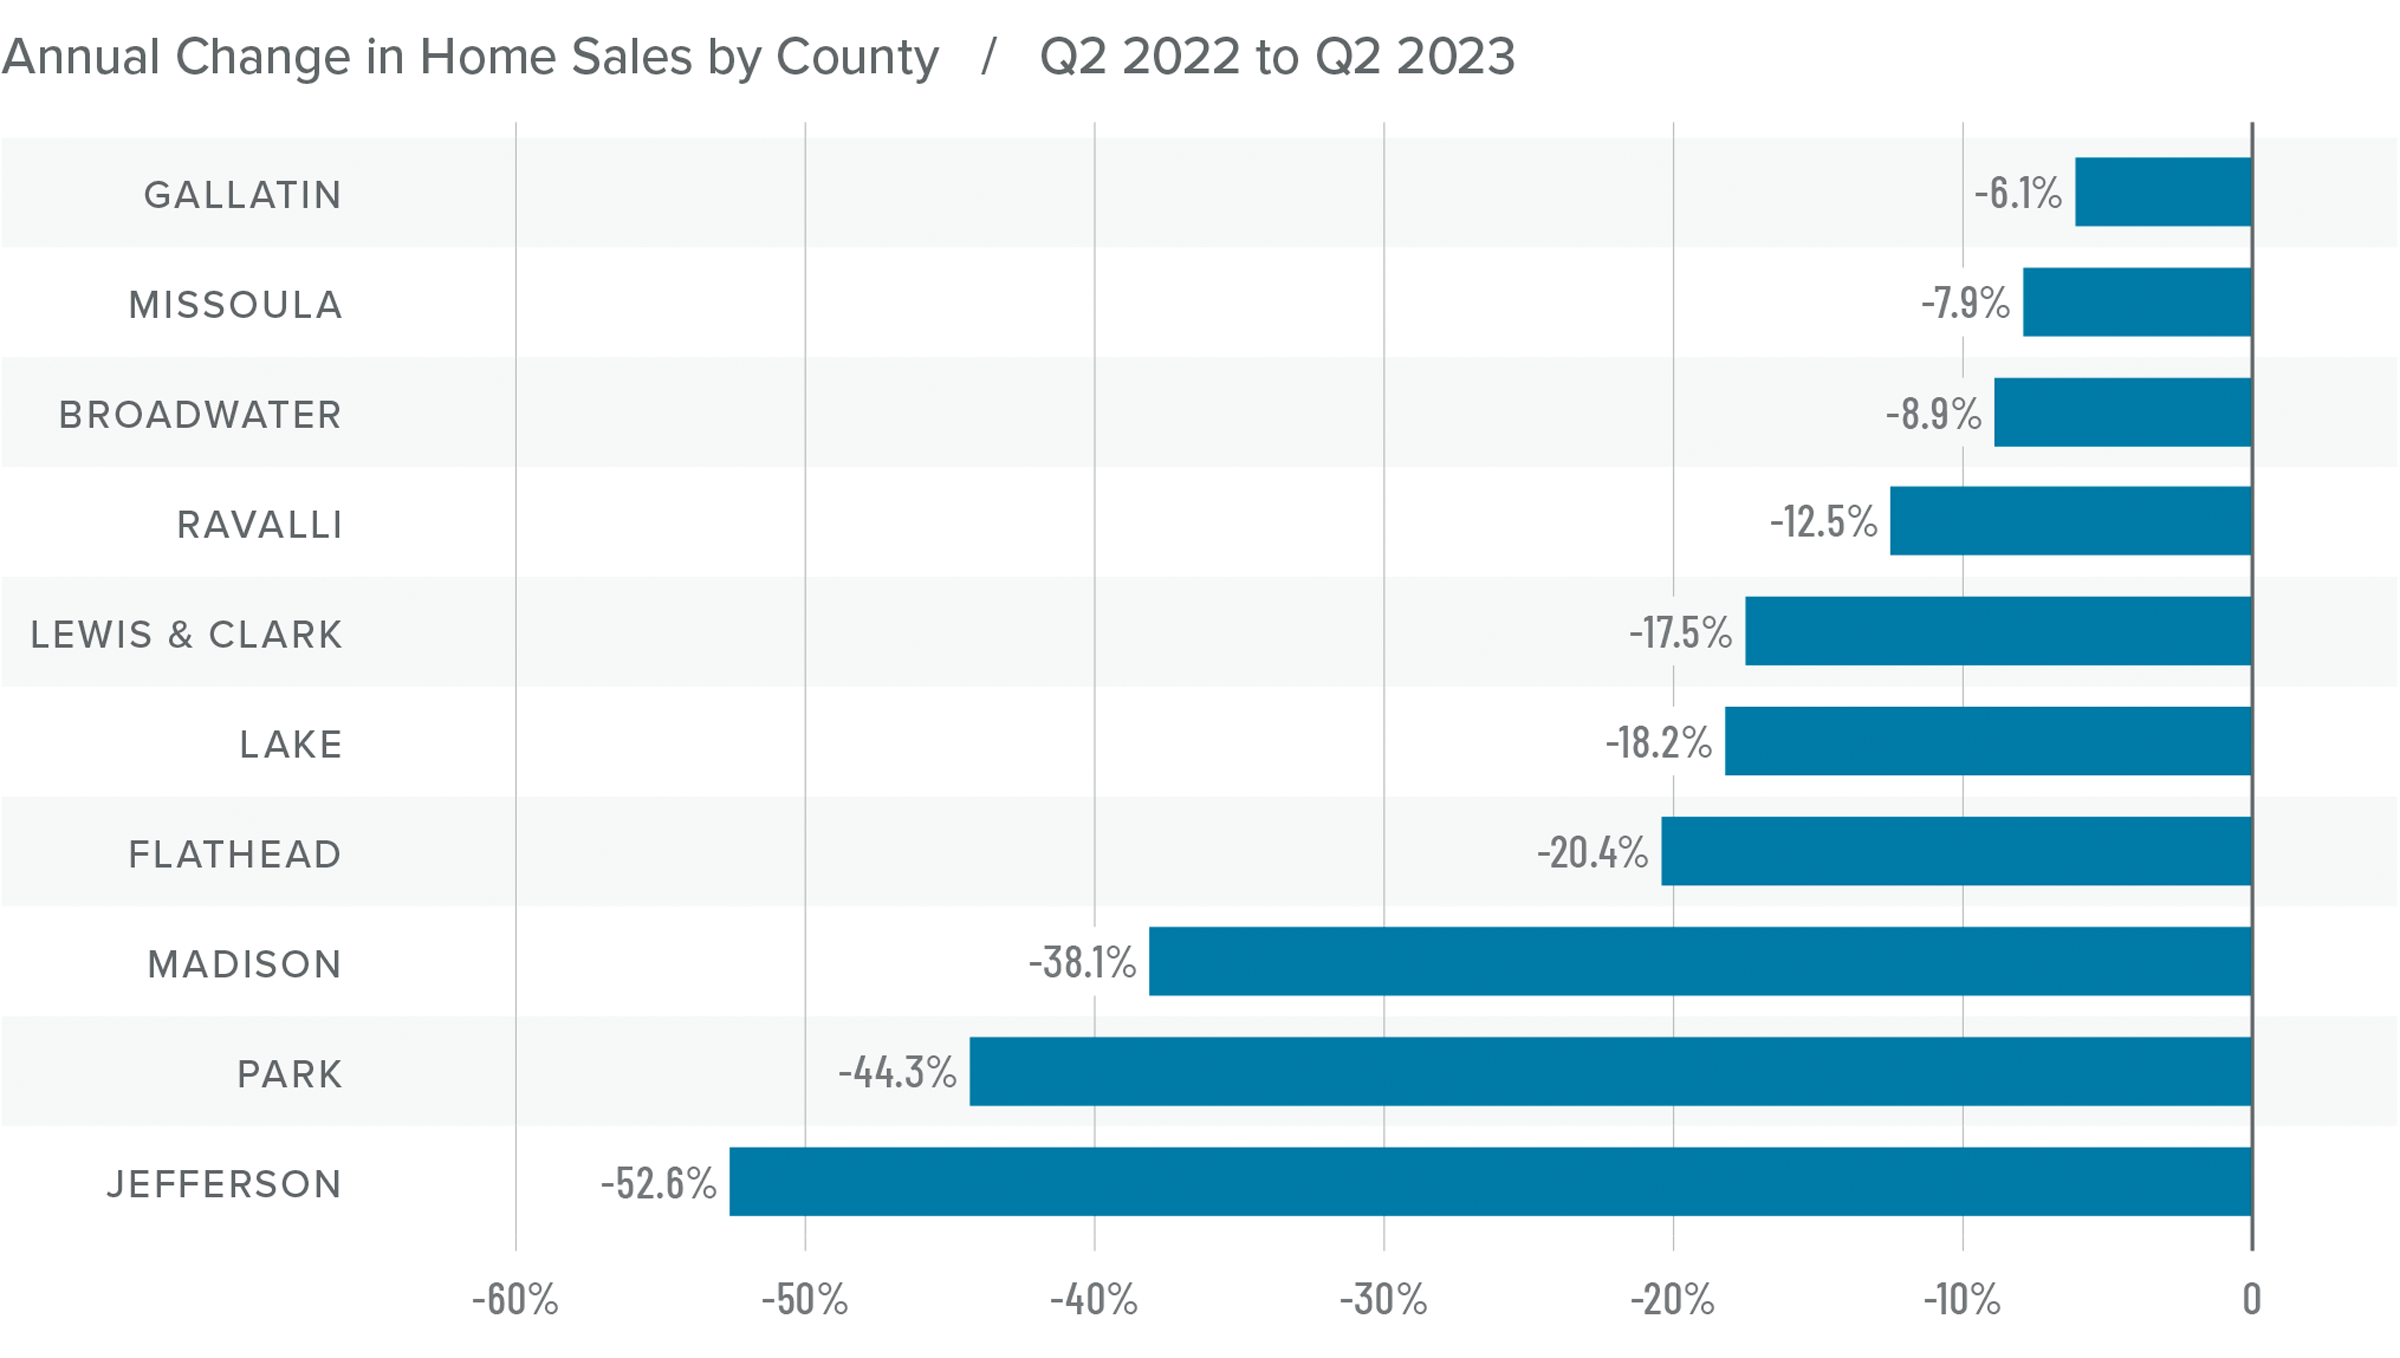
❱ In the third quarter of 2023, 1,959 homes sold in the counties covered by this report. This was a 10.8% decline from the third quarter of 2022 but 7% higher than in the second quarter of 2023.
❱ Listing activity was 9.6% higher than during the same period of 2022 and 30.2% higher than in the second quarter of this year.
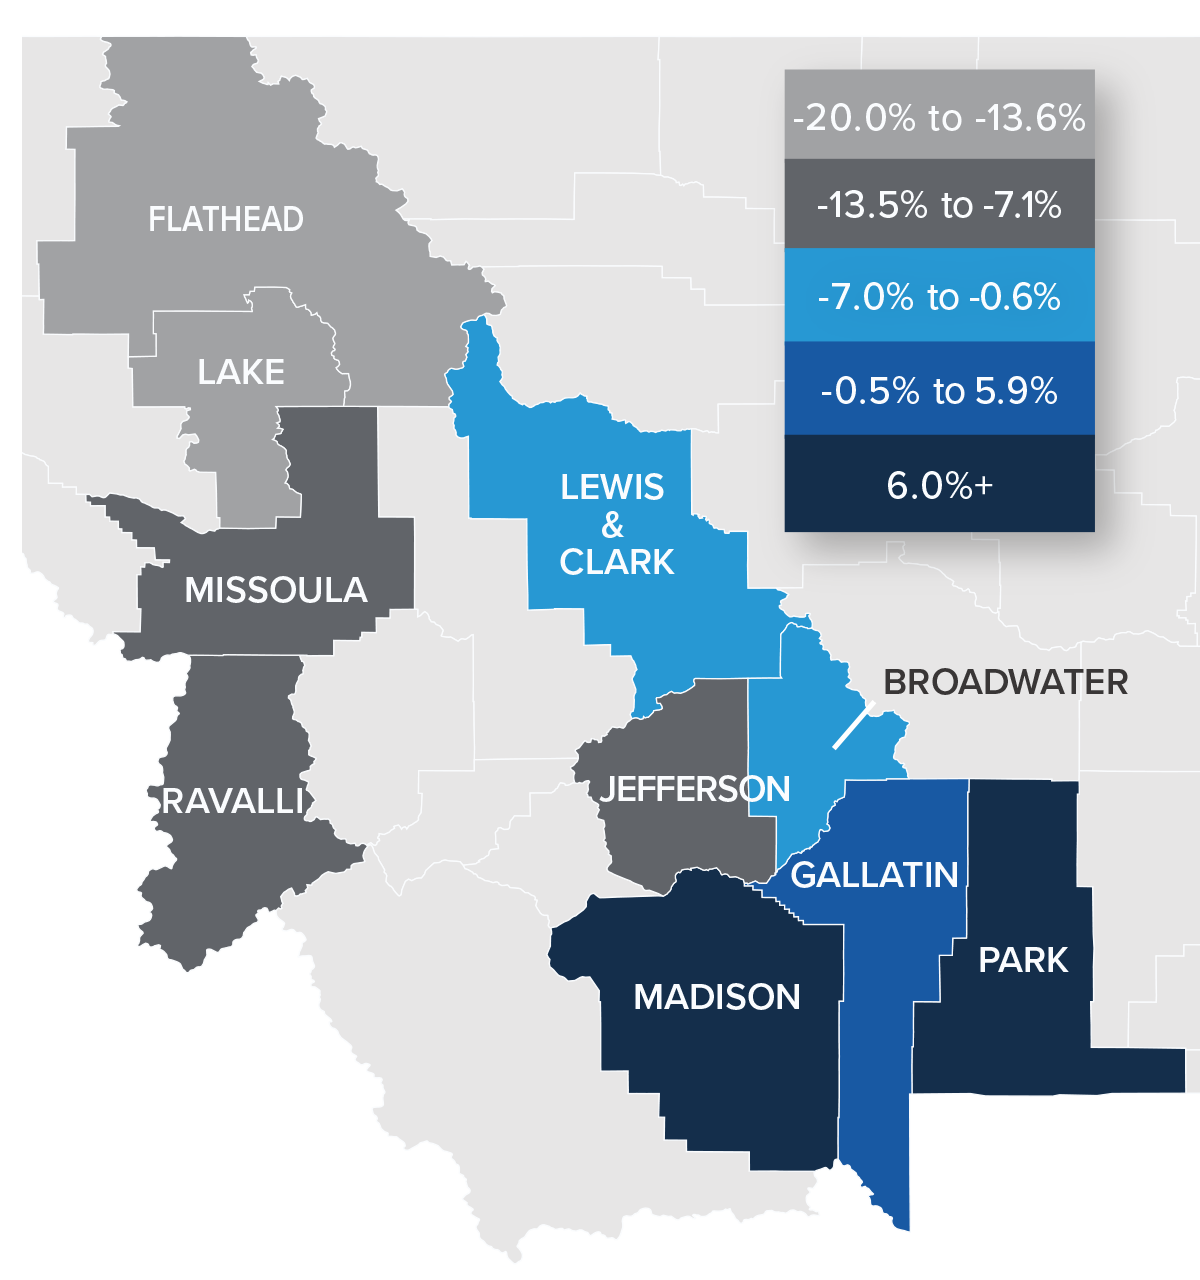
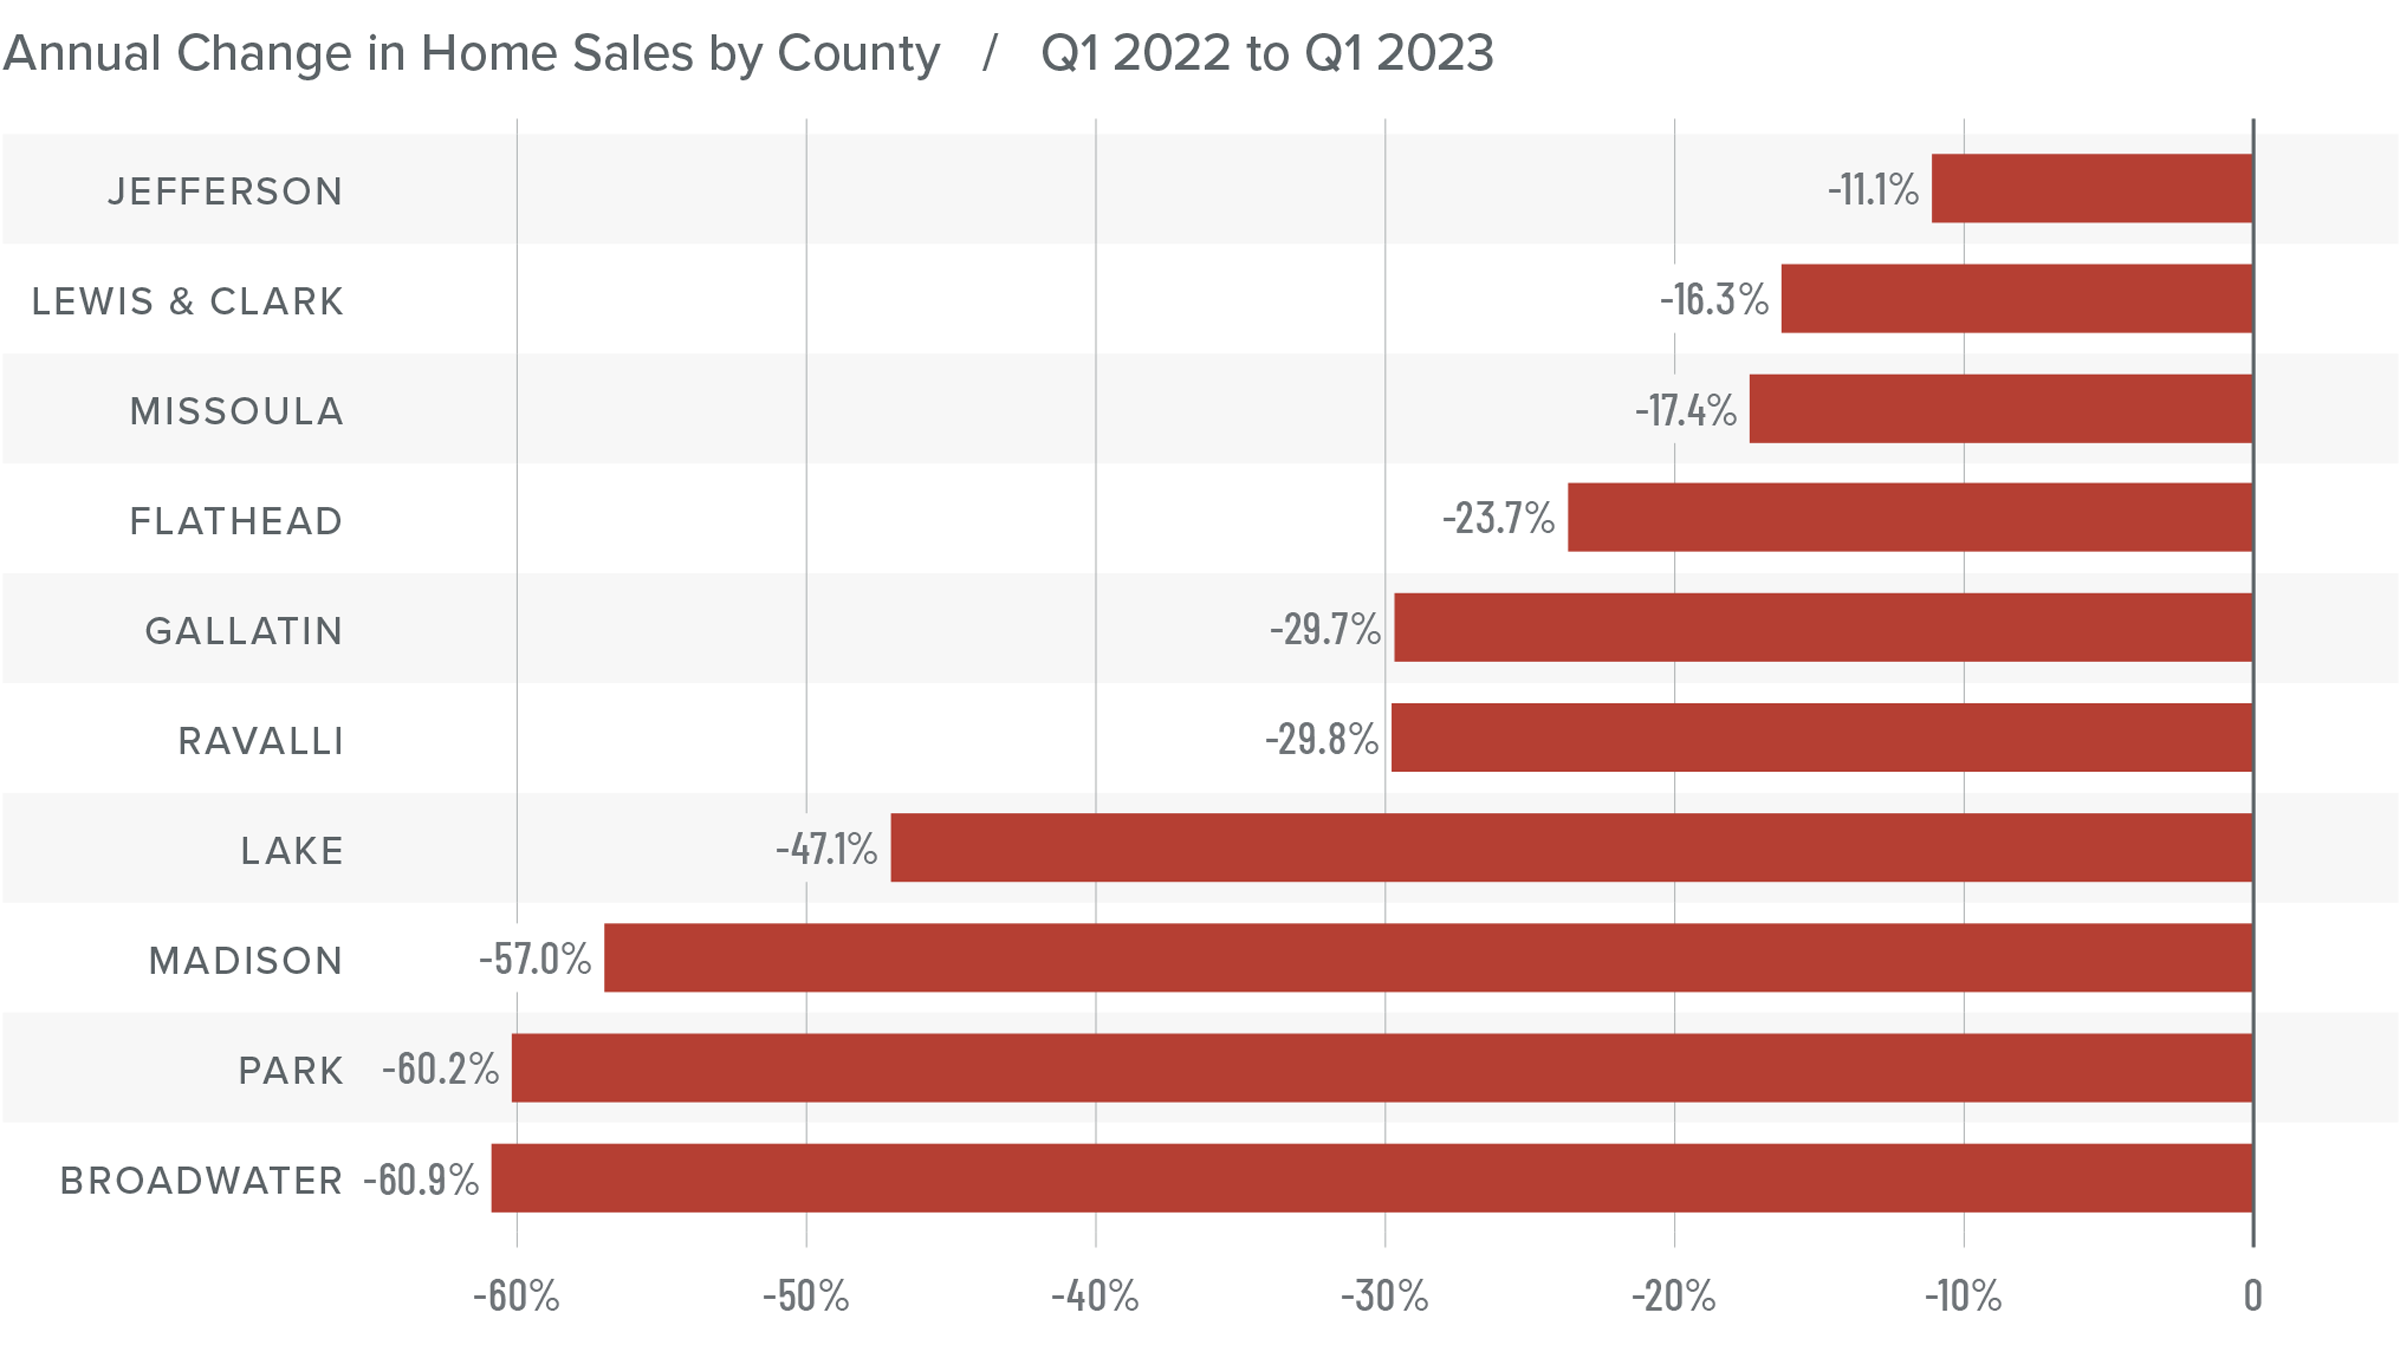
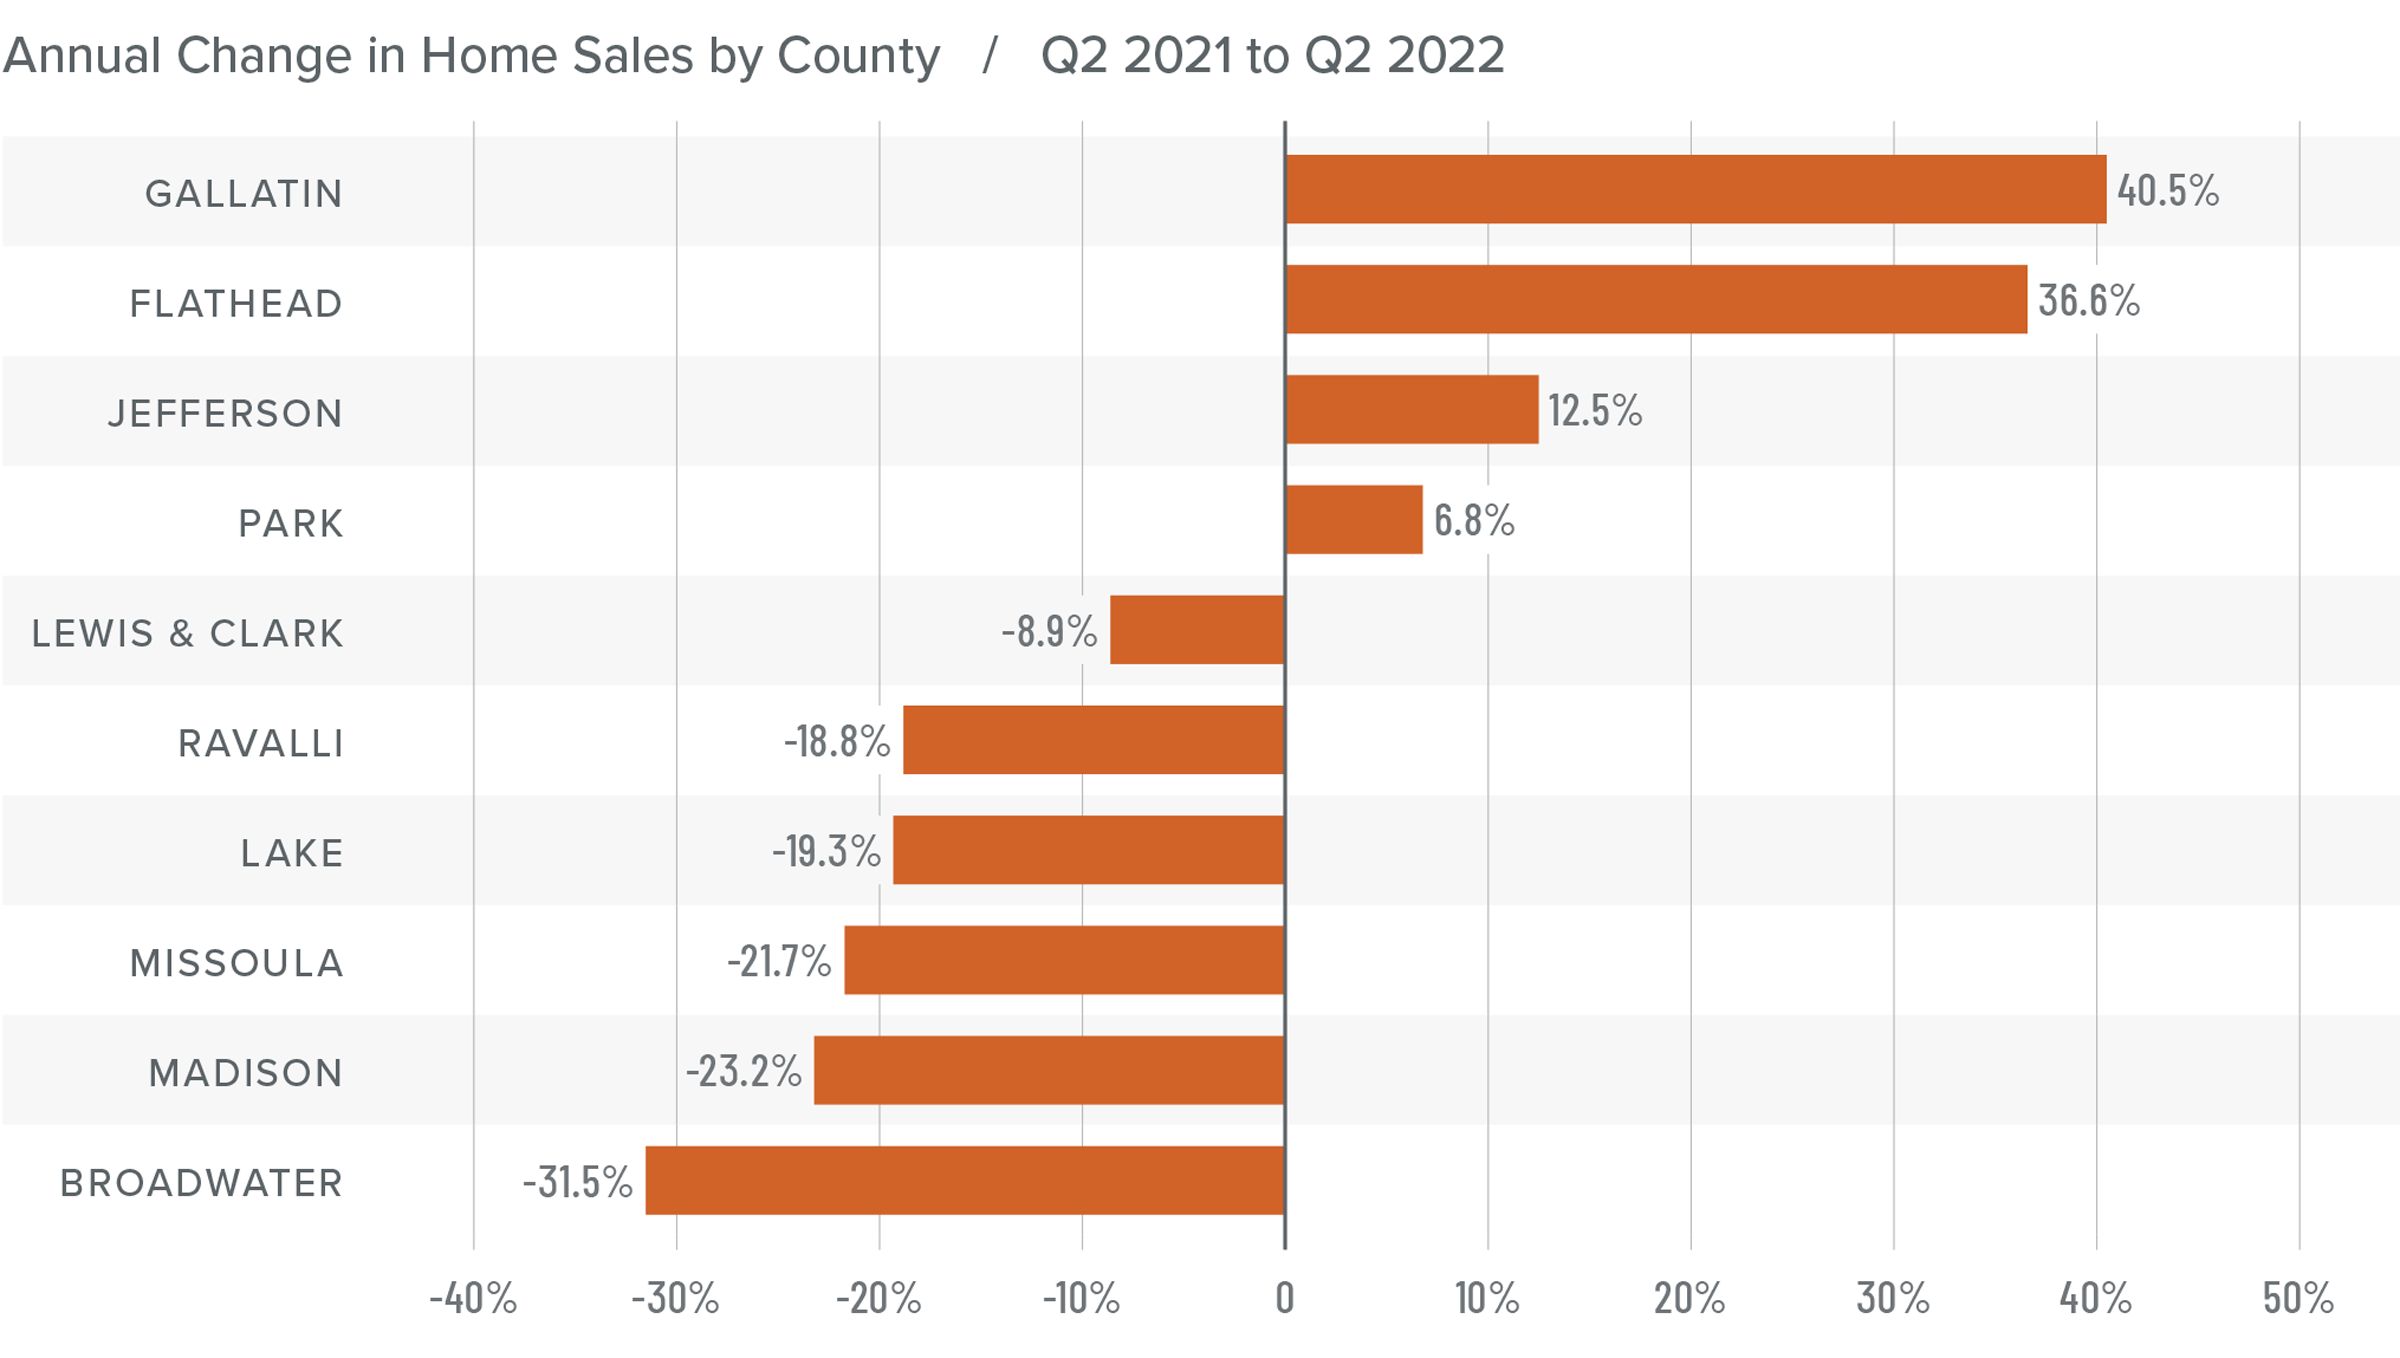
❱ Year over year, sales fell in all but three markets. Compared to the second quarter of this year, sales were up in every county other than Broadwater and Ravalli, where sales were down 37% and 7.4%, respectively.
❱ Pending sales fell 24.2% quarter over quarter, suggesting that closings in the final quarter of the year may be down.
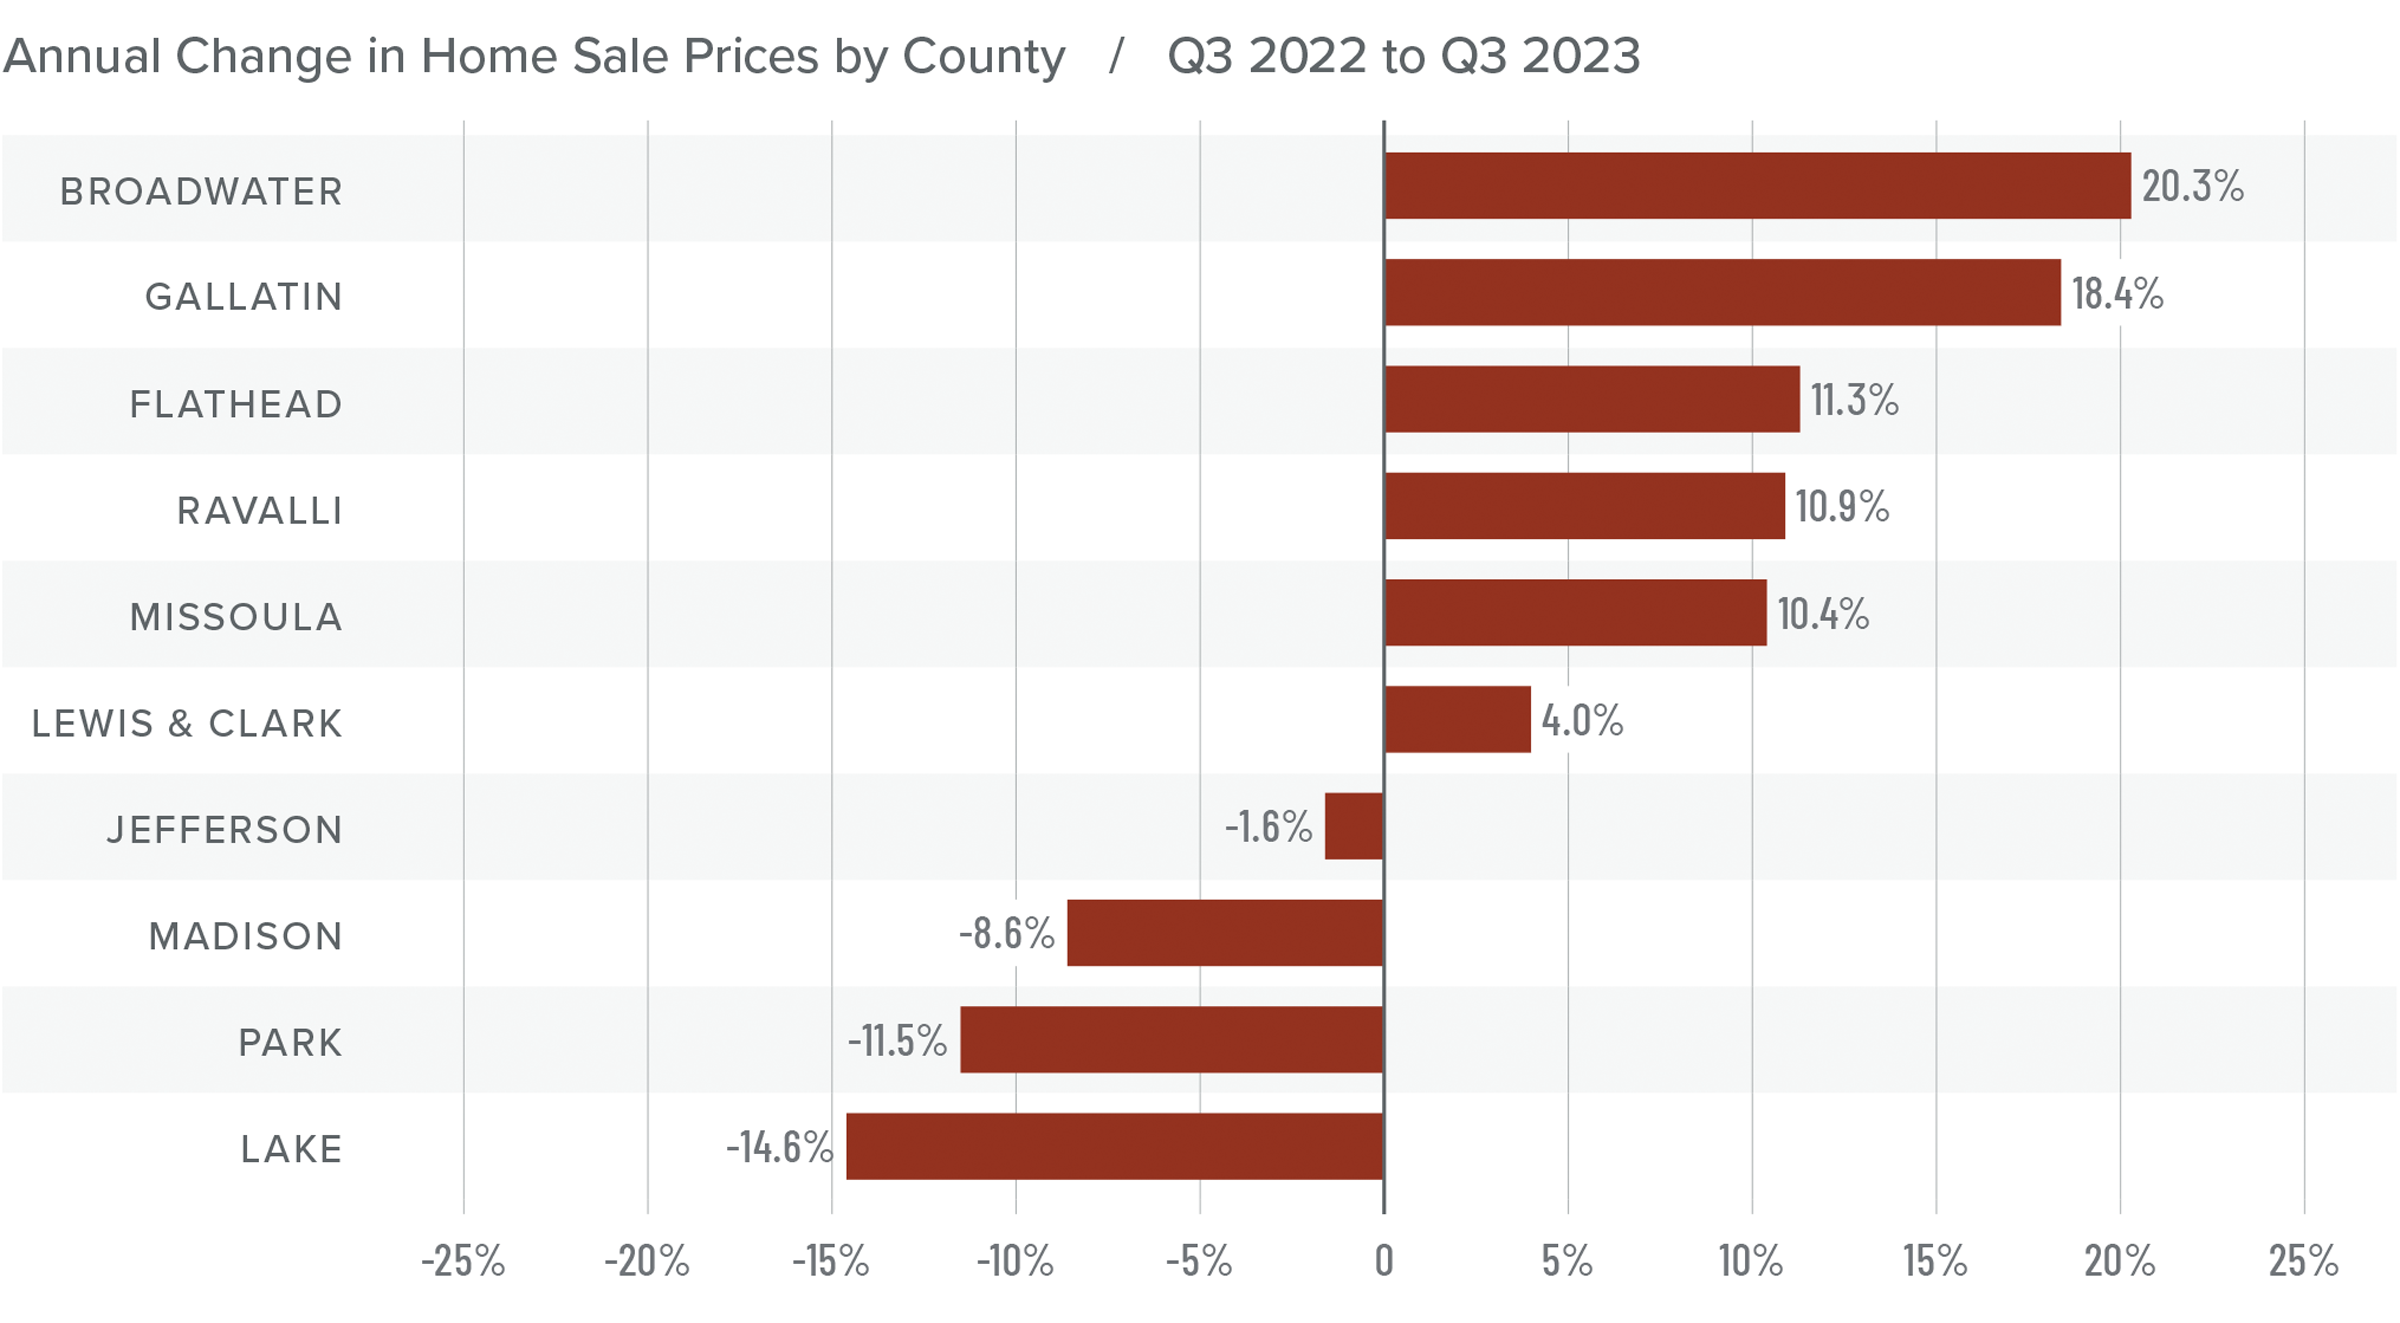
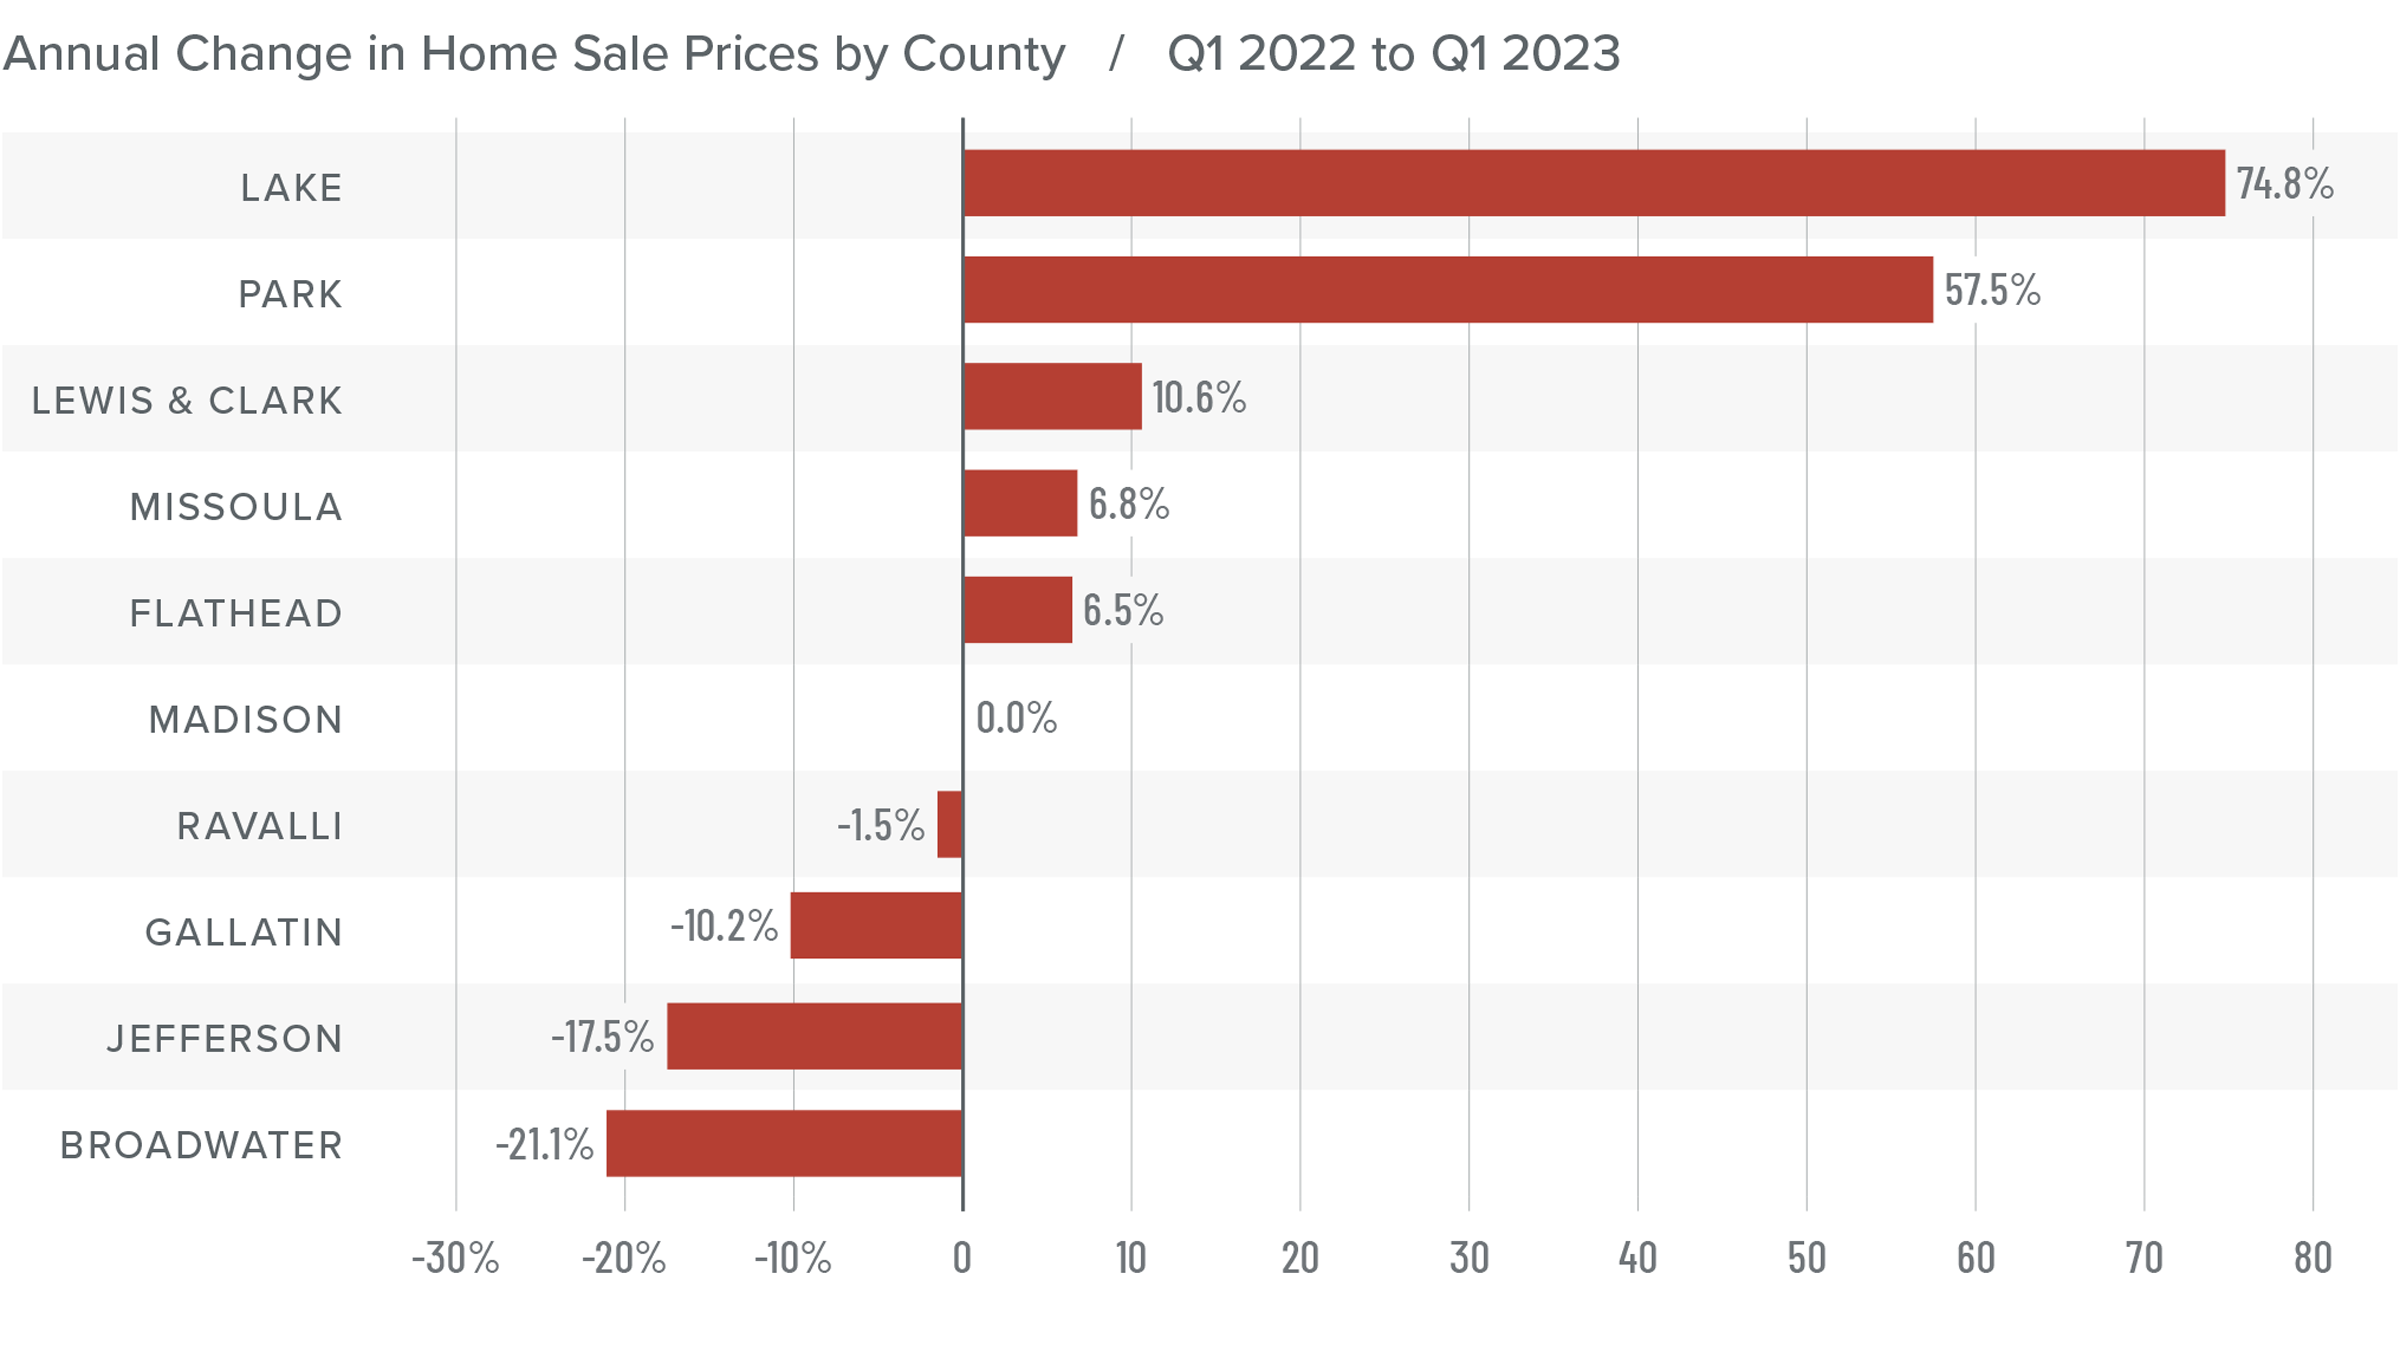
Montana Home Prices
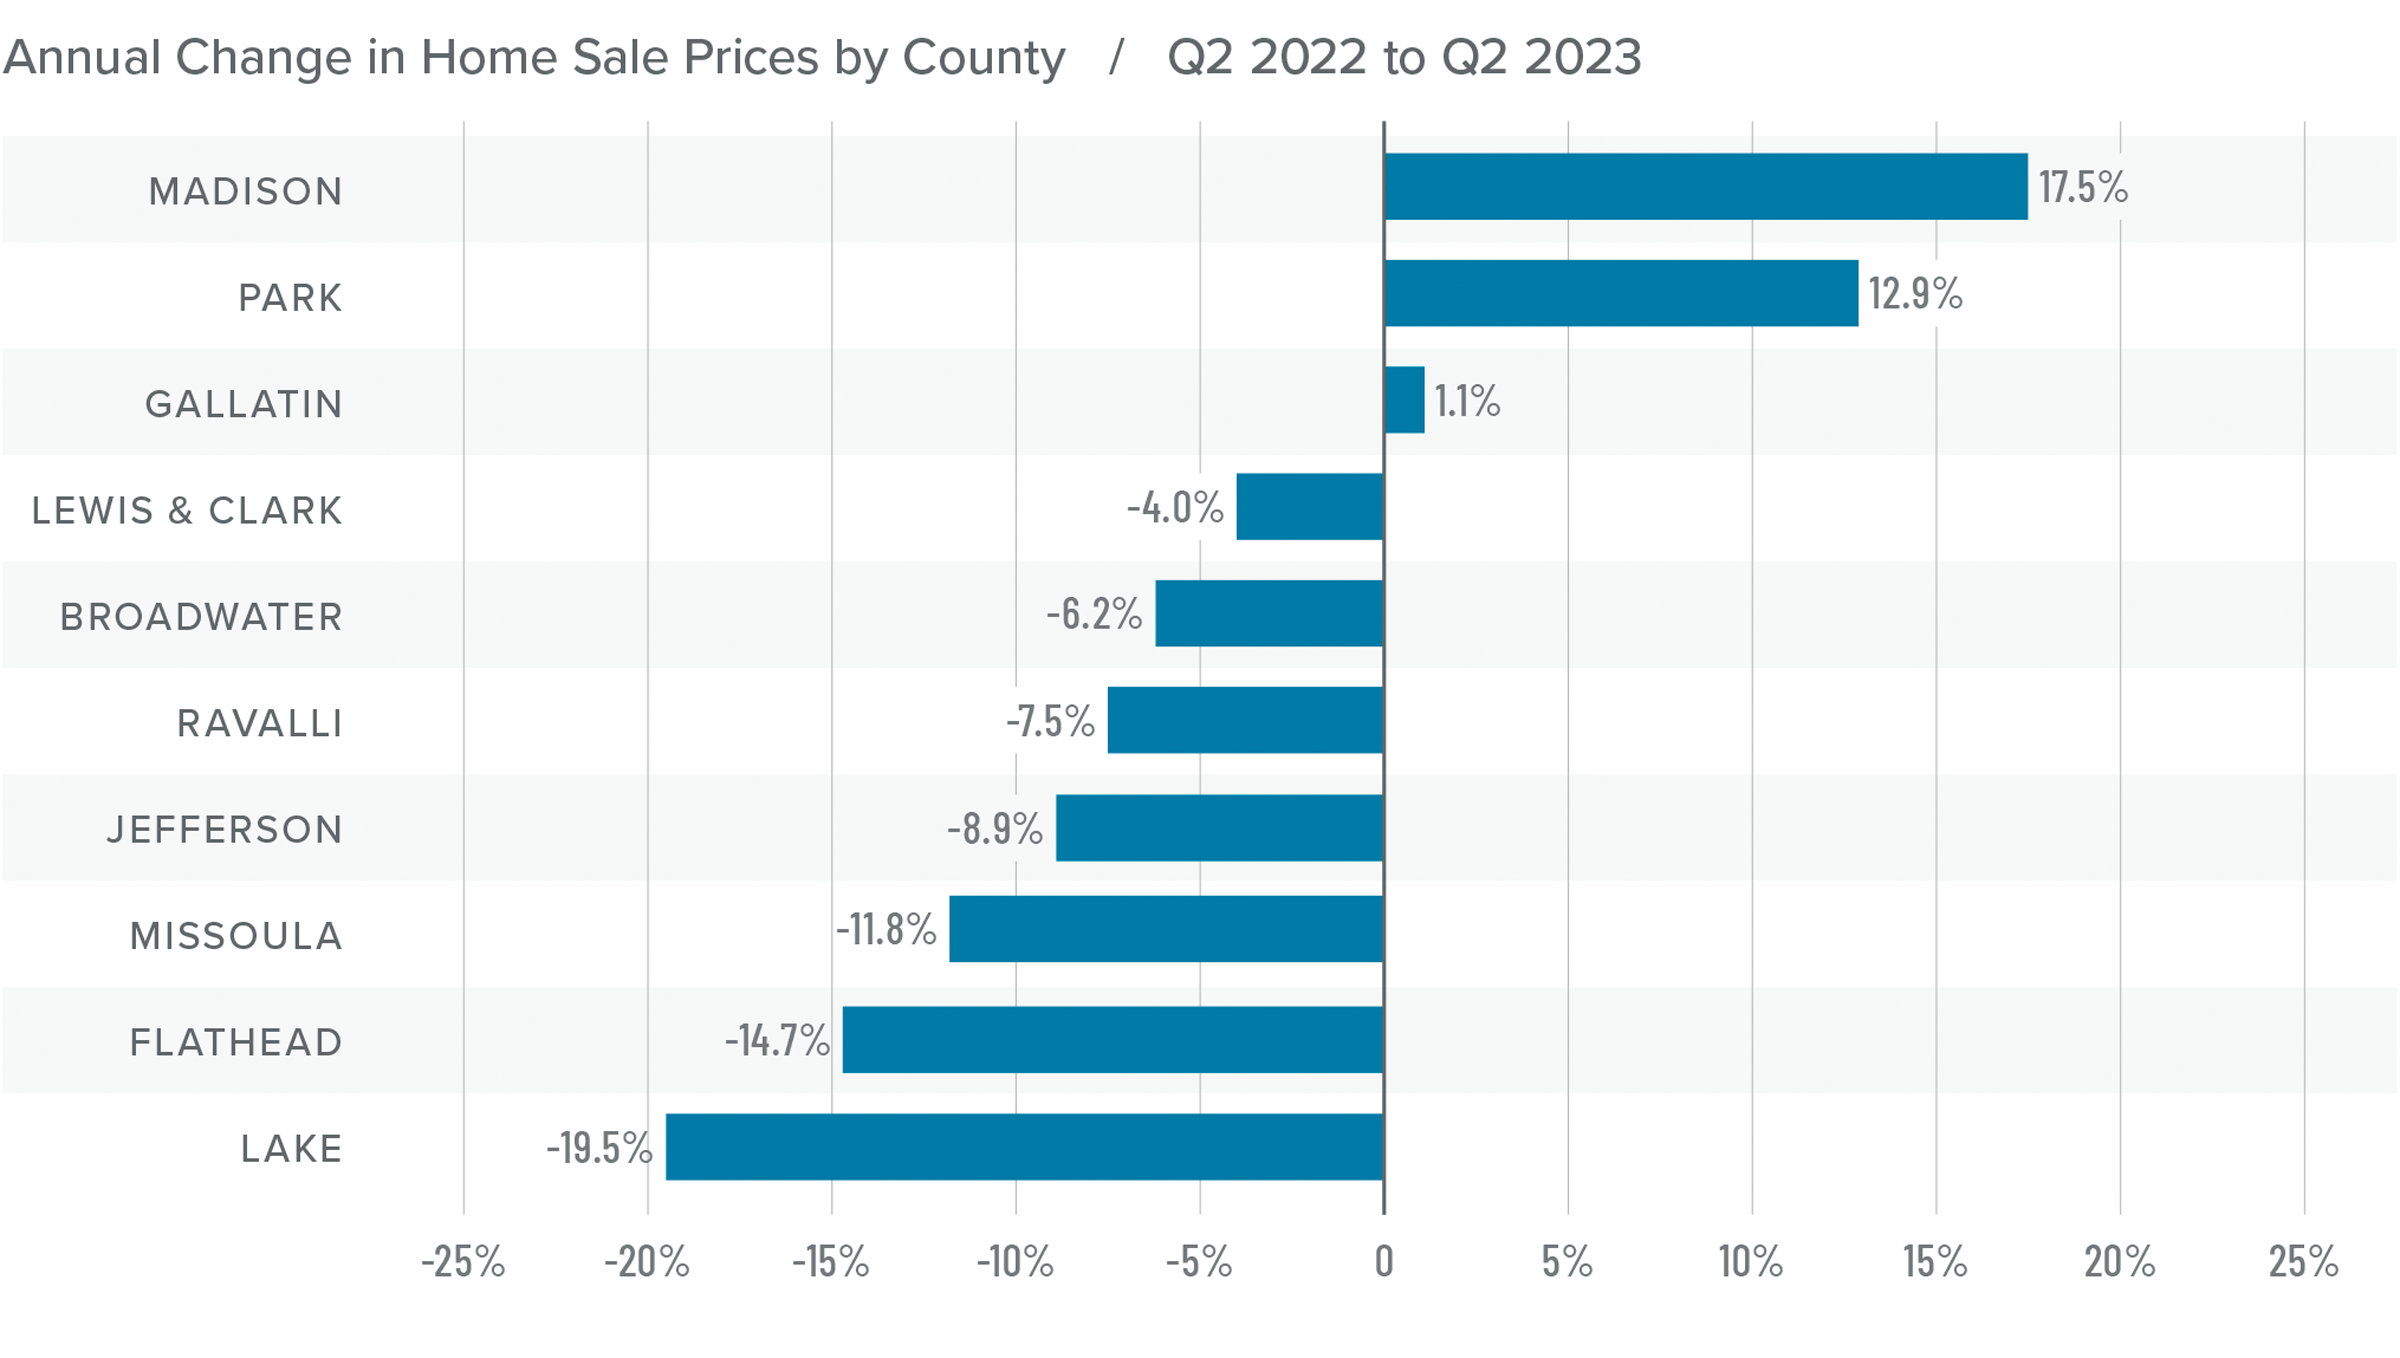
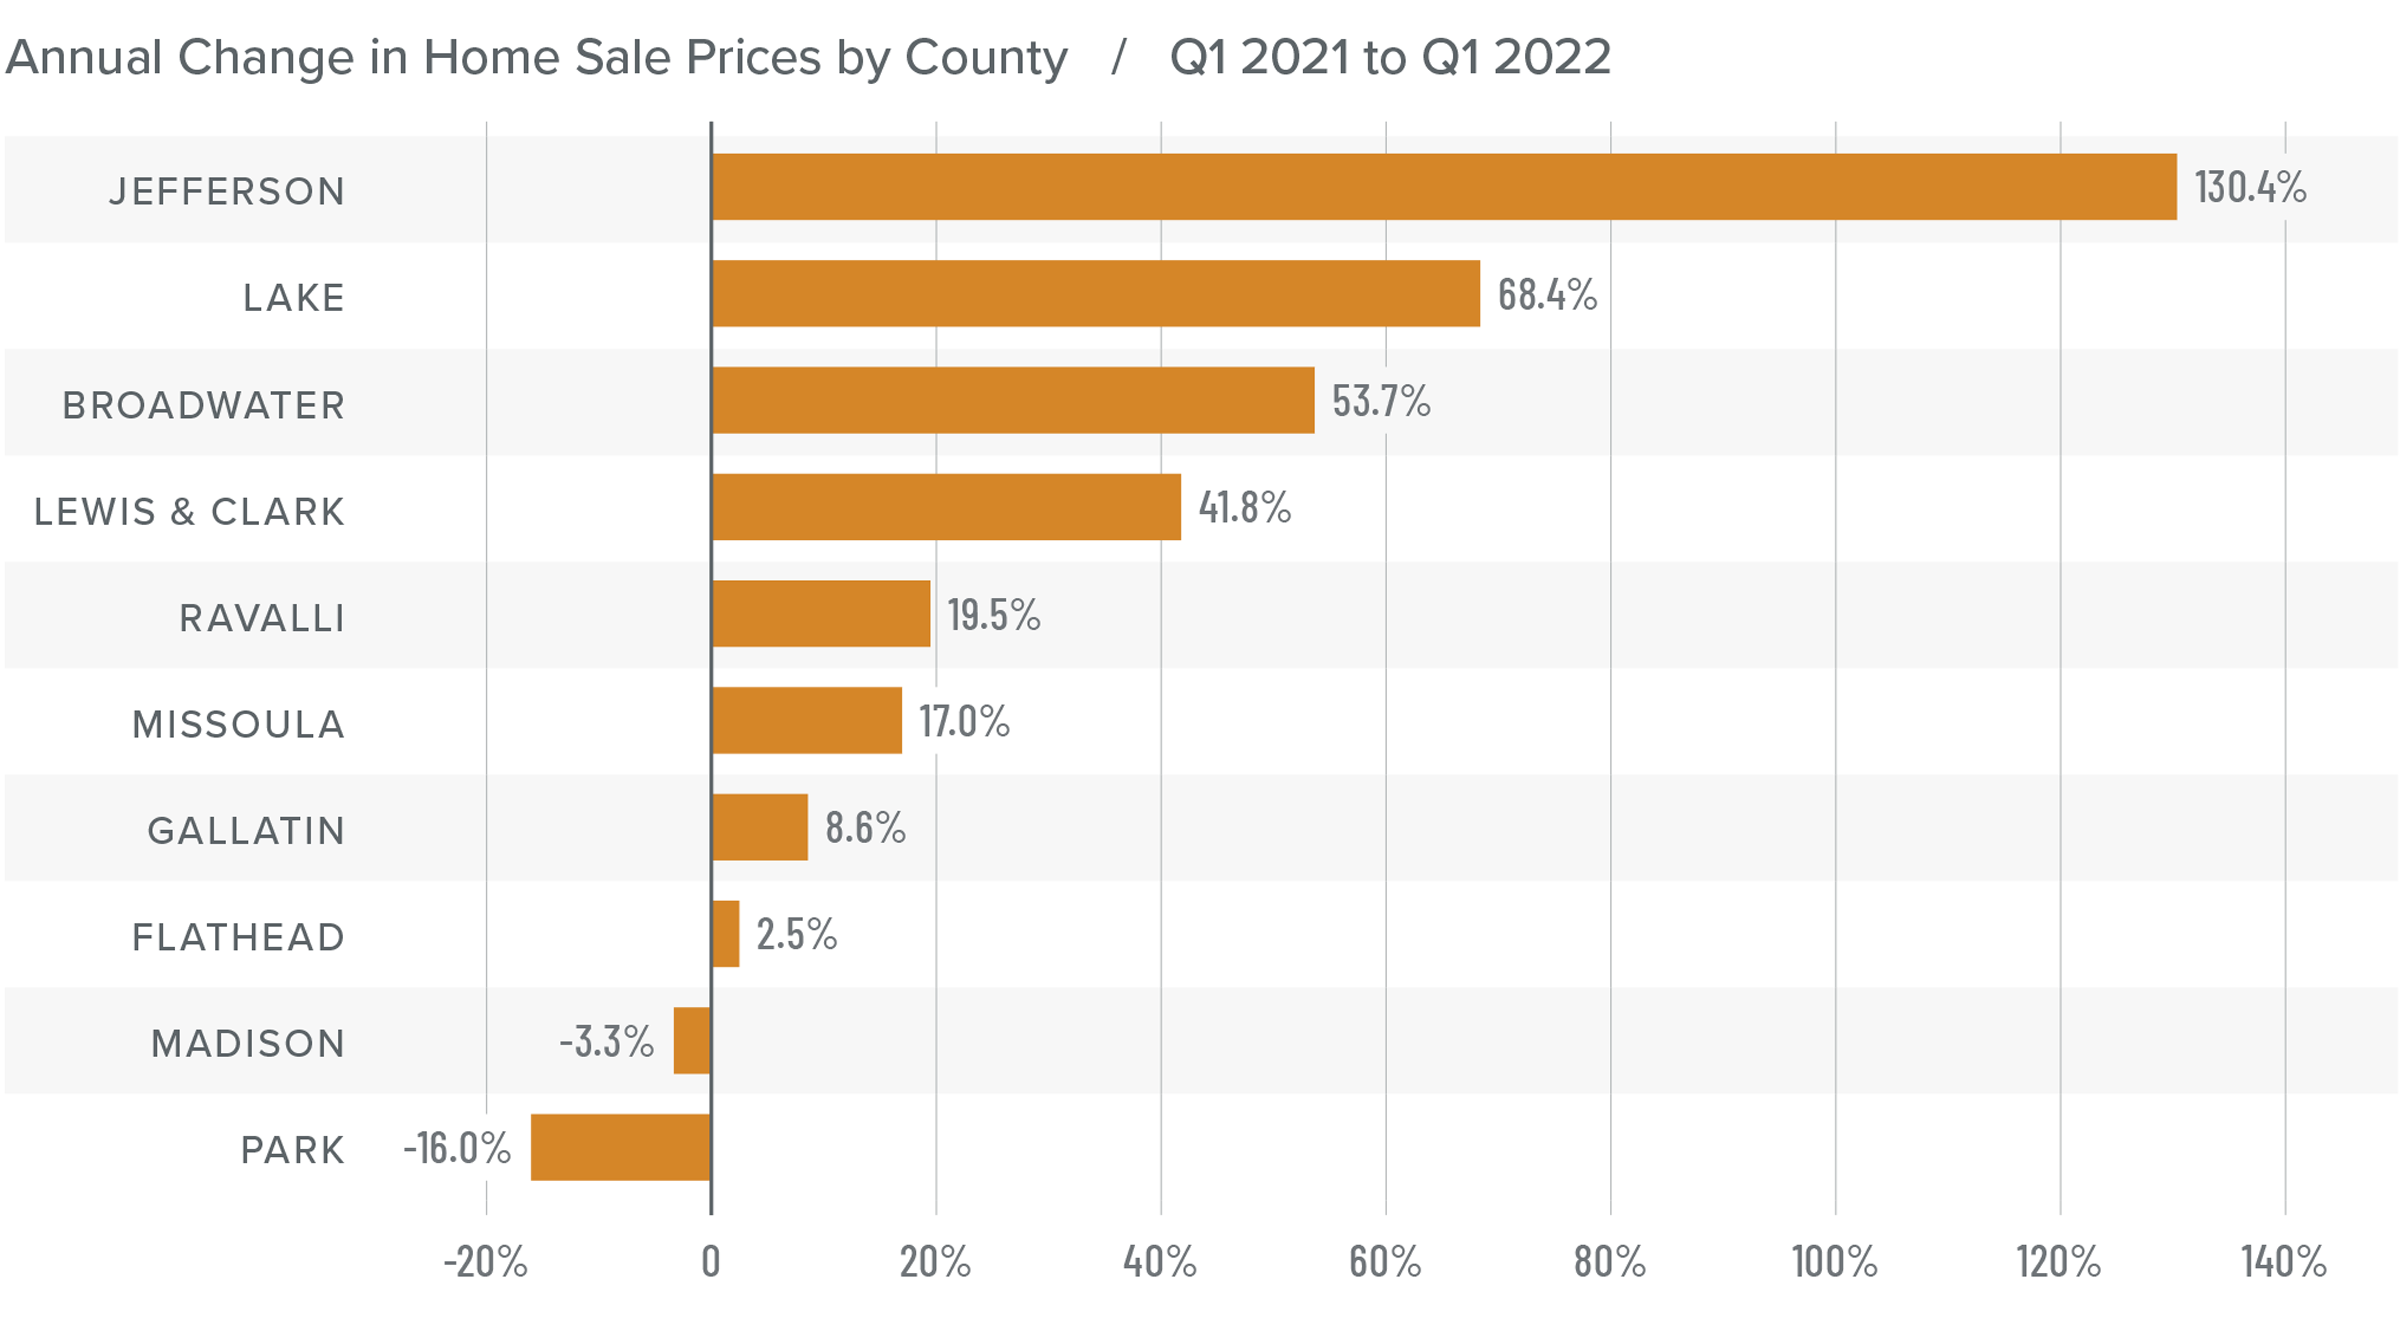
❱ Home prices were up 9.6% year over year. The average sale price was $758,641, which was 12% higher than in the second quarter of 2023.
❱ The growth in home prices is a little surprising given rising financing costs, more choice in the market, and the fact that list prices were higher in most markets than in the second quarter of 2023.
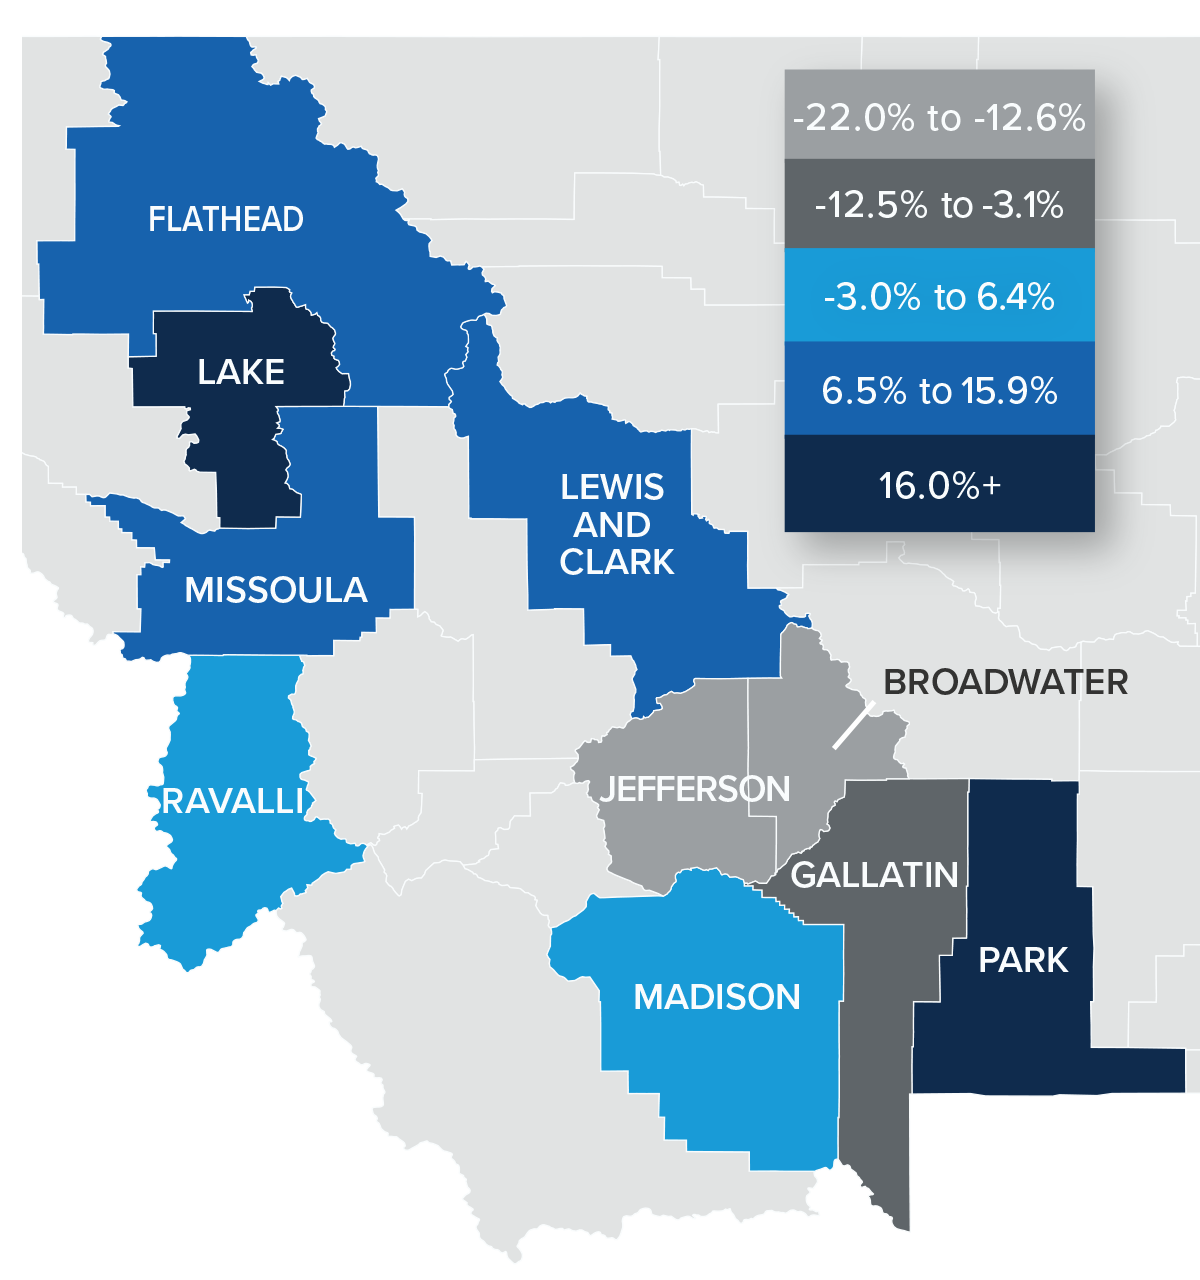
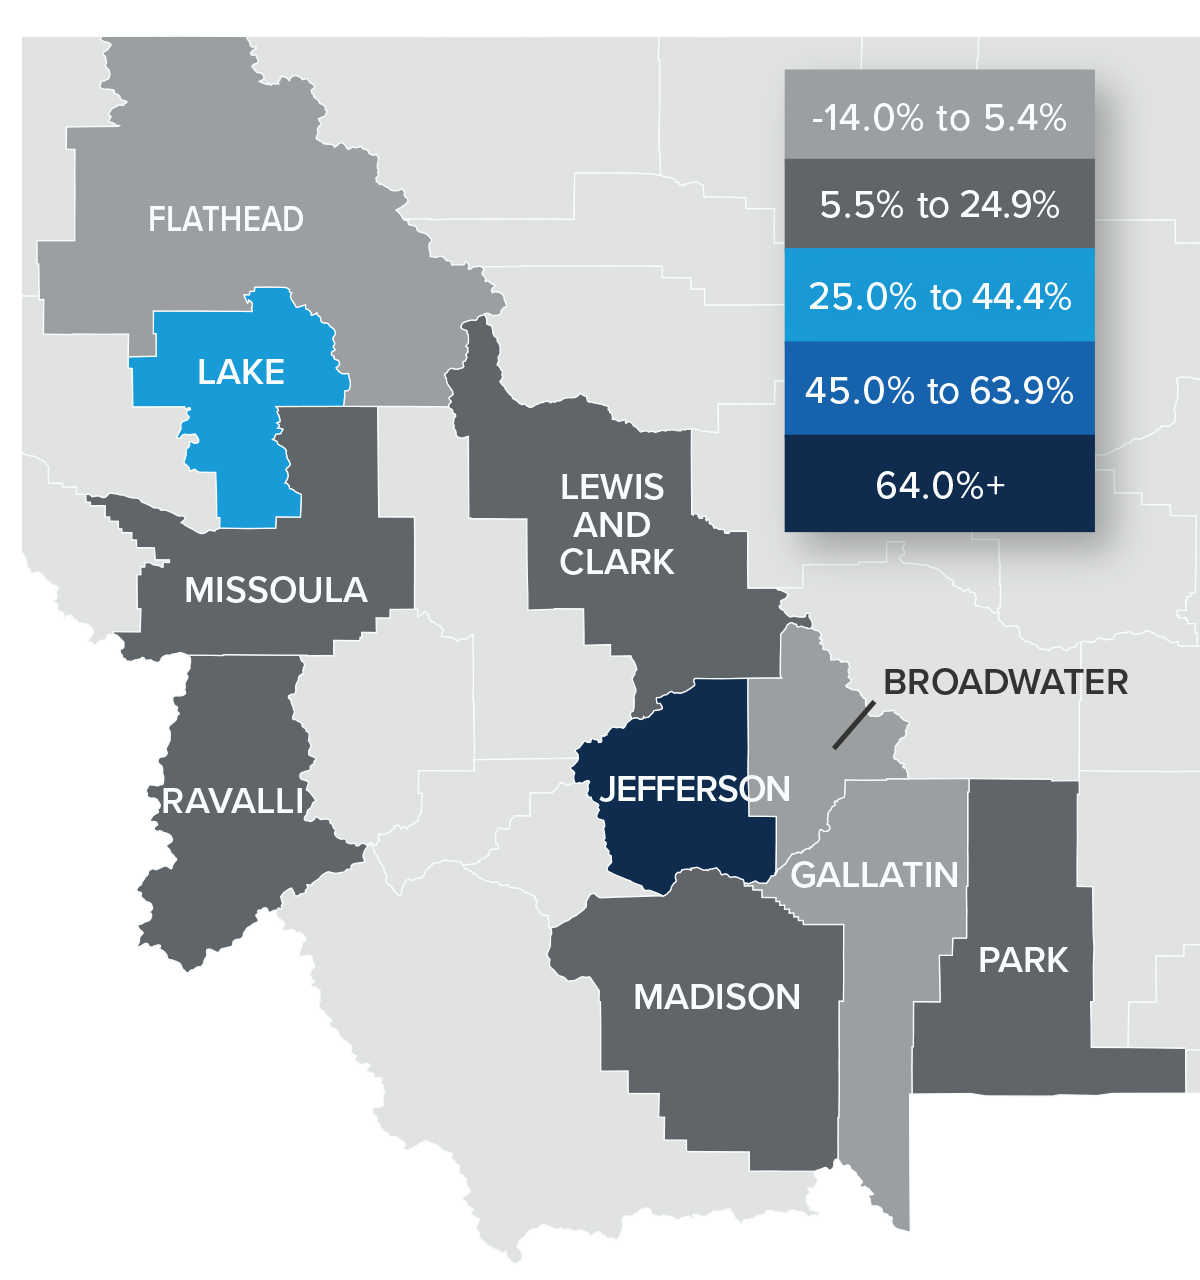
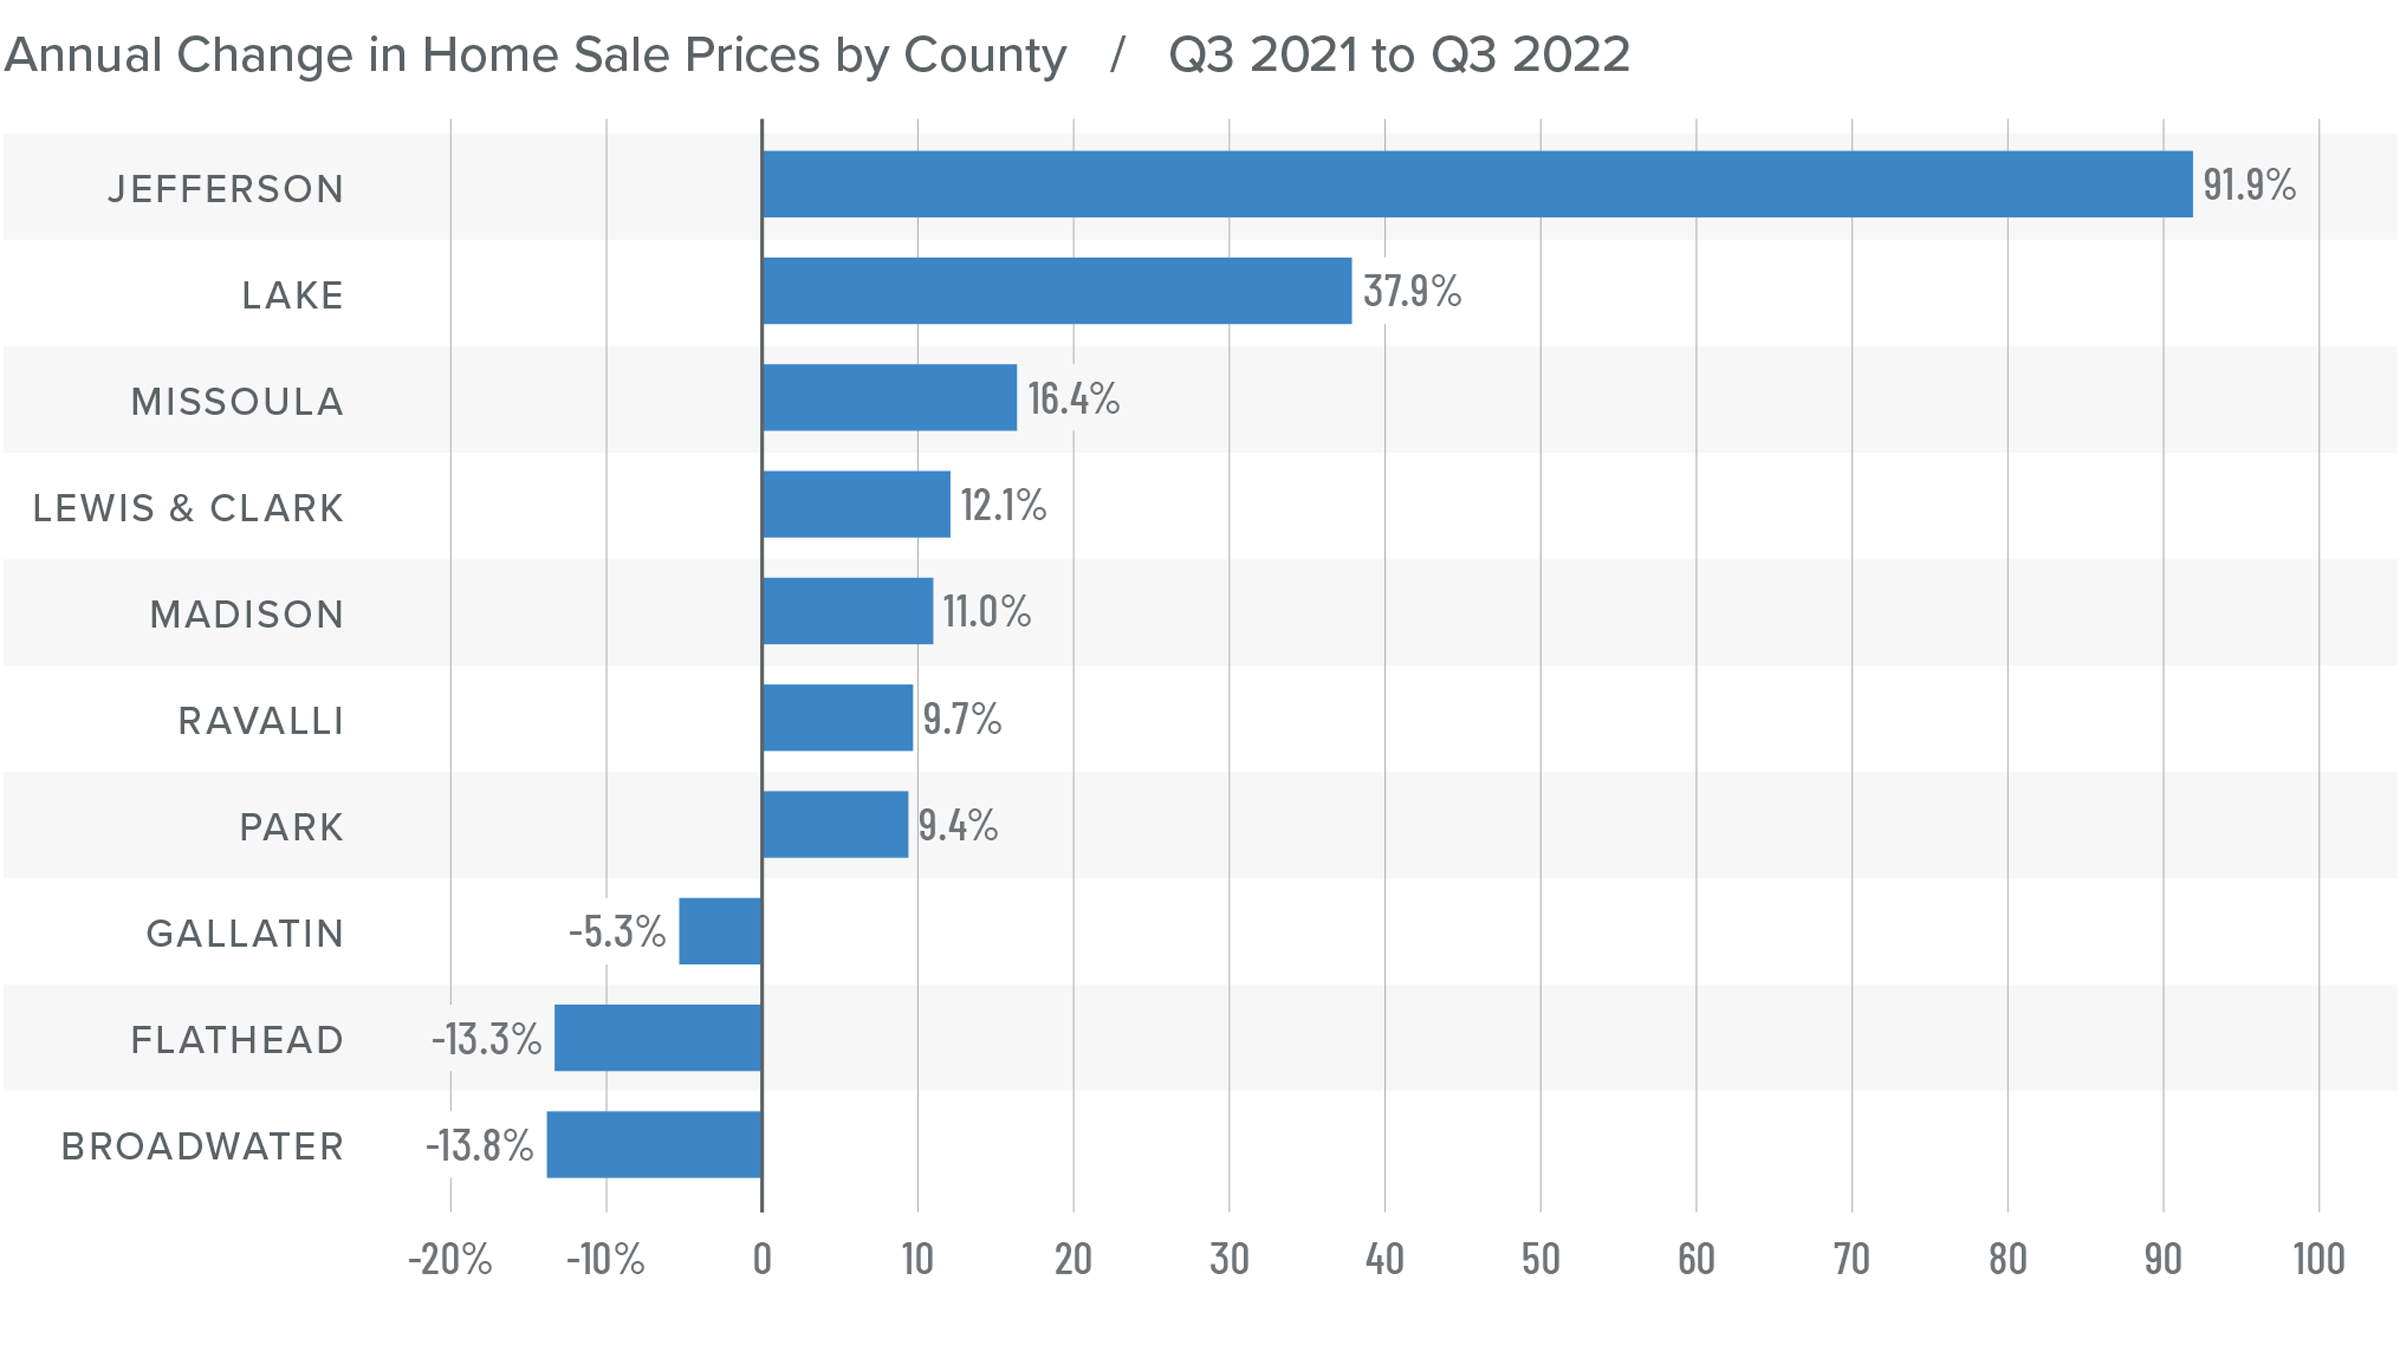
❱ Year over year, prices rose in six counties and fell in four. Compared to the second quarter of this year, prices rose in every county other than Lake and Park.
❱ So far, higher mortgage rates have not been much of a deterrent, at least not yet. I expected price growth to start tapering by now, but it appears I was a little premature. That said, I stand by my belief that high mortgage rates will begin to impact price growth as we move toward the end of the year.

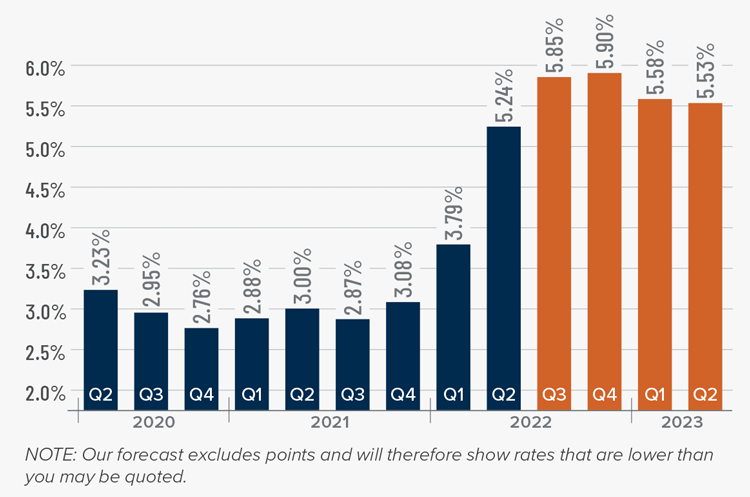
Mortgage Rates
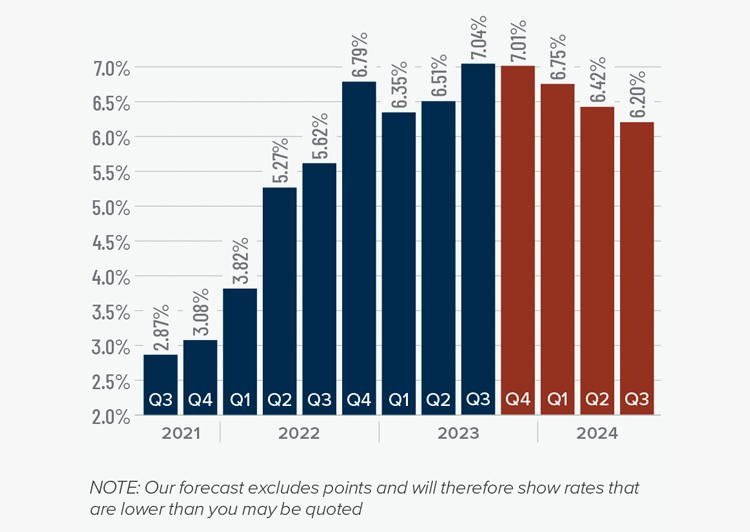
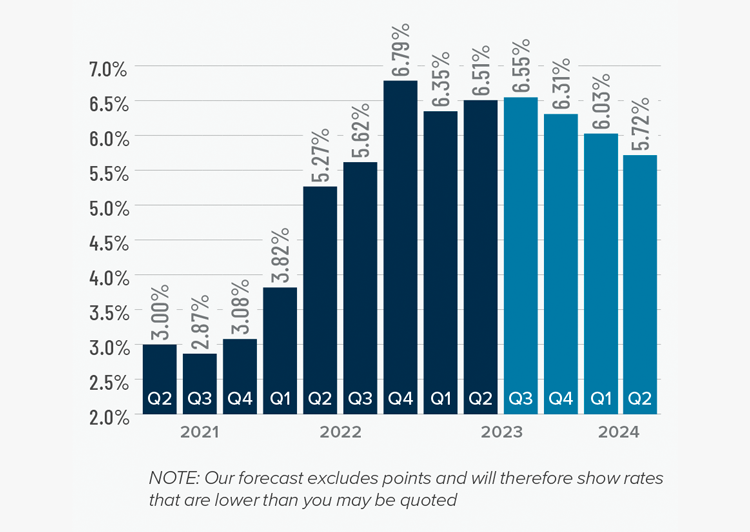
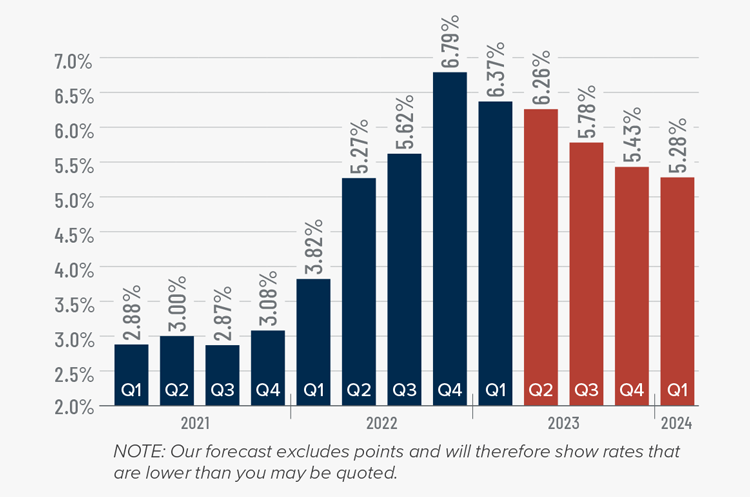
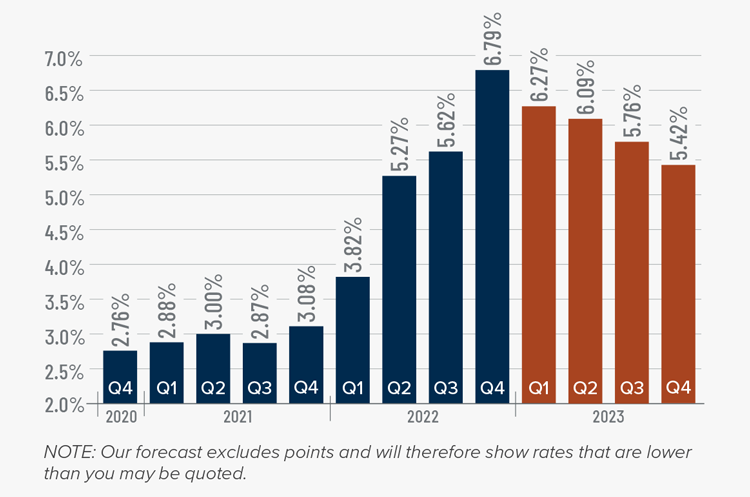
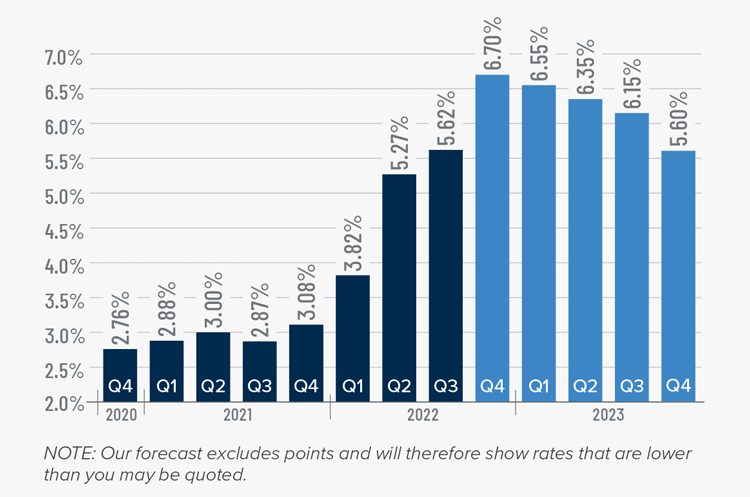
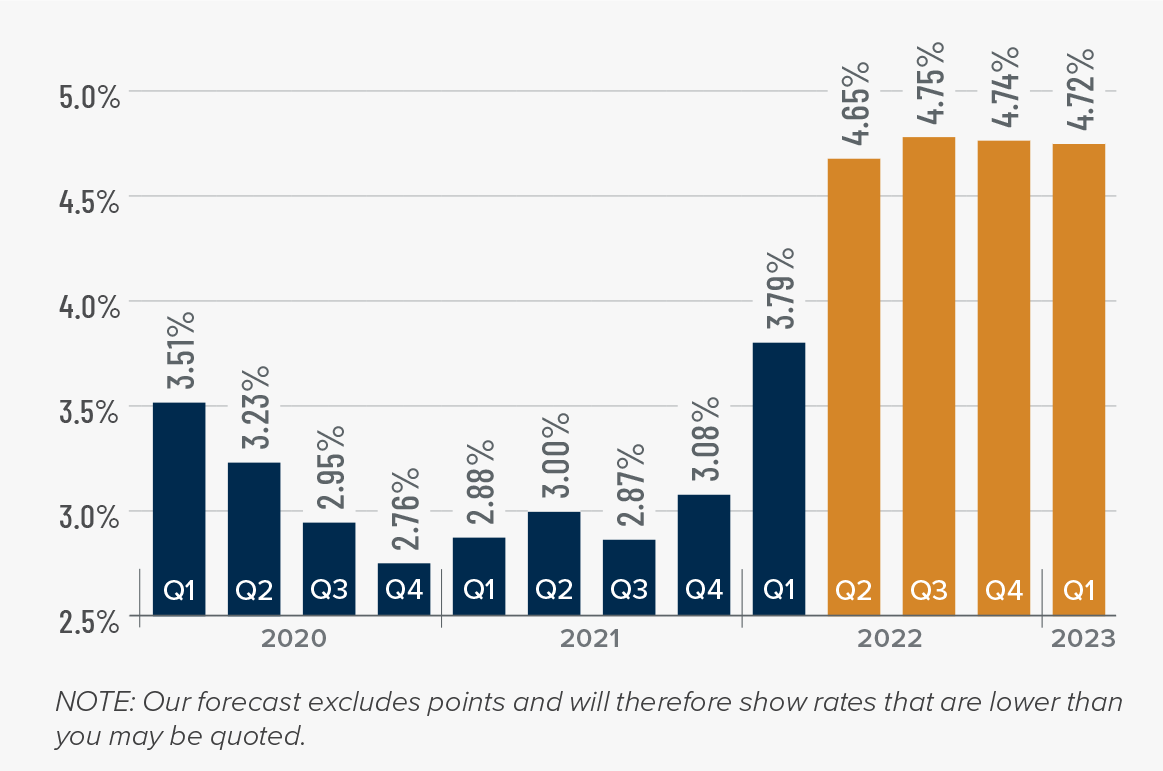
Mortgage rates continued trending higher in the third quarter of 2023 and are now at levels we have not seen since the fall of 2000. Mortgage rates are tied to the interest rate (yield) on 10-year treasuries, and they move in the opposite direction of the economy. Unfortunately for mortgage rates, the economy remains relatively buoyant, and though inflation is down significantly from its high, it is still elevated. These major factors and many minor ones are pushing Treasury yields higher, which is pushing mortgage rates up. Given the current position of the Federal Reserve, which intends to keep rates “higher for longer,” it is unlikely that home buyers will get much reprieve when it comes to borrowing costs any time soon.
With such a persistently positive economy, I have had to revise my forecast yet again. I now believe rates will hold at current levels before starting to trend down in the spring of next year.
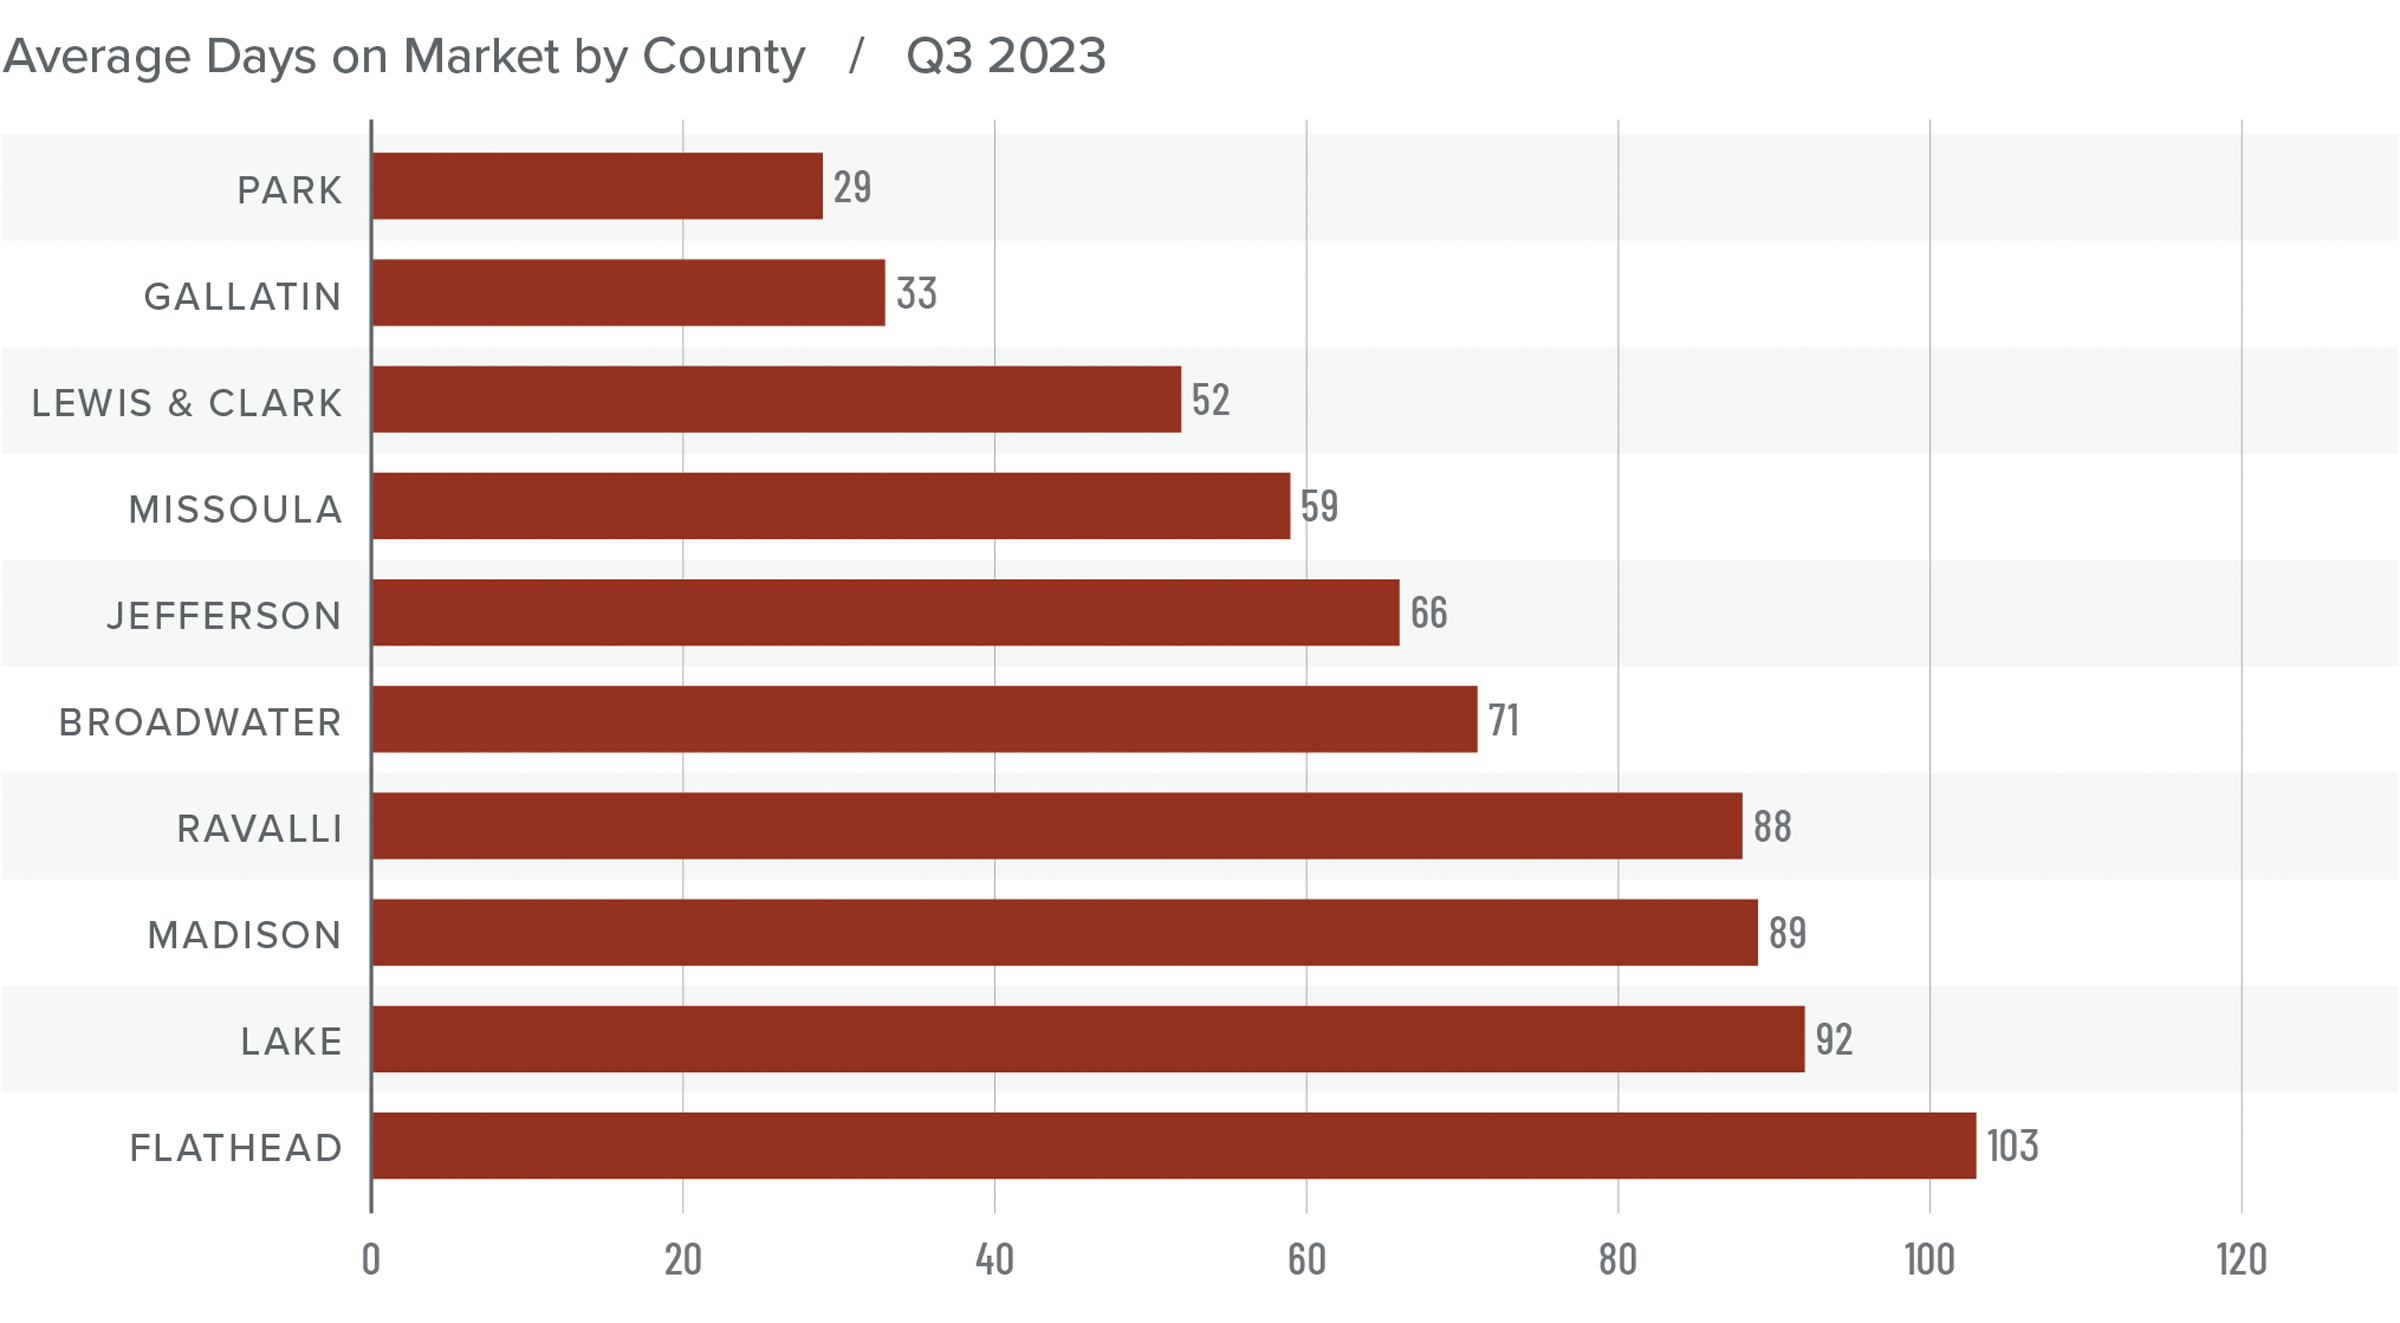
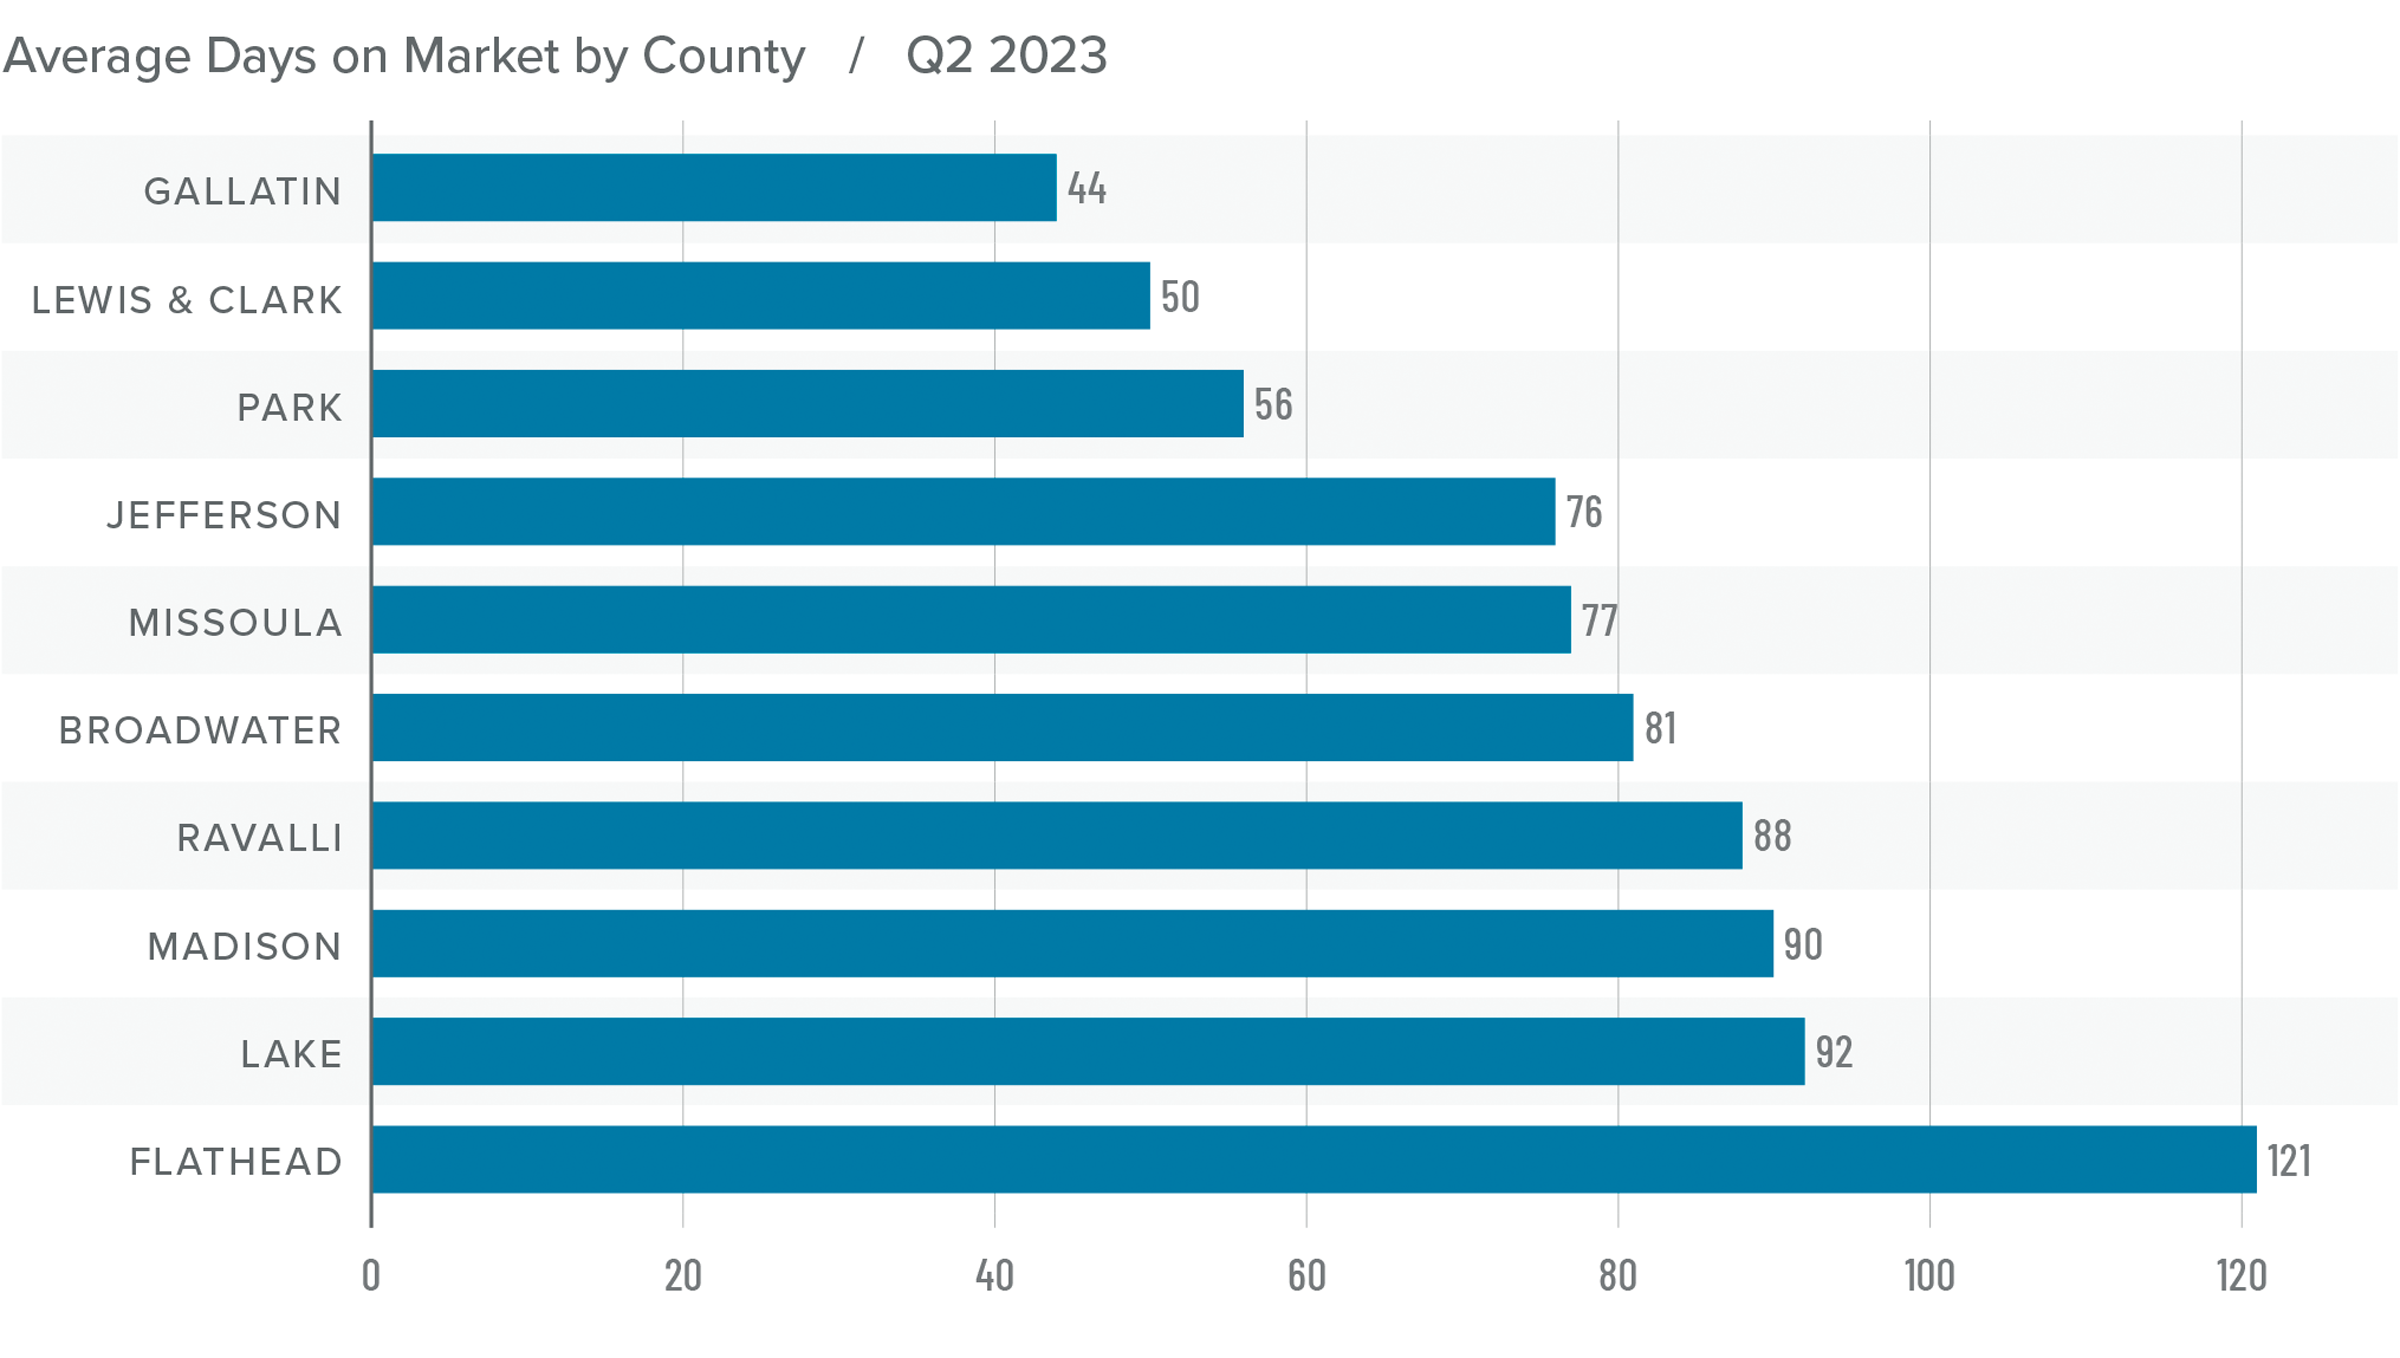
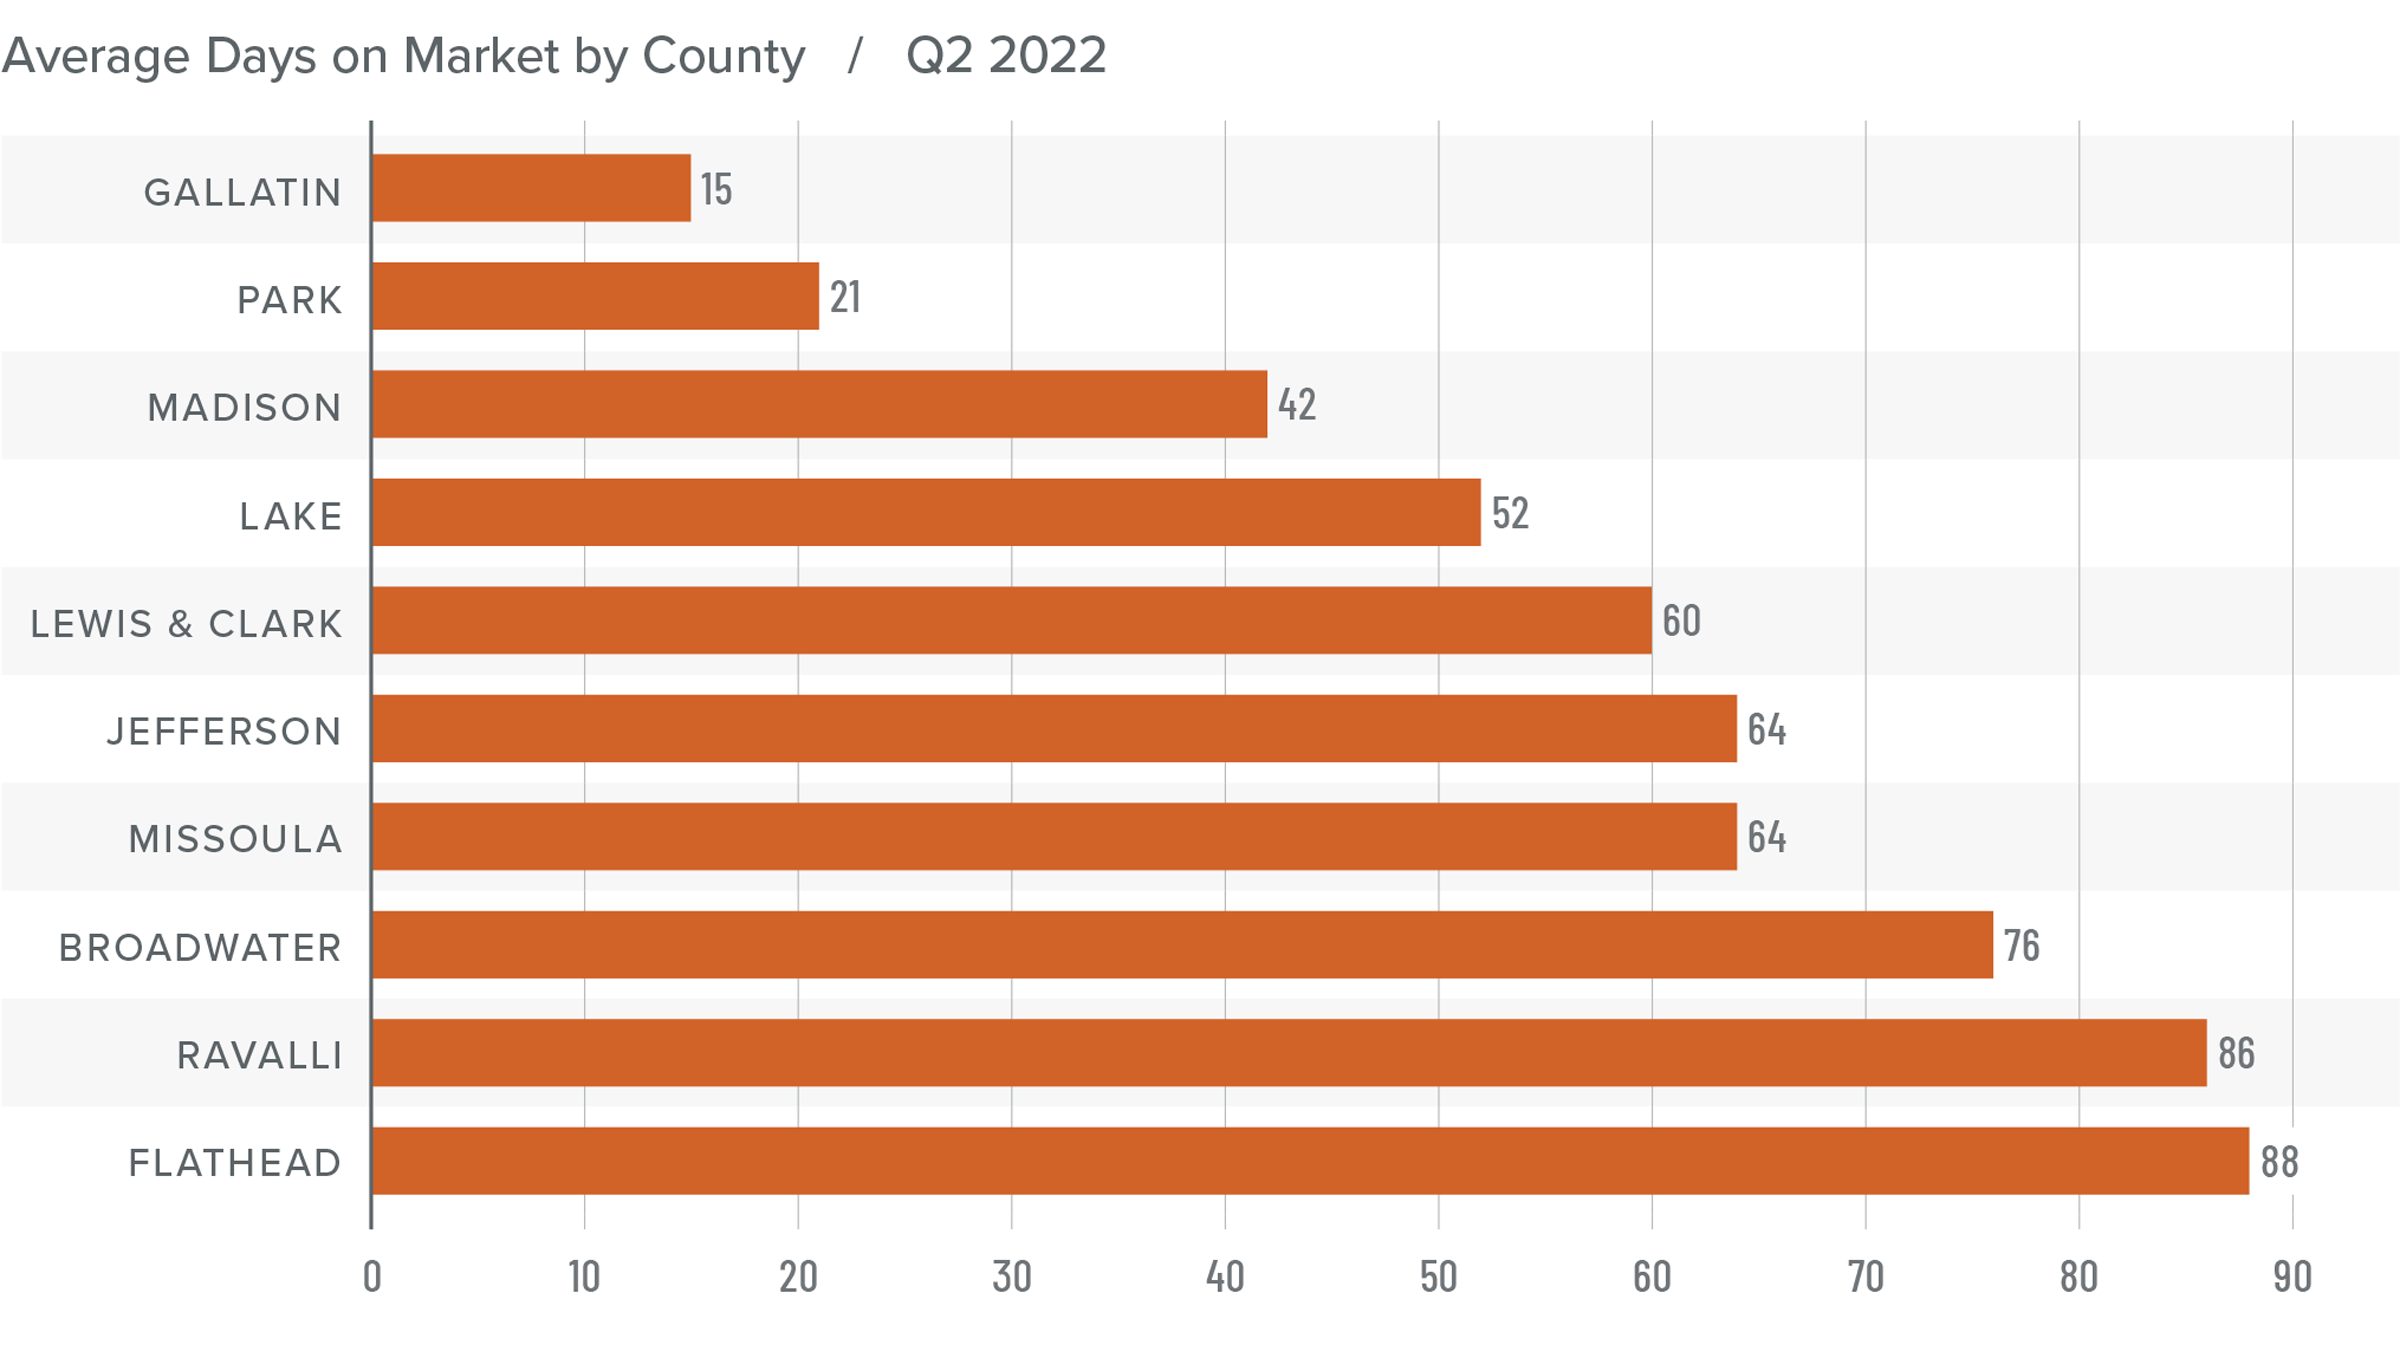
Montana Days on Market
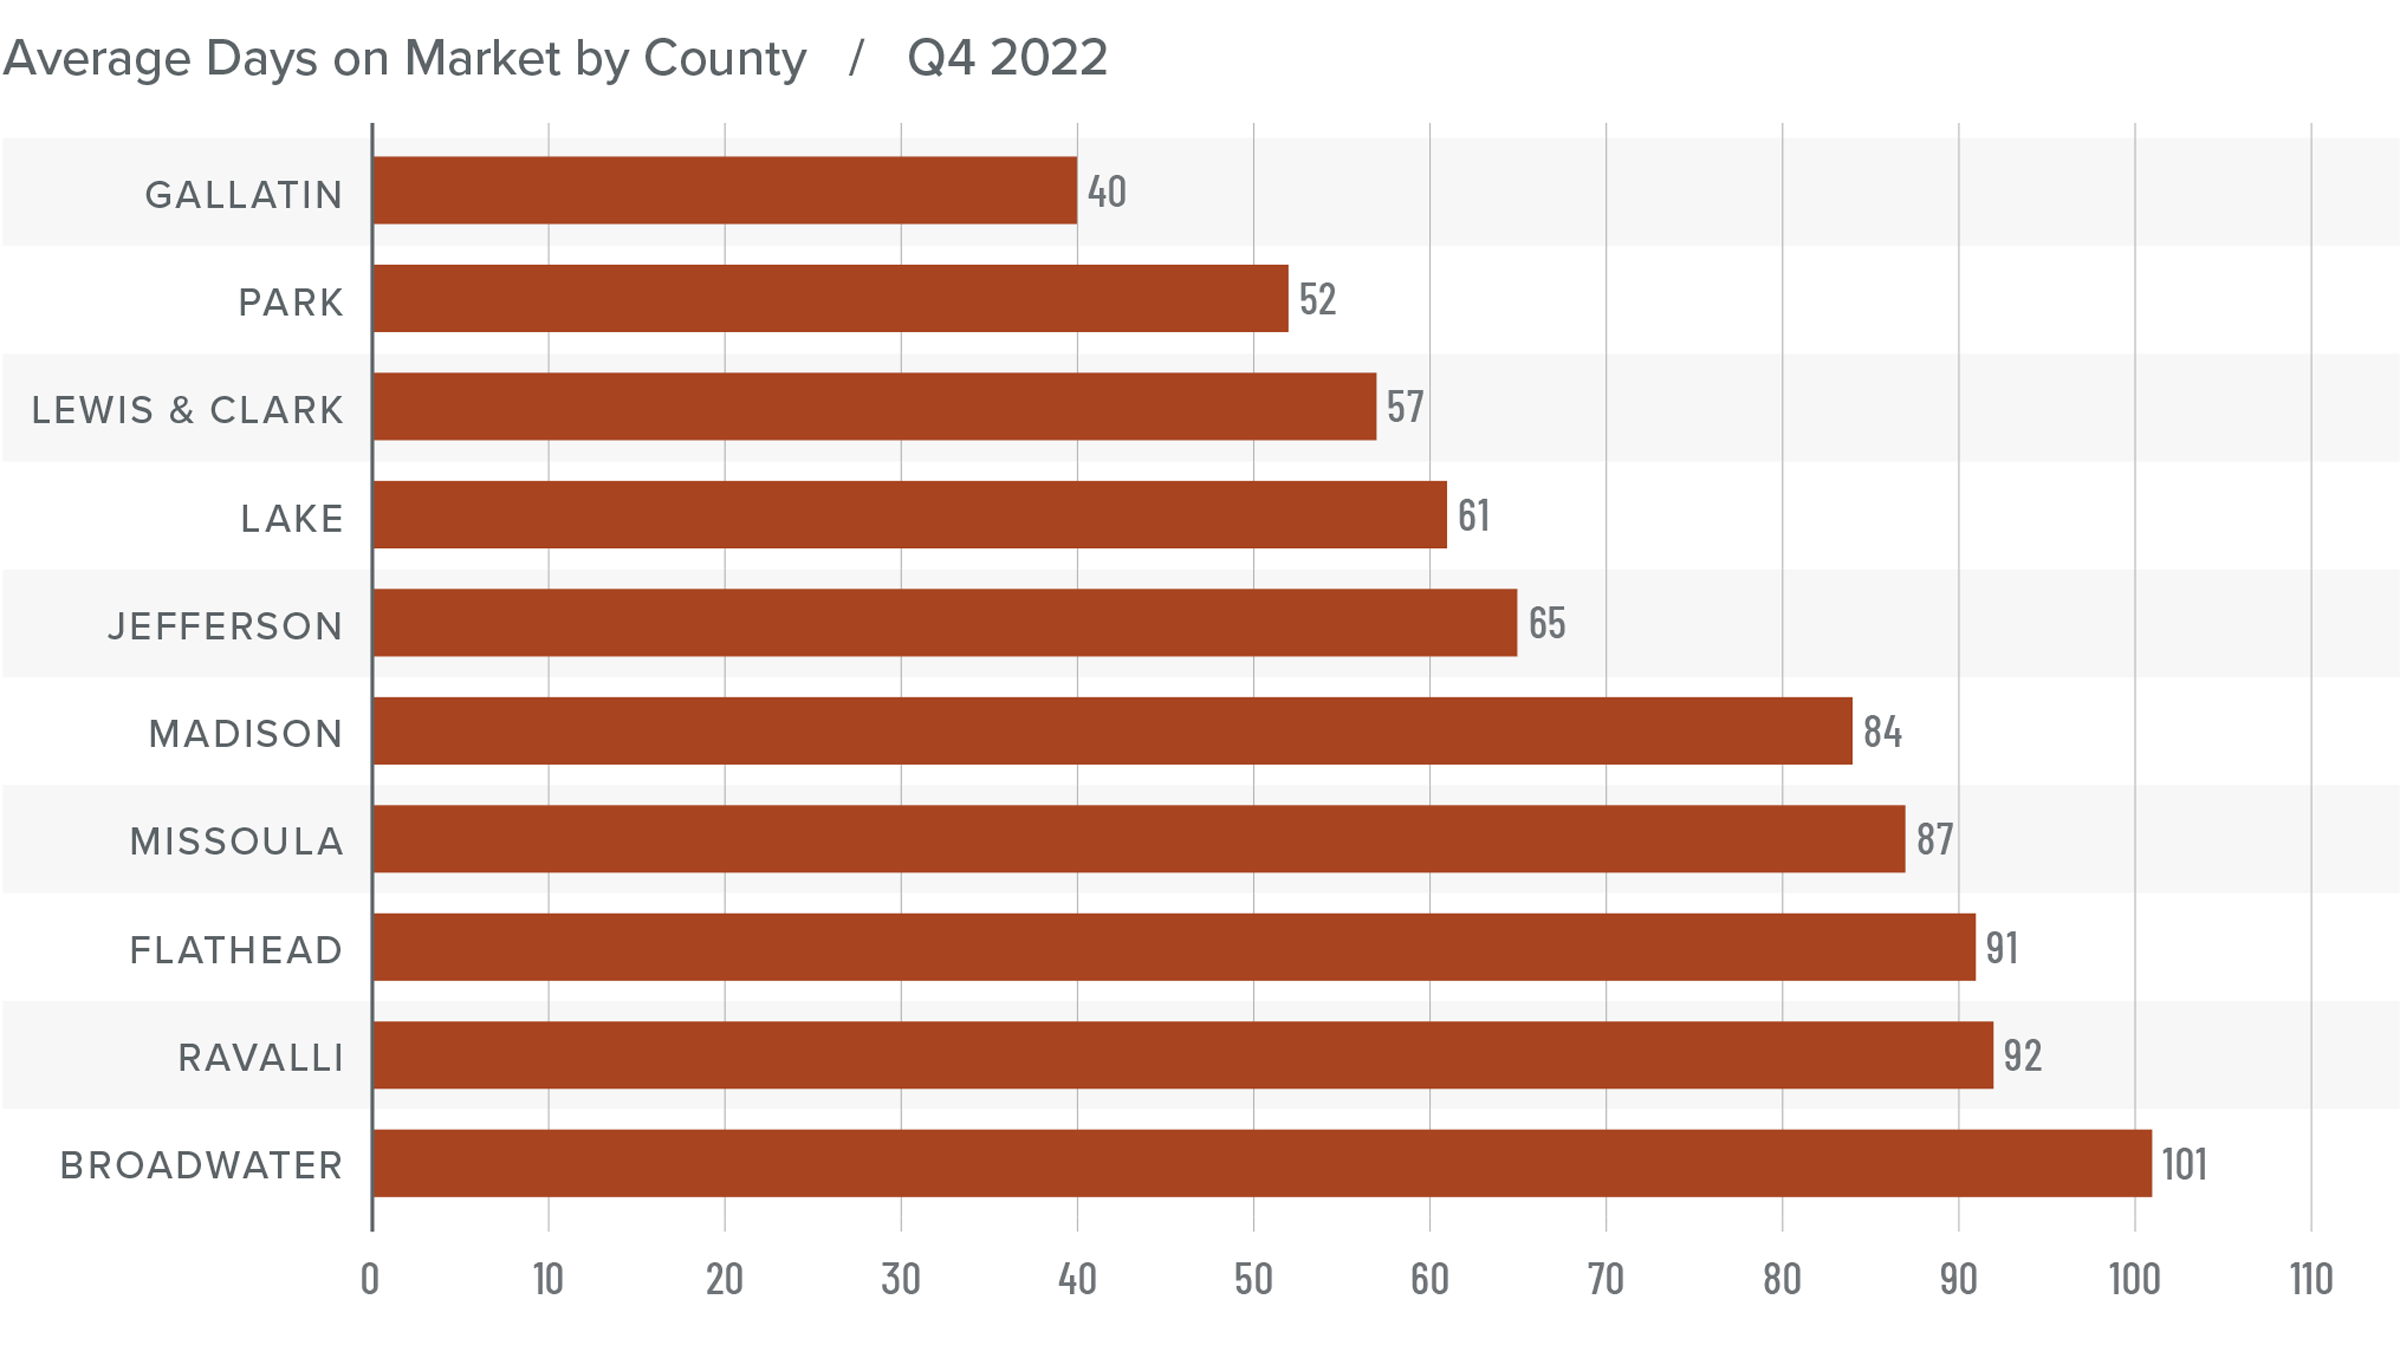
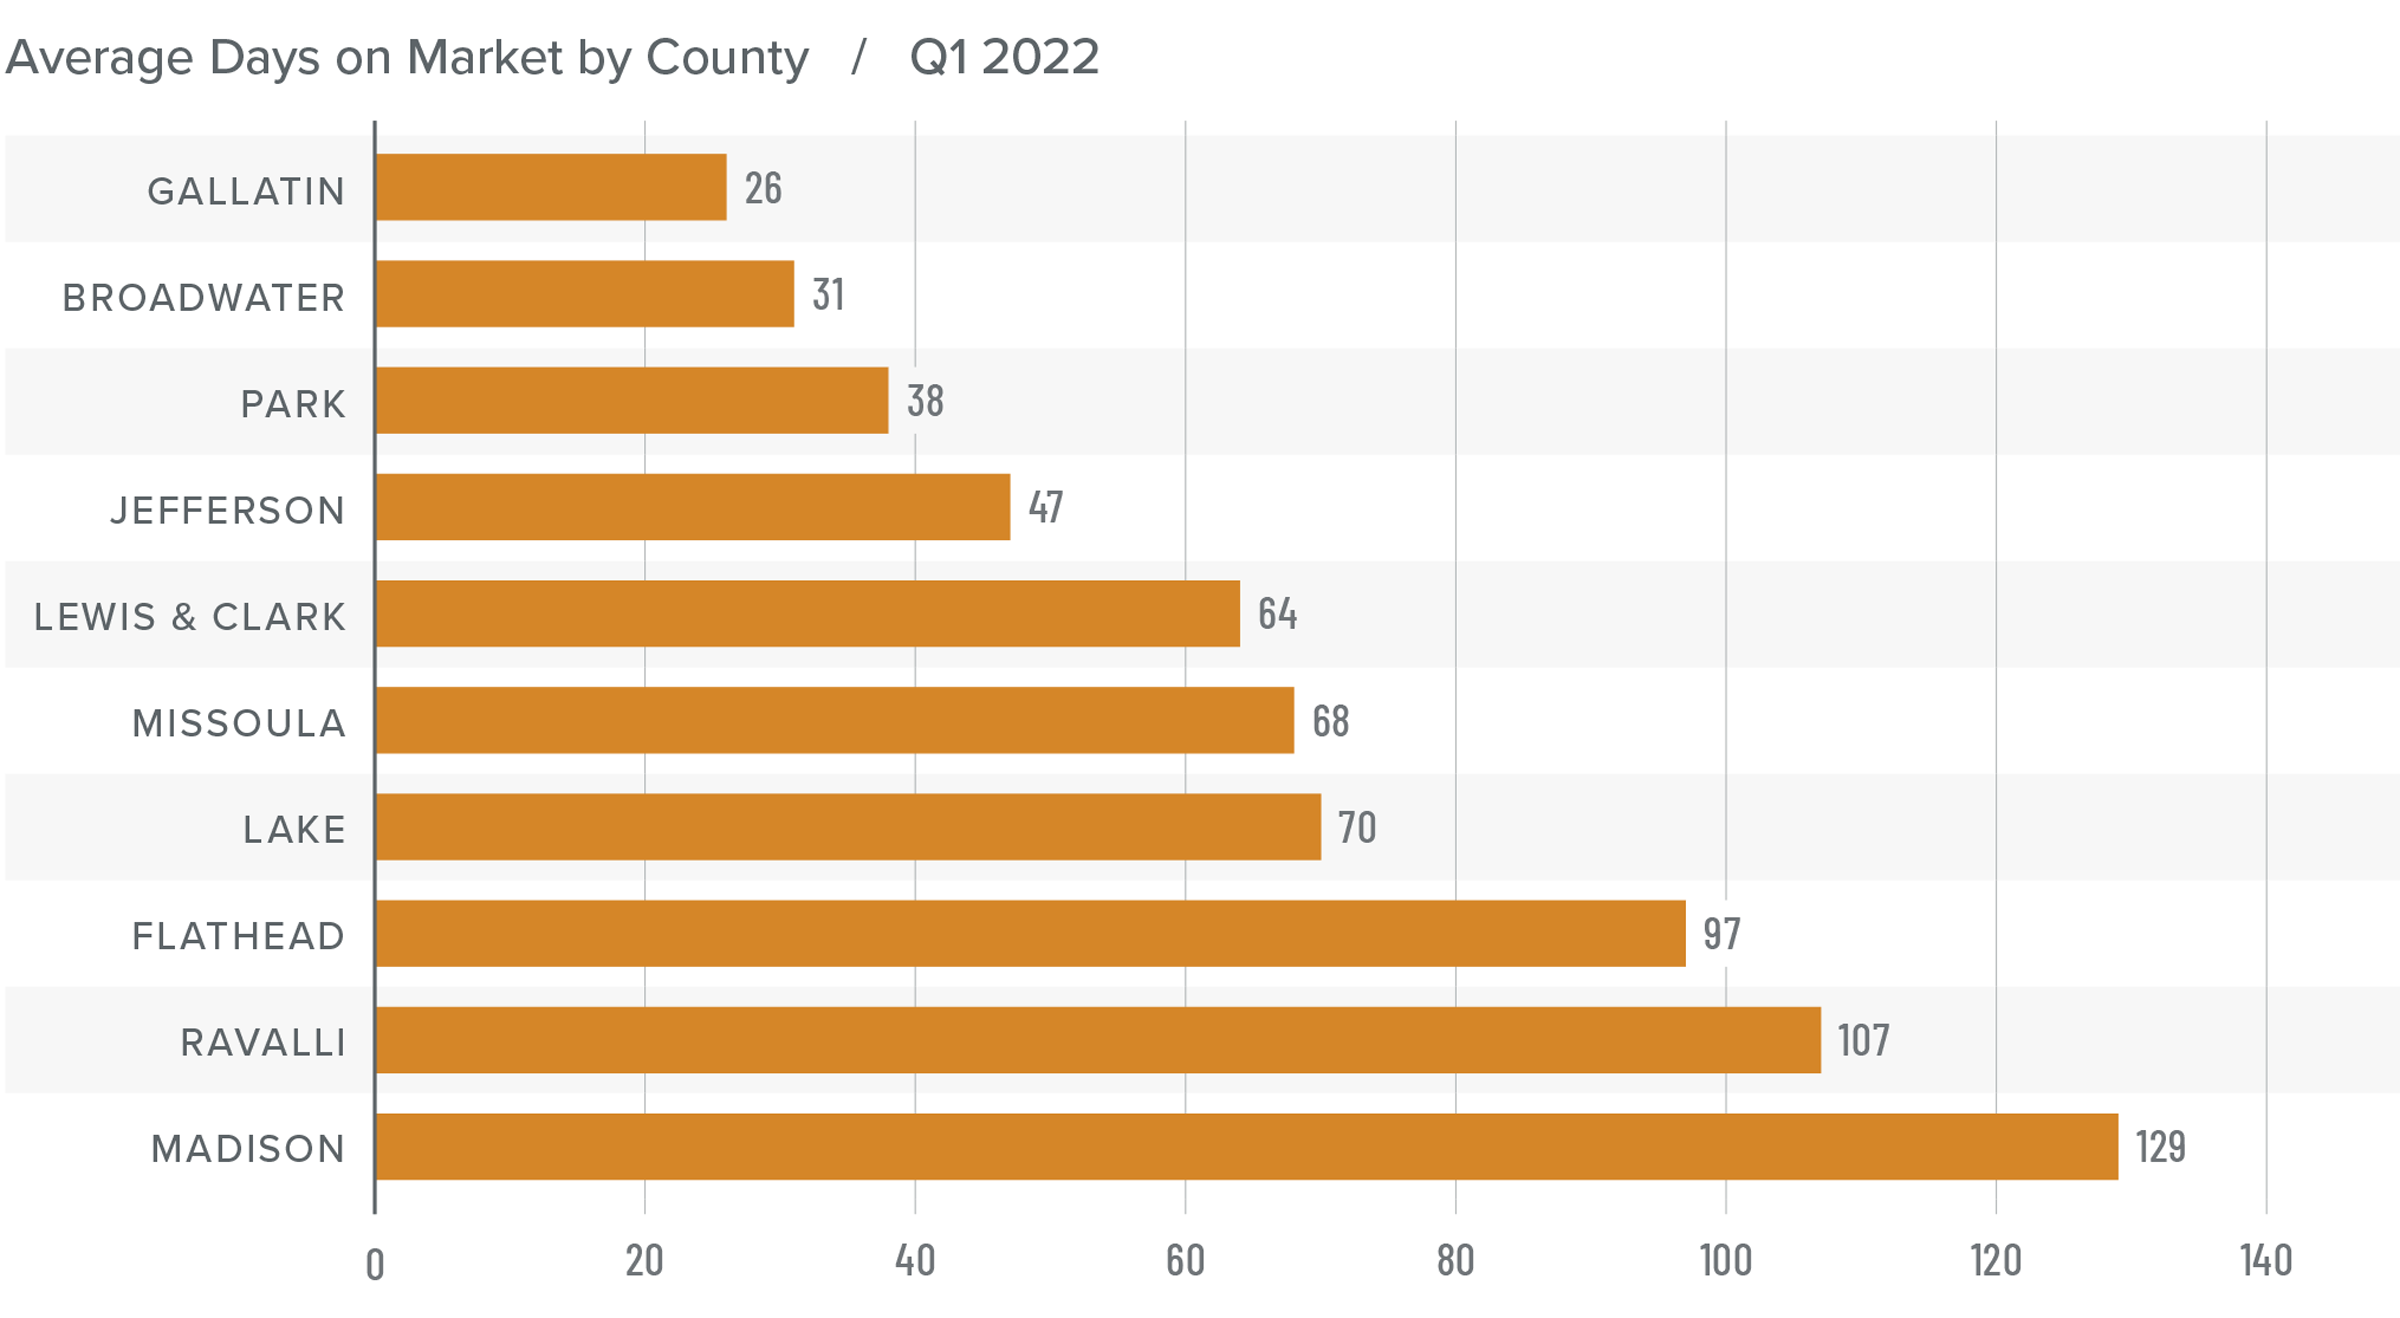
❱ The average time it took to sell a home rose six days compared to the same period in 2022. Time on market fell 11 days compared to the second quarter of 2023.
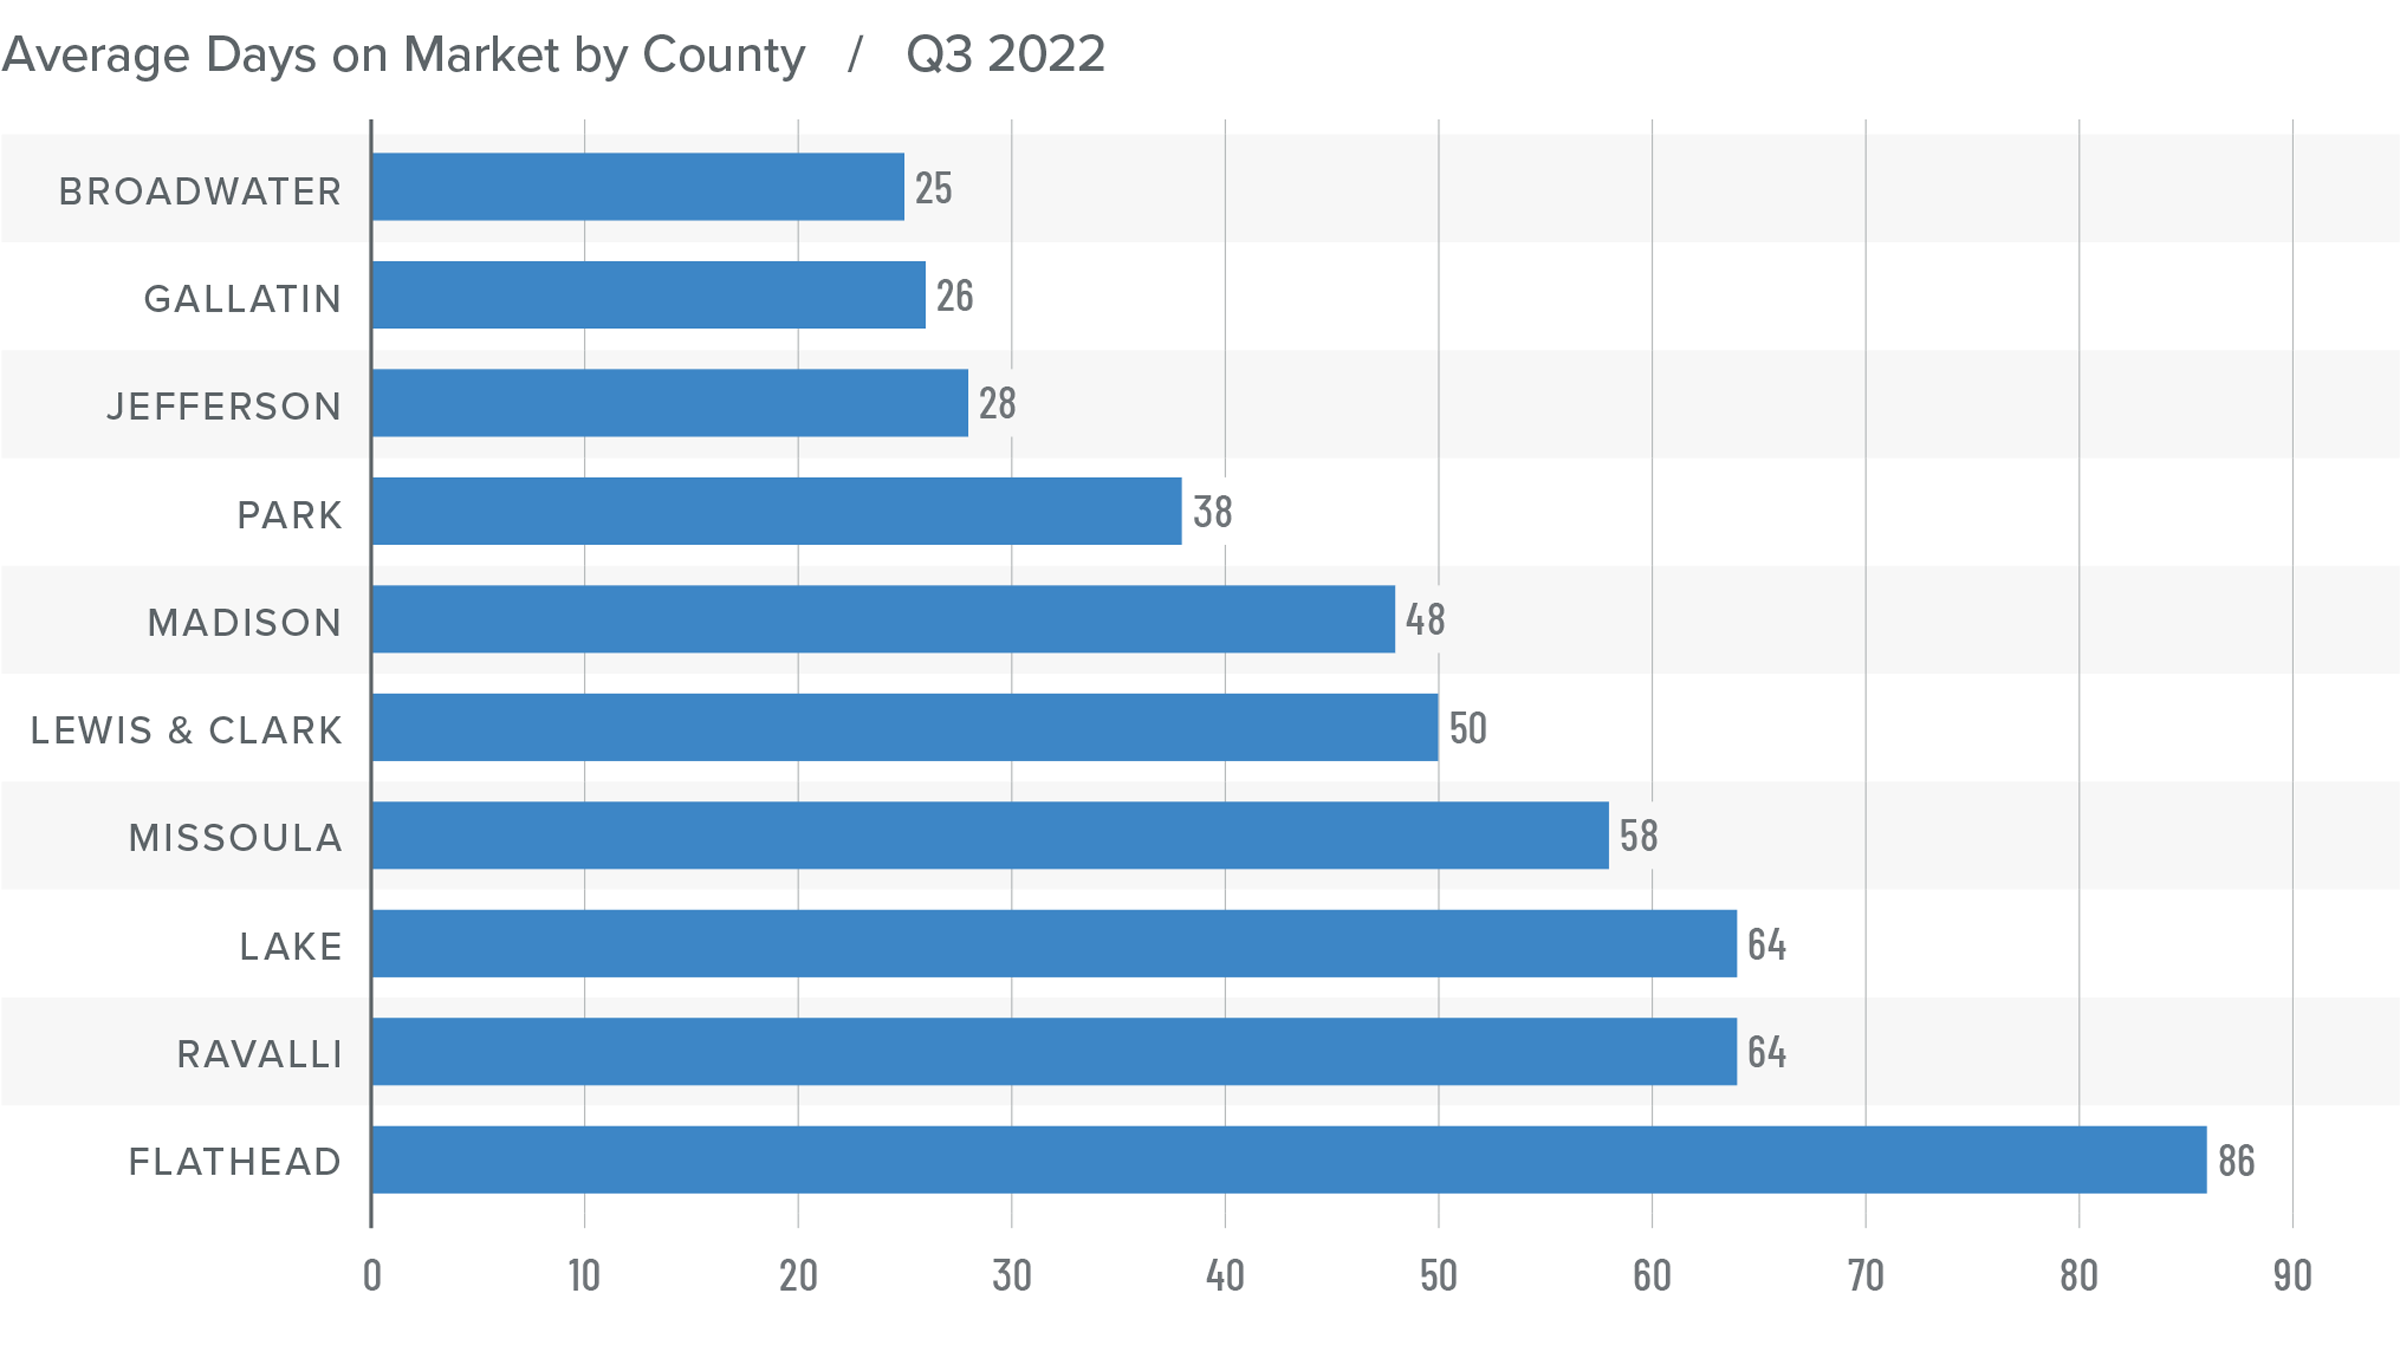
❱ Homes sold fastest in Park County while homes in Flathead County took the longest time to sell. Compared to the third quarter of 2022, market time fell in Missoula, Lewis and Clark, Broadwater, Jefferson, and Park counties but rose in the rest of the region.
❱ During the third quarter, it took an average of 68 days to sell a home in the markets covered by this report.
❱ Compared to the second quarter of this year, average market time rose in only three counties (Lake, Lewis and Clark, and Madison), was flat in Ravalli, and fell everywhere else.
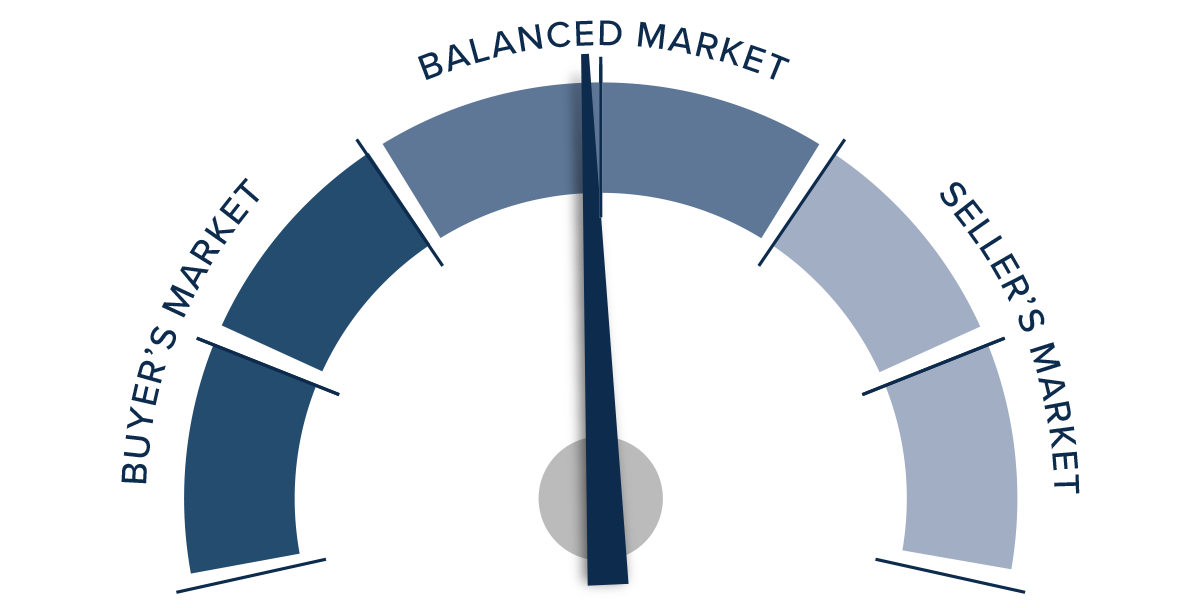
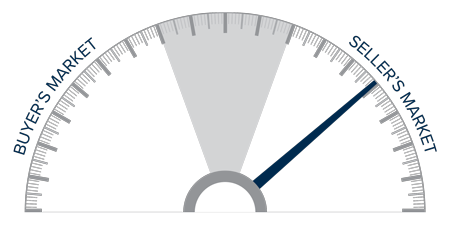
Conclusions
This speedometer reflects the state of the region’s real estate market using housing inventory, price gains, home sales, interest rates, and larger economic factors.
As mentioned earlier, it doesn’t appear that rising mortgage rates have had the same negative effect in Montana that has been felt across most of the country. In the third quarter, home sales and sale/ list prices rose while market time fell, which are all factors that favor sellers. However, rising inventory and falling pending sales would suggest that the market may be ready to shift toward buyers.

Although the market is expected to slow, it’s too early to suggest that it will favor buyers any time soon. Given all these factors, the needle stays in the balanced quadrant but moved slightly in favor of home sellers.
Q2 2023 Montana Real Estate Market Update

The following analysis of select counties of the Montana real estate market is provided by Windermere Real Estate Chief Economist Matthew Gardner. We hope that this information may assist you with making better-informed real estate decisions. For further information about the housing market in your area, please don’t hesitate to contact your Windermere Real Estate agent.
Regional Economic Overview
Year over year, Montana added 7,100 jobs. This represents an annual growth rate of 1.4%, which is the slowest pace of growth the state has seen since pandemic influences started to come into play. Regionally, there were significant variations: Employment fell .7% in Billings while it rose 3.4% in Missoula. Montana’s unemployment rate in May was 2.3%, which was down from 2.6% during the same period in 2022 and may explain slowing job growth. The state has a significant labor shortage. In the metro areas covered in this report, the lowest jobless rate was in Billings at 2.2%, followed by Missoula at 2.3%, and Great Falls at 2.4%.
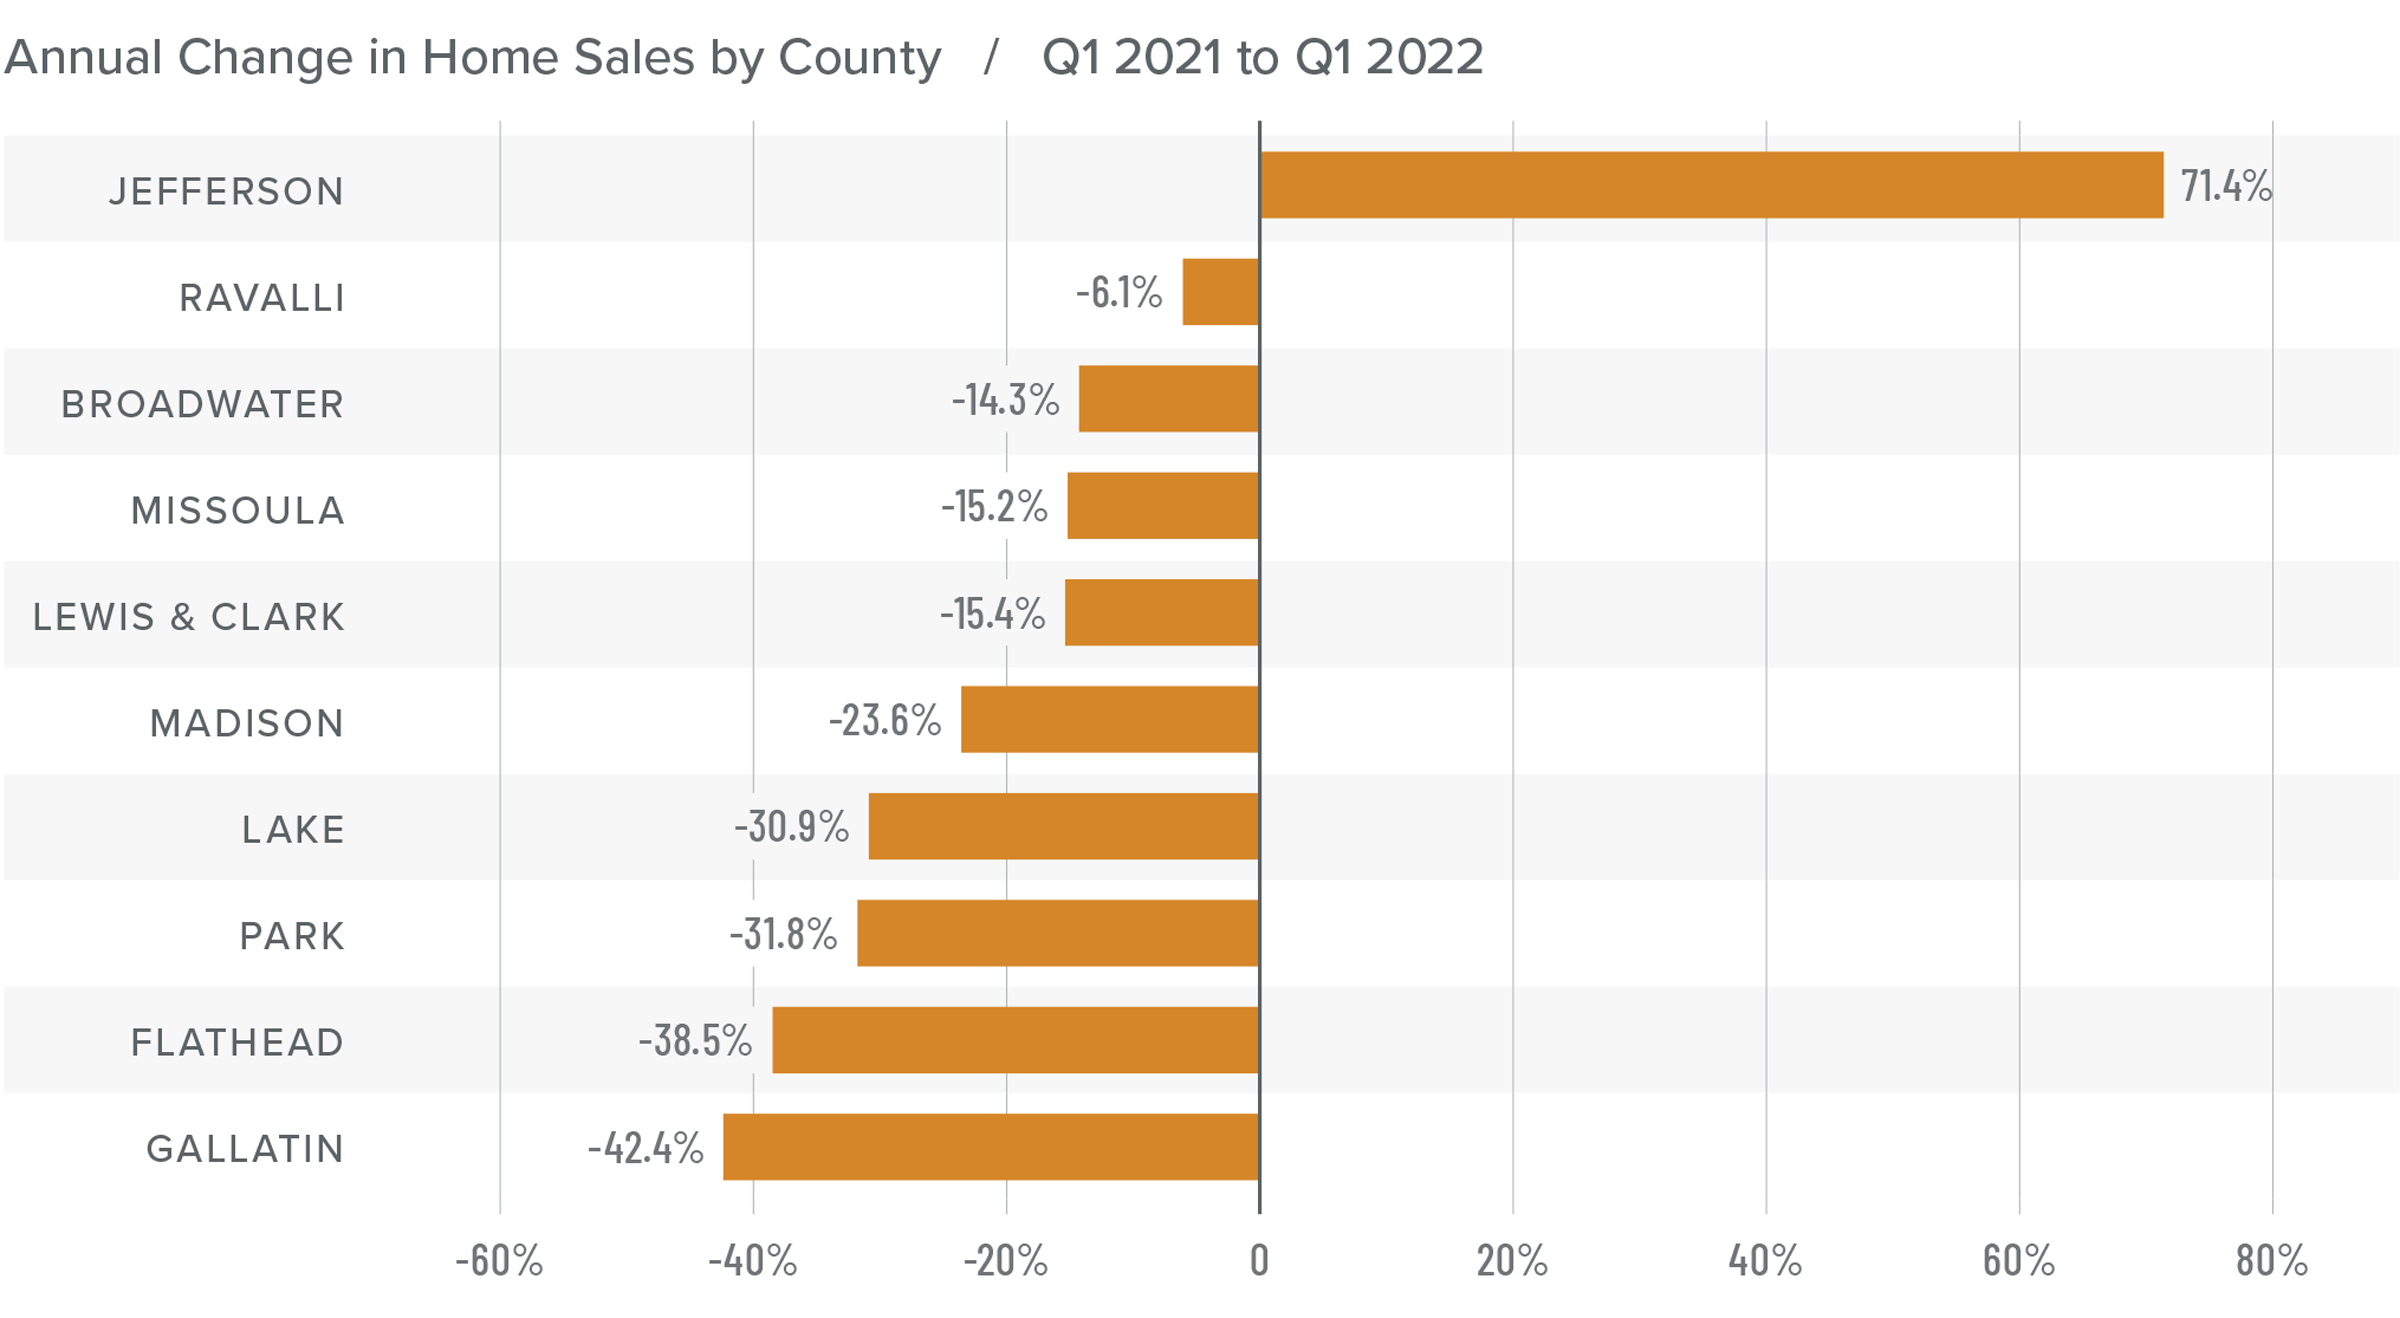
Montana Home Sales
❱ In the first quarter of 2023, 1,518 homes sold in the counties covered by this report. This represents a 16.1% decline from the second quarter of 2022 but an increase of 58.6% compared to the first quarter of 2023.
❱ Listing activity was 24.8% higher than in the second quarter of 2022 and 17.1% higher than in the first quarter of this year.
❱ Sales fell across the board from the second quarter of 2022. Compared to the first quarter of this year, sales were up in every county other than Jefferson, which is prone to significant swings given that very few homes sell there.
❱ Pending sales rose 15.4% quarter over quarter, suggesting that closings in the third quarter could show additional improvement.
Montana Home Prices
❱ Home prices were down 5% year over year, with an average sale price of $760,428. The average home price rose .1% compared to the first quarter of 2022.
❱ I wasn’t surprised that home prices fell in most areas compared to the same period in 2022. A year ago home buyers were scrambling to buy before mortgage rates skyrocketed.
❱ Year over year, prices rose in three counties and fell in seven. Compared to the first quarter of this year, every county other than Lake, Lewis & Clark, and Flathead saw prices rise.
❱ Mortgage rates remain high, and it’s now likely they will remain higher for longer than anticipated. That will take some steam out of price growth in the second half of the year. This is also supported by lower median list prices than in the first quarter. Sellers seem to understand that higher borrowing costs are having an impact on buyers.
Mortgage Rates
Although they were less erratic than the first quarter, mortgage rates unfortunately trended higher and ended the quarter above 7%. This was due to the short debt ceiling impasse, as well as several economic datasets that suggested the U.S. economy was not slowing at the speed required by the Federal Reserve.
While the June employment report showed fewer jobs created than earlier in the year, as well as downward revisions to prior gains, inflation has not sufficiently slowed. Until it does, rates cannot start to trend consistently lower. With the economy not slowing as fast as expected, I have adjusted my forecast: Rates will hold at current levels in third quarter and then start to trend lower through the fall. Although there are sure to be occasional spikes, my model now shows the 30-year fixed rate breaking below 6% next spring.
Montana Days on Market
❱ The average time it took to sell a home rose 26 days compared to the same period in 2022.
❱ Homes sold fastest in Gallatin County while homes in Flathead County took the longest time to sell. Only Lewis & Clark County saw market time fall compared to the second quarter of 2022. Average market time rose in the rest of the region.
❱ During the second quarter, it took an average of 77 days to sell a home in the markets covered by this report.
❱ Compared to the first quarter of 2023, days on market fell in all counties other than Jefferson, where it took 20 more days for homes to sell.
Conclusions
This speedometer reflects the state of the region’s real estate market using housing inventory, price gains, home sales, interest rates, and larger economic factors.
Market indicators are mixed right now. Sales activity increased and the length of time it took for homes to sell fell, which certainly should favor sellers. However, sales price growth was anemic, list prices are generally lower, and there is more inventory to choose from, which favors home buyers.
Having taken all these factors into consideration, I am leaving the needle inside the balanced quadrant. I am giving a bit of bias in favor of buyers, but the degree to which they have an advantage is minimal.
About Matthew Gardner

As Chief Economist for Windermere Real Estate, Matthew Gardner is responsible for analyzing and interpreting economic data and its impact on the real estate market on both a local and national level. Matthew has over 30 years of professional experience both in the U.S. and U.K.
In addition to his day-to-day responsibilities, Matthew sits on the Washington State Governors Council of Economic Advisors; chairs the Board of Trustees at the Washington Center for Real Estate Research at the University of Washington; and is an Advisory Board Member at the Runstad Center for Real Estate Studies at the University of Washington where he also lectures in real estate economics.
Q1 2023 Montana Real Estate Market Update

The following analysis of select counties of the Montana real estate market is provided by Windermere Real Estate Chief Economist Matthew Gardner. We hope that this information may assist you with making better-informed real estate decisions. For further information about the housing market in your area, please don’t hesitate to contact your Windermere Real Estate agent.
Regional Economic Overview
Year over year, Montana added 12,600 jobs, representing a solid growth rate of 2.5%. The slowdown in employment gains in the fourth quarter of 2022 appears to have turned. The rest of the region had the same change in trajectory except Billings, which lost 400 jobs over the past 12 months. The state unemployment rate in February was 2.4%, which was down from 2.5% in the first quarter of 2022. In the metro areas covered in this report, the lowest jobless rate was in Billings at 2.2%. In Missoula and Great Falls, 2.4% of their respective labor force remains unemployed.
Montana Home Sales
❱ In the first quarter of 2023, 1,273 homes sold, which was a 29.6% decline from the first quarter of 2022. Sales activity fell 23.4% compared to the final quarter of last year.
❱ Listing activity was 66% higher than in the same period of 2022, but down 3.5% compared to the fourth quarter of 2022. The market has become tight again.
❱ Sales fell across the board from the first quarter of 2022. Compared to the final quarter of last year, sales rose in Jefferson County but fell in the rest of the market areas.
❱ Pending sales rose 14.1% quarter over quarter. This suggests that closings in the second quarter could be higher, but low levels of inventory may hold the market back.
Montana Home Prices
❱ Home prices were up .2% year over year to an average sale price of $747,158. The average sale price rose 3.1% compared to the fourth quarter of 2022.
❱ The market has been more resilient than many had expected, given significantly higher financing costs. It was also interesting that the median listing price across the region was 1.4% higher than at the end of last year. The Montana market remains more confident than most of the country!
❱ Year over year, prices rose in five counties, remained static in one, and fell in four. What was more interesting, however, was that over half of the counties surveyed saw prices rise quarter over quarter. The only counties that had price declines were Broadwater, Jefferson, Gallatin, and Park.
❱ Ultimately, I expect prices to dip a little more before finding stability this summer and then starting to rise again as mortgage rates fall.
Mortgage Rates
Rates in the first quarter of 2023 were far less volatile than last year, even with the brief but significant impact of early March’s banking crisis. It appears that buyers are jumping in when rates dip, which was the case in mid-January and again in early February.
Even with the March Consumer Price Index report showing inflation slowing, I still expect the Federal Reserve to raise short-term rates one more time following their May meeting before pausing rate increases. This should be the catalyst that allows mortgage rates to start trending lower at a more consistent pace than we have seen so far this year. My current forecast is that rates will continue to move lower with occasional spikes, and that they will hold below 6% in the second half of this year.
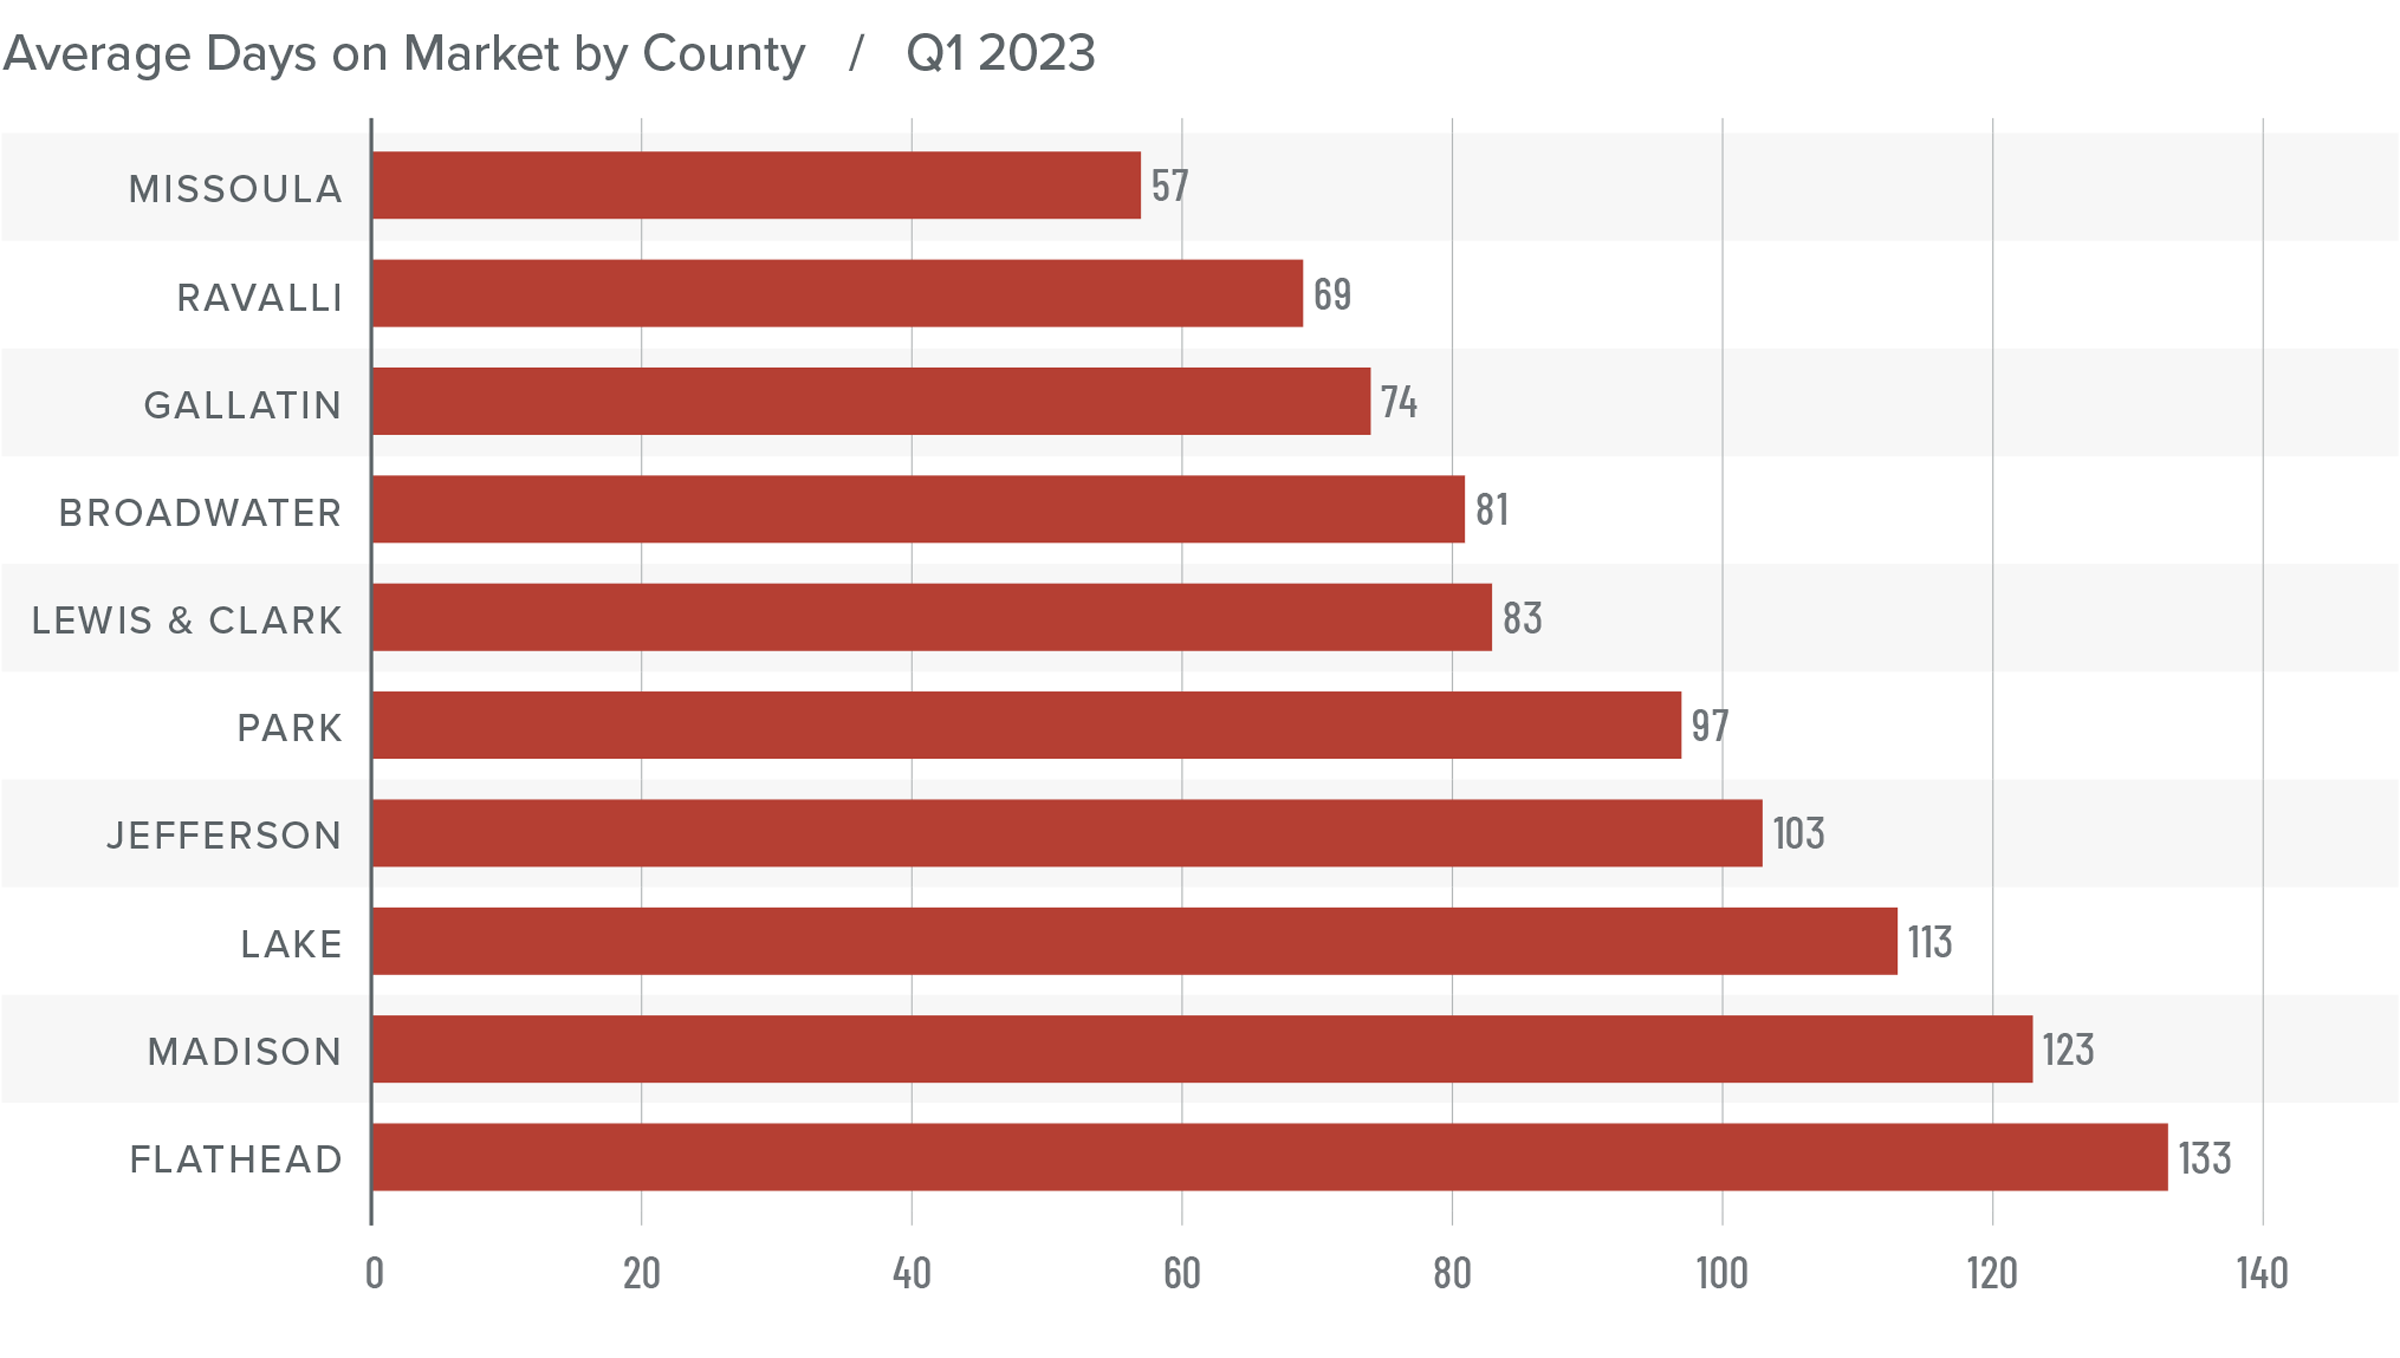
Montana Days on Market
❱ The average time it took to sell a home rose 19 days compared to the same period in 2022.
❱ Homes sold fastest in Missoula County while homes in Flathead County took the longest to sell. Broadwater and Madison counties saw days on market fall compared to the same period in 2022. Average market time rose in the rest of the region.
❱ During the first quarter, it took an average of 93 days to sell a home in the markets covered by this report.
❱ Compared to the final quarter of 2022, average market time rose in all counties other than Broadwater (-17 days) and Ravalli (-13 days).
Conclusions
This speedometer reflects the state of the region’s real estate market using housing inventory, price gains, home sales, interest rates, and larger economic factors.
Even in the face of significantly higher mortgage rates, the market has been very reluctant to give up the remarkable gains that home values saw during the pandemic period. However, it appears as if the nationwide trend has started to slowly impact the Treasure State. There are markets that have given back some of the value gained over the past few years, but it’s certainly not a collapse by any stretch of the imagination. Lower sales, prices, and longer days on market favor home buyers. However, inventory limitations, solid absorption rates, and higher listing prices benefit home sellers.
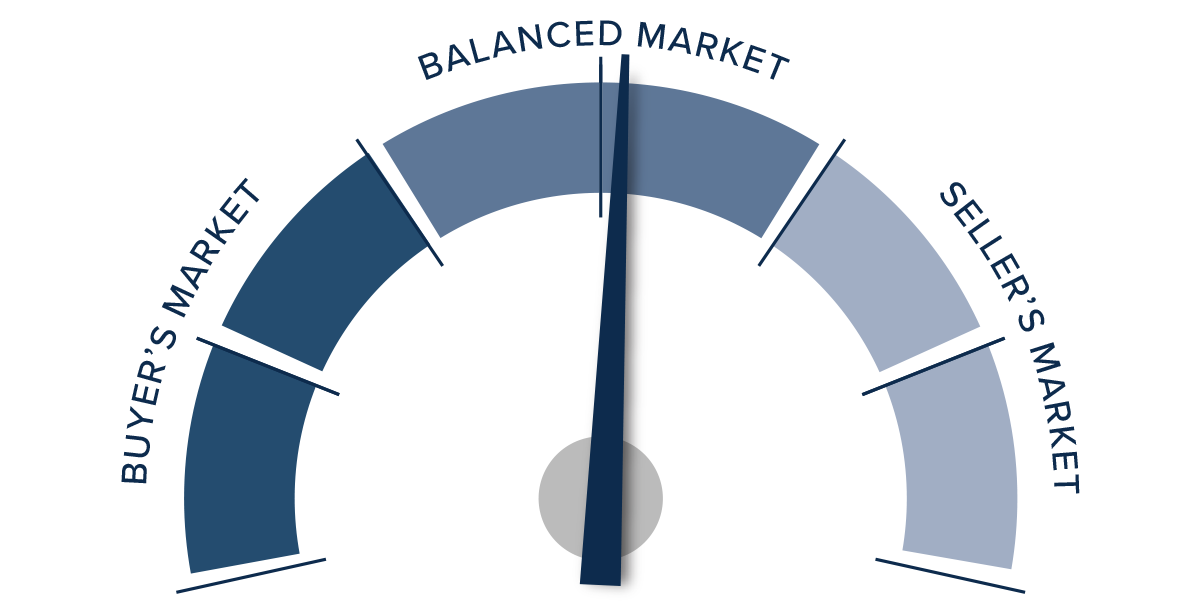
Although further erosion of home values is likely, I anticipate a number of the counties contained in this report will experience price growth in 2023. It’s unlikely to be significant, but it is growth all the same. As such, I am leaving the needle in the balanced area but tilted slightly toward home sellers.
About Matthew Gardner
As Chief Economist for Windermere Real Estate, Matthew Gardner is responsible for analyzing and interpreting economic data and its impact on the real estate market on both a local and national level. Matthew has over 30 years of professional experience both in the U.S. and U.K.
In addition to his day-to-day responsibilities, Matthew sits on the Washington State Governors Council of Economic Advisors; chairs the Board of Trustees at the Washington Center for Real Estate Research at the University of Washington; and is an Advisory Board Member at the Runstad Center for Real Estate Studies at the University of Washington where he also lectures in real estate economics.
Q4 2022 Montana Real Estate Market Update
The following analysis of select counties of the Montana real estate market is provided by Windermere Real Estate Chief Economist Matthew Gardner. We hope that this information may assist you with making better-informed real estate decisions. For further information about the housing market in your area, please don’t hesitate to contact your Windermere Real Estate agent.
Regional Economic Overview
The slowing job growth trend that started in the summer of last year continued into the fall, with employment increasing only 1.3% year over year. With only 6,500 jobs added over the past 12 months, annual job gains are now below 10,000, a pace we have not seen since the pandemic started having an impact on the job market. Regionally, the picture was the same: all metro areas added jobs but at a far slower pace. Montana’s unemployment rate in November was 2.9%, matching the level of the year prior. In the metro areas covered in this report, the lowest jobless rate was in Billings at 2.1%, followed by Missoula at 2.2%, and Great Falls at 2.5%.
Montana Home Sales
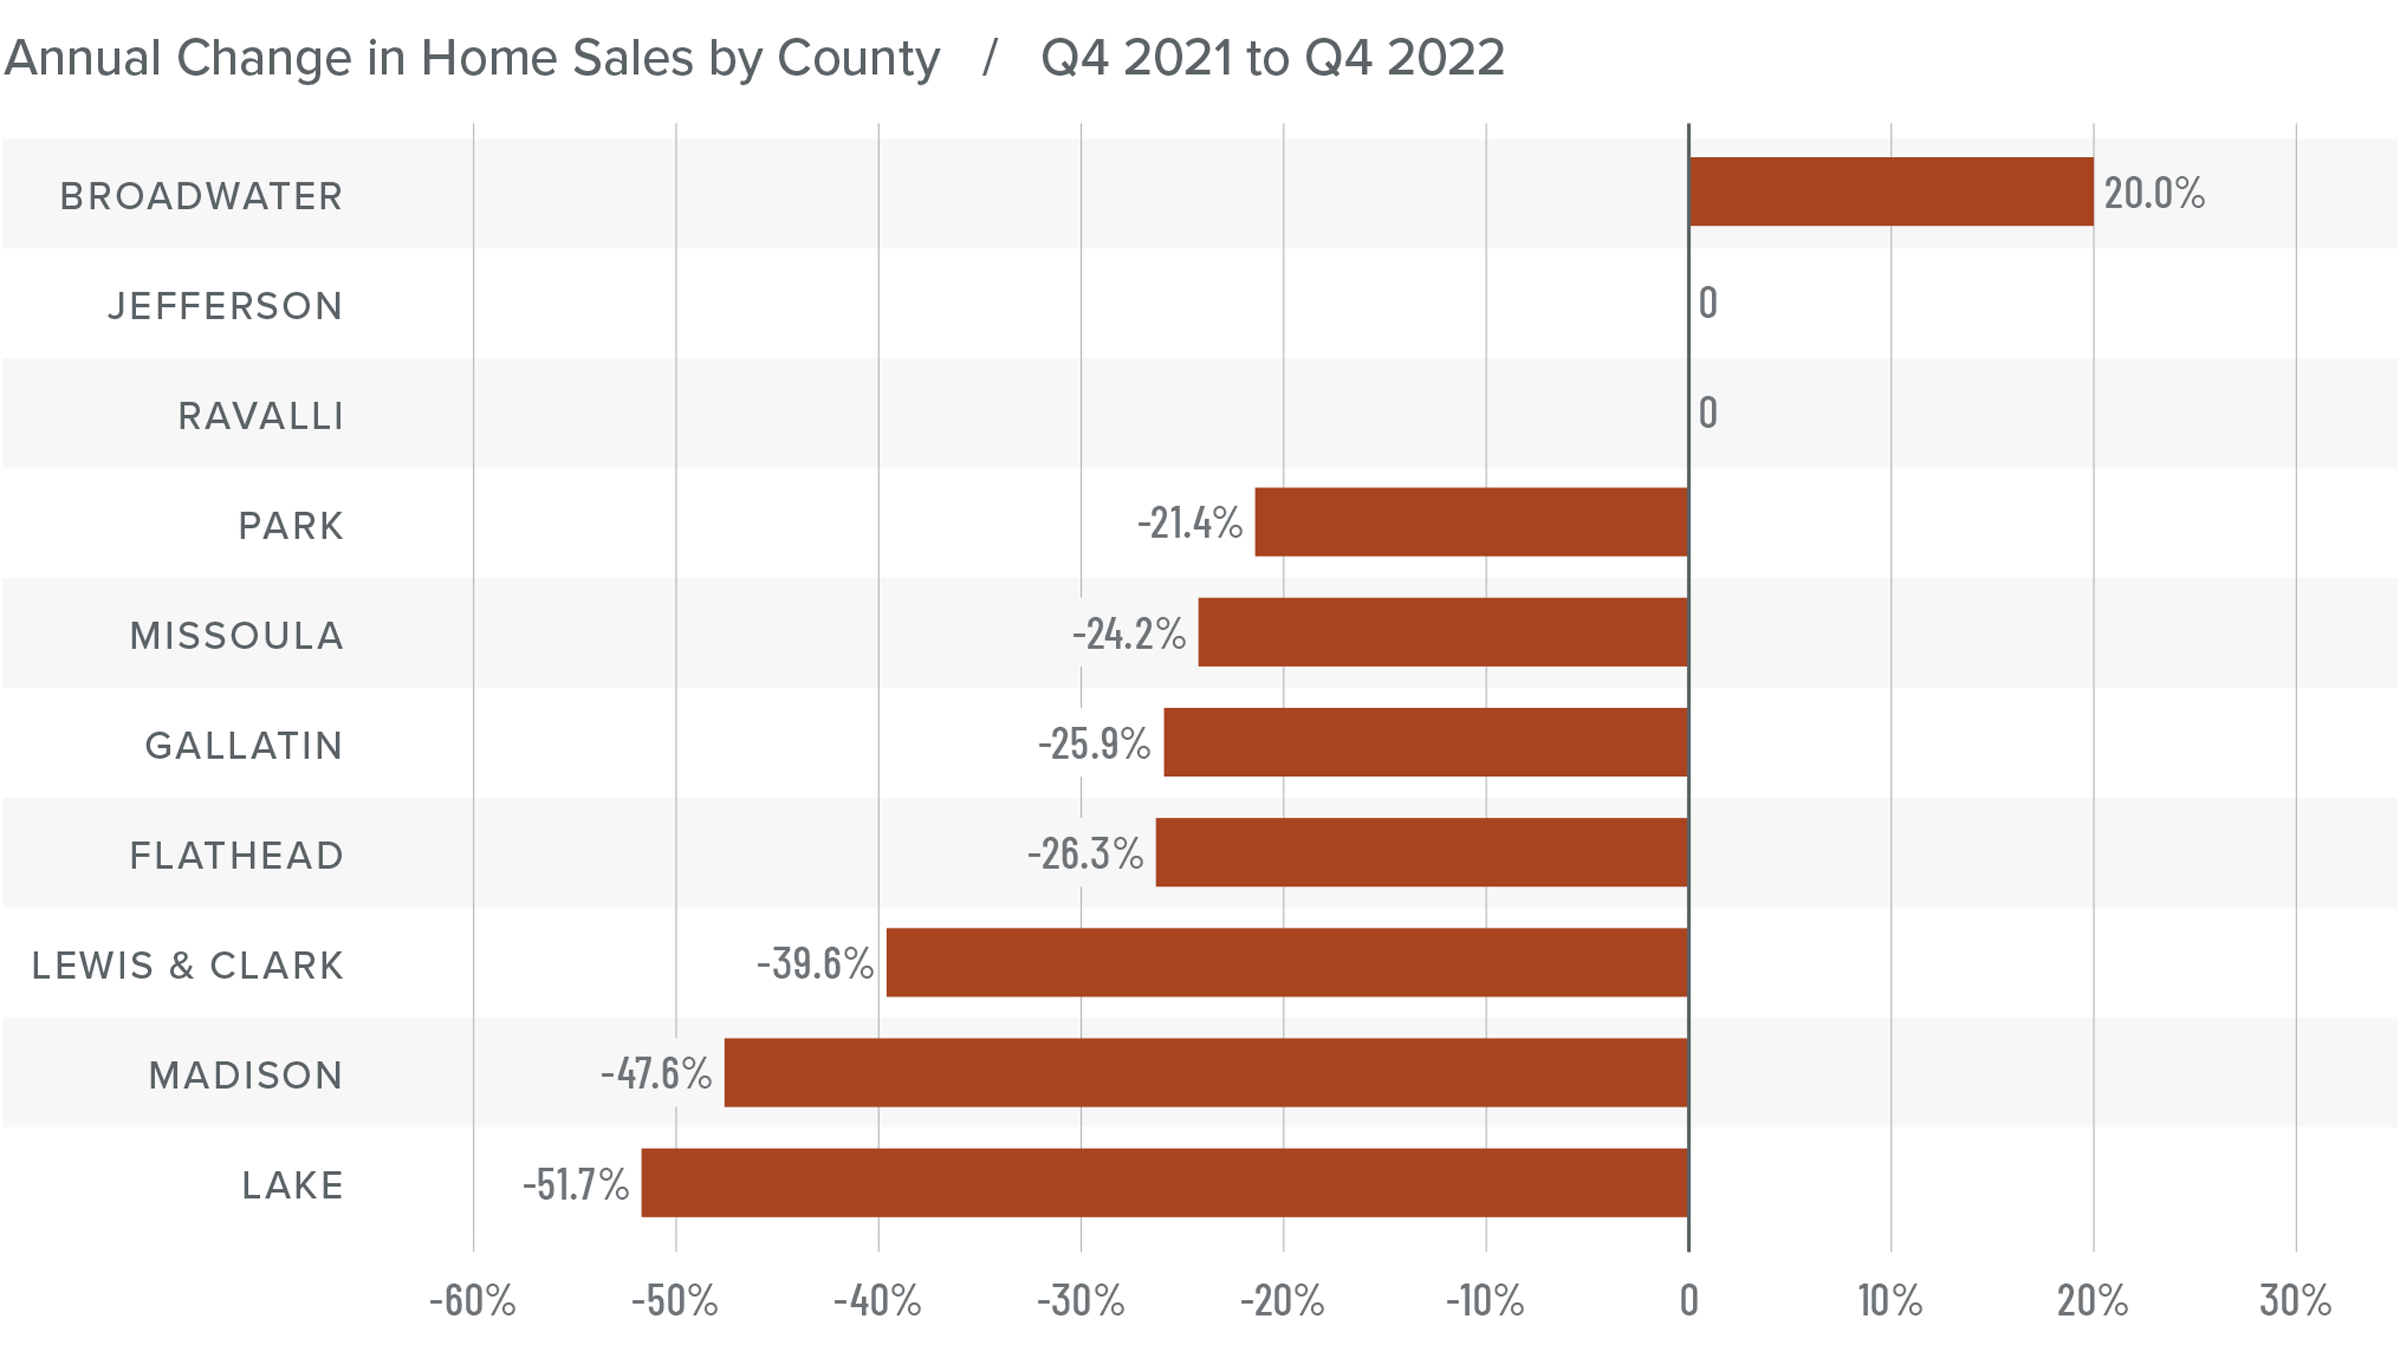
❱ In the final quarter of 2022, 1,203 homes sold in the counties covered by this report. This was a 27% decline from the fourth quarter 2021 and down 40.5% compared to the third quarter of 2022.
❱ Listing activity was 19.3% lower than the same period the prior year and 26.1% lower than in the third quarter. Although a drop in listings is expected as the region enters the winter months, the decline from a year ago was unexpected.
❱ Year over year, sales increased in Broadwater County, were flat in Jefferson and Ravalli counties, and fell in the balance of the markets included in this report. Compared to the third quarter of 2022, sales rose in Broadwater, Jefferson, and Madison counties but fell in all other markets.
❱ Pending sales fell 52.8% from the previous quarter. This may be a function of lower supply levels, but I am noticing that listing prices are starting to pull back in some areas. Higher mortgage rates may have started to affect prices.
Montana Home Prices
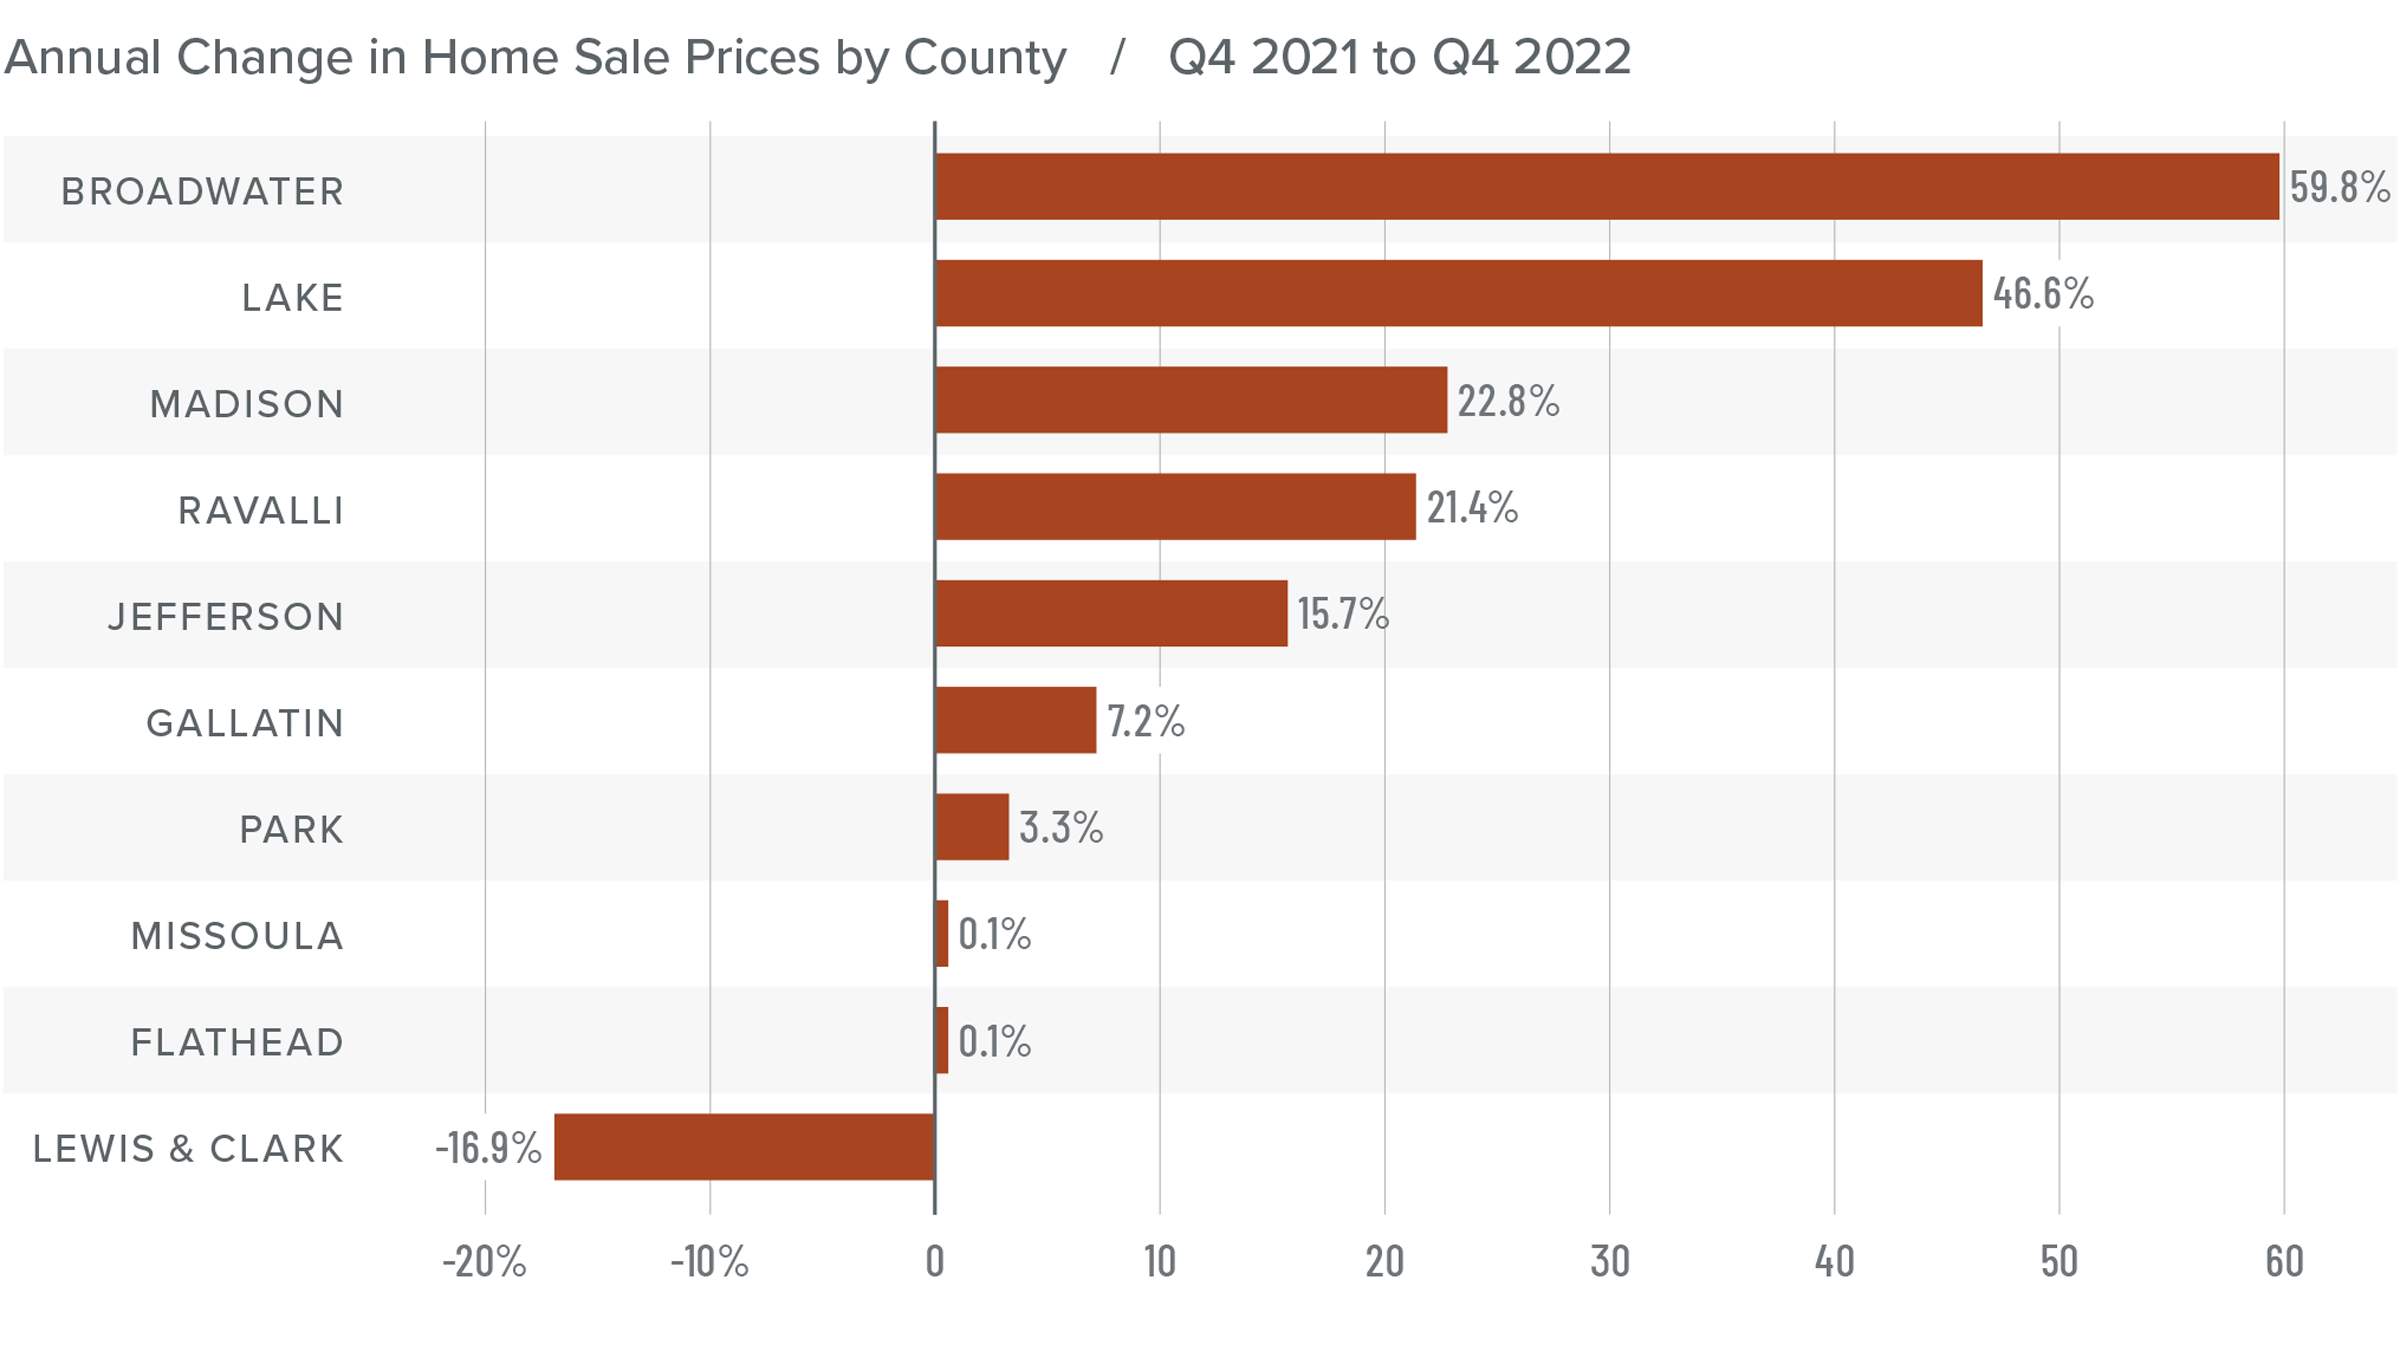
❱ Home prices were up 5.5% year over year to an average of $783,588. Prices were 10.5% higher than in the third quarter of 2022.
❱ I still expect price growth to slow as we move through 2023. The question is whether prices will experience a tangible fall or if they will be able to hold onto modest gains while waiting for mortgage rates to fall, which would stimulate demand.
❱ In many parts of the country, prices have started to soften due to higher mortgage rates, so it was surprising to see the region’s home prices increase from the third quarter. While median listing prices were higher across the board, they did drop in Broadwater, Ravalli, Park, and Gallatin counties.
❱ The Montana housing market is faring much better than most of the country. Whether this can continue, however, is still uncertain.
Mortgage Rates
Rates rose dramatically in 2022, but I believe that they have now peaked. Mortgage rates are primarily based on the prices and yields of bonds, and while bonds take cues from several places, they are always impacted by inflation and the economy at large. If inflation continues to fall, as I expect it will, rates will continue to drop.
My current forecast is that mortgage rates will trend lower as we move through the year. While this may be good news for home buyers, rates will still be higher than they have become accustomed to. Even as the cost of borrowing falls, home prices in expensive markets will probably fall a bit more to compensate for rates that will likely hold above 6% until early summer.
Montana Days on Market
❱ The average time it took to sell a home rose eight days compared to the same period the prior year.
❱ Homes sold fastest in Gallatin County while homes in Broadwater County took the longest time to sell. Missoula, Lake, Lewis and Clark, and Jefferson counties saw market time fall year over year. Market time rose in the rest of the region.
❱ During the fourth quarter, it took an average of 73 days to sell a home in the markets covered by this report.
❱ Compared to the third quarter of 2022, average market time rose in all counties other than Lake, where it took an average of four fewer days to find a buyer.
Conclusions
This speedometer reflects the state of the region’s real estate market using housing inventory, price gains, home sales, interest rates, and larger economic factors.
So far, the Montana housing market has been unaffected by the significantly higher financing costs that have led home prices to fall across much of the country. Whether the region can continue to move through 2023 without seeing any substantial drop in home values remains to be seen, but it appears to be in a far better position today than most states. Pending sales in the quarter fell across most counties contained in this report, but whether this can be attributed to slower demand or simply the fact that inventory levels have pulled back is also unclear.

What is clear is that the market remains resilient. For this reason I am not moving the needle more in favor of buyers, unlike most markets across the U.S. Instead, I am leaving it in the same position as the third quarter of 2022. Hopefully, the spring market will provide more clarity about what we can expect from the rest of the year.
About Matthew Gardner
As Chief Economist for Windermere Real Estate, Matthew Gardner is responsible for analyzing and interpreting economic data and its impact on the real estate market on both a local and national level. Matthew has over 30 years of professional experience both in the U.S. and U.K.
In addition to his day-to-day responsibilities, Matthew sits on the Washington State Governors Council of Economic Advisors; chairs the Board of Trustees at the Washington Center for Real Estate Research at the University of Washington; and is an Advisory Board Member at the Runstad Center for Real Estate Studies at the University of Washington where he also lectures in real estate economics.
Q3 2022 Montana Real Estate Market Update

The following analysis of select counties of the Montana real estate market is provided by Windermere Real Estate Chief Economist Matthew Gardner. We hope that this information may assist you with making better-informed real estate decisions. For further information about the housing market in your area, please don’t hesitate to contact your Windermere Real Estate agent.
Regional Economic Overview
Though employment growth in Montana continues to taper, the addition of 11,500 new jobs over the past year is solid. All metro areas in the region continue to add jobs. Missoula was the standout, having added 1,900 new jobs during the past quarter. The state unemployment rate in August was 2.8%; this is up from 2.6% at the end of the second quarter and is mainly due to the growing labor force. In the metro areas covered in this report, the lowest jobless rate was in Billings at 2.6%, followed by Missoula at 2.7%, and Great Falls at 2.9%. The labor force participation rate (which is the civilian population divided by the labor force) has risen marginally to 62.7%, which is still very close to the all-time low. This means businesses will still have a difficult time finding workers.
Montana Home Sales
❱ In the third quarter of this year, 2,023 homes sold in the markets contained in this report, which is a 7.9% decline from a year ago. Sales activity fell 14.3% compared to the second quarter of this year.
❱ The number of homes for sale was 17.5% higher than a year ago and a remarkable 75.7% higher than in the second quarter. Sellers appear to still be confident in the market.
❱ Year over year, sales grew in Ravalli County but fell in the balance of the markets included in this report. Sales grew in Missoula, Ravalli, and Lake counties from the second quarter but fell in all other markets.
❱ Seller confidence was supported by the fact that pending sales rose 34.4% from the second quarter, which is a very significant improvement and is likely a result of there being considerably more choice in the market.

Montana Home Prices
❱ Home prices were flat year over year, with the average sale price coming in at $709,013. Prices were .2% lower than in the second quarter of 2021.
❱ Price growth will likely remain flat for the balance of 2022 and into 2023 as buyers and sellers react to mortgage rates that are higher than they’ve seen in a long time. That said, even with more expensive financing costs and higher inventory levels, I do not expect home prices in Montana to turn negative in 2023.
❱ With pending sales up significantly but home prices essentially flat, the numbers are somewhat unusual until you note that the median listing price fell .8% from the second quarter. Home sellers are reacting to a market with more competition and are now having to price their homes more competitively.
❱ Sellers who price their homes realistically are still finding buyers—even with more competition than they’ve seen in several years.
Mortgage Rates
This remains an uncertain period for mortgage rates. When the Federal Reserve slowed bond purchases in 2013, investors were accused of having a “taper tantrum,” and we are seeing a similar reaction today. The Fed appears to be content to watch the housing market go through a period of pain as they throw all their tools at reducing inflation.
As a result, mortgage rates are out of sync with treasury yields, which not only continues to push rates much higher, but also creates violent swings in both directions. My current forecast calls for rates to peak in the fourth quarter of this year before starting to slowly pull back. That said, they will remain in the 6% range until the end of 2023.
Montana Days on Market
❱ The average time it took to sell a home fell eight days compared to the same period a year ago.
❱ Homes sold fastest in Broadwater County, while homes in Flathead County took the longest to sell. Jefferson, Gallatin, Park, and Madison counties saw market time rise compared to a year ago. Average market time in the rest of the region dropped.
❱ During the third quarter, it took an average of 49 days to sell a home in the markets covered by this report.
❱ In comparison to the second quarter of 2022, average market time fell in all counties other than Park (+17 days), Lake (+12 days), Gallatin (+11 days), and Madison (+6 days).
Conclusions
This speedometer reflects the state of the region’s real estate market using housing inventory, price gains, home sales, interest rates, and larger economic factors.
The Montana housing market has started to react to mortgage rates that have essentially doubled since the start of 2022. Sellers are having to adjust to higher inventory levels, more expensive financing costs, and increased competition by making sure their asking price is realistic. These adjustments should favor buyers—and they do. I see a trend back toward a more balanced market, but one that is still far from being a traditional buyer’s market.

Therefore, I am moving the needle more toward the middle, but not so much as to suggest that buyers are now in the driver’s seat.
About Matthew Gardner
As Chief Economist for Windermere Real Estate, Matthew Gardner is responsible for analyzing and interpreting economic data and its impact on the real estate market on both a local and national level. Matthew has over 30 years of professional experience both in the U.S. and U.K.
In addition to his day-to-day responsibilities, Matthew sits on the Washington State Governors Council of Economic Advisors; chairs the Board of Trustees at the Washington Center for Real Estate Research at the University of Washington; and is an Advisory Board Member at the Runstad Center for Real Estate Studies at the University of Washington where he also lectures in real estate economics.
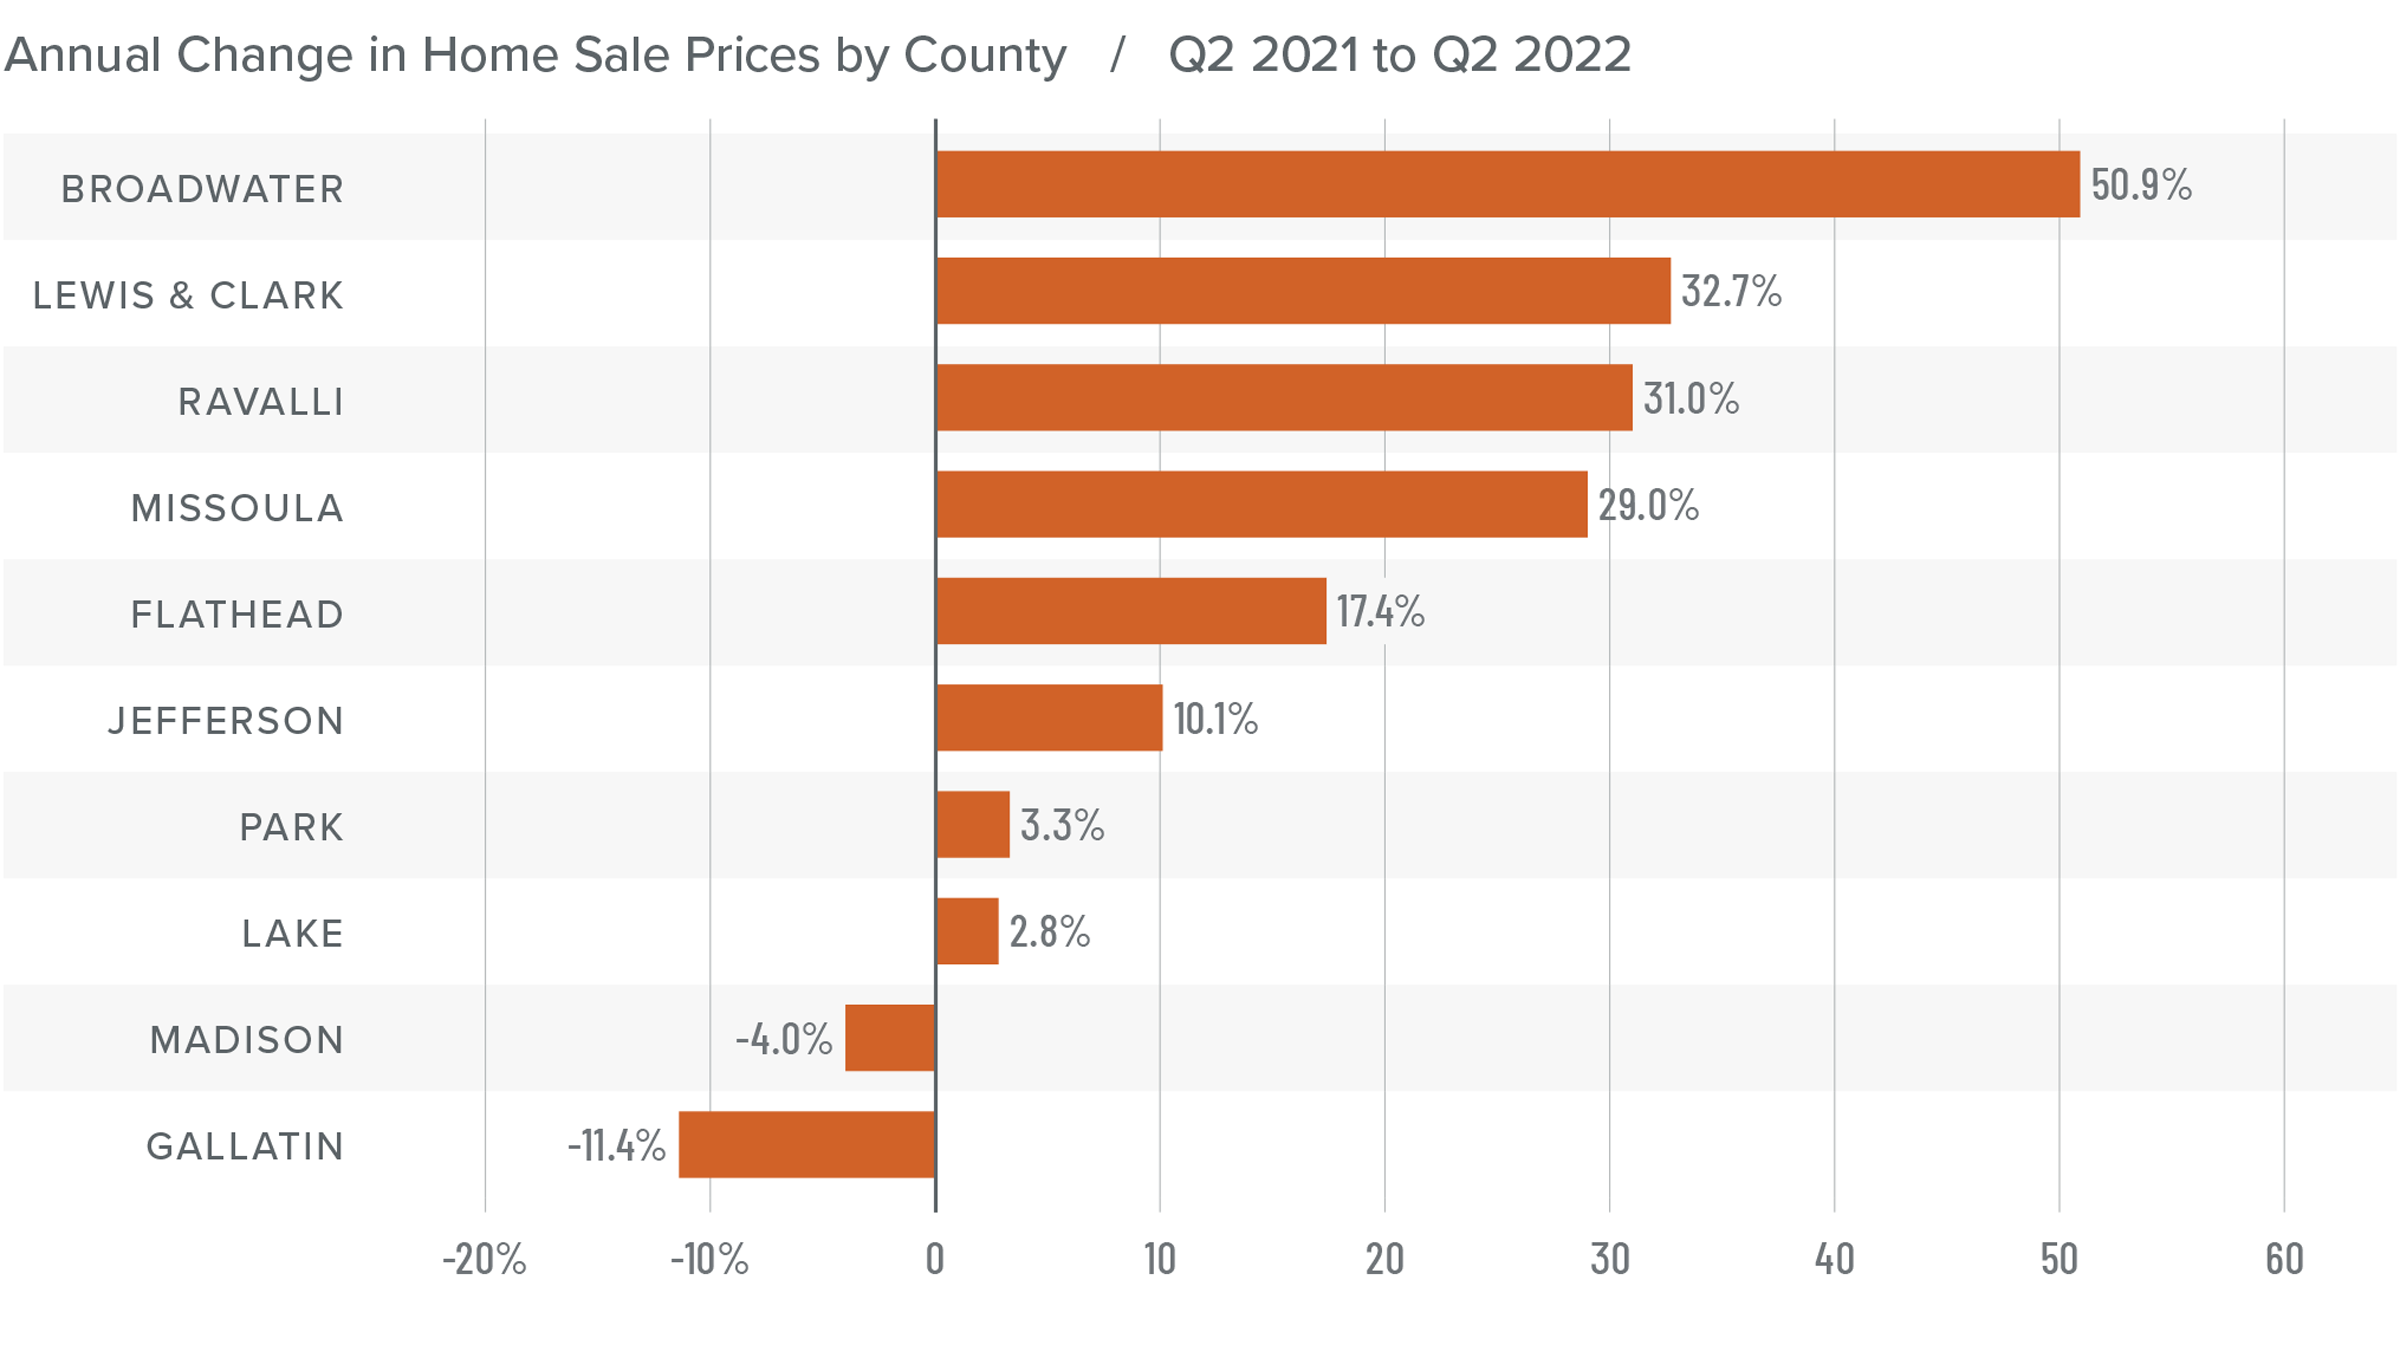
Q2 2022 Montana Real Estate Market Update

The following analysis of select counties of the Montana real estate market is provided by Windermere Real Estate Chief Economist Matthew Gardner. We hope that this information may assist you with making better-informed real estate decisions. For further information about the housing market in your area, please don’t hesitate to contact your Windermere Real Estate agent.
Regional Economic Overview
Though the pace of job growth continues to taper, Montana still added 15,800 new jobs over the past year, which is impressive when compared to historic averages. All of Montana’s metro areas have recovered the jobs lost due to the pandemic. The unemployment rate in Montana in June was 2.6%, an increase from the all-time low of 2.3% in April. In the metro areas contained in this report, the lowest jobless rate was in Billings at 2.5%, followed by Missoula at 2.7% and Great Falls at 2.8%. I continue to be worried about the lack of workers in the state. The labor force participation rate (which is the civilian population divided by the labor force) stands at only 62.6%, close to a historic low and making it difficult for employers to find workers.
Montana Home Sales
❱ In the second quarter, 2,359 homes sold in the markets contained in this report. This was a 2.9% increase from a year ago and more than double the number of closings in the first quarter of the year.
❱ Higher home sales can be attributed to the 124% increase in the number of homes that came to market in the quarter.
❱ Year over year, sales rose in four of the counties included in this report but fell in the rest of the markets. Compared to the first quarter, however, sales were up in every county other than Madison.
❱ With significantly more homes to choose from, pending sales rose 11.7% from first quarter, suggesting that third quarter numbers may also be strong.
Montana Home Prices
❱ Home prices rose 17.8% year over year to an average of $710,428 but were 12.9% lower than in the first quarter of 2022.
❱ I have started watching list prices more closely, as they are a leading indicator of the health of the housing market. Thus far, despite rising mortgage rates and inventory levels, sellers remain confident. This is evident in the median list price going up in every county other than Gallatin compared to the prior quarter.
❱ Although the quarterly drop may concern some, the average sale price used in this report is weighted to account for market size. If we use simple averages, prices in the second quarter were 11.9% higher than in the first quarter.
❱ Price growth has yet to slow but, given the changing market conditions, it’s only a matter of time before it does.
Mortgage Rates
Although mortgage rates did drop in June, the quarterly trend was still moving higher. Inflation—the bane of bonds and, therefore, mortgage rates—has yet to slow, which is putting upward pressure on financing costs.
That said, there are some signs that inflation is starting to soften and if this starts to show in upcoming Consumer Price Index numbers then rates will likely find a ceiling. I am hopeful this will be the case at some point in the third quarter, which is reflected in my forecast.
Montana Days on Market
❱ The average time it took to sell a home dropped 31 days compared to the second quarter of 2021.
❱ Homes sold fastest in Gallatin County. Flathead County homes took the longest time to find a buyer. All counties saw market time drop compared to a year ago.
❱ During the quarter, it took an average of 57 days to sell a home in the region.
❱ In comparison to the first quarter of the year, average market time fell in every market other than Jefferson (+17 days) and Broadwater (+45 days).
Conclusions
This speedometer reflects the state of the region’s real estate market using housing inventory, price gains, home sales, interest rates, and larger economic factors.
Even with a shortage of workers, the economy remains buoyant, which is an important factor when it comes to the regional housing market, particularly for buyers. Even though the number of homes for sale has grown significantly, which normally favors buyers, demand is strong and the market remains competitive. List prices continue to rise, demonstrating that sellers remain confident even in the face of higher financing costs, which is likely discouraging for home buyers. Sellers are clearly still in control.

As such, I have moved the needle a little more in the direction of sellers. Until we see list-price growth and transactional velocities slow significantly, we will not approach a balanced market.
About Matthew Gardner
As Chief Economist for Windermere Real Estate, Matthew Gardner is responsible for analyzing and interpreting economic data and its impact on the real estate market on both a local and national level. Matthew has over 30 years of professional experience both in the U.S. and U.K.
In addition to his day-to-day responsibilities, Matthew sits on the Washington State Governors Council of Economic Advisors; chairs the Board of Trustees at the Washington Center for Real Estate Research at the University of Washington; and is an Advisory Board Member at the Runstad Center for Real Estate Studies at the University of Washington where he also lectures in real estate economics.
Q1 2022 Montana Real Estate Market Update

The following analysis of select counties of the Montana real estate market is provided by Windermere Real Estate Chief Economist Matthew Gardner. We hope that this information may assist you with making better-informed real estate decisions. For further information about the housing market in your area, please don’t hesitate to contact your Windermere Real Estate agent.
Regional Economic Overview
At the end of the first quarter, 505,200 people were employed in the state, which is up 17,400 from a year ago and 16,100 more than the pre-pandemic peak. Regionally, job levels in Billings and Missoula were also above pre-COVID-19 rates. Great Falls is only 200 jobs shy of matching its February 2020 level. Given the solid pace of job growth in the state, it’s not surprising that the unemployment rate is at a very low 2.3%. This is the lowest rate Montana has seen since the Labor Department started keeping records in 1976. In the metro areas contained in this report, the lowest jobless rate was in Billings at 2.4%, followed by Great Falls at 2.5%, and Missoula at 2.7%. Revisions by the labor department showed an economy that is doing better than originally thought. The only cause for concern is that the labor force has not been increasing at a pace that can keep up with the needs of employers, as demonstrated by the very low jobless rate. This will likely lead wages to rise significantly to attract more workers.
Montana Home Sales
❱ In the first quarter of the year, 1,137 homes sold, which is a 35% drop from a year ago and 23.2% lower than in the final quarter of 2021.
❱ The lower number of sales can be blamed on the lack of homes for sale: inventory was down 37.7% from a year ago and was 31.7% lower than the previous quarter.
❱ The small county of Jefferson saw sales increase from a year ago, but all other markets pulled back. Compared to the final quarter of 2021, sales were lower across the board.
❱ Pending sales increased by a solid 18.8% quarter over quarter, suggesting that second quarter numbers should show growth.
Montana Home Prices
❱ Home prices rose a modest 3.1% year over year to an average of $815,938 and were 13.1% higher than in the final quarter of 2021.
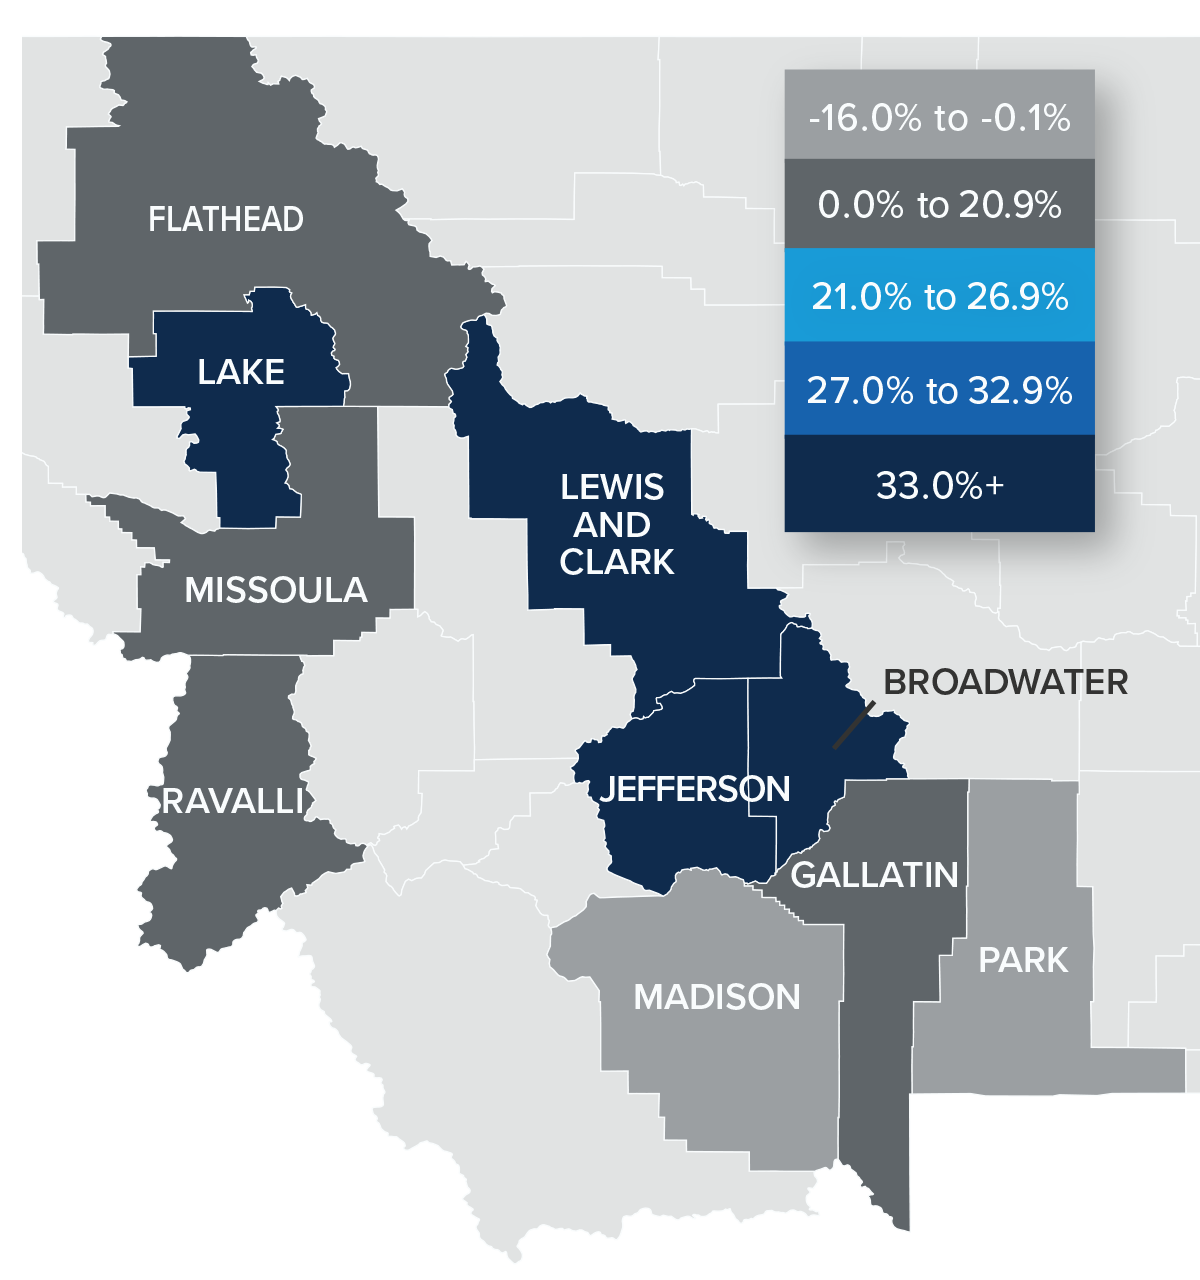
❱ Compared to the fourth quarter of 2021, prices were split: there were increases in Ravalli, Lewis and Clark, Lake, Jefferson, and Gallatin counties, but prices fell in the remaining market areas.
❱ Although the tepid increase in prices may surprise some readers, it uses weighted averages which account for market size. If we use simple averages, prices in the region rose by a more significant 14.5% year over year.
❱ There is a lag between mortgage rates rising and any impact on home prices. Thus far, higher financing costs have not had much of an effect on the market, but data from the second quarter of this year should give us a better idea as to whether the increase in rates is enough to dampen the market significantly.
Mortgage Rates
Average rates for a 30-year conforming mortgage were 3.11% at the end of 2021, but since then have jumped over 1.5%—the largest increase since 1987. The speed of the surge in rates is due to the market having quickly priced in the seven-to-eight rate increase that the Fed is expected to implement this year.
Because the mortgage market has priced this into the rates they are offering today, my forecast suggests that we are getting close to a ceiling in rates, and it is my belief that they will rise modestly in the second quarter before stabilizing for the balance of the year.
Montana Days on Market
❱ The average time it took to sell a home dropped 15 days compared to the first quarter of 2021.
❱ Homes sold fastest in Gallatin County and slowest in Madison County. Missoula, Ravalli, Lake, Lewis and Clark, Broadwater, and Gallatin counties saw market time drop. The length of time it took for homes to sell rose in the rest of the counties contained in this report.
❱ During the first quarter, it took an average of 68 days to sell a home in the region.
❱ Average market time across the region rose one day compared to the fourth quarter of 2021, but was lower in Missoula, Lake, Broadwater, and Jefferson counties.
Conclusions
This speedometer reflects the state of the region’s real estate market using housing inventory, price gains, home sales, interest rates, and larger economic factors.
Full employment and a growing economy tend to encourage home buyers, but rising financing costs are a cause for concern. Furthermore, we have yet to see whether the increase in mortgage rates will have a dampening effect on price growth, especially if more homes come on the market.

With this level of uncertainty, I have left the needle in the same position as the previous quarter. The data shows that an inflection point may have been reached, as indicated by slowing home-price growth and lower sales, but the impact of mortgage rates is not clear at this time. We should have a better picture of the market as we move through the spring. That said, it firmly remains a seller’s market.
About Matthew Gardner
As Chief Economist for Windermere Real Estate, Matthew Gardner is responsible for analyzing and interpreting economic data and its impact on the real estate market on both a local and national level. Matthew has over 30 years of professional experience both in the U.S. and U.K.
In addition to his day-to-day responsibilities, Matthew sits on the Washington State Governors Council of Economic Advisors; chairs the Board of Trustees at the Washington Center for Real Estate Research at the University of Washington; and is an Advisory Board Member at the Runstad Center for Real Estate Studies at the University of Washington where he also lectures in real estate economics.
Q4 2021 Montana Real Estate Market Update

The following analysis of select Montana real estate markets is provided by Windermere Real Estate Chief Economist Matthew Gardner. We hope that this information may assist you with making better-informed real estate decisions. For further information about the housing market in your area, please don’t hesitate to contact your Windermere Real Estate agent.
Regional Economic Overview
Jobs continue to return to Montana. The latest data shows the state needs only 3,700 more jobs to reach its pre-pandemic peak. As I have mentioned in past reports, the pace of the job recovery has been slowing—particularly in the Great Falls and Missoula metro areas—but this has been offset by growth in Billings and other parts of the state. The latest unemployment numbers showed only 2.8% of the workforce out of work, which is significantly better than the country as a whole. In the metro areas contained in this report, the lowest jobless rate was in Billings at 1.8%, followed by Great Falls at 1.9%, and Missoula at 2%. I still anticipate a full job recovery but, when placed alongside extremely low unemployment rates, the recent slowdown suggests that a lack of workers is the biggest hurdle for employers. I anticipate a return to pre-pandemic employment levels toward the end of 2022.
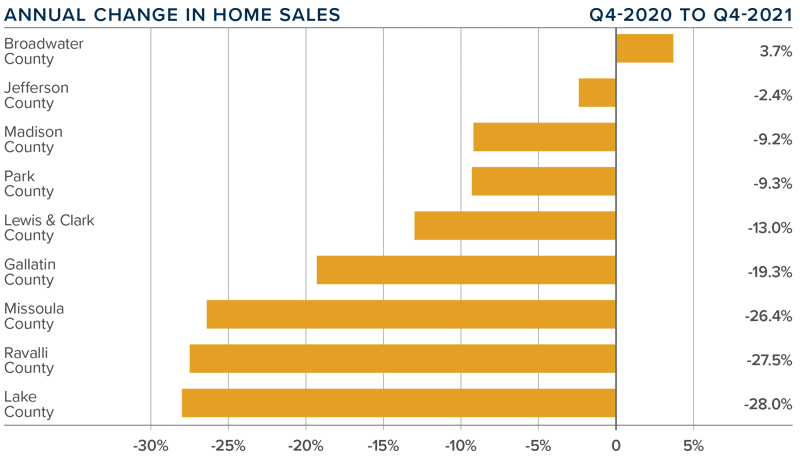
montana Home Sales
❱ In the final quarter of 2021, 1,479 homes sold in the markets contained in this report, which is 17.6% below the level a year ago and 14.1% lower than the previous quarter.
❱ Sales did manage to rise in Broadwater County, but it was only by one unit. Compared to the third quarter, sales were lower in every county other than Lake.
❱ Lower quarter-over-quarter sales are not surprising given seasonal factors. The drop in sales compared to a year ago is likely due to low inventory levels, which were down 47%.
❱ Year-over-year, listings were down between 30% and 82% in the counties contained in this report. Buyers are still looking, but if there isn’t a significant increase in the number of homes coming to market in the spring, things will remain very competitive for buyers.
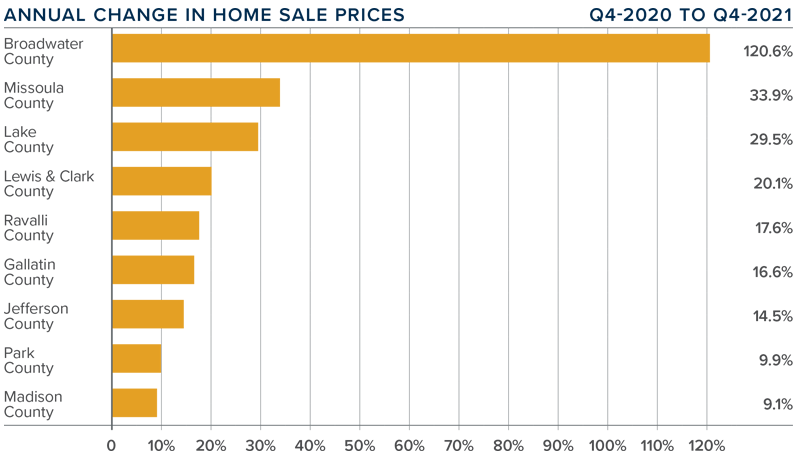
montana Home Prices
❱ With the supply limitations discussed above, it’s hardly surprising to see prices rise 17% year over year to an average of $721,634. Prices were also 8.3% higher than in the third quarter of 2021.
❱ When compared to the third quarter of 2021, home sale prices were lower in Ravalli, Lewis and Clark, Broadwater, and Jefferson counties, but rose in the remaining markets.
❱ Average home sale prices rose by double digits in all but two of the counties contained in this report. Broadwater County saw prices more than double.
❱ Mortgage rates trended higher in the final quarter of the year, which I expect to continue as we move through 2022. This should act as a headwind to home price growth, but my current forecast suggests that prices will continue to rise by an average of 15% in 2022.
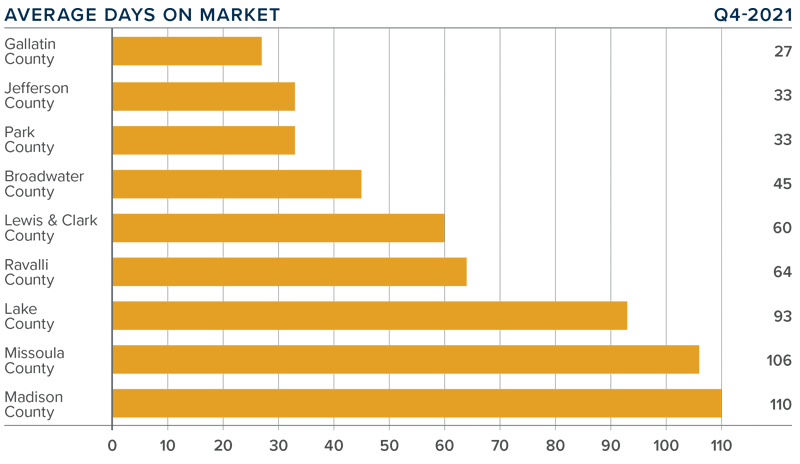
Days on Market
❱ The average time it took to sell a home in fourth quarter dropped by seven days compared to the previous year.
❱ Homes sold fastest in Gallatin County and slowest in Madison County. Days on market dropped in Ravalli, Lake, Lewis and Clark, and Jefferson counties, but rose in the balance of the counties contained in this report.
❱ It took an average of 64 days to sell a home in the region during fourth quarter.
❱ Relative to the third quarter of 2021, market time dropped in Ravalli, Broadwater, and Jefferson counties, but rose in all other markets.
Conclusions

This speedometer reflects the state of the region’s real estate market using housing inventory, price gains, home sales, interest rates, and larger economic factors.
The job recovery in Montana continues and, at this point, is only limited by the number of available workers. In addition, according to the Montana Secretary of State, a record number of new businesses were registered in 2021. With a growing economy, it’s no surprise that there is a strong demand for housing. Even as mortgage rates continue to rise, there are clearly more buyers than sellers, which sets the stage for home prices to rise at well-above average rates.
As mentioned earlier, I would not be surprised if prices rose by an average of 15% this year as supply and demand remain out of balance. Given all these factors, I have decided to move the needle further toward home sellers.
About Matthew Gardner

As Chief Economist for Windermere Real Estate, Matthew Gardner is responsible for analyzing and interpreting economic data and its impact on the real estate market on both a local and national level. Matthew has over 30 years of professional experience both in the U.S. and U.K.
In addition to his day-to-day responsibilities, Matthew sits on the Washington State Governors Council of Economic Advisors; chairs the Board of Trustees at the Washington Center for Real Estate Research at the University of Washington; and is an Advisory Board Member at the Runstad Center for Real Estate Studies at the University of Washington where he also lectures in real estate economics.
Q3 2021 Montana Real Estate Market Update

The following analysis of select Montana real estate markets is provided by Windermere Real Estate Chief Economist Matthew Gardner. We hope that this information may assist you with making better-informed real estate decisions. For further information about the housing market in your area, please don’t hesitate to contact your Windermere Real Estate agent.
Regional Economic Overview
Following the loss of 63,300 jobs in the wake of the pandemic, Montana continues to recover, and current employment levels are only 7,400 jobs shy of their pre-pandemic peak. Although this is good news, the momentum of this recovery began to slow in second quarter and this trend continued into the third quarter. The latest data on unemployment indicated that 3.5% of the labor force is currently out of work, but that level is well below the national rate of 4.8%. In the counties contained in this report, the lowest jobless rate was in Billings at 3%. Missoula followed at 3.1%, and Great Falls at 3.2%. I anticipate the state will see a return of all the jobs that were lost due to COVID-19, but the recent slowdown in the job recovery suggests that we will not reach pre-pandemic employment levels until the end of this year.
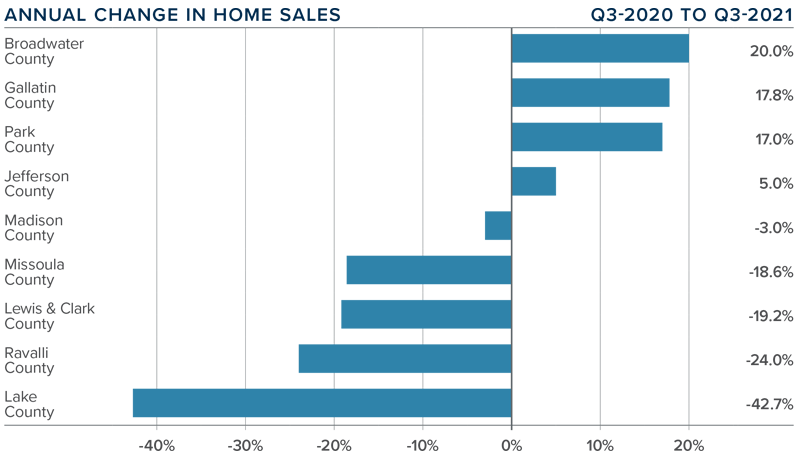
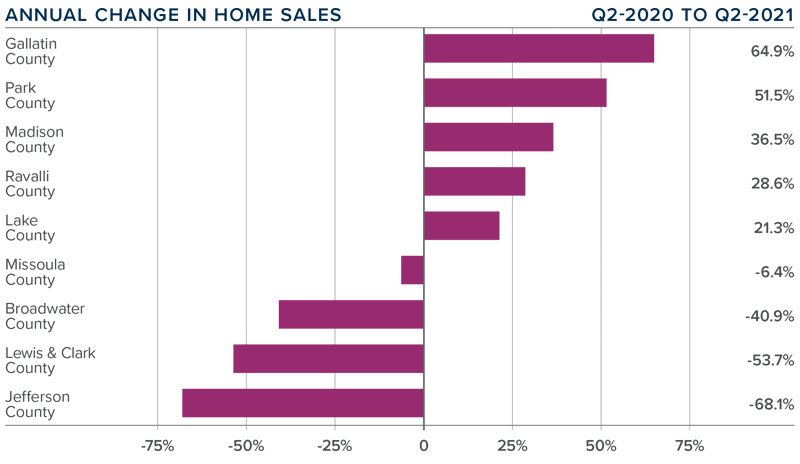
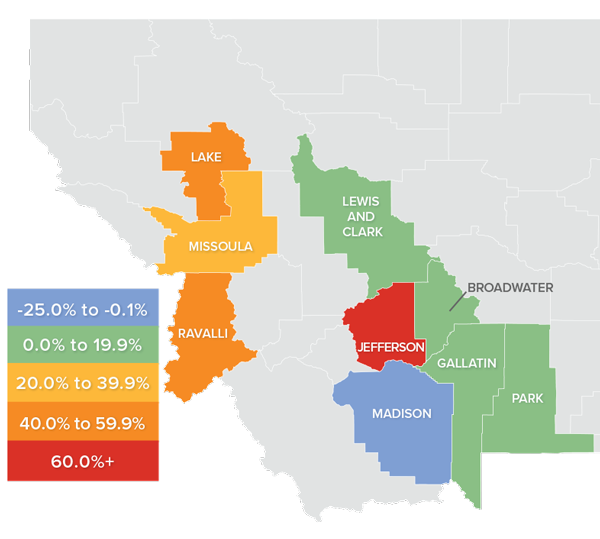
montana Home Sales
❱ In the third quarter, 1,722 homes sold in the markets contained in this report, representing a drop of 1.5% compared to the same period in 2020. Sales were 47.3% higher than in the second quarter of this year.
❱ Year-over-year, home sales still managed to rise in four of the nine counties contained in this report, with double-digit increases in Broadwater, Gallatin, and Park counties. Compared to the second quarter of this year, sales rose in every market other than Ravalli. Transactions more than doubled in Lewis and Clark, Broadwater, Jefferson, and Madison counties.
❱ I’m not concerned about the modest drop in sales compared to a year ago given that at that time the country was experiencing a massive housing rebound following the outbreak of COVID-19. On a more positive note, sales grew compared to the second quarter of 2021, even as inventory levels fell precipitously.
❱ Although we saw some very significant sales growth compared to the spring, pending sales managed to rise by only 3%, likely due to the lack of homes for sale. This suggests that closed sales in the final quarter of this year may be lower unless we see a large increase in listings.
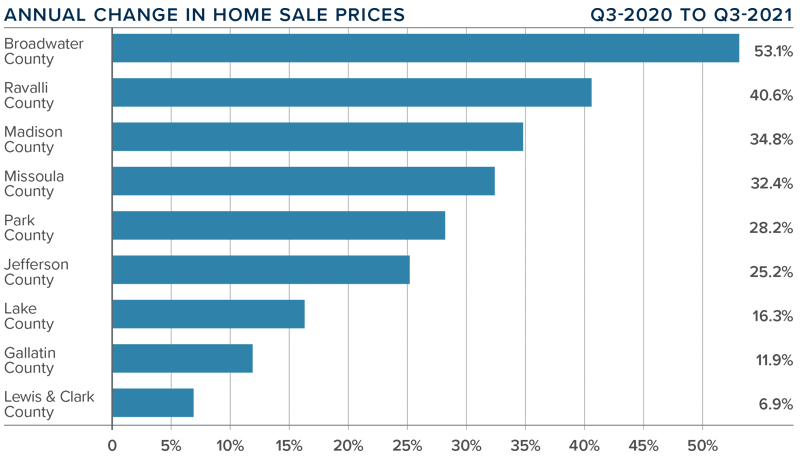
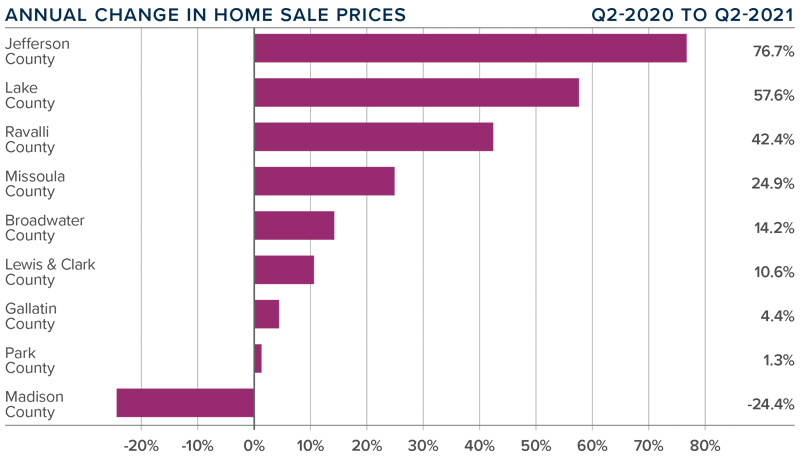
montana Home Prices
❱ Home prices averaged $666,391 in the third quarter, which is 22.5% higher than a year ago and 40.6% higher than the prior quarter.
❱ Year-over-year, all but Lewis and Clark County saw prices rise by double-digits. Broadwater County saw average prices rise more than 50%.
❱ Average sale prices rose in all counties contained in this report. It’s worth noting that following a significant drop in the second quarter, prices in Madison County rebounded and are now back above the $1 million mark.
❱ Mortgage rates moved modestly lower during the quarter, which could have contributed to rising prices, but not to the degree we saw. The bigger culprit is demand which far exceeds supply and continues to push up prices.
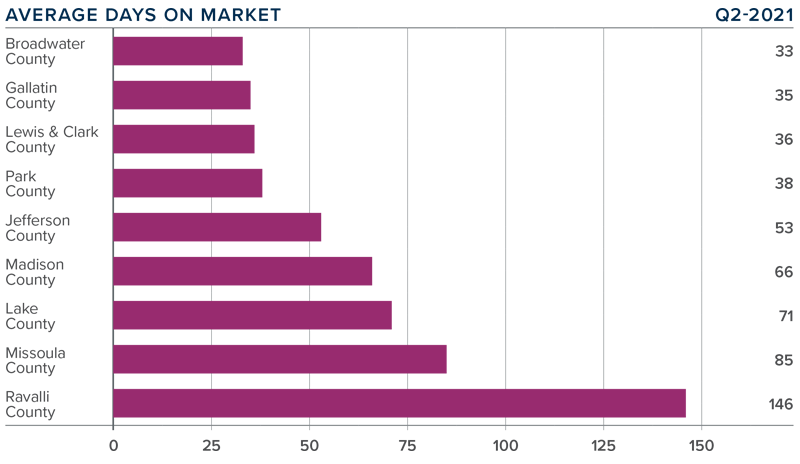
Days on Market
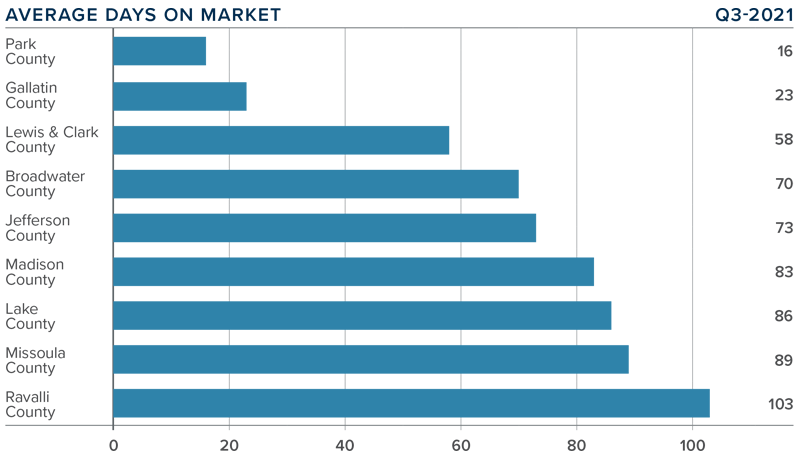
❱ The average time it took to sell a home dropped 19 days compared to the third quarter of 2020.
❱ Homes sold fastest in Park County and slowest in Ravalli County. All markets other than Madison (+17 days) saw market time drop compared to the same period a year ago.
❱ During third quarter, it took an average of 67 days to sell a home in the region.
❱ Relative to the second quarter of this year, market time dropped in Ravalli, Gallatin, Park, and Madison counties, but rose in the rest of the areas covered in this report.
Conclusions

This speedometer reflects the state of the region’s real estate market using housing inventory, price gains, home sales, interest rates, and larger economic factors.
The economy continues to recover, even though the pace of the return of jobs is slower than I would like to see. The unemployment rate remains very low compared to most other states, which suggests there are job openings out there; the biggest issue for businesses is finding qualified applicants.
Third-quarter homes sales are impressive—especially considering the lack of inventory—and with buyers clearly outnumbering sellers, the region has experienced very significant price growth. With all these factors in mind, I am moving the needle a little more in favor of sellers.
About Matthew Gardner
As Chief Economist for Windermere Real Estate, Matthew Gardner is responsible for analyzing and interpreting economic data and its impact on the real estate market on both a local and national level. Matthew has over 30 years of professional experience both in the U.S. and U.K.
In addition to his day-to-day responsibilities, Matthew sits on the Washington State Governors Council of Economic Advisors; chairs the Board of Trustees at the Washington Center for Real Estate Research at the University of Washington; and is an Advisory Board Member at the Runstad Center for Real Estate Studies at the University of Washington where he also lectures in real estate economics.
Q2 2021 Montana Real Estate Market Update

The following analysis of select Montana real estate markets is provided by Windermere Real Estate Chief Economist Matthew Gardner. We hope that this information may assist you with making better-informed real estate decisions. For further information about the housing market in your area, please don’t hesitate to contact your Windermere Real Estate agent.
Regional Economic Overview
Along with the rest of the nation, Montana’s job market was significantly impacted by COVID-19, losing 63,300 jobs statewide. However, as of the end of the second quarter of this year, Montana has recovered all but 10,000 of them. Although this puts employment levels 2% lower than the pre-pandemic peak, the momentum of jobs returning has slowed. Employment levels dropped by 1,800 jobs in the second quarter. The June unemployment rate in the state was 3.7%, well below the national rate of 5.9%. Unemployment numbers ticked up one tenth of a percent between May and June. In the counties contained in this report, the lowest jobless rate was in Billings at 3.3%. Great Falls’ rate was 3.4% and Missoula came in at 3.5%. I am hopeful that the economy will pick up speed as we move through the balance of 2021, but I remain mindful of the uptick in new COVID-19 cases and their potential to undermine the state’s recovery.
montana Home Sales
❱ In the second quarter, a total of 1,169 homes sold in the markets contained in this report, representing an increase of 2% compared to the same period in 2020. Sales were up 4.3% compared to the first quarter of this year.
❱ Even with greater choice and an increased number of sales in five counties, sales were lower in four counties. Compared to the first quarter of this year, sales were higher in Missoula, Ravalli, Lake, Gallatin, and Park counties, but lower in the other areas covered in this report.
❱ It was pleasing to see sales pick back up after the drop in transactions in the first quarter. This can be attributed to the 156% increase in the number of homes for sale from the first quarter to the second. Clearly, supply was the limiting factor, not demand.
❱ The growth in sales is a good sign, and with pending sales up 34.3% compared to the first quarter, it is likely that third quarter numbers will be positive.
montana Home Prices
❱ Year-over-year, home prices rose 6.5% to an average of $473,959. However, they were 10.8% lower than in the first quarter of the year.
❱ Sale prices can be frenetic—especially because many of the counties contained in this report have low sales activity—so I am not overly concerned at the present time.
❱ Average sale prices rose in all but one county. The outlier—Madison County, where average sales price dropped from $1.33 million to $924,000—dragged the regional average price lower.
❱ Last quarter I said I wouldn’t be surprised if prices dropped further in the second quarter, and it appears I was right. What I said then was that after a significant period where price growth far exceeded the long-term trend, the market is trying to find balance—and this remains true.
Days on Market
❱ The average number of days it took to sell a home dropped 38 days compared to the second quarter of 2020.
❱ Homes sold fastest in Broadwater County and slowest in Ravalli County. All markets other than Ravalli (+19 days) and Lewis & Clark (+2 days) saw market time drop year over year.
❱ During the quarter, it took an average of 74 days to sell a home in the region.
❱ Relative to the first quarter of this year, market time dropped in Lake, Missoula, Broadwater, and Jefferson counties, but rose in the rest of the areas covered in this report.
Conclusions
This speedometer reflects the state of the region’s real estate market using housing inventory, price gains, home sales, interest rates, and larger economic factors.
Montana’s economy is performing better than a vast majority of the nation and does not yet appear to be suffering significantly from the rising COVID-19 infections that are hitting many other states.
With mortgage rates set to remain very competitive for the foreseeable future, I believe the housing market will come out of this unique period in the positive despite some of the numbers in this report. Price growth and sales should pick back up, but I think we are seeing the early signs of a more balanced market. That said, we’re not there yet.
Well-positioned and well-priced homes continue to attract buyers, but the slowdown in certain aspects of the market have led me to leave the needle in the same position as in the first quarter.
About Matthew Gardner
As Chief Economist for Windermere Real Estate, Matthew Gardner is responsible for analyzing and interpreting economic data and its impact on the real estate market on both a local and national level. Matthew has over 30 years of professional experience both in the U.S. and U.K.
In addition to his day-to-day responsibilities, Matthew sits on the Washington State Governors Council of Economic Advisors; chairs the Board of Trustees at the Washington Center for Real Estate Research at the University of Washington; and is an Advisory Board Member at the Runstad Center for Real Estate Studies at the University of Washington where he also lectures in real estate economics.
")


