
 Facebook
 X
X
 Pinterest
 Copy Link

The following analysis of select Montana real estate markets is provided by Windermere Real Estate Chief Economist Matthew Gardner. We hope that this information may assist you with making better-informed real estate decisions. For further information about the housing market in your area, please don’t hesitate to contact your Windermere Real Estate agent.
Regional Economic Overview
Following the loss of 63,300 jobs in the wake of the pandemic, Montana continues to recover, and current employment levels are only 7,400 jobs shy of their pre-pandemic peak. Although this is good news, the momentum of this recovery began to slow in second quarter and this trend continued into the third quarter. The latest data on unemployment indicated that 3.5% of the labor force is currently out of work, but that level is well below the national rate of 4.8%. In the counties contained in this report, the lowest jobless rate was in Billings at 3%. Missoula followed at 3.1%, and Great Falls at 3.2%. I anticipate the state will see a return of all the jobs that were lost due to COVID-19, but the recent slowdown in the job recovery suggests that we will not reach pre-pandemic employment levels until the end of this year.
montana Home Sales
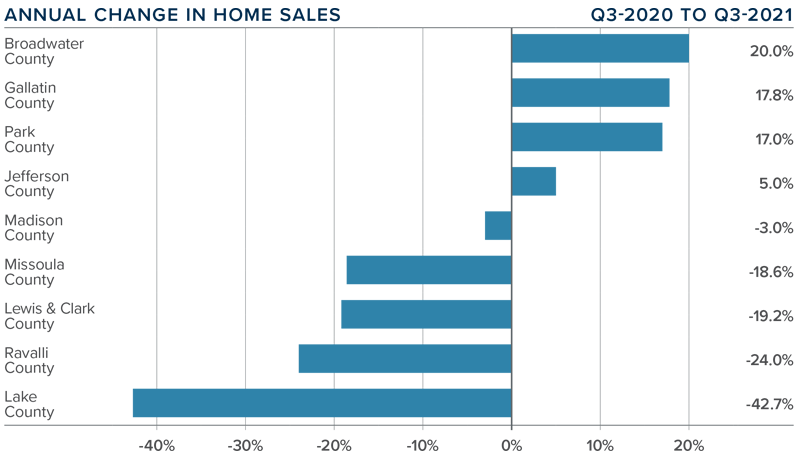
❱ In the third quarter, 1,722 homes sold in the markets contained in this report, representing a drop of 1.5% compared to the same period in 2020. Sales were 47.3% higher than in the second quarter of this year.
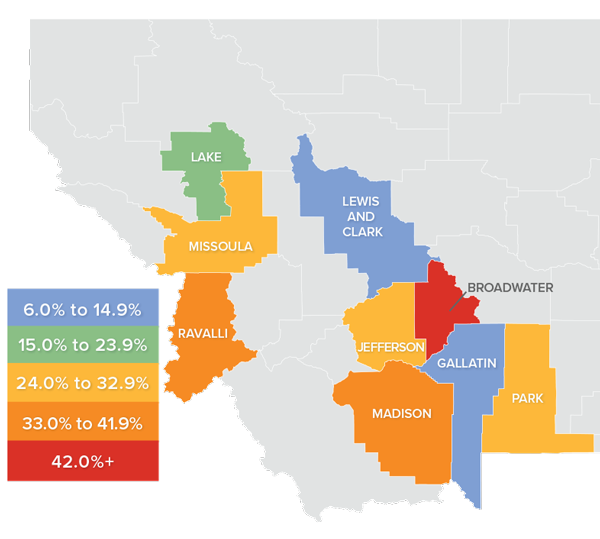
❱ Year-over-year, home sales still managed to rise in four of the nine counties contained in this report, with double-digit increases in Broadwater, Gallatin, and Park counties. Compared to the second quarter of this year, sales rose in every market other than Ravalli. Transactions more than doubled in Lewis and Clark, Broadwater, Jefferson, and Madison counties.
❱ I’m not concerned about the modest drop in sales compared to a year ago given that at that time the country was experiencing a massive housing rebound following the outbreak of COVID-19. On a more positive note, sales grew compared to the second quarter of 2021, even as inventory levels fell precipitously.
❱ Although we saw some very significant sales growth compared to the spring, pending sales managed to rise by only 3%, likely due to the lack of homes for sale. This suggests that closed sales in the final quarter of this year may be lower unless we see a large increase in listings.
montana Home Prices
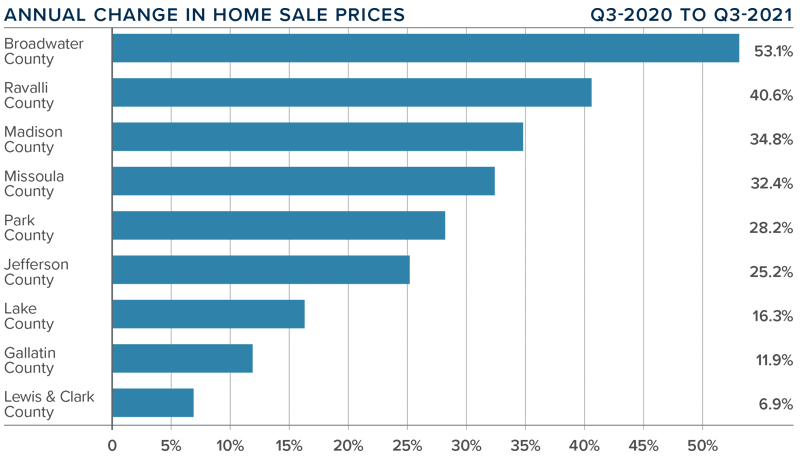
❱ Home prices averaged $666,391 in the third quarter, which is 22.5% higher than a year ago and 40.6% higher than the prior quarter.
❱ Year-over-year, all but Lewis and Clark County saw prices rise by double-digits. Broadwater County saw average prices rise more than 50%.
❱ Average sale prices rose in all counties contained in this report. It’s worth noting that following a significant drop in the second quarter, prices in Madison County rebounded and are now back above the $1 million mark.
❱ Mortgage rates moved modestly lower during the quarter, which could have contributed to rising prices, but not to the degree we saw. The bigger culprit is demand which far exceeds supply and continues to push up prices.
Days on Market
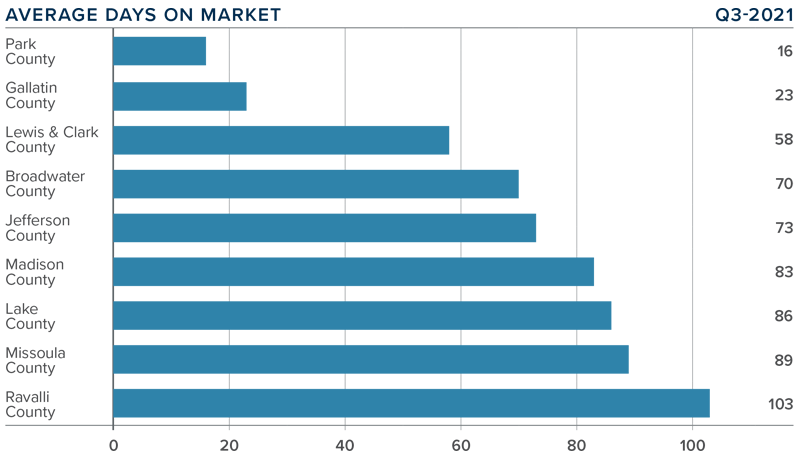
❱ The average time it took to sell a home dropped 19 days compared to the third quarter of 2020.
❱ Homes sold fastest in Park County and slowest in Ravalli County. All markets other than Madison (+17 days) saw market time drop compared to the same period a year ago.
❱ During third quarter, it took an average of 67 days to sell a home in the region.
❱ Relative to the second quarter of this year, market time dropped in Ravalli, Gallatin, Park, and Madison counties, but rose in the rest of the areas covered in this report.
Conclusions

This speedometer reflects the state of the region’s real estate market using housing inventory, price gains, home sales, interest rates, and larger economic factors.
The economy continues to recover, even though the pace of the return of jobs is slower than I would like to see. The unemployment rate remains very low compared to most other states, which suggests there are job openings out there; the biggest issue for businesses is finding qualified applicants.
Third-quarter homes sales are impressive—especially considering the lack of inventory—and with buyers clearly outnumbering sellers, the region has experienced very significant price growth. With all these factors in mind, I am moving the needle a little more in favor of sellers.
About Matthew Gardner

As Chief Economist for Windermere Real Estate, Matthew Gardner is responsible for analyzing and interpreting economic data and its impact on the real estate market on both a local and national level. Matthew has over 30 years of professional experience both in the U.S. and U.K.
In addition to his day-to-day responsibilities, Matthew sits on the Washington State Governors Council of Economic Advisors; chairs the Board of Trustees at the Washington Center for Real Estate Research at the University of Washington; and is an Advisory Board Member at the Runstad Center for Real Estate Studies at the University of Washington where he also lectures in real estate economics.
")


